Retail Globalization and Household Welfare: Evidence...
55
Retail Globalization and Household Welfare: Evidence from Mexico * David Atkin † , Benjamin Faber ‡ and Marco Gonzalez-Navarro § September 2014 PRELIMINARY AND INCOMPLETE Abstract The arrival of global retail chains in developing countries is causing a radical transformation in the way that households source their consumption. This paper draws on a new and unique collection of Mexican microdata to estimate the effect of foreign supermarket entry on house- hold welfare and its underlying channels. The richness of the data allow us to estimate a general expression for the welfare gains from retail FDI, and to decompose the total effect into several distinct components. To base our estimates on plausibly exogenous variation in for- eign retail entry we propose an event study design that exploits data on the universe of foreign store locations and opening dates in combination with high frequency data on barcode-level store prices, consumption quantities, and household incomes in those same locations over the period 2002-2014. We find that foreign retail entry causes large and significant welfare gains for the average household that are mainly driven by a reduction in the cost of living. A sub- stantial share of this price index effect is due to pro-competitive effects on consumer prices charged by domestic stores. We find little evidence of significant changes in average munici- pality level incomes, wages or employment. We do, however, find evidence of adverse effects on the incomes of traditional retail sector workers. Finally, we present evidence that the gains from retail FDI are positive for all income groups but regressive, and quantify the opposing forces that underlie this finding. Keywords: Supermarket revolution; foreign direct investment; gains from trade JEL Classification: F15; F23; F63; O24 * Zakia Akanda, Fatima Aqeel, Christopher Balette, Sakshi Kumar, Shruti Maken, Ramsha Mugal and Fern Ramoutar provided excellent research assistance. We are grateful to Rafael Posse and Javier Romero at INEGI, and to José Antonio Murillo at Banco de México for providing us access to the non-public access microdata of the Mexican CPI. Etienne Gagnon at the Fed Board in Washington D.C. kindly shared his data on the public access part of the Mex- ican CPI. Natalia Volkow at INEGI was pivotal in gaining access to the confidential microdata of the Mexican retail census. We thank Mauricio Varela for sharing his Mexican retail store data. We are also grateful to the Mexico City of- fice of a large international market research company for supporting an academic collaboration and granting us access to their uncensored barcode-level consumption microdata, and to Enrique Seira Bejarano and Paul Gertler who were instrumental in making that happen. Finally, we thank Costas Arkolakis, Jessie Handbury, Andrés Rodríguez-Clare and seminar participants at the NBER ITI Summer Institute for helpful discussions. This research has been supported by funding from OWSP. † Department of Economics, UCLA and NBER. ‡ Department of Economics, UC Berkeley and NBER. § CIRHR, Economics, and UTSC Management, University of Toronto.
Transcript of Retail Globalization and Household Welfare: Evidence...

Retail Globalization and Household Welfare: Evidence from
Mexico∗
David Atkin†, Benjamin Faber‡ and Marco Gonzalez-Navarro§
September 2014
PRELIMINARY AND INCOMPLETE
Abstract
The arrival of global retail chains in developing countries is causing a radical transformationin the way that households source their consumption. This paper draws on a new and uniquecollection of Mexican microdata to estimate the effect of foreign supermarket entry on house-hold welfare and its underlying channels. The richness of the data allow us to estimate ageneral expression for the welfare gains from retail FDI, and to decompose the total effect intoseveral distinct components. To base our estimates on plausibly exogenous variation in for-eign retail entry we propose an event study design that exploits data on the universe of foreignstore locations and opening dates in combination with high frequency data on barcode-levelstore prices, consumption quantities, and household incomes in those same locations over theperiod 2002-2014. We find that foreign retail entry causes large and significant welfare gainsfor the average household that are mainly driven by a reduction in the cost of living. A sub-stantial share of this price index effect is due to pro-competitive effects on consumer pricescharged by domestic stores. We find little evidence of significant changes in average munici-pality level incomes, wages or employment. We do, however, find evidence of adverse effectson the incomes of traditional retail sector workers. Finally, we present evidence that the gainsfrom retail FDI are positive for all income groups but regressive, and quantify the opposingforces that underlie this finding.
Keywords: Supermarket revolution; foreign direct investment; gains from tradeJEL Classification: F15; F23; F63; O24
∗Zakia Akanda, Fatima Aqeel, Christopher Balette, Sakshi Kumar, Shruti Maken, Ramsha Mugal and FernRamoutar provided excellent research assistance. We are grateful to Rafael Posse and Javier Romero at INEGI, and toJosé Antonio Murillo at Banco de México for providing us access to the non-public access microdata of the MexicanCPI. Etienne Gagnon at the Fed Board in Washington D.C. kindly shared his data on the public access part of the Mex-ican CPI. Natalia Volkow at INEGI was pivotal in gaining access to the confidential microdata of the Mexican retailcensus. We thank Mauricio Varela for sharing his Mexican retail store data. We are also grateful to the Mexico City of-fice of a large international market research company for supporting an academic collaboration and granting us accessto their uncensored barcode-level consumption microdata, and to Enrique Seira Bejarano and Paul Gertler who wereinstrumental in making that happen. Finally, we thank Costas Arkolakis, Jessie Handbury, Andrés Rodríguez-Clareand seminar participants at the NBER ITI Summer Institute for helpful discussions. This research has been supportedby funding from OWSP.†Department of Economics, UCLA and NBER.‡Department of Economics, UC Berkeley and NBER.§CIRHR, Economics, and UTSC Management, University of Toronto.

1 Introduction
A radical transformation is occurring in the way households in developing countries sourcetheir consumption. A key driver of this so called ’supermarket revolution’ has been the arrivalof global retail chains in developing countries (Reardon et al., 2003; Humphrey, 2007). Retailglobalization has already reached substantial levels and the process continues at pace. In 2012,the 250 largest retailers reported 4.3 trillion USD in revenues, of which 25 percent were due toforeign affiliate sales. This represents an increase of more than 400 percent relative to foreignaffiliate sales of these firms in the year 2000, and a doubling of the foreign sales share in totalrevenues.1 Over the same period, the share of the world stock of inward retail FDI accounted forby developing countries also more than doubled to 25 percent (UNCTAD, 2014).
Perhaps unsurprisingly in this context, retail globalization has led to heated policy debates.2
Those against foreign retailers point to the large share of employees working in traditional stores,while those in favor emphasize potential benefits from lower consumer prices. Importantly, thesedebates have also led to stark differences in the policy approaches to retail FDI across countries.While some countries such as Argentina, Brazil, Mexico and most of Eastern Europe chose tofully liberalize retail FDI at the beginning of the 1990s, several developing countries includingIndia continue to severely restrict foreign retail entry and others such as Indonesia, Malaysiaand Thailand re-imposed regulatory barriers on foreign retailers after initially allowing entry(Dufey et al., 2008; Wrigley and Lowe, 2010). These policy differences matter because retail isa key sector of the economy in terms of both employment and consumption: Retail accountsfor approximately 20% of total employment, 10-15% of total GDP, and more than 50% of totalhousehold expenditure in developing countries.3
Despite the rapid globalization of retail in the developing world and widespread policy inter-est, the existing literatures in trade and development have so far paid relatively little attention tothis facet of international integration. This paper brings to bear a new and uniquely rich collectionof microdata to assess the consequences of retail FDI in the context of Mexico, a country whoseretail landscape underwent a dramatic transformation as foreign retailers came to dominate itsmarket over the last 20 years. Our analysis coincides with the major wave of foreign store expan-sion in Mexico, providing an ideal empirical setting to study the process of retail globalization.The number of foreign supermarkets close to quadrupled from 365 stores at the end of 2001 to1335 stores at the end of our estimation period in March 2014.4
The paper aims to answer three central questions: 1) What is the effect of retail FDI on averagehousehold welfare in the municipality of entry?; 2) What are the channels underlying this effect?;and 3) To what extent do the gains from retail FDI differ across the pre-existing distribution ofhousehold incomes?
1Source: Deloitte Global Powers of Retail 2014.2For example, it took India’s Congress Party several years and many failed attempts to finally approve foreign
entry into multi-brand retail in 2012. This process was accompanied by street protests, and several Indian states,such as Delhi, subsequently voted to block foreign entry. Most recently, the new ruling party BJP has announced itsintention to move back to an outright nationwide ban of foreign retailers.
3These figures are based on reporting developing countries in ILO data (employment), UN National Accountsstatistics (GDP), and household consumption surveys (retail expenditures).
4These figures are based on the Mexican national association of retailers (ANTAD). See Sections 2 and 4 for furtherdetails.
1

In answering these questions, the paper also makes two methodological contributions to theliterature that focuses on quantifying the gains from trade and multinational production. Thefirst is to take advantage of massive recent improvements in the collection and availability ofmicrodata in developing countries which allows us to estimate a very general expression for thewelfare gains from retail FDI. Rather than imposing theoretical structure ex ante to limit the datarequirements to a set of readily observable aggregate moments, the combination of rich microdataon barcode-level consumer prices, consumption quantities, worker-level incomes and store-levelprofits allows us to empirically capture all major components of household welfare. The secondcontribution is that, rather than relying on cross-sectional moments that may or may not capturethe causal effects of integration, we propose an event study design to ensure that the momentswe feed into the welfare expression are causally identified.
At the center of the analysis lies the construction of an extremely rich collection of micro-data. We combine data on all foreign store locations and opening dates over the period 1999-2014, with household, product and store level microdata from multiple sources: monthly store-level consumer prices for barcode-equivelent products (e.g. a 330ml can of Coca-Cola) overthe period 2002-2014 from the confidential microdata of the Mexican Consumer Price Index;daily household-by-store level data on consumption quantities and prices, again at the barcode-equivelent level, from the uncensored microdata of the Mexican office of a large internationalmarket research company over the period 2011-2014; store level revenues, costs and profits forthe universe of urban retail establishments from the confidential microdata of the Mexican retailcensus; and quarterly individual level labor and business incomes, occupations and employmentover the period 2002-2012 from Mexico’s income and employment surveys (ENEU/ENOE).
The analysis proceeds in four steps. In Step 1, we write down a general theoretical frameworkthat decomposes the welfare effect of retail FDI into six distinct components. Using our data, weare able to express these fully in terms of two types of observable empirical moments: a set ofcausal effects on local economic outcomes due to foreign entry, and a set of household demandparameters. In Step 2, we turn to estimating the causal effects of foreign store entry on consumerprices, quantities, and household incomes using an event study design. In Step 3, we estimatethe key demand parameters that govern the substitutability across local stores as a function ofprice differences. Finally, in Step 4 we utilize the theoretical framework in combination withthe empirical estimates from the previous steps to quantify the total household gains from retailFDI, the underlying channels, and the distribution of the gains across the pre-existing incomedistribution. We now discuss each of these steps in more detail.
In Step 1, we derive a very general expression for the effect of retail FDI on household welfare.We decompose the total effect into three distinct effects on household cost of living (the priceindex) and three effects on household nominal incomes. We express the total cost of living effectas the sum of a direct price index effect and a pro-competitive price index effect. The direct priceindex effect captures the implicit changes in consumer prices due to foreign stores offering newvarieties, pre-existing varieties at cheaper prices, as well as different shopping quality. The pro-competitive effect comprises an intensive margin, the effect of foreign entry on consumer pricesin continuing domestic stores, and an extensive margin, the implicit price index changes due todomestic store exit. We express the total effect on nominal incomes as the sum of a retail income
2

effect and an effect on incomes from other sectors. Within the retail income effect, we separatebusiness income effects for domestic store owners and labor income effects for workers in boththe modern and traditional domestic retail sectors. To relate this general estimation framework tothe recent quantitative literature on the gains from trade and multinational production, we showthat, under a set of functional form assumptions that the data allow us to test directly, this welfareexpression collapses to the import-share sufficient statistic in Arkolakis et al. (2012) and extendedto foreign production shares for the case of horizontal FDI in Ramondo and Rodriguez-Clare(2013).
In Steps 2 and 3 we estimate the various empirical moments required to quantify the six ef-fects that underlie the total household gains from retail FDI. We tackle the pro-competitive effectamong continuing domestic stores first. The first empirical challenge in identifying this effect isthat the composition of goods and stores within consumer product groups changes over time.This implies that changes in unit values reported in household consumption surveys yield im-perfect measures of local consumer price changes. We address this challenge by exploiting na-tionally representative store price surveys at the barcode-equivelent-product by store-level thatare administered by Mexico’s statistical agency INEGI to calculate the CPI. These data allow usto construct monthly time series of prices for individual products sold in a particular retail outletin a particular municipality over the period 2002-2014.
The second empirical challenge is non-random entry of foreign retailers. To ensure that we areidentifying the causal effect on consumer prices in domestic stores, we propose an event studydesign. We argue that over our period of study, foreign retailers operated under the objective ofestablishing store presence in every major urban location in Mexico. In turn, the precise timingof opening within these locations was determined by the speed of obtaining zoning permits andthe completion of construction, and so the month of opening will be uncorrelated with locationspecific changes in prices or incomes that may confound estimates of the price and income effectsof foreign retail entry. We test this identifying assumption by estimating a full set of 48 monthlytreatment effects starting one year prior to the opening event and continuing for three years afteropening. By looking for evidence of pre-trends in these monthly treatment effects we are able totransparently and non-parametrically test for the validity of this identifying assumption.
While our data allow us to observe the price changes of continuing store-by-product varietiesin order to estimate the intensive margin pro-competitive effect, the consumer price changes thatresult from either the arrival of new store-by-product varieties in foreign stores (the direct priceindex effect) or the exit of domestic stores (the extensive margin of the pro-competitive effect) areinherently unobservable because neither first period prices of new varieties nor second periodprices of exiting varieties can be recorded. To quantify the cost of living implications of thesechanges in the available set of consumer choices, we require functional form assumptions aboutconsumer demand in order to estimate a virtual price, the price at which demand would be zero.
To this end, we use two different approaches. The first approach is an exact estimation of thedirect price index effect under a multi-tier CES preference structure. As shown by Anderson etal. (1992), these preferences generate the same demands as would be obtained from aggregatingmany consumers who make discrete choices over which store to shop in. This approach has theappeal of being widely used in the trade literature that evaluates the gains from new imported
3

products starting with Feenstra (1994), in part because it yields a very parsimonious expressionfor the welfare gain from new products (or stores in our case). This expression requires infor-mation on the ex post household expenditure shares on foreign stores across households andproduct groups in combination with estimates of the elasticity of substitution across local outlets.To obtain these estimates, we exploit the uncensored microdata of the Mexican operation of alarge international market research company which contain prices and household consumptionquantities at the barcode-equivelent level matched to retailer identities. A second benefit of theCES structure is that it allows us to relate our results to the recent quantitative literature on thegains from trade: We show that under CES preferences, the expression for the direct price indexeffect of foreign entry is identical to the well known sufficient statistic for the gains from trade ofArkolakis et al. (2012) and Ramondo and Rodriguez-Clare (2013).
While the assumption of CES preferences has its virtues, it also imposes a particular structureon household demands. As an alternative approach, we exploit the richness of the barcode-level store price data in order to estimate a first order approximation of the direct price indexeffect of foreign store entry that is solely based on observable barcode-level price changes dueto foreign entry. The advantage of this alternative approach is that it yields a a Paasche priceindex that approximates the consumer gains that arise from foreign store entry without imposingparticular functional form assumptions on consumer preferences. The disadvantage is that itcan only quantify the direct gains from foreign store entry that arise due to the price differencesbetween foreign and domestic stores for pre-existing products. That is, while being transparentand general, this approach abstracts from the consumer gains that arise from both a new storevariety, and from unobserved differences in either product variety or shopping amenities betweenforeign and domestic stores. In contrast, the exact estimation under CES allows us to capturethe complete set of unobserved consumer price changes due to foreign entry including pricedifferences among pre-existing products, additional store variety, changes in product variety aswell as potential differences in shopping amenities. The combination of these two approachesprovides an additional benefit. The difference between the direct price index effect under CES andthe first order approach provides an approximate estimate of the proportion of the welfare gainsthat come from the additional variety provided by foreign stores and any amenity differencesbetween foreign and domestic stores.
To estimate the effects on nominal household incomes, we construct a quarterly time series ofindividual incomes, wages, occupation, and employment status that allows us to track individualworkers and business owners over time in a given municipality. The identification issues are verysimilar to those we address in the price regressions. Accordingly, we follow a similar event studyapproach and examine how incomes, wages and employment status change in quarters beforeand after the month of entry of a foreign retailer. Similar to the consumer price regressions, thisquarterly event study design allows us to test for pre-existing differences in the growth rates oflocal household economic outcomes without imposing parametric structure.
In Step 4, we combine the estimates from Steps 2 and 3 to quantify the general welfare ex-pression from Step 1 and present several new findings. We find that foreign supermarket entrycauses large and significant welfare gains for the average household that are in the order of 7percent of initial household income. The majority of this effect is driven by a significant reduc-
4

tion in the cost of living. Interestingly, about 20 percent of the price index effect appears to bedriven by pro-competitive effects on consumer prices charged by pre-existing domestic stores.This effect arises in addition to the direct price index effect that is due to foreign supermarketsoffering cheaper quality-adjusted prices and new varieties to consumers. The finding that themajority of the price index effect is driven by the direct effect of foreign entry is also consistentwith the raw moments in the data: foreign retailers charge on average 12 percent lower prices forthe identical barcodes within the same month and municipality, offer several times the barcodevariety compared to domestic stores, and constitute on average more than one third of averagehousehold retail spending after foreign entry. In terms of break-up, the estimation results usingour first order approximation of the direct price index effect suggest that about one third of thiseffect is driven purely by observed ex-post store price differences, while the remaining two thirdsare based on the substantial differences in product variety and store amenities. Turning to nom-inal incomes, we find no evidence of an effect on average municipality level household incomesor employment rates. We do, however, find that workers in the traditional retail sector experiencesignificant adverse income effects. Finally, we present evidence that while all household incomegroups experience significant gains from retail FDI, this effect is larger for initially higher incomehouseholds, and quantify the interplay of opposing forces that underlie this result.
The paper is related to the recent literature that estimates the gains from international inte-gration for developing countries and the distribution of those gains (Porto, 2006 ; Goldberg andPavcnik, 2007; Topalova, 2010; Atkin, 2013; Donaldson, 2012; Faber, 2014; Fajgelbaum and Khan-delwahl, 2014). Relative to the existing literature on trade and development, we focus on theconsequences of retail globalization, a channel of integration that has received relatively little at-tention. Another difference is this paper’s careful empirical evaluation of all major componentsof household welfare and, in particular, the cost of living implications of the policy in question.Rather than relying on household consumption surveys in combination with simulated pricechanges at the level of aggregate product groups as in Porto (2006) and earlier work by Deaton(1989), or relying on cross-country trade flows as in Caron et al. (2012) and Fajgelbaum andKhandelwal (2014), this paper draws on price and consumption data at the level of individualhouseholds, barcode-equivelent products, and stores to provide the first empirical estimate of theeffect of foreign retail entry on household price indexes.
The paper closely relates to a small body of work that explores the economic consequences offoreign supermarkets in developing and emerging countries (Neven and Reardon, 2004; Iacovoneet al., 2014; Javorcik and Li, 2013).5 Relative to these papers which have focused on the spill-overeffects on domestic suppliers in both agriculture and manufacturing, this paper instead focuseson the consequences for consumers, workers and business owners located in the municipalitywhere the foreign store entry occurs. To the best of our knowledge, this is the first paper toprovide empirical evidence on these first order effects of retail globalization. 6
The paper also relates to the recent quantitative literature on the gains from multinational
5Varela (2013) uses Walmart’s entry decisions into local markets in Mexico to estimate a structural model of disec-onomies of scale in outlet expansion.
6We note that this paper’s focus is on quantifying the effects of foreign retail entry on the local population livingwithin the municipality, and is silent on potentially interesting national level effects such as changes in manufacturingproductivity that are absorbed by time fixed effects in our empirical setting.
5

production (Ramondo, 2014; Ramondo and Rodríguez-Clare, 2013). The richness of the collectedmicrodata allow us to empirically estimate a very general expression of the welfare effect of retailFDI which is a form of horizontal multinational production. Because our expression nests as oneof its terms the recent sufficient statistic approach pioneered in Arkolakis et al. (2012), this paperprovides empirical evidence on a number of commonly made assumptions in the literature. Forexample, we empirically estimate the size and nature of the pro-competitive effects of foreignentry, separately estimate price index and nominal income effects, and document to what extentthe estimated average effect of multinational production on household welfare differs across theincome distribution.
In so far as we are estimating the welfare effects of new foreign retail choices, the work is alsorelated to the trade literature that estimates the gains from new product variety (Feenstra, 1994;Broda and Weinstein, 2006; Feenstra and Weinstein, 2013; Handbury and Weinstein, 2011). Inaddition to studying foreign retailer entry at the level of a municipality as opposed to extensivemargin changes in country level import flows, the richness of the collected data allows us todirectly trace foreign production shares across the consumption baskets of individual householdsat the level of disaggregated product groups. To the best of our knowledge, this is the first timethat an empirical analysis exploits information on import shares in consumption directly (in oursetting expenditure shares on foreign-owned stores) at the household-by-product group level inorder to quantify the gains from integration. The key data that allow us to make progress on thisfront are the uncensored Mexican microdata of a large international market research company inwhich we observe retailer identities that we can link to foreign ownership status.
Finally, since Walmart de México is by far the biggest foreign retailer in Mexico (and in factis more dominant in Mexico than it has ever been in the United States), the paper relates to anextensive literature on the effects of Walmart in the United States. Basker (2005) analyzes effectson retail employment. Jia (2008) focuses on entry and exit decisions between Walmart and com-peting retailers. Hausman and Leibtag (2007) estimate the consumer benefits of Walmart entry.And Holmes (2011) infers economies of store density for Walmart from the centrifugal but denseexpansion of Walmart. This paper offers two main innovations relative to the existing literature.First, developing countries offer a very different pre-existing retail environment to study the effectof modern big box store entry. That is, rather than analyzing the effect of modern store entry inthe context of an already modernized retail sector, this paper sheds light on the effect of exposinga largely traditional retail environment to what is arguably the world’s technological frontier inretailing. Second, to the best of our knowledge this paper is the first to provide a comprehensivemeasurement of the total welfare effect of retail formats such as Walmart for local households.Somewhat surprisingly, the estimation of the effect of retail modernization on both nominal in-comes and household cost of living in a unified empirical framework has not been attempted inthe existing literature to date.
The remainder of the paper is structured as follows. Section 2 describes the background andpolicy context of retail globalization in Mexico. Section 3 presents the theoretical framework.Section 4 describes the data sets used to estimate each component of the welfare expression.Sections 5 and 6presents the empirical strategy and estimation results. Section 7 draws on theseestimation results in combination with estimates of household demand parameters to quantify
6

the average household welfare gain from retail FDI, its underlying channels, and how it variesacross the pre-existing distribution of household incomes. Section 8 concludes.
2 Background and Motivating Evidence on Retail Globalization in Mex-ico
2.1 Background
Mexico’s 1981 sovereign debt default was followed by a radical transition from a closed econ-omy import substitution model towards liberalization and opening its market to foreign compe-tition. Major reforms included the 1986 joining of GATT and the 1989 loosening of Mexico’s FDIrestrictions, such as licensing and local majority ownership of firms. Towards the late 1980’s thegovernment focused its efforts on inflation control and public deficit reduction, leading to a sig-nificant privatization program and opening of the economy to FDI to foster a more competitivedomestic economy. The reform process culminated with the negotiation of NAFTA which cameinto effect in January of 1994. NAFTA signaled a long term commitment to open trade and in-vestment and has been credited with turning Mexico into a major worldwide destination for FDIin the ensuing years.
Foreign investments in retail and other sectors were originally governed by the 1973 ForeignInvestment Law which required FDI to be approved on a case by case basis, and generally re-quired a minimum 51% Mexican ownership. Over the 1980’s restrictions were relaxed allowingFDI in most sectors up to 49% without explicit authorization, and allowing specific sectors to haveup to full foreign ownership. The major final step in Mexico’s opening to FDI was brought aboutby NAFTA which allowed full foreign ownership in all (including retail) but a few reserved sec-tors such as energy. Of particular importance was the fact that NAFTA guaranteed full freedomto repatriate profits and a third-party dispute resolution mechanism.
The first significant foreign investment in retail we are aware of is the purchase of 49% of CasaLey (a regional retailer in Northern Mexico) by Safeway of the U.S. in 1981 under pre-NAFTAregulations. However, the truly transformative event has proven to be Walmart’s decision toenter the Mexican market in the early 1990’s around the time of NAFTA’s negotiation. Walmartinitially arrived under a joint venture partnership with Mexican retailer Cifra, a successful localretailer focused on the Mexico City region with around 100 supermarket units. By 1997 Cifrawas bought out by Walmart, and in 2000 the name of the company was changed to Walmart deMéxico (WALMEX). In the ensuing years, Walmart de México became the largest retail chain andthe largest employer in the country with 210,000 employees in January 2014.
The entry of global retail chains and their modern store formats into Mexico created a settingin which the domestic retail market, which was dominated by street markets, traditional storeformats and independent shop owners, was exposed to what is arguably the world technologicalfrontier in retailing. Major operational and technological differences included the introduction ofdistribution centers, modern logistics such as cold-chain logistics for fresh products, and sourcingfrom global supply chains (Biles, 2008).
The expansion of Walmart and other foreign supermarket chains, such as Casa Ley-Safeway,
7

Costco, HEB, Smart and Waldos, proceeded relatively slowly during the second half of the 1990s,serving predominantly metropolitan and relatively high income neighborhoods in the majorcities. As depicted in Figure 1, the number of foreign supermarkets in Mexico expanded from204 stores at the end of 1995 to 365 stores at the end of 2001. In both periods, the presence offoreign stores was strongly concentrated in a handful of central locations in the major metropoli-tan centers of Mexico. Between 2002 and 2014, the estimation period of our empirical analysis,foreign retailers expanded close to fourfold from 365 supermarkets to 1335 at the beginning of2014. As is apparent in Figure 1, this period saw the expansion of foreign supermarkets way be-yond the large metropolitan city centers, towards establishing presence among the wide range ofsecond and third tier urban areas as small as 15,000 inhabitants.
2.2 Motivating Evidence
How do these new foreign-owned supermarkets differ from the pre-existing retail environ-ment faced by Mexican consumers? In this subsection, we exploit the microdata of the Mexicansubsidiary of a large international market research company and the administrative records ofthe Mexican National Retail Association (ANTAD) to document a set of stylized facts about thedifferences between foreign-owned and domestic retailers in periods after foreign entry.
Table 1 shows that foreign owned retailers differ along several key dimensions. Column 1shows that, on average, foreign stores charge approximately 12 percent lower prices for identi-cal barcode products compared to domestic retailers in the same municipality during the samemonth. Interestingly, the sign of this difference is reversed when we replace barcode-by-monthfixed effects by product group-by-month fixed effects (column 2). Thus, foreign stores offer higherquality varieties within a product group (where quality is proxied by price) whilst charging lowerprices for varieties of equal quality.
These large price differences and higher quality levels appear to be combined with a sub-stantially larger set of available varieties. When compared to modern domestic retail chains incolumn 3, a foreign-owned supermarket offers approximately five times as many barcode prod-ucts during a given survey year in the same municipality compared to a domestic supermarketchain store.7 This difference in consumer choice is also apparent when comparing the floor spacerecords using the ANTAD data. Column 4 of Table 1 shows that the average foreign-owned storeis approximately six times the size of a domestic retailer that is also a member of ANTAD.
Finally, in addition to differences in consumer prices and product variety there are a num-ber of differences in the shopping amenities offered by foreign-owned supermarkets comparedto the domestic retailers. Two key dimensions of shopping amenity are the store environmentand the store location. In terms of positive amenities, foreign-owned supermarkets are typicallycleaner, offer greater security, and display and organize their products better. In terms of neg-ative amenities, foreign-owned stores tend to be located farther outside the town center due to
7Notice that columns 3 and 4 are based on the comparison to modern domestic retail chains and exclude thetraditional independent domestic retail segment. These comparisons likely provide lower bounds of the differencesin product variety between foreign stores and the domestic retail environment including the traditional sector. Asdiscussed in Section 4, this is due to the fact that we cannot count the number of products for individual stores inthe traditional domestic retail segment for which we do not have unique store identifiers. In column 4, the Mexicannational association of retailers only includes retail chains as members and not independent single stores.
8

both their larger size and their later entry into the market (although they typically offer moreparking spaces). A set of illustrative maps of store locations by store-type are presented in theOnline Appendix.
3 Theoretical Framework
In this section we derive a general expression for assessing the impact of foreign supermarketentry on local household welfare. We allow foreign supermarket entry to affect welfare througha variety of channels that affect both the cost of living (i.e. the price index) as well as house-hold nominal incomes. We distinguish between three separate channels on the cost of living side:(1) a direct price index effect whereby the entry of foreign stores lowers the household cost ofliving by offering new varieties, pre-existing varieties at potentially cheaper prices, as well asdifferent levels of shopping quality, (2) an intensive margin pro-competitive effect whereby for-eign supermarkets affect consumer prices charged by continuing domestic retailers due to greatercompetition in the local retail market, and (3) the extensive margin of the pro-competitive effecton domestic retail prices whereby foreign entry affects the available local variety due to the po-tential exit of domestic stores. On the nominal income side, we also distinguish between threeseparate channels: (4) an income effect for workers in both the traditional and modern domesticretail sector due to wage and employment changes that result from foreign entry, (5) a retail busi-ness income effect for domestic store owners due to increased competition with foreign retailers,and (6) additional general equilibrium effects on non-retail household income.
3.1 A General Estimation Framework
Consumers purchase goods from a set of “items” indexed by a product b by store s pair. Eachproduct is sold by potentially many stores. These stores may belong to either the modern retailsector im (e.g. supermarkets or big box stores) or to the traditional retail sector it (e.g. marketstalls or mom-and-pop stores) with the two retail sectors indexed by i ∈ {im, it}, respectively. Fornotational convenience, we distinguish prices at foreign retailers in the modern sector (indexedby f with product-store prices stacked in a vector P f ) from domestic retailers (indexed by d withproduct-store prices stacked in a vector Pd), with the latter category including both modern andtraditional retailers.
A household h’s nominal expenditure on all goods and services, e(Pd, Pf, uh), is equal tohousehold nominal income:
e(Pd, P f , uh) = yh = ∑i∈{im,it}
wilih + ∑i∈{im,it}
πih(Pih; w) + xh. (1)
where nominal income yh is the sum of three terms: wage earnings wi from household laborlih (with ∑ lih ≤ nh where nh is household labor supply) across both retail sectors; profits πih
from domestic modern or traditional retail enterprises owned by the household that depend onthe vector of output prices Pih and the vector of input prices w including potentially householdlabor; and income from other sources xh.
9

In order to calculate the welfare effects we consider the compensating variation8, the changein exogenous income required to maintain utility when foreign retail arrives between period 1and period 0, with periods denoted by superscripts:
CV =[e(P1∗
d , P1f , u0
h)− e(P0d, P0∗
f , u0h)]
︸ ︷︷ ︸Cost of living effect (CLE)
−[∑
iw1
i l1ih −∑
iw0
i l0ih + ∑
iπ1
ih(P1ih; w1)−∑
iπ0
ih(P0ih; w0) + x1
h − x0h
]︸ ︷︷ ︸
Income effect (IE)
.
(2)Or in proportional terms (relative to period 0 expenditure):
CVe(P0
d, P0∗f , u0
h)=
[e(P1∗
d , P1f , u0
h)
e(P0d, P0∗
f , u0h)− 1
]︸ ︷︷ ︸
Cost of living effect (CLE)
−[
∑i w1i l1
ih + ∑i π1ih(P
1ih; w1) + x1
h
∑i w0i l0
ih + ∑i π0ih(P
0ih; w0) + x0
h− 1
]︸ ︷︷ ︸
Income effect (IE)
. (3)
The first term is the cost of living effect, whereby foreign retail entry may lower the pricesconsumers pay. Of course foreign retailers’ prices are not observed prior to their entry and so theforeign retail prices in period 0 are replaced with virtual prices P0∗
f , the foreign prices that wouldensure that exactly zero quantity was consumed given the price vector of other goods. Thesevirtual prices can be estimated with additional assumptions on consumer preferences. Similarly,prices are not always observed for domestic items that exit between periods 0 and 1 and theseunobserved prices are also replaced with virtual prices; the vector P1∗
d contains actual prices forthe observed domestic items in period 1 (continuously available items and new items) and virtualprices for item exits, while the vector P0
d contains actual prices for domestic items in period 0.9
The second term is the income effect, whereby foreign retail entry may change wages, particularlyin the retail sector, and may alter profits for firms competing with foreign retailers.
In the following sections we consider the various sub-components of the cost of living andincome effects as well as the moments in the data that we will use to identify them.
3.2 Estimating the Cost of Living Effect
The cost of living effect can be divided into two quite distinct sub-components: a direct effectdue to new items sold at foreign retailers (either previously available varieties of a product soldby foreign retailers at different shopping-quality-adjusted prices, or new varieties of products);and a pro-competitive effect due to domestic retailers exiting or changing prices as a result of theentry of foreign retailers. To see these distinct terms, note that
CLE =[e(P1∗
d , P1f , u0
h)− e(P1∗d , P1∗
f , u0h)]
︸ ︷︷ ︸(1) Direct effect (DE)
+[e(P1∗
d , P1∗f , u0
h)− e(P0d, P0∗
f , u0h)]
︸ ︷︷ ︸Pro-competitive effect (PE)
. (4)
8This approach follows earlier work by Hausman (1981) and Hausman and Leonard (2002).9It is straightforward to also allow for domestic product entry through virtual prices P0∗
d . Empirically we findno evidence of such entry in response to foreign retail arrivals and so abstract from this possibility in the theoreticalexposition.
10

where using the virtual price notation defined above, P1∗f are the prices required to set demand
for foreign products equal to zero given domestic prices in period 1. The first expression whichwe label the direct effect is the cost difference between obtaining u0
h at period 1 prices with andwithout the presence of foreign retail. These are the gains from foreign retail arrival holdingfixed competitors prices. The second expression which we label the pro-competitive effect isthe cost difference between obtaining u0
h at period 1 domestic prices and at period 0 domesticprices accounting for domestic product exit through the use of virtual prices (in the absence offoreign retail in either period). These are the gains from foreign retail working through changesin domestic competitors on the intensive and extensive margins.
The pro-competitive effect can itself be divided into two terms by separating the price effectson continuing domestic items with a price vector Pdc, from domestic item exiters with prices Pdx:
PE =[e(P1
dc, P1∗dx, P1∗
f , u0h)− e(P0
dc, P0∗dx, P0∗
f , u0h)]
︸ ︷︷ ︸(2) Pro-competitive intensive margin (PEI)
+[e(P0
dc, P0∗dx, P0∗
f , u0h)− e(P0
dc, P0dx, P0∗
f , u0h)]
︸ ︷︷ ︸(3) Pro-competitive exit margin (PEX)
.(5)
Estimating both the direct effect and the pro-competitive effect requires us to place additionalstructure on demand. Most obviously, since virtual prices are not observed they must be esti-mated which requires a demand function for the good or at least an approximation to one. Belowwe propose two estimation approaches.
First Order Approach Using Observed Store Price Differences In the first approach, we ex-ploit the extremely detailed price data before and after the arrival of foreign retail in order toestimate a first order approximation of the cost of living effect of foreign entry that is solely basedon observed product-level price changes. This approach abstracts from any unobserved retailerdifferences in terms of shopping variety or amenities, and provides a first order Paasche approx-imation of the pro-competitive effect (PE) and the direct price index effect (DE) using observedprice changes and ex post consumption weights.
For the pro-competitive effect, we start by taking a first-order Taylor expansion of the expen-diture function around period 1 prices and apply Shepherd’s lemma. Focusing on price changesin the set of domestic stores continuously selling product b across both periods (for which we canobserve price changes) we obtain:
PE ≈∑b
∑s∈Sdc
b
[q1
bsh(p1bs − p0
bs)]
, (6)
where qtbsh is the quantity consumed of product b in store s by household h in period t and Sdc
b isthe set of domestic stores continuously selling product b across both periods. Rewriting the PEin proportional terms:
PEe(P1∗
d , P1∗f , u0
h)≈∑
b∑
s∈Sdcb
[φ1
bsh(p1
bs − p0bs
p1bs
)
], (7)
where φ1bsh is the household expenditure share spent on the item in period 1. To a first order
approximation, the pro-competitive effect is simply a Paasche price index of the price changes of
11

pre-existing store-by-product varieties that occurred due to the entry of foreign retail.For the direct price index effect, we again take a first-order Taylor expansion of the expendi-
ture function around period 1 prices but now focus on the remaining term, the sales at foreignstores in period 1. We calculate the first-order welfare loss if these stores had the exact samenumber of varieties and amenities, but instead charged the pre-entry prices charged by domesticstores for those products:
DEe(P1∗
d , P1f , u0
h)≈∑
b∑
s∈S fb
[φ1
bsh(p1
b f − p0bd
p1b f
)
]. (8)
where S fb is the set of foreign stores present in period 1. Hence, the direct effect corresponds to a
Paasche price index of the product-level price differences between foreign stores in period 1, p1b f ,
and domestic stores in period 0, p0bd (instead of evaluating the virtual price changes at foreign
stores that would set their demand equal to zero in period 1 that provides the exact welfare gain).The benefits of this approach are clear. It yields a transparent first order approximation of the
consumer gains that arise from foreign store entry purely based on moments we can obtain fromthe price microdata without the need to impose particular functional form assumptions on con-sumer preferences. The disadvantages are equally clear: we miss any direct gains that arise due todifferences in the number and type of product varieties on sale in foreign stores or the amenitiesprovided by foreign stores, differences that are potentially substantial and that we highlighted inSection 2. We also miss any gains from the additional store-variety that new foreign-retail outletsprovide since we do not evaluate the price changes that would set the demand for foreign storesequal to zero. We now turn to our second approach that allows us to evaluate those additionalunobserved consumer price changes.
Exact Estimation under CES demand Our second approach provides an exact and completeestimate of the cost of living effect under a multi-tier CES demand structure that is common inthe trade literature. This approach has several advantages. As first shown by Feenstra (1994), theCES structure produces an intuitive and straightforward expression for the cost of living changedue to the introduction of new varieties. Unlike the first order approach above, we can capturedifferences in variety or amenities across domestic and foreign stores. The assumption of CESpreferences also allows us to relate the estimation results to the recent quantitative literature onthe gains from trade: Under CES, the expression for the direct price index effect in our expressionfor the total welfare effect due to foreign retail entry is identical to the well known sufficientstatistic of Arkolakis et al. (2012), extended to horizontal multinational production by Ramondoand Rodriguez-Clare (2013). Finally, as shown by Anderson et al. (1992), the demands generatedby CES will be identical to the demands generated by aggregating many consumers who makediscrete choices over which store to shop in.
We propose a three tier demand system: in the upper tier there are Cobb-Douglas preferencesover product groups g ∈ G (e.g. Beverages), in the middle tier there are CES preferences overlocal retailers selling that product group s ∈ S (e.g. Walmex, a foreign retailer; Soriana, a domesticretailer in modern retail; or a mom-and-pop store in the traditional retail sector), and in the final
12

tier there are preferences over the products within the product groups b ∈ Bg (e.g. a product suchas a 330 ml Coca Cola can) that we can leave unspecified for now:
U = ∏g∈G
[Qgh
]αgh (9)
Qgh = ( ∑s∈Sg
βgshqηgh−1
ηghgsh )
ηghηgh−1 (10)
where αgh, βgsh and are (potentially household-specific) preference parameters that are fixed overperiods. Qgh and qgsh are consumption aggregates with associated price indexes Pgh and rgsh
respectively. Under this demand system, consumers choose separately for each broad productgroup how much they are going to buy in each store. Consumers then choose the particularproducts purchased within each store. This seems like a reasonable assumption given that certainstores specialize in certain product groups and, at least within a month, consumers visit multiplestores. While the demand system is homothetic, we capture potential heterogeneity across theincome distribution by allowing for the preference parameters and elasticities to differ acrosshouseholds in different income groups.10
Building on Feenstra (1994), the following expression provides the exact proportional cost ofliving effect:
CLEe(P0∗
d , P0∗f , u0
h)=
e(P1∗d , P1
f , u0h)
e(P0∗d , P0∗
f , u0h)− 1 = ∏
g∈G
(∑s∈Sdc
gφ1
gsh
∑s∈Sdcg
φ0gsh
)1
ηgh−1 ∏s∈Sdc
g
(r1
gsh
r0gsh
)ωgsh
αgh
− 1. (11)
where Sdcg denotes the set of continuing domestic retailers within product group g, φt
gsh =
rtgshqt
gsh/ ∑s∈Sgrt
gshqtgsh is the expenditure share for a particular retailer of product group g, and
the ωgsh’s are ideal log-change weights
ωgsh = (φ̃1
gsh − φ̃0gsh
ln φ̃1gsh − ln φ̃0
gsh)/ ∑
sdc∈Sdcg
(φ̃1
gsh − φ̃0gsh
ln φ̃1gsh − ln φ̃0
gsh)
which in turn contain expenditure shares of different retailers within product groups where theshares consider only expenditure at continuing retailers φ̃t
gsh = rtgshqt
gsh/ ∑s∈Sdcg
rtgshqt
gsh. The priceterms rt
gsh are themselves price indexes of product-specific prices ptgsb within stores which, in
principle, could also account for new product varieties using the same methodology.As above, the cost of living effect can be broken up into the direct effect and the pro-competitive
10Notice that while convenient for estimation, this somewhat ad hoc treatment of non-homotheticity is unlikely tosignificantly bias our results in our empirical setting. Unless foreign retail entry causes large effects on either averagehousehold incomes, or the distribution of incomes—which we do not find to be the case empirically—income effectswould only play a minor role in evaluating the causal effect of retail FDI on household price indexes.
13

effect as follows:
CLEe(P0∗
d , P0∗f , u0
h)=
∏g∈G
(∑s∈Sdc
gφ1
gsh
∑s∈Sdcg
φ0gsh
)1
ηgh−1 ∏s∈Sdc
g
(r1
gsh
r0gsh
)ωgsh
αgh
−∏g∈G
(1
∑s∈Sdcg
φ0gsh
)1
ηgh−1 ∏s∈Sdc
g
(r1
gsh
r0gsh
)ωgsh
αgh
︸ ︷︷ ︸(1) Direct effect (DE)
+
∏g∈G
(1
∑s∈Sdcg
φ0gsh
)1
ηgh−1 ∏s∈Sdc
g
(r1
gsh
r0gsh
)ωgsh
αgh
− 1
︸ ︷︷ ︸
Pro-competitive effect (PE)
. (12)
Once more we can further break up the pro-competitive effect into extensive and intensive mar-gins:
PEe(P0∗
d , P0∗f , u0
h)=
∏g∈G
(1
∑s∈Sdcg
φ0gsh
)1
ηgh−1 ∏s∈Sdc
g
(r1
gsh
r0gsh
)ωgsh
αgh
−∏g∈G
∏s∈Sdc
g
(r1
gsh
r0gsh
)ωgsh
αgh
︸ ︷︷ ︸(3) Pro-competitive exit margin (PEX)
+
∏g∈G
∏s∈Sdc
g
(r1
gsh
r0gsh
)ωgsh
αgh
− 1
︸ ︷︷ ︸
(2) Pro-competitive intensive margin (PEI)
. (13)
This decomposition can be written more compactly if we consider the log change in expenditureholding fixed utility at the base period:
lne(P1∗
d , P1f , u0
h)
e(P0∗d , P0∗
f , u0h)
= ∑g∈G
αgh1
ηgh − 1ln ∑
s∈Sdcg
φ1gsh︸ ︷︷ ︸
(1) DE
− ∑g∈G
αgh1
ηgh − 1ln ∑
s∈Sdcg
φ0gsh︸ ︷︷ ︸
(3) PEX
+ ∑g∈G
αgh ∑s∈Sdc
g
ωgsh(ln r1gsh − ln r0
gsh)︸ ︷︷ ︸(2) PEI
.
(14)In the simple case where there are no pro-competitive effects (such as when firms are monop-
olistically competitive as in Krugman 1980):
CLEe(P0∗
d , P0∗f , u0
h)= ∏
g∈G
( ∑s∈Sdc
g
φ1gsh)
1ηgh−1
αgh
− 1 (15)
which is precisely the welfare gain from trade highlighted in recent work by Arkolakis at al.(2012) and Ramondo and Rodríguez-Clare (2013), but here in a multi-sectoral environment.
As described in detail in Section 4, the richness of the Mexican data we have compiled allowsus to calculate each of these components of the cost of living effect. In particular, we first drawon detailed price and quantity data and the precise timing of foreign retail openings to calculatecausal changes in the price index of domestic stores (the r1
gsh/r0gsh ratio) and market shares due
to foreign retail entry. We then use barcode-by-store level consumption surveys to provide an
14

estimate of the elasticity of substitution between store types (ηgh). Finally, we combine these twoestimates with expenditure shares of different store types and product groups to perform thequantification.
3.3 Estimating the Income Effect
The income effect in equation 2 can also be separated into distinct sub-components. Taking asecond order Taylor approximation on the income effect in period 1 we obtain the following:
IEe(P0∗
d , P0∗f , u0
h)≈ −∑
i
[θw0
ih
(w1
i − w0i
w0i
+l1ih − l0
ihl0ih
+w1
i − w0i
w0i
l1ih − l0
ihl0ih
)]︸ ︷︷ ︸
(4) Wage effects
(16)
−∑i
[θπ0
ih
(πih(P1
ih; w)− πih(P0ih; w0)
πih(P0ih; w0)
)]︸ ︷︷ ︸
(5) Household business effects
−[
θo0h
x1h − x0
hx0
h
]︸ ︷︷ ︸
(6) Other income effects
where θwih is the share of wages from industry i in household total income, θπ
ih is the share of totalincome derived from selling product b in a household retail enterprise in sector i and θo0
h is theshare of other income in household total income.
Foreign retail entry may change wages generally, or specifically in certain industries such aformal retail or informal retail (the θw0
ihw1
i−w0i
w0i
term). There may also be changes along the employ-ment margin with workers reducing their labor supply to certain industries, for example informalretail that competes with foreign retail, and increasing their labor supply to other industries ormoving into unemployment (the θπ0
ihl1ih−l0
ihl0ih
term).Households may also own businesses, for example traditional retail stores, and these may
be hurt by foreign retail entry (the household business effects term). Finally, income from othersources may respond to foreign retail entry through general equilibrium wage effects or becausehouseholds are producing goods that are sold through the retail sector.
The household business effect can be further broken down into effects due to output and inputprice competition. For simplicity we assume that retail profits are an additive function of profitsfrom each good sold in that store type,
πih(Pih; w) = ∑b
πbih(pbih; wi, p̃b),
with product-by-product profits a function of wages in that sector wi, and a common wholesaleprice for that good p̃b. Taking a second order Taylor approximation and applying Hoteling’slemma on the profits in period 1 we obtain two effects:
∑i
[θπ0
ih
(πih(P1
ih; w)− πih(P0ih; w0)
πih(P0ih; w0
)]︸ ︷︷ ︸
(5) Household business effects
≈ ∑i
∑b
[θπ0
bih
((
p1bih − p0
bihp0
bih) +
12
µbibih(p1
bih − p0bih
p0bih
)2
)]︸ ︷︷ ︸
(5a) Household business effects (output price competition)
(17)
15

−∑i
[ω0
ih(w1
i − w0i
w0i
) +12
ω0ihξiih(
w1i − w0
iw0
i)2 + ∑
b
(ω0
bih(p̃1
b − p̃0b
p̃0b
) +12
ω0bih$bibih(
p̃1b − p̃0
bp̃0
b)2 + ω0
ihχbiih(p̃1
b − p̃0b
p̃0b
)(w1
i − w0i
w0i
)
)]︸ ︷︷ ︸
(5b) Household business effects (input price competition)
where θπ0bih is the share of income from selling product b in total income; µbibih =
∂qSbih
∂pbih
pbihqS
bihis the
elasticity of supply; ωih is the share of wage costs in total income; ωbih is the share of whole-
sale costs for good b in total income; and ξiih = ∂l̃bih∂wi
wil̃bih
, $bibih =∂q̃S
bih∂ p̃b
p̃bq̃S
bihand χbiih = ∂l̃bih
∂ p̃b
p̃bl̃bih
arethe various input elasticities. In terms of output price competition, household business profitsmay decline through lowering the prices the firm receives (the θπ0
bih(p1
bih−p0bih
p0bih
) term). Householdsmay also substitute into other businesses in order to avoid competition with foreign retailers (theθπ0
bih12 µbibih(
p1bih−p0
bihp0
bih)2 term). In terms of input price competition, household businesses may suffer
from higher wages in retail if foreign entry bids up salaries, as well as potentially gain from lowerwholesale prices if foreign entry lowers producer price.
In our empirical work we will explore these terms allowing the effects of foreign entry todiffer across industry and hence across households depending on the household’s initial laborallocation and businesses. In order to do so, we draw on data from ENEU and ENOE, the Mexicanemployment surveys, which allow us to observe a quarterly time series of household incomebefore and after foreign retail entry as well as, for example, whether households are working invarious forms of retail or own a retail business.
In summary, our theoretical framework allows us to express the total household gains fromretail FDI as a function of causal effects on retail prices, consumption quantities and householdnominal incomes in combination with household demand parameters. The next section describesthe data sources we draw on to obtain these estimates. We then proceed in three steps. In step1, we present the empirical strategy to estimate the causal effects of foreign entry on retail prices,consumption quantities and household incomes. In step 2, we estimate the necessary demandparameters needed for the quantification. Finally, in step 3, we combine the estimates obtainedin the two previous steps with data on both household expenditure shares and income sources toquantify the gains from retail FDI across the income distribution.
4 Data
This section provides an overview of the main data sets that we use to estimate the welfareexpression.
Monthly Mexican CPI Microdata
Monthly price data at the barcode and store level are used to estimate the intensive marginpro-competitive effect: the effect of foreign entry on consumer prices among continuing domesticstores. These data consist of retail price quotes that are administered by Mexico’s nationalstatis-tics agency INEGI every month to compute the Mexican CPI.11 Because the main objective of the
11In July 2011 this operation was passed from Mexico’s Central Bank to INEGI.
16

CPI is to compute price inflation for identical product items in identical retail outlets over time,these data are ideally suited to estimate price effects among pre-existing products and stores thatare unconfounded by unobserved changes in product quality or changes in the composition ofstores over time.
The data collection effort for the Mexican CPI is substantial. Every month enumerators obtainprice quotes for over 85,000 items covering 315 product categories in 46 metropolitan areas cov-ering 141 urban municipalities.12 These individual price quotes are made publicly available ona monthly basis in the country’s official government gazette (Diario Oficial de la Federación).13
Obviously the CPI includes many product groups which do not refer to physical goods sold byretailers, such as housing, education, health or public transport. We exclude all non-retail productgroups from the analysis of the effect of foreign entry on consumer prices in pre-existing retailestablishments. The implicit assumption for the welfare analysis is that the entry of a foreignsupermarket has no significant effects on the prices of non-retail consumption. We also excludeproduct groups whose price quotes are not based on barcode level information. CPI prices offast changing product groups, such as clothing, or unprocessed product groups, such as fruit andvegetables or fresh meat, are based on store samples that do not credibly control for changes inproduct characteristics over time. The time series of prices for barcode-equivalent items (i.e. freshwhole milk Alpura brand 1 liter carton) that we use to estimate the pro-competitive effects of for-eign retail entry comprise more than one third of all reported price quotes in the Mexican CPImicrodata, and account for more than 40% of average household retail expenditure. Price quotesare inclusive of any promotions (sales) as well as value added tax.
In addition to the public access data of the Mexican CPI, we also obtain access to the confi-dential data columns.14 These allow us to observe the municipality in which the price quote wastaken, as well as store format type and retailer names. The latter information allow us to explorethe heterogeneity of the effect of foreign entry on consumer prices across different types of do-mestic competitors. The final estimation sample of the event study described in the followingsection consists of 3.3 million store price observations over the period 2002-2014 comprising 120product groups with barcode-equivalent goods across 76 urban municipalities.
These price data have a number of additional advantages for our purposes. First, the samplingof prices being collected is designed to be representative of Mexican household consumption andcovers not only supermarkets, convenience, and department stores but also street vendors, tra-ditional markets, and specialized stores. A second important advantage is that within a productgroup, the selection of barcode items and store types is designed to capture the consumption pat-terns obtained in the urban segment of the ENIGH household consumption surveys discussedbelow (Salas, 2006).
12For comparison, the U.S. CPI collects prices on 80,000 items in 211 product categories.13We thank Etienne Gagnon for access to the data he assembled directly from the Gazette.14We thank Rafael Posse and Javier Romero at INEGI and José Antonio Murillo at Banco de México for access to
these data.
17

ANTAD Store Opening Dates and Locations
We obtain data on store locations and dates of opening from Mexico’s national association ofretail businesses ANTAD (Asociación Nacional de Tiendas de Autoservicio y Departamentales).All major retailers in Mexico are part of ANTAD. The association represents more than 34,000retail units with close to 25 million square meters of retail space. ANTAD collects an unusuallydetailed data set with information from all its members about location and date of opening forevery unit in the country. The store openings at the municipality level by retailer over the 2002-2014 period are the source of the independent variable of interest in the empirical analysis—theentry of a foreign retailer in a municipality.15
Microdata of the Mexican Operation of a Large International Market Research Company
The estimation of the effects of changes in product variety on household cost of living requiresdata on the ex post retail market shares of foreign stores across product groups and householdsalong the income distribution, as well as estimates of the elasticity of substitution of householdconsumption across local stores as a function of price differences. The data we exploit for thispurpose are the microdata of a large international market research company, which was madeavailable to us through an academic collaboration with their Mexico City office. Their Mexicanconsumption microdata data are available for the years 2011-2014. These data are similar to thehome scanner data that market research companies collect on US consumers. The Mexican oper-ation of the firm collects information from roughly 6,000 urban households distributed across 151Mexican municipalities. Households are visited biweekly to obtain consumption diary informa-tion on all products purchased by the household. The household sample is updated annually tobe representative of all cities over 50,000. Importantly, we obtain access to the uncensored recordsincluding retailer identities that can be linked to every barcode transaction in a household’s con-sumption basket. These data are ideally suited to observe retailer market shares embodied inhousehold consumption baskets, as well as for the estimation of household elasticities of substi-tution that capture the extent to which households source their consumption from different localstores as a function of price differences. These microdata provide us with roughly 24 milliontransaction level observations over the period between January 2011 and June 2014.
Mexican Retail Census Microdata
For the purpose of estimating the effect of foreign entry on retail business profits and domes-tic retail exit we use the confidential version of the Economic Census microdata for the years 2003and 2008 (Censos Económicos 2004 and 2009) from INEGI. The Economic Census records estab-lishment level information for the universe of urban establishments in the country, including theuniverse of urban retail establishments. The restricted access version of the data we use allowsus to observe store level revenues and costs in addition to distinguishing between foreign and
15We thank Mauricio Varela for access to his data on Walmart store openings during years in which Walmart wasnot a member of ANTAD (2002-2007). We also extended the foreign store openings database for the period after 2007using monthly or annual reports from firms and in some cases newspaper coverage and phone calls to track downopening dates for stores with missing information on opening dates that were present at the beginning of 2014.
18

domestic establishments as well as modern and traditional store formats.
Quarterly Data on Household Incomes, Income Sources and Employment
To estimate the effect of foreign entry on nominal household incomes and employment, werequire high frequency data to exploit the same event study design for incomes as we use forconsumer prices. To this end, we make use of the National Employment and Occupation Surveys(ENOE) from INEGI. The ENOE has a similar design to the U.S. Current Population Survey in thatit is a quarterly survey with a rotating panel of sampled households in which a given householdis followed over 5 quarters. The survey tracks occupation and income in a manner equivalent tothe ENIGH data set described below and has the advantage of being representative at the statelevel and for 32 large cities. Every quarter more than 100,000 individual residences are surveyed.The ENOE replaced the national urban employment survey ENEU (1987-2004) which we use forthe pre-2005 years. The final estimation sample comprises roughly 5 million observations across172 urban municipalities.
Household Data on Consumption and Income Shares
In the final quantification exercise in section 7, we make use of Mexican household microdatathat allow us to observe both the incomes and income sources of each household as well as itsexpenditure shares across all product groups contained in the store price microdata and the mar-ket research company records described above. We obtain these data from the Mexican NationalIncome and Expenditure Surveys (ENIGH), which are administered biannually by INEGI. Thesedata provide us with the distribution of incomes, income sources, and consumption habits thatwe require to quantify the welfare effect for different income groups in Section 7. Unlike earlierrounds, the ENIGH microdata starting from 2006 also provide us with rich information on thestore formats that each individual transaction takes place at. The final estimation sample for thewelfare quantification contains 5,716 households in 171 urban municipalities between 2006-2008that had not experienced foreign retail entry at the time of the ENIGH survey.
5 Estimating the Causal Effects of Foreign Retail Entry
This section draws on the collection of microdata described above to empirically estimatethe causal effect of foreign retail entry on local consumer prices, retail market shares, store exit,and household incomes and employment across Mexican municipalities over the period 2002-2014. As well as being of interest in their own right, these causal effects enter into the welfareexpressions derived in the theoretical framework and hence form the basis of the quantificationof the household gains from retail FDI in Section 7.
19

5.1 Effect on Consumer Prices
5.1.1 Effect on Retail Prices in Pre-Existing Stores
Empirical Strategy To estimate the effect of foreign supermarket entry on retail prices in pre-existing domestic stores in expression 6, we combine the universe of foreign store opening datesand locations with monthly panel data on local barcode level prices from the Mexican CPI micro-data. We estimate the following event study specification:
ln pgsbmt =36
∑τ=−12
βτ I (MonthsSinceEntrymt = τ) + δgsbm + ηt + εgsbmt , (18)
where ln pgsbmt is the log price of a product in product-group g, individual store s, with bar-code b, in municipality and month t. I (MonthsSinceEntrymt = τ) is an indicator function, andMonthsSinceEntrymt counts the months since foreign entry for each municipality m at a givenpoint in time t (with negative values counting months before entry, positive values counting themonths after entry, so that MonthsSinceEntrymt = 0 in the month that a foreign store enters amunicipality for the first time).16 Since we are looking only at pro competitive effects on do-mestic stores, we restrict attention to prices at domestic stores before and after the first foreignstore opening. The parameter βτ captures the effect of foreign store entry for each of τ monthsbefore and after the opening event. δgsbm is a barcode-by-store fixed effect, and ηt is a monthfixed effect. If we estimated expression 18 with a single time-invariant β coefficient on a foreigntreatment dummy that takes the value 1 for all periods where there is a foreign store in the mu-nicipality, the coefficient would capture the mean difference in log prices before and after foreignentry (while treating each individual barcode-by-store combination as a separate price time se-ries and conditioning on average monthly price growth across stores in all sample municipalities).As mentioned in 3, since the pre-existing sampling weights across the store price quotes were de-signed to be representative of national consumption (the weighting to calculate the Mexican CPI),this change in log prices pre and post foreign entry, if properly identified, would provide a first-order (Laspeyres) approximation of the effect of foreign entry on the local retail price index forbarcode-equivalent product groups. This estimate only considers the intensive margin of retailprice changes, while abstracting from the effect on cost of living through exit and entry, to whichwe turn in the following subsection.
The concern when estimating a single time-invariant β coefficient is that foreign retail entrycould be associated with other time varying factors that also affect retail prices, but are not ac-counted for by the barcode-by-store and month fixed effects. In particular, foreign stores mighttarget municipalities with higher pre-existing price growth. They could also decide the timingof the opening in a way that is correlated with positive local store price shocks. Both of thesescenarios would lead to an upward biased estimate of the treatment effect of foreign entry on do-mestic store prices. Conversely, foreign stores could target faster growing municipalities whoseretail environments are also becoming more competitive, so that store prices could be on a pre-existing downward trajectory for reasons other than foreign entry. A final scenario is that rather
16We also define the indicator variable I (MonthsSinceEntrymt = 36), that picks up the last treatment effect, to takethe value 1 for all MonthsSinceEntrymt ≥ 36.
20

than targeting a particular subset of municipalities or particular points in time, foreign retailersexpand rapidly over the sample period with the long term aim of establishing store presence inmost urban municipalities. In that scenario, given that our municipality sample is drawn from46 large and entirely urban metropolitan regions one would expect a limited potential for biasedestimates as neither the selection of municipalities nor the timing of opening would likely becorrelated with differential pre-existing price growth in our sample.
To explore these scenarios, we draw on the monthly time series of the CPI microdata to es-timate specification 18. By estimating the treatment effect in the 12 months leading up to theopening event as well as the 36 months after, this approach allows us to test for the presence andslope of potential trends or leads in the run-up to the foreign store opening event in a transparentway, and without imposing parametric structure. The absence of trends or leads would suggestthat the endogeneity concerns above are not an issue, while if there are trends or leads, the eventstudy design allows us to sign and quantify any bias.
To estimate the event study on a fully balanced sample of municipalities both before andafter the store opening, we exclude municipalities where the first foreign store opened in the firsttwelve months of our data set (July 2002-June 2003), and municipalities where the first foreignstore opened in the last 36 months our data set (April 2011-March 2014) or later. This samplerestriction leads to the exclusion of six percent of our store price observations, and ensures thatthe event study point estimates are based on a fully balanced estimation sample starting one yearbefore the store opening event and extending to three years after.
In addition to the baseline event study specification in 18, we also estimate several additionalspecifications that serve as robustness checks. First, we replace the 141 month fixed effects, with16,818 product-group-by-month fixed effects in order to account for potential concerns that for-eign store openings are correlated with a particular product mix that also affects price growth.17
Second, to address concerns that the municipality sample is not fully balanced earlier than 12months before the opening event, we include municipality-specific time trends in the event studyregression. Finally, we make use of the urban income and employment surveys to additionallyinclude a rich set of quarterly municipality level controls for log average household income, em-ployment rates, log population as well as third order polynomials for average age and averageyears of schooling.
Estimation Results Figure 2 and Table 2 present the estimation results for the effect of foreignsupermarket entry on consumer prices in pre-existing domestic retail outlets. Figure 2 presentsthe event study graph. The absence of pre-existing differential trends in price growth providesno evidence suggesting that foreign retailers over the post-2002 estimation period have targeteda particular subset of municipalities among our urban estimation sample, or targeted store open-ing events at a particular points in time that coincide with local price shocks. Instead, the results
17Note, we do not include barcode-by-month fixed effects for two reasons. First, the product descriptions which weuse to define barcodes are recorded consistently within stores, but not necessarily across stores, and we are currentlyworking on the enormous task of harmonizing the barcode-level product descriptions. Second, even with harmonizedbarcode-level product descriptions across stores, because the store price data doesn’t sample an exhaustive list ofproducts, or the same products in every location, including such fixed effects absorbs much of the variation in the dataset.
21

appear to be consistent with a scenario in which foreign retailers rapidly expanded their store net-works to establish presence in a wide range of urban locations subject to a longer term planninghorizon.
The point estimates are close to zero and not statistically significant in the run up to the open-ing event, and a negative and significant effect starts to appear approximately ten months afterthe opening. Interestingly, the point estimate continues to get more negative until about twoyears after the opening, after which it levels off at about negative three percentage points. Asdiscussed above, given that the initial store price survey weights were designed to reflect a rep-resentative household consumption basket, this point estimate can be interpreted as a first orderapproximation of the effect of foreign entry on the local retail price index for barcode equivalentproduct groups.
Table 2 also reports additional specifications that serve as robustness checks. In particular,we obtain estimates of the same sign, size and statistical significance after including product-by-month fixed effects, municipality specific time trends, and a rich set of quarterly time-varyingmunicipality-level controls.
After reporting the event study on the average retail price effect of foreign store entry, wealso explore the heterogeneous effects of foreign entry on domestic retail prices across productgroups as well as domestic store formats. This analysis is possible since the confidential versionof the Mexican CPI microdata allows us to observe store formats and retailer names in additionto product groups. We estimate the following specification:
ln pgsbmt = ∑gs
βgs(
ForeignEntrymt × Productgs)+ δgsbm + ηgst + εgsbmt , (19)
where ForeignEntrymt is an indicator that takes the value of 1 if there is a foreign store in the mu-nicipality m in period t and Productgs is an indicator variable that takes the value of 1 if the retailprice quote belongs to a product in product g and store type s, and δgsbm is a barcode-by-store fixedeffect. To control for time-varying product-group by store-type specific shocks to price growth,we also include product-group by store-type by month fixed effects ηgst. The βgs estimates capturethe differential effect of foreign entry on domestic retail prices across product-group by store-typecategories relative to a reference category. This specification on the heterogeneous effects of for-eign entry is subject to similar identification concerns as discussed for the simple pre versus postmean comparison of the average effect above. We follow a similar strategy and rely on the lackof pre trends in the event study reported above. We also exclude all price observations during a24 month adjustment period immediately after the foreign opening event. We choose to excludethe first 24 months after store opening because the price coefficients in the event study level offby that time so our single coefficient here will capture the long-run price adjustment.
Table 3 reports the results of the treatment interactions with respect to domestic supermarketsas opposed to traditional stores, and with respect to food items as opposed to other consumercategories. The results suggest that modern domestic store formats are driving the bulk of the pro-competitive average effect, and that food prices appear to be marginally less affected by foreignentry in both domestic supermarkets and traditional store formats. We present this selected setof heterogeneity results for the sake of brevity, but the welfare quantification will use a full set of
22

product group-by-store type specific treatment effects of foreign entry on domestic retail prices.18
5.1.2 Ex-Post Price Gaps between Foreign and Domestic Stores for Identical Barcode Products
Empirical Strategy To estimate the average ex-post price difference charged by foreign storesrelative to domestic stores in the same municipality for identical barcode items in expression 7,we use the microdata of the international market research company over the period 2011-2014 toestimate the following specification:
ln pgsbmt = βDomesticStores + δgbmt + εgsbmt , (20)
where DomesticStores is a dummy that takes the value of 1 if the retailer is not a foreign-ownedstore and δgbmt is a barcode-by-municipality-by-month fixed effect. This specification estimatesthe average price gap between foreign stores and domestic stores for identical barcode itemsobserved in the same location and during the same month. Alternatively, we also estimate theex-post price gaps after further breaking up the domestic retail environment into modern andtraditional stores as well as food as opposed to non-food product groups within each of theseretailer categories.
As discussed in Section 3, these estimates provide a simple and transparent empirical ap-proximation for the direct price index effect of foreign retail entry (in combination with the pricechanges in domestic stores calculated in the previous section). This only provides an approxi-mation for three reasons. First, we are using a first-order approximation that amounts to usingPaasche weights. Second, we are ignoring differences in product variety and shopping ameni-ties across stores. Third, we are ignoring the gains in terms of shopping-variety that come fromthe presence of an additional shopping outlet. Hence, the expression would provide an accuratefirst-order approximation to the direct price effect if foreign and domestic stores do not differ inthe variety of products that they offer, and if foreign and domestic stores are not differentiated inwith respect to shopping quality (for example, there are no differences in search costs, security,transport costs, convenience, ambiance, friendliness or social status from shopping in the store).
Estimation Results Table 4 presents the estimation results. As reported in Section 2, foreignstores charge approximately 12 percent lower prices for identical barcode items compared to do-mestic stores in the same location during the same month. In terms of heterogeneity, the priceadvantage of foreign stores is most pronounced compared to traditional domestic retailers (an18.4 percent price difference), but the difference remains both economically and statistically sig-nificant when comparing foreign stores to modern domestic supermarkets (a 3.8 percent pricedifference). In terms of heterogeneity across product groups, the price differences are most pro-nounced for food relative to non-food product groups.
18The full set of results are shown in Appendix XXX.
23

5.2 Effect on Consumption Quantities
5.2.1 Effect on Foreign Retail Market Shares
Empirical Strategy To calculate the direct price index effect in expressions 14 and ??, we requireestimates of the effect of foreign supermarket entry on the retail expenditure shares of foreignstores (broken down by product group and by household income group). To obtain these esti-mates we turn to the uncensored microdata of the large international market research companyand estimate the following specification:
∑s∈S f
gmt
φghmt = βgh + εghmt (21)
where ∑s∈S fgmt
φghmt are local retail market shares of all foreign retailers s ∈ S fgmt. We allow for
these shares to differ across product-group g and household-type h, where household type is oneof seven income-groups. As above, we focus on the time period 24 months after initial foreignentry which we interpret as the long run (recall the price effects leveled off by that point). Ac-cordingly, we restrict our sample to municipalities and time periods where foreign retailer hadbeen open for 24 or more months. Thus, this specification estimates the mean long-run foreignretailer shares across 7 household income groups and 13 product groups.19
The choice to estimate average ex post foreign retailer shares after 24 months raises the con-cern that foreign entry could be correlated with other changes in the municipality that also affectforeign retail market shares. For example, income growth or changes in local transport infrastruc-ture may differentially affect retail expenditures on foreign and domestic stores. To limit potentialbias, as a robustness exercise we we restrict the estimation of 21 to municipalities where foreignretail first arrived between 2 and three years ago. The identifying assumption is that up to threeyears after the foreign entry event, the predominant factor that affects foreign retail shares is thefact that a foreign store opened in the municipality, rather than other time varying factors, such asincome growth, that could affect the relative expenditure shares on domestic and foreign outletsindependently of a foreign store opening.
Estimation Results Figure 3 presents the estimation results using the microdata of the largeinternational market research company. These data allow us to trace each retailer’s expenditureshares by product group across individual household consumption baskets. The average ex-postquarterly share of total household retail expenditure on foreign stores is more than 30 percent.Given that the median number of foreign stores across urban Mexican municipalities is one singlestore, these results provide prima facie evidence of a substantial and significant direct price indexeffect of retail FDI in a developing country context.
Importantly, the estimated ex post expenditure shares on foreign stores significantly differacross the distribution of household incomes. Figure 3 suggest that the poorest income groupspend approximately 40 percent less of their retail expenditure in foreign supermarkets compared
19These 13 broad product categories are the product group definitions that we currently work with in the welfarequantification exercise below.
24

to the richest income group. The right panel of the figure then breaks up the observed averageex post expenditure shares on foreign stores across product groups, rather than household in-come groups. The insight that arises is that non-food product groups appear to have slightlyhigher foreign expenditure shares compared to food products. However, this difference is notvery pronounced.
5.2.2 Effect on Domestic Store Exit
Empirical Strategy To estimate the effect of foreign store entry on domestic store exit in expres-sions 14 and ??, we intend to use the retail census microdata that provides store counts acrossperiods of foreign store entry. As these data are still in the process of being acquired, instead wemake use of information on the number of workers who report being store owners every quar-ter in the Mexican income and employment surveys (ENEU). As this is the same data source weuse below for the income and employment regressions, we discuss the empirical strategy andreport these estimation results alongside the other income and employment results in the nextsubsection.
5.3 Effect on Nominal Incomes and Employment
Empirical Strategy To calculate the income effect in expression 16 of Section 3, we require es-timates of the causal impact of foreign retail entry on nominal incomes and employment in thelocation where retail entry occurred. We start by analyzing the effect on average nominal incomesby running the following event study specification:
lnIncomejmt =20
∑τ=−10
βτ I (QuartersSinceEntrymt = τ) + γXjmt + δm + ηt + εjmt, (22)
where subscripts j, m and t index individuals, municipalities and quarters respectively. Xjmt
are person controls including gender and third order polynomials for age and years of schooling.Alternatively, we replace log monthly incomes with an employment indicator that takes the valueof one if the person is employed:
Employmentjmt =20
∑τ=−10
βτ I (QuartersSinceEntrymt = τ) + γXjmt + δm + ηt + εjmt, (23)
Hence, quarterly individual income or employment outcomes are thus regressed on foreign storeopening events in addition to person controls, municipality fixed-effects and quarter fixed-effects.
As discussed for the price regressions above, the event study design allows us to transpar-ently and non-parametrically explore pre-existing trends in the run up to the store opening event.Again, there are several possibilities . Foreign retailers could target urban municipalities withhigher pre-existing income growth rates, or decide on the timing of the opening in a way thatis correlated with positive local economic shocks. Conversely, it could be the case that foreignretailers target urban municipalities with higher income levels that in turn could be character-
25

ized by lower income growth rates. Finally, it could be that, as found to be the case in the priceregressions, foreign retailers expanded rapidly during the estimation period with a longer-termplanning horizon to establish store presence in a wide range of urban municipalities, so that storeopenings are uncorrelated with local shocks or pre-existing trends in incomes or employment.
One important difference relative to the retail price event study above is the municipalityestimation sample. While both the CPI price microdata as well as the ENEU income and em-ployment surveys explicitly include only urban municipalities, the ENEU data comprises a muchwider range of urban municipalities compared to the store price microdata. The CPI microdataare collected in around 140 urban municipalities located in the 46 major metropolitan centers ofMexico. In contrast, the ENEU data include more than 500 urban municipalities across all ofMexico, where urban is defined to be any municipality with more than 2500 inhabitants. Theincome event study is thus based on a much wider and more heterogeneous range of urban mu-nicipalities compared to the more homogenous municipalities in the store price data, and so theendogeneity concerns may differ across the two samples.
With these points in mind, we proceed to implement the event study in the same way asdescribed above for the price regressions. As above, we balance the estimation sample betweenone year before and two years after the store entry event. This restriction excludes approximatelyten percent percent of our income and employment observations. The majority (6 percent) ofthese excluded observations are in urban municipalities that had not yet received a foreign storeat the end of our sample in March 2014.
Since the ENEU data is a rotating panel where individuals are followed for 5 quarters, wehave the possibility of including person fixed effects. Therefore, we run an additional specifica-tion in 22 where replace municipality fixed effects with individual fixed effects. The interpretationof our coefficients is quite different when we include individual fixed effects. First, we miss anycompositional changes in the number of working age people in the municipality if individualsare not followed across locations. For example, there may be migration responses to a foreignsupermarket opening. Both the data as well as anecdotal evidence would point against this chan-nel playing a significant role.20 Second, because each individual is observed for a maximum of5 consecutive quarters, the individual fixed-effect mechanically restricts the treatment effect to ashort run estimate. For example, someone may lose their job as a result of foreign retail competi-tion and only obtain a new job after they have left the panel. With this qualification in mind, wereport estimates both with and without individual fixed-effects.
Before turning to the results on differential income effects, we note that our empirical method-ology is only able to estimate income gains or losses within the location where the foreign storeopened. Any changes in national income due to foreign store entry are absorbed in the fixed ef-fects. Undoubtedly there are such effects. The owners, headquarter employees and shareholdersof large domestic supermarket chains are likely to experience profit declines, and employees atforeign firms Mexican headquarters will see gains. These income effects will be concentrated inMexico City and other major cities where the headquarters are located and are excluded from ouranalysis. Accordingly, this paper provides estimates of the local welfare effects of foreign retailentry rather than the complete national welfare effects.
20We find no effects on municipality population.
26

For our quantification we require estimates of the nominal income effects broken down byoccupation. Any differences across occupations will lead to heterogeneous welfare impacts onhouseholds depending on their pre existing occupation breakdown. Therefore, to estimate towhat extent household incomes are affected differently depending on the primary source of in-come (indexed by i below), we also run specifications that allow for heterogeneity.
Since individuals may work in several occupations or become unemployed over time, and weonly follow individuals over 5 consecutive quarters, if we want to assess the impact on workers indifferent occupations prior to foreign entry we are necessarily restricted to shorter-run responses.In order to obtain longer run responses that match our price results, we therefore evaluate ag-gregate changes in incomes and employment across different occupations. As with the priceregressions, we remove observations from the first two years after foreign store entry to explorelong run adjustments. We regress log income or employment on a foreign entry dummy thattakes the value 1 when there is a foreign store in the municipality interacted with an occupationdummy that takes the value of 1 if a worker is employed in that occupation:
ln(Income)jimt = ∑i
βi (ForeignEntrymt ×Occupationi) + γXjimt + δmt + ηim + θit + εjimt , (24)
where subscripts j, i, m and t index individuals, occupations, municipalities and quarters respec-tively. We focus on different retail occupations, where i includes categories for retail workersin modern store formats, retail workers in traditional store formats, retail business owners andworkers in other sectors. δmt is a municipality-by-quarter fixed effect, ηim is an occupation-by-municipality fixed effect, and θit is an occupation-by-quarter fixed effect. The coefficients βi cap-ture the differential effect of foreign store entry on the incomes of retail workers in modern storeformats, traditional store formats and retail business owners (conditional on flexible trends at themunicipality-quarter level and initial earnings differences across occupation groups within themunicipality and the quarter). Similarly, we estimate specification 24 with employment dum-mies on the left hand side to capture the differential effect on employment propensities.
The empirical issue with both these specifications is that the ENEU survey is a sample ofpotential workers, and so the number of retail employees and owners is necessarily small aroundthe time of foreign retail openings (the median quarter-by-municipality sample count is 200). Inthe future we plan to supplement this section with additional evidence from the retail censusthat would provide larger sample sizes and more precise inference. With this important datalimitation in mind, we proceed to the empirical results.
Estimation Results Figure 4 and Tables 5 and 6 present the estimation results on the income andemployment effects of foreign supermarket entry. The estimation results on the average effectsin Figure 4 and Table 5 suggest that foreign retail entry is occurring in locations that are ex antedifferent to locations where foreign retail does not enter. The event study graph portrays a patternin which foreign retailers open stores in urban municipalities with pre-existing positive trends inlog incomes, i.e. higher income growth rates. However, accounting for this pre-trend, there is nochange in levels or growth trends in either average incomes or employment, as shown in Table 5.
These findings differ from the event study design on local retail prices presented above, inwhich no pre-existing trends were apparent even without municipality time trends. As men-
27

tioned above, one possible explanation for this are the differences in the urban municipality sam-ples between the two event studies: whereas the effect on retail prices is estimated in a sampleof metropolitan municipalities, the income effect is estimated off a much more heterogeneousand wider range of urban municipalities. This could give rise to spurious OLS income effects be-cause the control group includes somewhat remote and very different municipalities which weretreated at a later point in time. We explore this explanation by rerunning the event study on thesame sample of municipalities as in our price analysis. The results of this event study are reportedin Figure 5 and provide support for this explanation. When estimated on the same sample of ur-ban municipalities as the retail price event study, the results show no pre-existing trends whileconfirming the finding of no significant effect on average municipality level nominal incomes dueto foreign retail entry. In conclusion, while the event study on retail prices reveals a clear break inthe pre-existing (flat) time trend, no such break in trend or jump in levels is apparent in the eventstudy on average municipality level incomes or employment propensities.
Table 6 presents the results that explore heterogeneity across retail workers in modern storeformats, traditional formats, and retail business owners. In contrast to the average income re-gressions, we find a negative and significant effect on the incomes of traditional retail workers.This point estimate is robust to including income group-by-quarter fixed effects as well as state-by-income-group specific time trends, implying that this effect is not driven by pre-existing dif-ferential trends that are specific to particular income groups. The point estimate corresponds toa reduction in the monthly incomes of traditional sector retail workers of approximately 5 per-cent as a result of foreign retail entry. It is important to keep in mind that the ENEU allows usto estimate the effect on retail worker earnings conditional on employment in that sector duringany given quarter. What the ENEU do not allow us to quantify is the extensive margin effect ofworkers or store owners that lose their job or business as a consequence of foreign retail entrybecause of the very short 5 quarter panel structure.
The final four columns of the table aim to shed light on such extensive margin effects usingthe ENEU data. Unsurprisingly, we find insignificant and noisy estimates of the effect of retailentry on the employment propensities across the three retail sectors relative to average changes inemployment in the municipality. As briefly discussed above, the likely reason for these estimatesis that the ENEU are not thick enough in order to rely on changes in the municipality level sam-pling probabilities for workers across different sectors in order to estimate the extensive marginresponses on exit or entry. We are currently in the process of collecting richer data to providebetter estimates of these effects.
6 Estimating Demand Parameters
We now turn to the estimation of the preference parameters using the market research com-pany’s records on individual household shopping patterns across multiple stores. These dataallow us to estimate our key elasticity, the degree to which households substitute across localoutlets as a function of retailer price differences.
In the estimation procedure we will draw on the elasticity of household shopping responseswith respect to variation in store-specific prices across locations to identify these parameters.
28

These cross-location estimates form our baseline specification as we believe that these providemore reasonable estimates of the long run elasticity relevant for estimating the gains from newforeign retail store openings.
6.1 Estimation of the CES Elasticity Parameter
In the CES case, note that the logged share equation can be written as
ln φgshmt = (1− ηgh) ln rgshmt − (1− ηgh) ln cghmt + ηgh ln βgshmt (25)
where cghmt = (∑s∈Sgmt(βgsh)
ηgh(rgshmt)1−ηgh)
11−ηgh is the CES price index, g indexes product groups,
s indexes stores, h indexes household income groups, m indexes location, and t indexes time. Ifwe had measures of rgshmt, the price index for product group g within store s for income group h,we could simply run the following regression:
ln φgshmt = bgh ln rgshmt + δghmt + γst + ugshmt (26)
where ugshmt is measurement error on log budget shares that needs to be uncorrelated with prices,δghmt are product-group-by-income-group-by-municipality-by-time fixed effects, γst is a store-time fixed effect that absorbs unobserved taste differences across stores and time which we dis-cuss in more detail in the next paragraph. Finally, 1− bgh is the parameter of interest: the elasticityparameter ηgh that governs the degree of substitutability between local retail outlets as a functionof store price differences. When we carry out the estimation, we restrict this parameter to beidentical across households and product groups as our baseline estimation approach. We laterrelax this assumption, and allow the parameter to potentially differ across income groups as wellas product categories.21
We allow the store-specific taste shifters to vary across time through the inclusion of store-by-time fixed effects. Essentially we are comparing store market shares across locations with differ-ent relative price indexes across stores (where prices indexes across stores are all demeaned byproduct group, income group, municipality and time through the δghmt fixed effects). Exploitingthe cross section in this manner provides estimates of long run elasticities since if price differ-ences are persistent over time, when we look across municipalities we see consumers that havehad time to adjust their shopping patterns in response to these price differences across stores.
Turning to our measures of the store price index, rgshmt, recall we left the third tier of thedemand system unspecified in Section 3. In principle we could use any demand system to cal-culate the price index. For simplicity and transparency, we use a Stone-price index, ln rgshmt =
∑b∈Bgshmtφgsbhmt ln pgsbhmt, or a budget share weighted sum of log prices. As barcodes differ across
stores, and some stores may sell higher-quality varieties, we ensure that we are only compar-ing identical products to extract price differences by recovering ln rgshmt from regressing budget-share-weighted log prices at the barcode level (where budget shares are income group-specific)
21Notice that despite the richness of these microdata, the variation starts to become thin once we allow for hetero-geneity along the h or g dimension. To see this more clearly, notice that there are on average 40 households observedin a given quarter in a given municipality.
29

on store-by-product-group-by-income-group-by-municipality-by-time fixed effects. The coeffi-cient on the fixed effects provides an estimate of the store price index for a product and incomegroup relative to other stores in that municipality and time period.
Given the nature of the consumption microdata, we collapse the price data to averages at the(retailer identity)-(barcode)-(income-group)-(quarter)-(municipality) level in order to estimate thespecifications above.22
We address the standard simultaneity concern that arises when estimating demand. For ex-ample, suppose that the taste parameters β are not constant across locations within a store-timeperiod as implicitly assumed when we include only a γst fixed effect. Deviations in taste shifterswould then enter the error term and potentially be correlated with ∆ ln pi
gsh due to supply sideconsiderations. To deal with this concern we follow Hausman (1996) and instrument price in-dexes with price indexes in stores of the same retailer in nearby municipalities. The assumptionhere is that deviations in the taste shifters across locations are idiosyncratic, a similar assumptionrequired for the identification through heteroskedasticity approach in Feenstra (1994), Broda andWeinstein (2006) and Feenstra and Weinstein (2013), and so these deviations do not confoundprices in nearby locations which serve as valid instruments in the presence of common supplyside price determinants.
6.2 Estimation Results
Table 7 presents the estimation results for the average household elasticity of substitutionunder CES. We estimate this parameter by exploiting variation in relative store prices across mu-nicipalities (taking store-by-quarter fixed effects in addition to the δghmt fixed effects). The IVpoint estimate reported in Table 7 that we use for the welfare quantification is η = 3.82.
7 Quantifying the Welfare Effect of Foreign Retail
This section calculates the expressions derived in the theoretical framework of Section 3, us-ing both the causal effects estimated in Section 5 and the demand parameters from Section 6, toquantify the welfare effects of foreign retail entry across Mexican households. The first subsec-tion explains how we map our various estimates into the theoretical welfare expressions, whilethe second subsection reports the results of the quantification both for the average household andfor the full distribution of households.
7.1 Calculating the Welfare Effect of Foreign Retail Entry
This subsection explains how we use the causal estimates of the price, quantity, and incomeeffects reported in Section 5 in combination with the demand parameter estimates of the previoussection to quantify the gains from retail FDI across households. At the center of this exercise
22The retailer identity is one of the retailers we can identify from the microdata with all traditional stores (for whichthe research company does not brand-identify a retailer) grouped together. The market research company data divideconsumers into six income groups.
30

lies household microdata from the Mexican income and expenditure surveys (ENIGH), whichprovide us with household specific budget shares at the product group-by-store type level inaddition to household income shares across different occupations and business income sources.These data allow us to separately quantify the welfare effects of foreign entry for every householdin the dataset and hence for us to obtain the full distribution of welfare effects across households.
To be consistent with the empirical estimates of the previous sections, we restrict attention toENIGH households surveyed over the period 2006-2008 (two bi-annual cross-sections) who residein urban municipalities without foreign stores at the time of the survey. Unlike earlier ENIGHsurveys, these two rounds break down the location of expenditure by product group into detailedstore categories that allow us to code the expenditure as occurring in modern or traditional stores.The ex ante household income shares as well as ex ante household expenditure shares provide uswith the remaining parameters needed to perform the full quantification outlined in Section 3.
To quantify the cost of living effect, ideally we would separately estimate the causal pricechanges and budget share changes for every barcode product in every domestic store. Giventhe available store price microdata that we use in the event study methodology presented inSection 5, estimating such a large number of causal price effects is not feasible. Instead, we makea simplifying assumption that still allows for substantial heterogeneity. We assume that causalprice changes within a product-group-by-store-type are the same, where the two store types aredomestic continuing modern, M, stores and domestic continuing traditional, T, stores:
Assumption 1:
p1gsb
p0gsb
≡ pgj ∀s ∈ Sdcjg
where j takes two values, M or T. Note that we allow these price changes to differ by productgroup as well as store type, so for example beverage prices could fall more than the prices ofsnacks, and relatively more so in domestic modern than traditional stores.
With this assumption in hand, and the estimates of the causal effects on price changes andex post foreign retail shares reported in Section 5, we have almost all we need to carry out thequantification exercise in the CES case. The only remaining inputs are causal estimates of post-foreign-entry market shares of continuing domestic varieties that enter into the ideal log changeweights. In the CES case, these can be easily calculated since the estimated elasticities of sub-stitution allow us to calculate ex post budget shares for continuing stores as a function of initialexpenditure shares in the ENIGH surveys and the estimated prices effects:23
φ̃1gsh = φ̃0
gsh((pgj)
1−ηgh
(pgM)1−ηgh ∑s∈SdcMg
φ̃0gsh + (pgT)
1−ηgh ∑s∈SdcTg
φ̃0gsh
)
where j takes the value M if s ∈ SdcM and the value T if s ∈ SdcT. Note that ∑s∈SdcMg
φ̃0gsh is the
expenditure share of continuing domestic store purchases of product group g spent in modernretail.
23This approach assumes that there are no new or exiting products in domestic continuing stores around the timeof foreign retail entry.
31

7.2 Quantification Results
7.2.1 Average Household Gains from Foreign Retail Entry
In this subsection, we present the quantification results and explore several counterfactualsthat shed light on the interplay of forces that underlie the distribution of the welfare effects thatwe find..
We first present the results of the quantification under the exact (CES) approach. The ENIGHdata combined with our various moments allow us to calculate welfare gains separately for eachhousehold in the sample based on their expenditure shares and income sources. Column 1 ofTable 8 presents the mean of the total welfare gain across all households as well as the varioussub components of the total welfare effect in columns 2-7.24 Foreign store entry leads to large andsignificant welfare gains for the average household in the municipality where the store opened.These gains are of the order of 7 percent of initial household welfare.
The majority of the total welfare gain is driven by a significant reduction in the cost of livingrather than income effects. While the adverse effects on the household incomes of traditionalretail workers are economically significant (an estimated negative 5 percent change), these effectsare muted when analyzing the municipality as a whole. In contrast, retail is a large share ofhousehold expenditures for all households which drives large cost of living effects.
Focusing on the cost of living effect, about 20 percent of this effect comes from pro-competitiveeffects on the intensive margin, i.e. reductions in prices at domestic stores induced by the entryof foreign retailers. The remaining 80 percent of the cost of living effect is due to the direct priceindex effect of foreign entry, a finding already foreshadowed in the raw data by both the signifi-cantly lower prices charged by foreign stores and their large ex-post retail market shares reportedin Section 5.
Turning to the first order approach in columns 8-14 of Table 8 we see that the Paasche approxi-mation of the direct price index effect that is purely based on observed barcode price changes andex post store price gaps can account for one third of the exactly estimated direct price index effectunder CES (1.94 percent as opposed to 5.89 percent). This effect does not capture three potentiallyimportant welfare gains due to foreign store entry: gains from greater variety, potentially highershopping amenity, and (abstracting from these differences) virtual price changes that would setthe demand for a new horizontal store variety equal to zero ex ante. The pro-competitive priceeffect is also slightly smaller under the direct approach, which can be explained by the fact thatwe use a Paasche first-order approximation which will tend to underestimate the pro-competitiveeffects as it uses ex post weights on domestic stores.
7.2.2 The Distribution of the Gains from Foreign Retail Entry
Since we have estimates of the welfare gains for every household in the ENIGH sample, wecan plot these estimated gains against initial household income to explore the distribution of
24Both this table and the accompanying welfare figures do not yet report standard errors that take account of thefact that many of the quantification inputs are themselves estimated and may be correlated with each other. Weare currently in the process of bootstrapping the entire estimation procedure to provide correct standard errors andconfidence intervals.
32

the gains from foreign retail entry. Figure 6 presents non-parametric plots of the exact approachquantification (both the total welfare effect and the various components). We find that while allincome groups benefit substantially from foreign retail entry, richer households gain more thanpoorer households. The regressiveness of the gains from retail FDI is sizable. The total welfaregain for the poorest household is about 5 percent, rising to 10 percent for the richest households.
Where do these regressive gains come from? Figures 7-10 present a number of counterfactualexercises that allow us to analyze the interplay of forces underlying these results. Each of thesegraphs sets one component of the quantification equal to the mean of that component across allhouseholds in the sample and compares the resulting counterfactual distribution of the welfaregains from foreign entry to the one we actually observe. We explore the role of several salient dif-ferences in household shopping and income patterns across the household income distribution:expenditure shares on foreign retailers relative to domestic ones, on retail relative to non-retailconsumption, on food relative to non-food product groups within retail, and labor and businessincome shares from retail relative to other income sources.
On one hand, after foreign entry the richest households spend over 50 percent of their totalretail expenditure at foreign stores compared to under 20 percent for the poorest households. Asshown in Figure 7, this moment in the data clearly works in favor of richer households experi-encing much larger reductions in cost of living due to foreign entry: In the absence of differencesin foreign shares across households, the gains would actually become progressive. On the otherhand, richer households spend a significantly smaller share of their total expenditure on retailconsumption compared to poorer households. As shown in Figure 8, this moment in the dataworks in the opposite direction. In absence of differences in retail expenditure shares, the gainsfrom retail globalization would be vastly more regressive than we estimate.
The three remaining forces have much more moderate impacts on the distribution of gainsacross households. As shown in Figure 9, the fact that poorer households spend more of theirretail expenditure on food consumption contributes positively but only slightly to the regressive-ness of the welfare gains. The reason for this is that while the pro-competitive effect on domes-tic retail prices is slightly weaker for food products the direct price index is relatively evenlydistributed across food and non-food product groups as indicated earlier in Figure 3. Finally,differences in retail income shares across the income distribution do not appear to contributesignificantly to the estimated regressiveness. While there are clear distributional patterns in thesectors that households obtain their income from (e.g. poorer households derive a larger propor-tion of their income from working in the traditional retail sector or being self-employed in theretail sector), these differences have little effect on the total welfare gains from foreign retail entrysince the majority of households derive no income from the retail sector.
8 Conclusion
[Work in progress.]
33

References
Anderson, S. P., De Palma, A., & Thisse, J. F. (1992). Discrete choice theory of product differentiation.MIT press.
Arkolakis, C., Costinot, A., & Rodríguez-Clare, A. (2012). New trade models, same old gains?American Economic Review, 102(1), 94–130.
Atkin, D. (2013). Trade, tastes and nutrition in India. American Economic Review, 103(5), 1629–1663.
Basker, E. (2005). Job creation or destruction? Labor market effects of Wal-Mart expansion. Reviewof Economics and Statistics, 87(1), 174–183.
Biles, J. J. (2008). Wal-Mart and the supermarket revolution in Mexico. Geographische RundschauInternational Edition, 4(2), 44–49.
Broda, C., & Weinstein, D. E. (2006). Globalization and the gains from variety. Quarterly Journalof Economics, 121(2), 541–585.
Caron, J., Fally, T., & Markusen, J. R. (2012). Skill premium and trade puzzles: A solution linkingproduction and preferences. NBER Working Paper 18131.
Deaton, A. (1989). Rice prices and income distribution in Thailand: A non-parametric analysis.The Economic Journal, 99(395), 1–37.
Donaldson, D. (2012). Railroads of the raj: Estimating the impact of transportation infrastructure.American Economic Review, forthcoming.
Dufey, A., Grieg-Gran, M., & Ward, H. (2008). Responsible enterprise, foreign direct investment andinvestment promotion: Key issues in attracting investment for sustainable development. InternationalInstitute for Environment and Development.
Faber, B. (2014). Trade liberalization, the price of quality, and inequality: Evidence from Mexicanstore prices. UC-Berkeley Working Paper.
Fajgelbaum, P. D., & Khandelwal, A. K. (2014). Measuring the unequal gains from trade. WorkingPaper.
Feenstra, R. C. (1994). New product varieties and the measurement of international prices. Amer-ican Economic Review, 84(1), 155–57.
Feenstra, R. C., & Weinstein, D. E. (2013). Globalization, markups and U.S. welfare. NBERWorking Paper 15749.
Goldberg, P., & Pavcnik, N. (2007). Distributional effects of globalization in developing countries.Journal of Economic Literature, 45, 39–82.
Handbury, J., & Weinstein, D. E. (2011). Goods prices and availability in cities. NBER WorkingPaper 17067.
Hausman, J., & Leibtag, E. (2007). Consumer benefits from increased competition in shoppingoutlets: Measuring the effect of Wal-Mart. Journal of Applied Econometrics, 22(7), 1157–1177.
Hausman, J. A. (1981). Exact consumer’s surplus and deadweight loss. American Economic Review,71(4), 662–676.
34

Hausman, J. A. (1996). Valuation of new goods under perfect and imperfect competition. In Theeconomics of new goods (pp. 207–248). University of Chicago Press.
Holmes, T. J. (2011). The diffusion of Wal-Mart and economies of density. Econometrica, 79(1),253–302.
Humphrey, J. (2007). The supermarket revolution in developing countries: Tidal wave or toughcompetitive struggle? Journal of Economic Geography, 7(4), 433–450.
Iacovone, L., Javorcik, B. S., Keller, W., & Tybout, J. R. (2014). Supplier responses to Wal-Mart’sinvasion of Mexico. Journal of International Economics forthcoming.
Instituto Nacional de Estadística y Geografía - INEGI. (2004). Metodología de los censos económicos.
Instituto Nacional de Estadística y Geografía - INEGI. (2009). Metodología de los censos económicos.
Javorcik, B. S., & Li, Y. (2013). Do the biggest aisles serve a brighter future? Global retail chainsand their implications for Romania. Journal of International Economics, 90(2), 348–363.
Jia, P. (2008). What happens when Wal-Mart comes to town: An empirical analysis of the discountretailing industry. Econometrica, 76(6), 1263–1316.
Krugman, P. (1980). Scale economies, product differentiation, and the pattern of trade. AmericanEconomic Review, 70(5), 950–59.
Neven, D., & Reardon, T. (2004). The rise of Kenyan supermarkets and the evolution of theirhorticulture product procurement systems. Development Policy Review, 22(6), 669–699.
Porto, G. (2006). Using survey data to assess the distributional effects of trade policy. Journal ofInternational Economics, 70(1), 140–160.
Ramondo, N. (2014). A quantitative approach to multinational production. Journal of InternationalEconomics.
Ramondo, N., & Rodríguez-Clare, A. (2013). Trade, multinational production, and the gains fromopenness. Journal of Political Economy, 121(2), 273–322.
Reardon, T., Timmer, C. P., Barrett, C. B., & Berdegué, J. (2003). The rise of supermarkets in Africa,Asia, and Latin America. American Journal of Agricultural Economics, 85(5), 1140–1146.
Topalova, P. (2010). Factor immobility and regional impacts of trade liberalization: Evidence onpoverty from India. American Economic Journal: Applied Economics, 2(4), 1–41.
United Nations Conference on Trade and Development. (2014). World economic report 2014.
Varela, M. (2013). The costs of growth: Estimating entry costs during rollouts. University ofArizona Working Paper.
Wrigley, N., & Lowe, M. (2010). The globalization of trade in retail services. Organisation forEconomic Co-operation and Development.
35

9 Figures and Tables
Figure 1: Retail Globalization in Mexico - Left to Right: Foreign Store Presence at the End of 1995, 2001, and 2013
Juárez
Tijuana
Puebla
Querétaro
Monterrey
Guadalajara Mexico City
Juárez
Tijuana
Puebla
Querétaro
Monterrey
Guadalajara Mexico City
Juárez
Tijuana
Puebla
Querétaro
Monterrey
Guadalajara Mexico City
Notes: Municipalities in red indicate foreign store presence at the end of 1995 (upper left, 204 stores), 2001 (upper right, 365 stores), and 2013 (lower, 1335 stores). The datasource are annual publications of the Mexican National Association of Supermarkets (ANTAD).
36

Figure 2: Effect on the Prices of Domestic Retailers: Monthly Event Study
-.05
-.04
-.03
-.02
-.01
0.0
1
Log
Bar
code
Pric
es a
roun
d D
ate
of O
peni
ng(R
elat
ive
to 1
3 M
onth
s B
efor
e O
peni
ng)
-12 -9 -6 -3 0 3 6 9 12 15 18 21 24 27 30 33 >36Months Before and After Foreign Supermarket Opening
Notes: Point estimates are based on 149,273 monthly price series of unique barcode-by-store combinations over theperiod 2002-2014. The dots correspond to coefficient estimates from a regression with 3,228,544 observations in whichlog prices are regressed on the indicated monthly treatment effects in addition to barcode-by-store fixed effects andmonth-by-product group fixed effects. The reference category are barcode prices 13 months before foreign entry. Thegraph depicts 95% confidence intervals based on standard errors that are clustered at the municipality level.
37

Figure 3: Effect on Foreign Retail Market Shares: Heterogeneity across the Household Income Distribution
Figure 4.1: Across the Income Distribution Figure 4.2: Across Product Groups
.1.2
.3.4
.5.6
Hou
seho
ld R
etai
l Exp
endi
ture
Sha
res
on F
orei
gn S
tore
s
Poorest 2 3 4 5 6 RichestHousehold Income Group
.1.2
.3.4
.5H
ouse
hold
Ret
ail E
xpen
ditu
re S
hare
s on
For
eign
Sto
res
Bre
ad&
Cer
eals
Fis
h
Milk
Pro
duct
s
Oils
&F
at
Fru
its&
Veg
gie
Bev
erag
es
Oth
erF
ood
Alc
ohol
Acc
esor
ies
Det
erge
nts
Med
ical
Per
sona
lCar
e
Notes: The graphs depict quarterly household retail expenditure shares on foreign stores among municipalities that have experienced foreign store entry more than two years ago. Thedata source for this graph are the microdata of the Mexican operation of a large international market research company for the years 2011-14. Both graphs depict 95% confidence intervalsbased on standard errors that are clustered at the municipality level.
38

Figure 4: Effect on Average Municipality Incomes and Employment
Figure 6.1: Average Monthly Incomes Figure 4.2: Average Employment Propensities
-.02
0.0
2.0
4.0
6.0
8
Log
Mon
thly
Inco
mes
aro
und
Dat
e of
Ope
ning
(Rel
ativ
e to
5 Q
uart
ers
Bef
ore
Ope
ning
)
-4 -3 -2 -1 0 1 2 3 4 5 6 7 8Quarters Before and After Foreign Supermarket Opening
-.01
-.00
50
.005
.01
Em
ploy
men
t Pro
pens
ity a
roun
d D
ate
of O
peni
ng(R
elat
ive
to 5
Qua
rter
s B
efor
e O
peni
ng)
-4 -3 -2 -1 0 1 2 3 4 5 6 7 8Quarters Before and After Foreign Supermarket Opening
Notes: Point estimates are based on the quarterly income series of 1,606,213 individuals (left) and the quarterly employment series of 1,828,567 individuals (right) over the period2002-2012. The dots correspond to coefficient estimates from a regression with 4,377,393 observations (left) and 5,705,807 observations (right) in which log monthly incomes oremployment identifiers are regressed on the indicated monthly treatment effects in addition to municipality and quarter fixed effects and and time changing person controls. Thereference category in both graphs are incomes or employment 5 quarters before foreign entry. Both graphs depict 95% confidence intervals based on standard errors that areclustered at the municipality level.
39

Figure 5: Effect on Average Municipality Incomes and Employment - Identical Municipality Sample as for Event Study on Retail Prices
Figure 6.1: Average Monthly Incomes Figure 4.2: Average Employment Propensities
-.1
-.05
0.0
5.1
Log
Mon
thly
Inco
mes
aro
und
Dat
e of
Ope
ning
(Rel
ativ
e to
5 Q
uart
ers
Bef
ore
Ope
ning
)
-4 -3 -2 -1 0 1 2 3 4 5 6 7 8Quarters Before and After Foreign Supermarket Opening
-.02
-.01
0.0
1.0
2.0
3
Em
ploy
men
t Pro
pens
ity a
roun
d D
ate
of O
peni
ng(R
elat
ive
to 5
Qua
rter
s B
efor
e O
peni
ng)
-4 -3 -2 -1 0 1 2 3 4 5 6 7 8Quarters Before and After Foreign Supermarket Opening
Notes: Point estimates are based on the quarterly income series of 1,061,578 individuals (left) and the quarterly employment series of 1,208,949 individuals (right) over the period2002-2012. The dots correspond to coefficient estimates from a regression with 2,901,437 observations (left) and 3,820,601 observations (right) in which log monthly incomes oremployment identifiers are regressed on the indicated monthly treatment effects in addition to municipality and quarter fixed effects and and time changing person controls. Thereference category in both graphs are incomes or employment 5 quarters before foreign entry. Both graphs depict 95% confidence intervals based on standard errors that areclustered at the municipality level.
40

Figure 6: Gains from Foreign Retail Entry across the Household Income Distribution
-.02
50
.025
.05
.075
.1.1
25T
otal
Pro
port
iona
l Wel
fare
Gai
n
-1 0 1 2Mean Deviations in Log Income Per Capita (Pesos)
Total Welfare Gains Direct Effect Pro-competitive PricePro-competitive Exit Wage Effect Profit EffectOther Income
Notes: The graph is based on 5,716 households among 171 urban municipalities between 2006-2008 that had notexperienced foreign retail entry at the time of the ENIGH survey.
41

Figure 7: Counterfactual Distribution of the Gains - Setting Ex-Post Foreign Expenditure Sharesto Sample Average
.2.3
.4.5
Exp
endi
ture
Sha
re
-1 0 1 2Mean Deviations in Log Income Per Capita (Pesos)
0.0
25.0
5.0
75.1
.125
Tot
al P
ropo
rtio
nal W
elfa
re G
ain
-1 0 1 2Mean Deviations in Log Income Per Capita (Pesos)
Actual Welfare Gains
Counterfactual Welfare Gains
Notes: The graph is based on 5,716 households among 171 urban municipalities between 2006-2008 that had notexperienced foreign retail entry at the time of the ENIGH survey.
42

Figure 8: Counterfactual Distribution of the Gains - Setting Retail Expenditure Shares to SampleMean
.35
.4.4
5.5
.55
.6E
xpen
ditu
re S
hare
-1 0 1 2Mean Deviations in Log Income Per Capita (Pesos)
0.0
25.0
5.0
75.1
.125
Tot
al P
ropo
rtio
nal W
elfa
re G
ain
-1 0 1 2Mean Deviations in Log Income Per Capita (Pesos)
Actual Welfare Gains
Counterfactual Welfare Gains
Notes: The graph is based on 5,716 households among 171 urban municipalities between 2006-2008 that had notexperienced foreign retail entry at the time of the ENIGH survey.
43

Figure 9: Counterfactual Distribution of the Gains - Setting Food Expenditure Shares to SampleMean
.45
.5.5
5.6
.65
.7E
xpen
ditu
re S
hare
-1 0 1 2Mean Deviations in Log Income Per Capita (Pesos)
0.0
25.0
5.0
75.1
.125
Tot
al P
ropo
rtio
nal W
elfa
re G
ain
-1 0 1 2Mean Deviations in Log Income Per Capita (Pesos)
Actual Welfare Gains
Counterfactual Welfare Gains
Notes: The graph is based on 5,716 households among 171 urban municipalities between 2006-2008 that had notexperienced foreign retail entry at the time of the ENIGH survey.
44

Figure 10: Counterfactual Distribution of the Gains - Setting Retail Income Shares to Sample Mean
0.0
5.1
Inco
me
Sha
re
-1 0 1 2Mean Deviations in Log Income Per Capita (Pesos)
Retail Modern Retail Trad. Retail Self-Employ.
0.0
25.0
5.0
75.1
.125
Tot
al P
ropo
rtio
nal W
elfa
re G
ain
-1 0 1 2Mean Deviations in Log Income Per Capita (Pesos)
Actual Welfare Gains
Counterfactual Welfare Gains
Notes: The graph is based on 5,716 households among 171 urban municipalities between 2006-2008 that had notexperienced foreign retail entry at the time of the ENIGH survey.
45

Tables
Table 1: How Do Foreign Owned Stores Differ Ex Post?
(1) (2) (3) (4)
Dependent Variable: Log Price Log Price Log Number of Barcodes Log Floor Space
Foreign Store Dummy 0.119*** 0.254*** 1.612*** 1.911***(0.00926) (0.0151) (0.0671) (0.0416)
Municipality-By-Year FX Municipality-By-Product-By-Month FX Municipality-By-Barcode-By-Month FX Observations 17,467,996 17,467,996 10,393 11,113R-squared 0.923 0.919 0.139 0.302Number of Municipalities 151 151 151 499
Notes: Columns 1-3 are based the microdata of the Mexican operation of a large international market research company for the years 2011-14. Column 4 is based on theadministrative records of the Mexican National Retail Association (ANTAD) over the period 2002-2007. Regressions are weighted by household weights and expenditureweights across products. Standard errors are clustered at the municipality level and reported in parenthesis below the point estimates. * 10%, ** 5%, *** 1% significance levels.
46

Table 2: Effect on the Prices of Domestic Retailers
(1) (2) (3) (4) (5)Dependent Variable: Log Price Log Price Log Price Log Price Log Price
Foreign Entry - Four Quarters Before -0.00257 -0.00348 -0.00389 -0.00366 -0.00188(0.00594) (0.00471) (0.00457) (0.00441) (0.00517)
Foreign Entry - Three Quarters Before -0.00260 -0.00521 -0.00525 -0.00491 -0.00412(0.00642) (0.00500) (0.00558) (0.00567) (0.00783)
Foreign Entry - Two Quarters Before -0.00354 -0.00374 -0.00333 -0.00300 -0.00334(0.00751) (0.00626) (0.00614) (0.00649) (0.00846)
Foreign Entry - One Quarter Before -0.00523 -0.00401 -0.00275 -0.00322 -0.00417(0.00923) (0.00753) (0.00677) (0.00692) (0.00858)
Foreign Entry - One Quarter After -0.00828 -0.00770 -0.00589 -0.00630 -0.00819(0.00940) (0.00765) (0.00684) (0.00688) (0.00858)
Foreign Entry - Two Quarters After -0.00924 -0.0106 -0.00813 -0.00837 -0.0112(0.00953) (0.00784) (0.00716) (0.00719) (0.00916)
Foreign Entry - Three Quarters After -0.0136 -0.0137 -0.0105 -0.0121 -0.0153*(0.00914) (0.00849) (0.00802) (0.00767) (0.00861)
Foreign Entry - Four Quarters After -0.0156* -0.0147* -0.0106 -0.0126 -0.0167*(0.00909) (0.00876) (0.00835) (0.00815) (0.00954)
Foreign Entry - Five Quarters After -0.0184* -0.0183* -0.0136 -0.0163* -0.0206*(0.0103) (0.00958) (0.00913) (0.00930) (0.0111)
Foreign Entry - Six Quarters After -0.0279** -0.0271** -0.0218** -0.0251** -0.0288**(0.0114) (0.0104) (0.0101) (0.0104) (0.0129)
Foreign Entry - Seven Quarters After -0.0344*** -0.0316*** -0.0256** -0.0291*** -0.0330**(0.0116) (0.0105) (0.0101) (0.0107) (0.0134)
Foreign Entry - Eight Quarters After -0.0340*** -0.0320*** -0.0250** -0.0294*** -0.0337**(0.0109) (0.0103) (0.0102) (0.0112) (0.0139)
P-Value (Eight Quarters=Post Eight Quarters) 0.4262 0.7481 0.3403 0.2086 0.3404Month FX Barcode-By-Municipality FX Barcode-By-Store FX Municipality Time Trends Product-By-Month FX Quarterly Municipality Controls Observations 3,228,544 3,228,544 3,228,544 3,228,544 2,726,484R-squared 0.990 0.996 0.996 0.996 0.996Number of Barcode-By-Store Cells 149,273 149,273 149,273 149,273 134,635Number of Product-By-Month Cells 16,818 16,818 16,818 16,818 15,018Number of Municipality Clusters 76 76 76 76 76
Notes: The dependent variable is log barcode prices. Regressions are based on monthly price observations of 152,223unique barcode-by-store combinations over the period 2002-2014 in 120 product groups and 76 municipalities. ForeignEntry indicates the presence of a foreign supermarket in a municipality. Quarterly municipality controls includeaverage log monthly incomes, employment propensities, log population, and two third order polynomials of averageyears of schooling and average age. Standard errors are clustered at the municipality level and reported in parenthesisbelow the point estimates. * 10%, ** 5%, *** 1% significance levels.
47

Table 3: Effect on the Prices of Domestic Retailers - Heterogeneity
(1) (2) (3) (4)
Dependent Variable: Log Price Log Price Log Price Log Price
Foreign Entry -0.00574 -0.0256** -0.0103 -0.00852
(0.0164) (0.0121) (0.0178) (0.0191)
Foreign Entry X Modern Store -0.0475** -0.0567*** -0.0630**
(0.0213) (0.0190) (0.0253)
Foreign Entry X Food Products 0.000863 0.0240* 0.0148
(0.0186) (0.0136) (0.0215)
Foreign Entry X Modern X Food 0.0173
(0.0315)
Month FX
Barcode-By-Store FX
Product-By-Store Type-By-Month FX
Observations 2,790,780 3,157,767 2,790,780 2,790,780
R-squared 0.996 0.996 0.996 0.996
Number of Barcode-By-Store Cells 123,937 148,479 123,937 123,937
Number of Product-By-Store Type-By-Month Cells 33,516 33,516 33,516 33,516
Number of Municipality Clusters 76 76 76 76
Notes: The dependent variable is log barcode prices. Regressions are based on monthly price observations over the period 2002-2014 in 120 product groups and 76 municipali-ties. Foreign Entry indicates the presence of a foreign supermarket in a municipality. Estimations are based on regressions after excluding an adjustment period of 24 months.Standard errors are clustered at the municipality level and reported in parenthesis below the point estimates. * 10%, ** 5%, *** 1% significance levels.
48

Table 4: Ex-Post Price Differences for Identical Barcodes
(1) (2) (3) (4)Dependent Variable: Log Price Log Price Log Price Log Price
Domestic Store 0.119*** 0.0749***(0.00926) (0.00773)
Domestic Traditional 0.174*** 0.170***(0.00876) (0.0112)
Domestic Modern 0.0411*** 0.0194***(0.0112) (0.00725)
Domestic X Food 0.0500***(0.00930)
Domestic Traditional X Food 0.00492(0.0133)
Domestic Modern X Food 0.0253**(0.00999)
Municipality-By-Barcode-By-Month FX Observations 17,467,996 17,467,996 17,467,996 17,467,996R-squared 0.923 0.923 0.923 0.923Number of Municipalities 151 151 151 151
Notes: The dependent variable is log barcode prices. Regressions are based on the microdata of the Mexican operation of a large international market research company for theyears 2011-14. The reference category in all columns are barcode prices in foreign owned retailers. Regressions are weighed by household weights and expenditure weightsacross products. Standard errors are clustered at the municipality level and reported in parenthesis below the point estimates. * 10%, ** 5%, *** 1% significance levels.
49

Table 5: Effect on Municipality Average Incomes and Employment
(1) (2) (3) (4) (5) (6)
Dependent Variable: Log Monthly Income
Log Monthly Income
Log Monthly Income Employed Employed Employed
Foreign Entry 0.0424*** 0.0341*** -0.0134 0.00150 0.00176 0.00118(0.0121) (0.00990) (0.00824) (0.00184) (0.00182) (0.00186)
Quarter FX Municipality FX Person Controls Municipality Time Trends Observations 4,377,393 4,377,393 4,377,393 5,705,807 5,705,807 5,705,807R-squared 0.084 0.303 0.306 0.005 0.020 0.021Number of Individuals 1,606,213 1,606,213 1,606,213 1,828,567 1,828,567 1,828,567Number of Municipality Clusters 298 299 300 301 302 303
Notes: The dependent variable is log monthly incomes in Columns 1-4 and binary employment indicators in Columns 5-8 across 172 urban municipalities over the period2002-2012. Standard errors are clustered at the municipality level and reported in parenthesis below the point estimates. * 10%, ** 5%, *** 1% significance levels.
50

Table 6: Effect on Incomes - Heterogeneity
(1) (2) (3) (4) (5) (6) (7) (8)
Dependent Variable: Log (Monthly Income)
Log (Monthly Income)
Log (Monthly Income)
Log (Monthly Income) Employed Employed Employed Employed
Foreign Entry X Modern Retail Worker -0.0581*** -0.000169 -0.0280 -0.0284 0.0613*** 0.0364*** -0.00277 0.00123(0.00611) (0.0188) (0.0194) (0.0189) (0.00142) (0.00402) (0.00396) (0.00325)
Foreign Entry X Traditional Retail Worker -0.260*** -0.0337* -0.0493** -0.0499** 0.0734*** 0.0277*** -0.00275 4.58e-05(0.00776) (0.0200) (0.0213) (0.0216) (0.00171) (0.00276) (0.00376) (0.00455)
Foreign Entry X Retail Shop Owner -0.296*** -0.0966*** 0.0153 0.00892 0.0513*** 0.0200*** -0.000988 0.00310(0.0114) (0.0230) (0.0253) (0.0245) (0.00141) (0.00232) (0.00288) (0.00332)
Person Controls Municipality-by-Quarter FX Municipality-by-Group Fixed Effects Group-by-Quarter FX State-by-Group Time Trends Observations 4,222,154 4,222,154 4,222,154 4,222,154 5,500,588 5,500,588 5,500,588 5,500,588R-squared 0.323 0.255 0.256 0.256 0.037 0.028 0.038 0.039Number of Individuals 1,568,257 1,568,257 1,568,257 1,568,257 1,787,095 1,787,095 1,787,095 1,787,095Number of Municipality-by-Quarter Cells 9,184 9,184 9,184 9,184 9,184 9,184 9,184 9,184Number of State-by-Group Time Trends 128 128 128 128 128 128 128 128Number of Municipality Clusters 298 298 298 298 298 298 298 298
Notes: Estimations are based on 172 urban municipalities over the period 2002-2012. We exclude an adjustment period of two years. Standard errors are clustered at themunicipality level and reported in parenthesis below the point estimates. * 10%, ** 5%, *** 1% significance levels.
51

Table 7: Demand Parameter Estimates
(1) (2)
Dependent Variable: Log(Phi) Log(Phi)
OLS IV
Log(Store Price Index) 0.535*** -2.819**
-0.0153 (1.248)
Product-by-Income-by-Municipality-by-Quarter FX
Store-by-Quarter FX
Observations 115,224 104,979
R-squared 0.735
First-Stage F-Statistic 18.940
Notes: The estimates are based on the microdata of the Mexican operation of a large international market research company and the specifications discussed in 6.
52
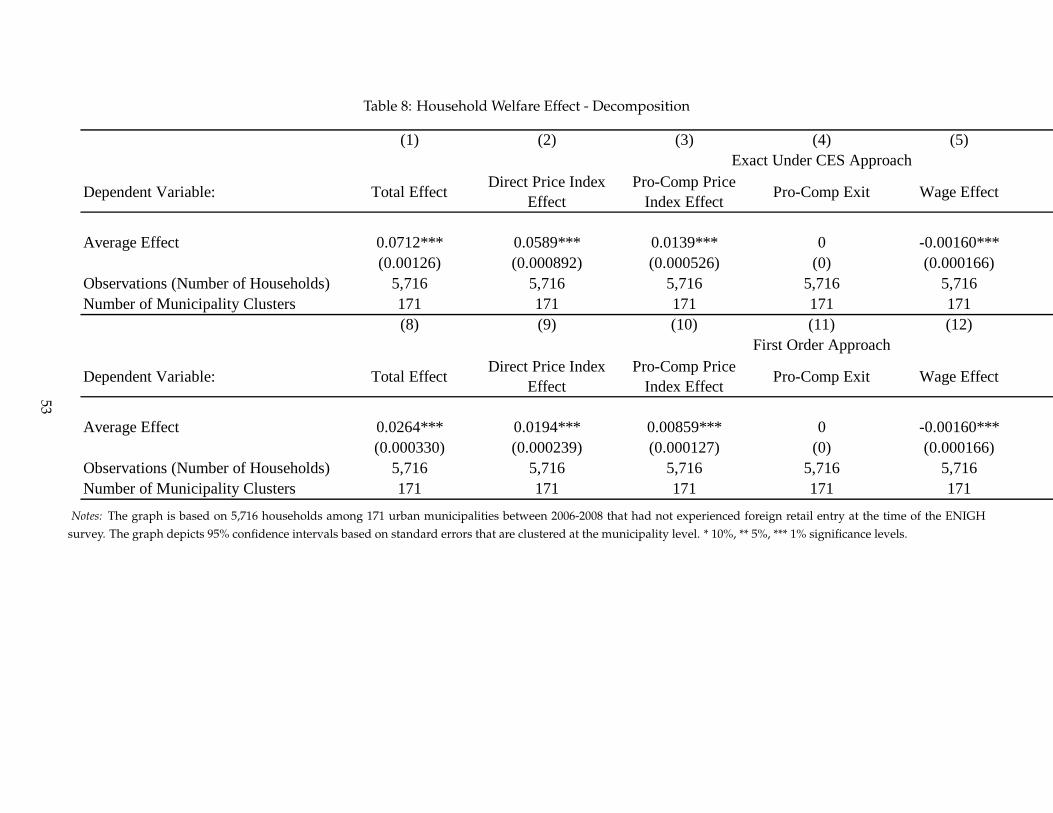
Table 8: Household Welfare Effect - Decomposition
(1) (2) (3) (4) (5) (6) (7)
Dependent Variable: Total Effect Direct Price Index Effect
Pro-Comp Price Index Effect Pro-Comp Exit Wage Effect Profit Effect Other Income Effect
Average Effect 0.0712*** 0.0589*** 0.0139*** 0 -0.00160*** 0 0(0.00126) (0.000892) (0.000526) (0) (0.000166) (0) (0)
Observations (Number of Households) 5,716 5,716 5,716 5,716 5,716 5,716 5,716Number of Municipality Clusters 171 171 171 171 171 171 171
(8) (9) (10) (11) (12) (13) (14)
Dependent Variable: Total Effect Direct Price Index Effect
Pro-Comp Price Index Effect Pro-Comp Exit Wage Effect Profit Effect Other Income Effect
Average Effect 0.0264*** 0.0194*** 0.00859*** 0 -0.00160*** 0 0(0.000330) (0.000239) (0.000127) (0) (0.000166) (0) (0)
Observations (Number of Households) 5,716 5,716 5,716 5,716 5,716 5,716 5,716Number of Municipality Clusters 171 171 171 171 171 171 171
Exact Under CES Approach
First Order Approach
Notes: The graph is based on 5,716 households among 171 urban municipalities between 2006-2008 that had not experienced foreign retail entry at the time of the ENIGHsurvey. The graph depicts 95% confidence intervals based on standard errors that are clustered at the municipality level. * 10%, ** 5%, *** 1% significance levels.
53

Online Appendix - Not for Publication
{Work in progress.]
54