Retail Equity Research Bata India Ltd Accumulate
5
www.geojit.com Retail Equity Research Bata India Ltd FMCG BSE CODE : 500043 NSE CODE: BATAINDIA BLOOMBERG CODE: BATA:IN SENSEX : 29,916 Accumulate 12M Investment Period Rating as per Mid Cap CMP Rs1,250 TARGET Rs1,400 RETURN 12% (Closing: 20-03-20) 20 th March, 2020 COMPANY UPDATE Covid-19 impact volumes…valuation at 10Yr average Bata India Ltd (BIL) is the largest retailer and leading manufacturer of footwear in India with ~1400 retail stores as on Dec 2019. We revise our Target to Rs.1,400 (earlier Rs1,850) factoring the demand weakness due to COVID-19 epidemic, but upgrade to Accu- mulate rating considering the recent sharp fall in stock price. Q3FY20 revenue growth moderates to 6.5%YoY, while PAT growth was healthy at 14%YoY. EBITDA margin (ex Ind-AS 116 impact) improved by 30bps YoY to 21.3% due to expansion in gross margin which improved 210bps on account of improving premium mix and reduction in RM cost. BIL’s cost reduction initiatives continue to give results as EBITDA margin improves consistently and has reached all time high of 21.3%. Rent expense as % of sales improved by 70bps YoY. BIL’s strong focus to increase footfalls along with acceleration in store additions via franchisee will support revenue growth. We have cut down our volume estimates to factor the impact on Corona virus spread. Expect BIL’s revenue/earnings to grow at 9%/15% CAGR over FY20-22E . BIL’s strong focus on cost control measures will support earnings growth. Currently, BIL is trading at 38x 1Yr Fwd P/E. We value BIL at 37x (10Yr Avg) on FY22 EPS, upgrade to Accumulate. Company Data Market Cap (cr) Rs.16,065 Enterprise Value (cr) Rs.15,810 Outstanding Shares (cr) 12.9 Free Float 47% Dividend Yield 0.5% 52 week high Rs.1,897 52 week low Rs.1,017 6m average volume (cr) 0.1 Beta 1.09 Face value Rs5 Shareholding (%) Q1FY20 Q2FY20 Q3FY20 Promoters 53.0 53.0 53.0 FII’s 12.3 11.3 11.1 MFs/Insti 20.4 21.7 21.3 Public 11.7 11.3 11.8 Others 2.63 2.74 2.8 Total 100.0 100.0 100.0 Promoter pledge NIL NIL NIL Price Performance 3 month 6 Month 1 Year Absolute Return -26.2% -23.1% -7.5% Absolute Sensex -28.2% -21.3% -22.1% Relative Return* 2.1% -1.8% 14.6% over or under performance to benchmark index Standalone (cr) FY20E FY21E FY22E Sales 3,127 3,314 3,727 Growth (%) 6.8 6.0 12.5 EBITDA 534 577 658 EBITDA Margin(%) 17.1 17.4 17.7 PAT Adj. 368 429 489 Growth (%) 11.5 16.7 13.9 Adj.EPS 28.6 33.4 38.0 Growth (%) 11.5 16.7 13.9 P/E 43.7 37.4 32.9 P/B 7.8 6.6 5.6 EV/EBITDA 28.5 25.8 22.2 ROE (%) 19.3 19.1 18.4 D/E 0.0 0.0 0.0 Vincent Andrews Research Analyst KEY CHANGES: TARGET RATING EARNINGS Healthy revenue growth… Q3FY20 revenue growth was healthy at 7%YoY amid industry slow down. BIL’s continuous investment in areas of product-innovation, store renovation, cus- tomer experience and marketing campaigns over the past few years supported steady growth. BIL’s strong focus on improving footfalls along with higher ad spend and scaling-up of premium products in the revenue mix will continue to support revenue growth. The company strengthened its channel focus by rolling out Omni-channel home delivery offerings in more than 60% of ts stores result- ing into improved conversions. “Stay Camera Ready’ with new collections every Friday was the new campaign rolled out during the quarter to attract customers. BIL expects to add ~100 new stores in FY20 and also plans to open ~500 fran- chisee stores over 5 years. In FY19, the company has added 71 new stores, 51 franchisee stores and has renovated 47 outlets. We expect BIL’s strong focus on improving footfalls along with store additions will improve revenue growth. The company is aggressively increasing the ad- spend also (2.25% of sales in FY19 Vs 1.5% in FY18). Expect revenue to grow at 11%CAGR over FY20-22E. Strong operating performance continues... BIL reported healthy growth in earnings at 16%YoY supported by 30bps im- provement in EBITDA margins (ex Ind-AS 116 impact). EBITDA margin im- provement was largely due to expansion in gross margins (220bpsYoY) partially offset by increase in staff cost. BIL has been on the path of premiumisation by adopting technologies like memory cusion & insolia and with several new launches such as Hush Puppies, Naturalizer, European collection etc, resulted in improved average selling price. Moreover the company’s cost control measures is also giving results. Rent as a % of sales has declined by 70bps YoY in Q3FY20 (+80bps YoY in FY19). Store additions via franchisee will continue to control fixed costs. We expect ~18% CAGR in earnings over FY20-22E. Covid-19 impact volumes…valuation at 10Yr average The slowdown in economic activities due to spread of Corona virus is likely to impact demand while disruption in supply chain will affect sourcing & distribu- tion. We have cut down our volume estimates to factor the impact. However, the sharp decline in crude will benefit the industry with reduction in costs. BIL’s strong focus on increasing footfalls through improving customer experience and higher advertisement expenditure along with accelerated store additions will boost revenue growth. Currently, BIL is trading at 38x 1yr Fwd P/E. We value BIL at 37x (10Yr Avg) to arrive at a new Target of Rs1,400 (earlier Rs1,850), and upgrade to Accumulate rating.
Transcript of Retail Equity Research Bata India Ltd Accumulate
www.geojit.com
Retail Equity Research
Bata India Ltd FMCG
BSE CODE : 500043 NSE CODE: BATAINDIA
BLOOMBERG CODE: BATA:IN SENSEX : 29,916
Accumulate
12M Investment Period Rating as per Mid Cap
CMP Rs1,250 TARGET Rs1,400 RETURN 12%
(Closing: 20-03-20)
20th March, 2020
COMPANY UPDATE
Covid-19 impact volumes…valuation at 10Yr average Bata India Ltd (BIL) is the largest retailer and leading manufacturer of footwear in India with ~1400 retail stores as on Dec 2019.
We revise our Target to Rs.1,400 (earlier Rs1,850) factoring the demand weakness due to COVID-19 epidemic, but upgrade to Accu-mulate rating considering the recent sharp fall in stock price.
Q3FY20 revenue growth moderates to 6.5%YoY, while PAT growth was healthy at 14%YoY.
EBITDA margin (ex Ind-AS 116 impact) improved by 30bps YoY to 21.3% due to expansion in gross margin which improved 210bps on account of improving premium mix and reduction in RM cost.
BIL’s cost reduction initiatives continue to give results as EBITDA margin improves consistently and has reached all time high of 21.3%. Rent expense as % of sales improved by 70bps YoY.
BIL’s strong focus to increase footfalls along with acceleration in store additions via franchisee will support revenue growth.
We have cut down our volume estimates to factor the impact on Corona virus spread. Expect BIL’s revenue/earnings to grow at 9%/15% CAGR over FY20-22E .
BIL’s strong focus on cost control measures will support earnings growth. Currently, BIL is trading at 38x 1Yr Fwd P/E. We value BIL at 37x (10Yr Avg) on FY22 EPS, upgrade to Accumulate.
Company Data
Market Cap (cr) Rs.16,065
Enterprise Value (cr) Rs.15,810 Outstanding Shares (cr) 12.9
Free Float 47%
Dividend Yield 0.5% 52 week high Rs.1,897 52 week low Rs.1,017
6m average volume (cr) 0.1
Beta 1.09
Face value Rs5
Shareholding (%) Q1FY20 Q2FY20 Q3FY20
Promoters 53.0 53.0 53.0
FII’s 12.3 11.3 11.1
MFs/Insti 20.4 21.7 21.3
Public 11.7 11.3 11.8
Others 2.63 2.74 2.8
Total 100.0 100.0 100.0
Promoter pledge NIL NIL NIL
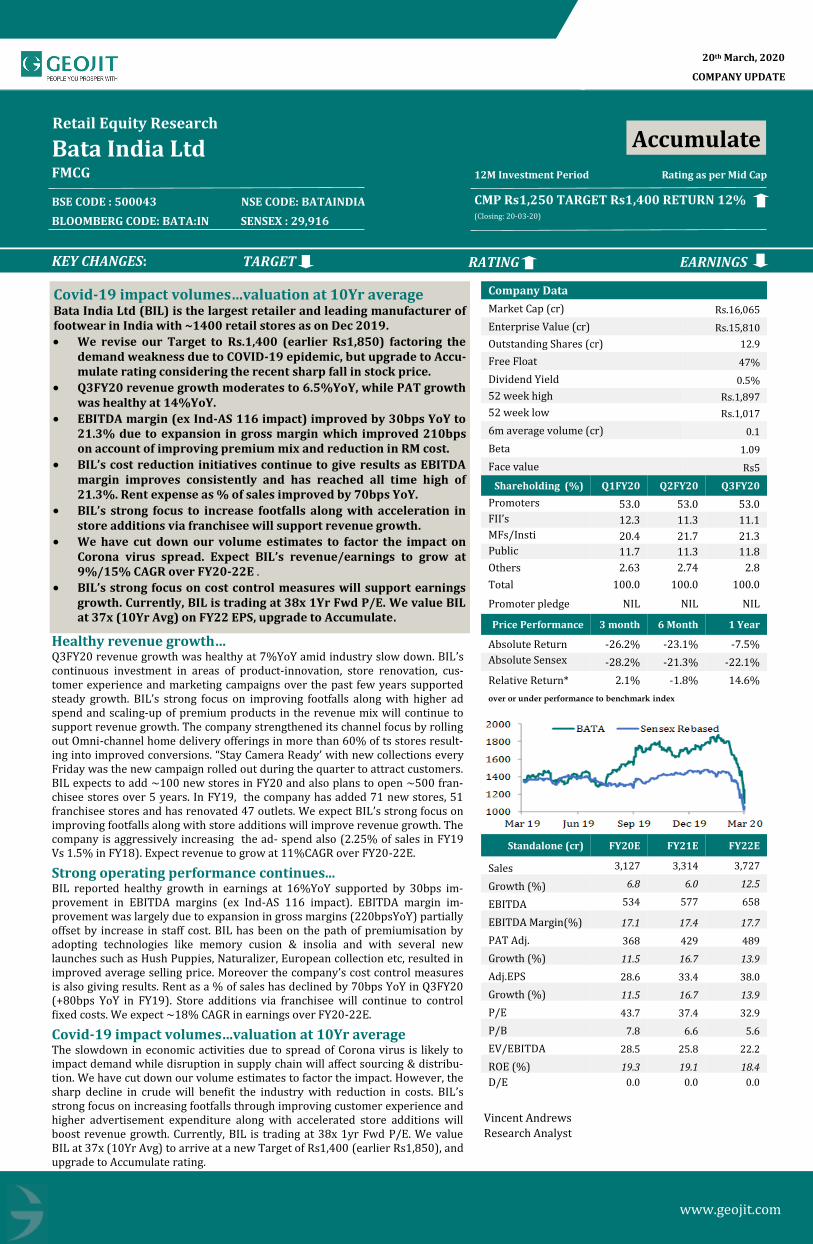
Price Performance 3 month 6 Month 1 Year
Absolute Return -26.2% -23.1% -7.5%
Absolute Sensex -28.2% -21.3% -22.1%
Relative Return* 2.1% -1.8% 14.6%
over or under performance to benchmark index
Standalone (cr) FY20E FY21E FY22E
Sales 3,127 3,314 3,727
Growth (%) 6.8 6.0 12.5
EBITDA 534 577 658
EBITDA Margin(%) 17.1 17.4 17.7
PAT Adj. 368 429 489
Growth (%) 11.5 16.7 13.9
Adj.EPS 28.6 33.4 38.0
Growth (%) 11.5 16.7 13.9
P/E 43.7 37.4 32.9
P/B 7.8 6.6 5.6
EV/EBITDA 28.5 25.8 22.2
ROE (%) 19.3 19.1 18.4 D/E 0.0 0.0 0.0
Vincent Andrews
Research Analyst
KEY CHANGES: TARGET RATING EARNINGS
Healthy revenue growth… Q3FY20 revenue growth was healthy at 7%YoY amid industry slow down. BIL’s continuous investment in areas of product-innovation, store renovation, cus-tomer experience and marketing campaigns over the past few years supported steady growth. BIL’s strong focus on improving footfalls along with higher ad spend and scaling-up of premium products in the revenue mix will continue to support revenue growth. The company strengthened its channel focus by rolling out Omni-channel home delivery offerings in more than 60% of ts stores result-ing into improved conversions. “Stay Camera Ready’ with new collections every Friday was the new campaign rolled out during the quarter to attract customers. BIL expects to add ~100 new stores in FY20 and also plans to open ~500 fran-chisee stores over 5 years. In FY19, the company has added 71 new stores, 51 franchisee stores and has renovated 47 outlets. We expect BIL’s strong focus on improving footfalls along with store additions will improve revenue growth. The company is aggressively increasing the ad- spend also (2.25% of sales in FY19 Vs 1.5% in FY18). Expect revenue to grow at 11%CAGR over FY20-22E.
Strong operating performance continues... BIL reported healthy growth in earnings at 16%YoY supported by 30bps im-provement in EBITDA margins (ex Ind-AS 116 impact). EBITDA margin im-provement was largely due to expansion in gross margins (220bpsYoY) partially offset by increase in staff cost. BIL has been on the path of premiumisation by adopting technologies like memory cusion & insolia and with several new launches such as Hush Puppies, Naturalizer, European collection etc, resulted in improved average selling price. Moreover the company’s cost control measures is also giving results. Rent as a % of sales has declined by 70bps YoY in Q3FY20 (+80bps YoY in FY19). Store additions via franchisee will continue to control fixed costs. We expect ~18% CAGR in earnings over FY20-22E.
Covid-19 impact volumes…valuation at 10Yr average The slowdown in economic activities due to spread of Corona virus is likely to impact demand while disruption in supply chain will affect sourcing & distribu-tion. We have cut down our volume estimates to factor the impact. However, the sharp decline in crude will benefit the industry with reduction in costs. BIL’s strong focus on increasing footfalls through improving customer experience and higher advertisement expenditure along with accelerated store additions will boost revenue growth. Currently, BIL is trading at 38x 1yr Fwd P/E. We value BIL at 37x (10Yr Avg) to arrive at a new Target of Rs1,400 (earlier Rs1,850), and upgrade to Accumulate rating.

www.geojit.com
Quarterly Financials (Standalone)
Profit & Loss
Change in Estimates
Old estimates New estimates Change %
Year / Rs cr FY20E FY21E FY20E FY21E FY20E FY21E
Revenue 3,216 3,577 3,127 3,314 -2.8% -7.4%
EBITDA 880 989 534 577 -39.3% -41.6%
Margins (%) 27.4% 27.6% 17.1% 17.4% 1070bps 1030bps
Adj. PAT 396 498 368 429 -7.2% -13.8%
EPS 30.8 38.7 28.6 33.4 -7.1% -13.7%
Rs cr) Q3FY20 Q3FY19
YoY
Growth % Q2FY19
QoQ
Growth % 9MFY20 9MFY19
YoY
Growth %
Sales 829.6 778.7 6.5% 722.0 15% 2433.7 2249.0 8.2%
EBITDA 177.0 163.6 8% 97.8 81% 433.1 382.7 13%
EBITDA margins 21.3% 21.0% 30bps 13.5% 780bps 17.8% 17.0% 1,140bps
Depreciation 16.0 17.0 -6% 17.6 -9% 49.4 47.4 4%
EBIT 161.0 146.6 10% 80.2 101% 383.7 335.3 14%
Interest 0.5 0.9 -47% 0.8 -42% 2.1 3.0 -27%
Other Income 17.1 13.7 24% 17.7 -4% 51.7 40.6 27%
Exceptional Items 0.0 0.0 NA 0.0 NA 0.0 0.0 NA
PBT 177.6 159.4 11% 97.1 83% 433.3 373.0 16%
Tax 58.2 56.2 4% 26.0 124% 140.1 131.7 6%
Reported PAT 119.4 103.2 16% 71.1 68% 293.2 241.3 21%
Adjustments 0.0 0.0 NA 0.0 NA 0.0 0.0 NA
Adj PAT 119.4 103.2 16% 71.1 68% 293.2 241.3 21%
No. of Shares 12.9 12.9 0% 12.9 0% 12.9 12.9 0%
EPS (Rs) 9.3 8.0 16% 5.5 68% 22.8 18.8 21%

www.geojit.com
27th December 2018
Standalone Financials
PROFIT & LOSS BALANCE SHEET
RATIOS CASH FLOW
Y.E March (Rs Cr) FY18A FY19E FY20E FY21E FY22E
Sales 2629 2928 3127 3314 3727
% change 6.6 11.4 6.8 6.0 12.5
EBITDA 354 477 534 577 658
% change 27.4 34.9 12.0 8.1 14.0
Depreciation 60 64 70 71 81
EBIT 293 413 465 506 577
Interest 4 4 3 2 2
Other Income 51 69 72 76 86
PBT 340 478 534 580 660
% change 45.5 40.6 11.6 8.6 13.9
Tax 116 149 166 151 172
Tax Rate (%) 34% 31% 31% 26% 26%
Reported PAT 224 330 368 429 489
Adj.* 0 0 0 0 0
Adj. PAT 224 330 368 429 489
% change 23.9 47.4 11.5 16.7 13.9
No. of shares (cr) 13 13 13 13 13
Adj EPS (Rs) 17.4 25.6 28.6 33.4 38.0
% change 23.9 47.4 11.5 16.7 13.9
DPS (Rs) 4.1 4.1 4.1 4.1 4.1
Y.E March (Rs Cr) FY18A FY19E FY20E FY21E FY22E
Net inc. + Depn. 284 394 437 500 570
Non-cash adj. -1 -1 -32 -2 -3
Changes in W.C -54 37 -243 -24 -61
C.F. Operation 229 430 162 474 506
Capital exp. -71 -87 -88 -100 -100
Change in inv. 0 0 0 0 0
Other invest.CF -16 -25 -15 -15 -34
C.F - Investment -87 -112 -102 -115 -134
Issue of equity 0 0 0 0 0
Issue/repay debt 0 0 0 0 0
Dividends paid -52 -52 -52 -52 -52
Other finance.CF -4 -4 -3 -2 -2
C.F - Finance -75 -68 -55 -55 -54
Chg. in cash 68 250 5 304 318
Closing cash 589 839 844 1148 1466
Y.E March FY18A FY19E FY20E FY21E FY22E
Profitab & Return
EBITDA margin (%) 13.5 16.3 17.1 17.4 17.7
EBIT margin (%) 11.2 14.1 14.9 15.3 15.5
Net profit mgn.(%) 8.5 11.3 11.8 12.9 13.1
ROE (%) 15.9 20.4 19.3 19.1 18.4
ROCE (%) 10.3% 13.0% 13.3% 13.9% 13.4%
W.C & Liquidity Receivables (days) 10.8 9.6 9.3 10.7 10.4
Inventory (days) 224.0 227.5 232.0 228.2 221.9
Payables (days) 187.5 186.7 162.6 135.9 132.2
Current ratio (x) 2.6 2.8 3.9 4.3 4.6
Quick ratio (x) 1.1 1.3 1.8 2.3 2.6
Turnover &Leverage Gross asset T.O (x) 5.9 5.5 5.1 4.7 4.6
Total asset T.O (x) 1.3 1.3 1.2 1.2 1.1
Int. covge. ratio (x) 69.9 116.5 162.4 214.3 266.9
Adj. debt/equity (x) 0.0 0.0 0.0 0.0 0.0
Valuation EV/Sales (x) 5.9 5.2 4.9 4.5 3.9
EV/EBITDA (x) 43.7 31.9 28.5 25.8 22.2
P/E (x) 71.9 48.7 43.7 37.4 32.9
P/BV (x) 10.9 9.2 7.8 6.6 5.6
Y.E March (Rs Cr) FY18A FY19E FY20E FY21E FY22E
Cash 589 839 844 1148 1466
Accounts Receivable 89 65 94 100 112
Inventories 762 839 861 914 1029
Other Cur. Assets 289 289 300 322 362
Investments 5 5 5 5 5
Gross Fixed Assets 491 573 663 763 863
Net Fixed Assets 293 311 331 360 379
CWIP 12 17 15 15 15
Intangible Assets 2 4 4 4 4
Def. Tax (Net) 105 110 145 149 155
Other Assets 0 0 0 0 0
Total Assets 2145 2479 2599 3018 3527
Current Liabilities 636 678 513 544 613
Provisions 30 54 24 34 39
Debt Funds 0 0 0 0 0
Other Liabilities 0 0 0 0 0
Equity Capital 64 64 64 64 64
Reserves & Surplus 1414 1682 1997 2374 2810
Shareholder’s Fund 1479 1747 2062 2438 2874
Total Liabilities 2145 2479 2599 3018 3527
BVPS 115 136 160 190 224

www.geojit.com
Source: Bloomberg, Geojit Research.
27th December 2018
Dates Rating Target 8th March 2016 Accumulate 556
06th June 2016 Accumulate 619
10th August 2016 Reduce 516
30th November 2016 Hold 432
14th February 2017 Buy 584
05th August 2017 Hold 665
28th November 2017 Hold 768
06th March 2018 Hold 772
28th May 2018 Buy 900
23rd July 2018 Hold 900
05th November 2018 Hold 1,068
20th February 2019 Accumulate 1,404
03rd June 2019 Hold 1,390
19th November 2019 Hold 1,850
20th March 2019 Accumulate 1,400
General Disclosures and Disclaimers
CERTIFICATION
We, Vincent K A and Vinod Nair, authors of this Report, hereby certify that all the views expressed in this research report reflect our personal views about any or all of the
subject issuer or securities. This report has been prepared by the Research Team of Geojit Financial Services Limited, hereinafter referred to as Geojit.
COMPANY OVERVIEW
Geojit Financial Services Limited (hereinafter Geojit), a publically listed company, is engaged in services of retail broking, depository services, portfolio management and
marketing investment products including mutual funds, insurance and properties. Geojit is a SEBI registered Research Entity and as such prepares and shares research data and
reports periodically with clients, investors, stake holders and general public in compliance with Securities and Exchange Board of India Act, 1992, Securities And Exchange
Board Of India (Research Analysts) Regulations, 2014 and/or any other applicable directives, instructions or guidelines issued by the Regulators from time to time.
DISTRIBUTION OF REPORTS
This document is not for public distribution and has been furnished to you solely for your information and must not be reproduced or redistributed to any other person. Geojit
will not treat the recipients of this report as clients by virtue of their receiving this report.
GENERAL REPRESENTATION
The research reports do not constitute an offer or solicitation for the purchase or sale of any financial instruments, inducements, promise, guarantee, warranty, or as an official
confirmation of any transaction or contractual obligations of any kind. This report is provided for assistance only and is not intended to be and must not alone be taken as the
basis for an investment decision. The information contained herein is from publicly available data or other sources believed to be reliable, but we do not represent that it is
accurate or complete and it should not be relied on as such. We have also reviewed the research report for any untrue statements of material facts or any false or misleading
information. While we endeavor to update on a reasonable basis the information discussed in this material, there may be regulatory, compliance, or other reasons that prevent
us from doing so.
RISK DISCLOSURE
Geojit and/or its Affiliates and its officers, directors and employees including the analyst/authors shall not be in any way be responsible for any loss or damage that may arise
to any person from any inadvertent error in the information contained in this report. Investors may lose his/her entire investment under certain market conditions so before
acting on any advice or recommendation in these material, investors should consider whether it is suitable for their particular circumstances and, if necessary, seek professional
advice. This report does not take into account the specific investment objectives, financial situation/circumstances and the particular needs of any specific person who may
receive this document. The user assumes the entire risk of any use made of this information. Each recipient of this report should make such investigation as it deems necessary
to arrive at an independent evaluation of an investment in the securities of companies referred to in this report (including the merits and risks involved). The price, volume and
income of the investments referred to in this report may fluctuate and investors may realize losses that may exceed their original capital.
FUNDAMENTAL DISCLAIMER
We have prepared this report based on information believed to be reliable. The recommendations herein are based on 12 month horizon, unless otherwise specified. The invest-
ment ratings are on absolute positive/negative return basis. It is possible that due to volatile price fluctuation in the near to medium term, there could be a temporary mismatch
to rating. For reasons of valuations/return/lack of clarity/event we may revisit rating at appropriate time. The stocks always carry the risk of being upgraded to buy or down-
graded to a hold, reduce or sell. The opinions expressed are subject to change but we have no obligation to tell our clients when our opinions or recommendations change. This
report is non-inclusive and does not consider all the information that the recipients may consider material to investments. This report is issued by Geojit without any liability/
undertaking/commitment on the part of itself or anyof its entities. We may have issued or may issue on the companies covered herein, reports, recommendations or information
which is contrary to those contained in this report.
Definition:
Buy: Acquire at Current Market Price (CMP), with the target mentioned in the research note.
Accumulate: Partial buying or to accumulate as CMP dips in the future.
Hold: Hold the stock with the expected target mentioned in the note.
Reduce: Reduce your exposure to the stock due to limited upside.
Sell: Exit from the stock.
Not rated : The analyst has no investment opinion on the stock.
Investment Criteria Ratings Large caps Midcaps Small caps
Buy Upside is above 10% Upside is above 15% Upside is above 20%
Accumulate - Upside is between 10% - 15% Upside is between 10% - 20%
Hold Upside is between 0% - 10% Upside is between 0% - 10% Upside is between 0% - 10%
Reduce/sell Downside is more than 0% Downside is more than 0% Downside is more than 0%
Not rated -
To satisfy regulatory requirements, we attribute ‘Accumulate’ as Buy and ‘Reduce’ as Sell.
The recommendations are based on 12 month horizon, unless otherwise specified. The investment ratings are on absolute positive/negative return basis. It
is possible that due to volatile price fluctuation in the near to medium term, there could be a temporary mismatch to rating. For reasons of valuations/
return/lack of clarity/event we may revisit rating at appropriate time. Please note that the stock always carries the risk of being upgraded to BUY or down-
graded to a HOLD, REDUCE or SELL.
Neutral- The analyst has no investment opinion on the stock under review
Recommendation summary

www.geojit.com
27th December 2018
The projections and forecasts described in this report should be evaluated keeping in mind the fact that these are based on estimates and assumptions and will vary from actual
results over a period of time. The actual performance of the companies represented in the report may vary from those projected. These are not scientifically proven to guarantee
certain intended results and hence, are not published as a warranty and do not carry any evidentiary value whatsoever. These are not to be relied on in or as contractual, legal or
tax advice. Prospective investors and others are cautioned that any forward-looking statements are not predictions and may be subject to change without notice.
JURISDICTION
The securities described herein may not be eligible for sale in all jurisdictions or to all categories of investors. The countries in which the companies mentioned in this report are
organized may have restrictions on investments, voting rights or dealings in securities by nationals of other countries. Distributing/taking/sending/dispatching/transmitting this
document in certain foreign jurisdictions may be restricted by law, and persons into whose possession this document comes should inform themselves about, and observe any
such restrictions. Failure to comply with this restriction may constitute a violation of any foreign jurisdiction laws. Foreign currencies denominated securities are subject to
fluctuations in exchange rates that could have an adverse effect on the value or price of or income derived from the investment. Investors in securities such as ADRs, the value
of which are influenced by foreign currencies effectively assume currency risk.
REGULATORY DISCLOSURES:
Geojit’s Associates consists of privately held companies such as Geojit Technologies Private Limited (GTPL- Software Solutions provider), Geojit Credits Pri-vate Limited (GCPL- NBFC Services provider), Geojit Investment Services Limited (GISL- Corporate Agent for Insurance products), Geojit Financial Manage-ment Services Private Limited (GFMSL) &Geojit Financial Distribution Private Limited (GFDPL), (Distributors of Insurance and MF Units).In the context of the SEBI Regulations on Research Analysts (2014), Geojit affirms that we are a SEBI registered Research Entity and in the course of our business as a stock market intermediary, we issue research reports /research analysis etc that are prepared by our Research Analysts. We also affirm and undertake that no disciplinary action has been taken against us or our Analysts in connection with our business activities.
In compliance with the above mentioned SEBI Regulations, the following additional disclosures are also provided which may be considered by the reader be-fore making an investment decision:
1. Disclosures regarding Ownership*:
Geojit confirms that: It/its associates have no financial interest or any other material conflict in relation to the subject company (ies) covered herein. It/its associates have no actual beneficial ownership greater than 1% in relation to the subject company (ies) covered herein.
Further, the Analyst confirms that: he, his associates and his relatives have no financial interest in the subject company (ies) covered herein, and they have no other material conflict in the subject
company. he, his associates and his relatives have no actual/beneficial ownership greater than 1% in the subject company covered
2. Disclosures regarding Compensation:
During the past 12 months, Geojit or its Associates:
(a) Have not received any compensation from the subject company; (b) Have not managed or co-managed public offering of securities for the subject company (c) Have not received any compensation for investment banking or merchant banking or brokerage services from the subject company. (d) Have not received any compensation for products or services other than investment banking or merchant banking or brokerage services from the subject company (e) Have not received any compensation or other benefits from the subject company or third party in connection with the research report (f) The subject company is / was not a client during twelve months preceding the date of distribution of the research report.
3. Disclosure by Geojit regarding the compensation paid to its Research Analyst:
Geojit hereby confirms that no part of the compensation paid to the persons employed by it as Research Analysts is based on any specific brokerage services or transactions pertaining to trading in securities of companies contained in the Research Reports.
4. Disclosure regarding the Research Analyst’s connection with the subject company:
It is affirmed that we, Vincent K A and Vinod Nair, Research Analysts of Geojit have not served as an officer, director or employee of the subject company
5. Disclosure regarding Market Making activity:
Neither Geojit/its Analysts have engaged in market making activities for the subject company.
Please ensure that you have read the “Risk Disclosure Documents for Capital Market and Derivatives Segments” as prescribed by the Securities and Exchange Board of India
before investing.
Geojit Financial Services Ltd. (formerly known as Geojit BNP Paribas Financial Services Ltd.), Registered Office: 34/659-P, Civil Line Road, Padivattom, Kochi-682024,
Kerala, India. Phone: +91 484-2901000, Website: www.geojit.com. For investor queries: [email protected], For grievances: [email protected], For compliance
officer: [email protected].
Corporate Identity Number: L67120KL1994PLC008403, SEBI Stock Broker Registration No INZ000104737, Research Entity SEBI Reg No: INH200000345, Investment
Adviser SEBI Reg No: INA200002817, Portfolio Manager: INP000003203, Depository Participant: IN-DP-325-2017, ARN Regn.Nos:0098, IRDA Corporate Agent
(Composite) No.: CA0226