
Power 2.2kW / 3.0HP Discharge DIN DN40 PN10 Weight (Excl ...

1
Wharf Real Estate Investment Company Limited
2017 Final Results
5 March 2018
Retail Drives IP Cashflow

Overview
2
6 Unique Properties at Prime Locations
Diamond Hill
Causeway Bay
Tsimshatsui
Central
Harbour
City
Central Portfolio
Crawford
House
Times
Square
97%
2017 Group Business Assets
Plaza
Hollywood
Wheelock
House
The
Murray

Overview
3
*Incl. 3 Marco Polo Hotels & The Murray’s Valuation; but All Hotels are Booked at Cost in Wharf REIC’s Balance Sheet
^999-yr Leasehold (Excl. Ocean Terminal & Pacific Club at Harbour City, Plaza Hollywood and The Murray)
Highlights
End-17 Valuation*
$265B +4%
2017 Sales
+9.1% (2H17:+15%)
(10-yr CAGR: +10.2%)
2017 Avg. Sales psf/mth
~$2,300 +5.4%
2017 Revenue
$14.6B +4%
2017 Market Share
9.2% (2H17: 9.8%)
2017 Retail Sales
$41B +7%
Rare 999-year Leases Offer a Differentiation^
HKIP & Hotel Harbour City Retail 3 Malls

Overview
4
The Above Refers to the 6 Key Properties in Hong Kong
*Incl. 3 Marco Polo Hotels & The Murray’s Valuation; but All Hotels are Booked at Cost in Wharf REIC’s Balance Sheet
Central Portfolio: Incl. Crawford House, Wheelock House & The Murray
Premium Quality Portfolio
Revenue
2017 Revenue
$14.6B
Harbour City
73.6%
Times Square
19.3%
Plaza Hollywood
3.9% Central Portfolio
3.2%
GFA
HKIP & Hotel
GFA
11.7M s.f
Harbour City
72.0%
Times Square
16.9%
Plaza Hollywood
4.8% Central Portfolio
6.3%
Valuation*
Valuation
$265B
Harbour City
67.2%
Times Square
21.5%
Plaza Hollywood
3.8% Central Portfolio
7.5%
Overview
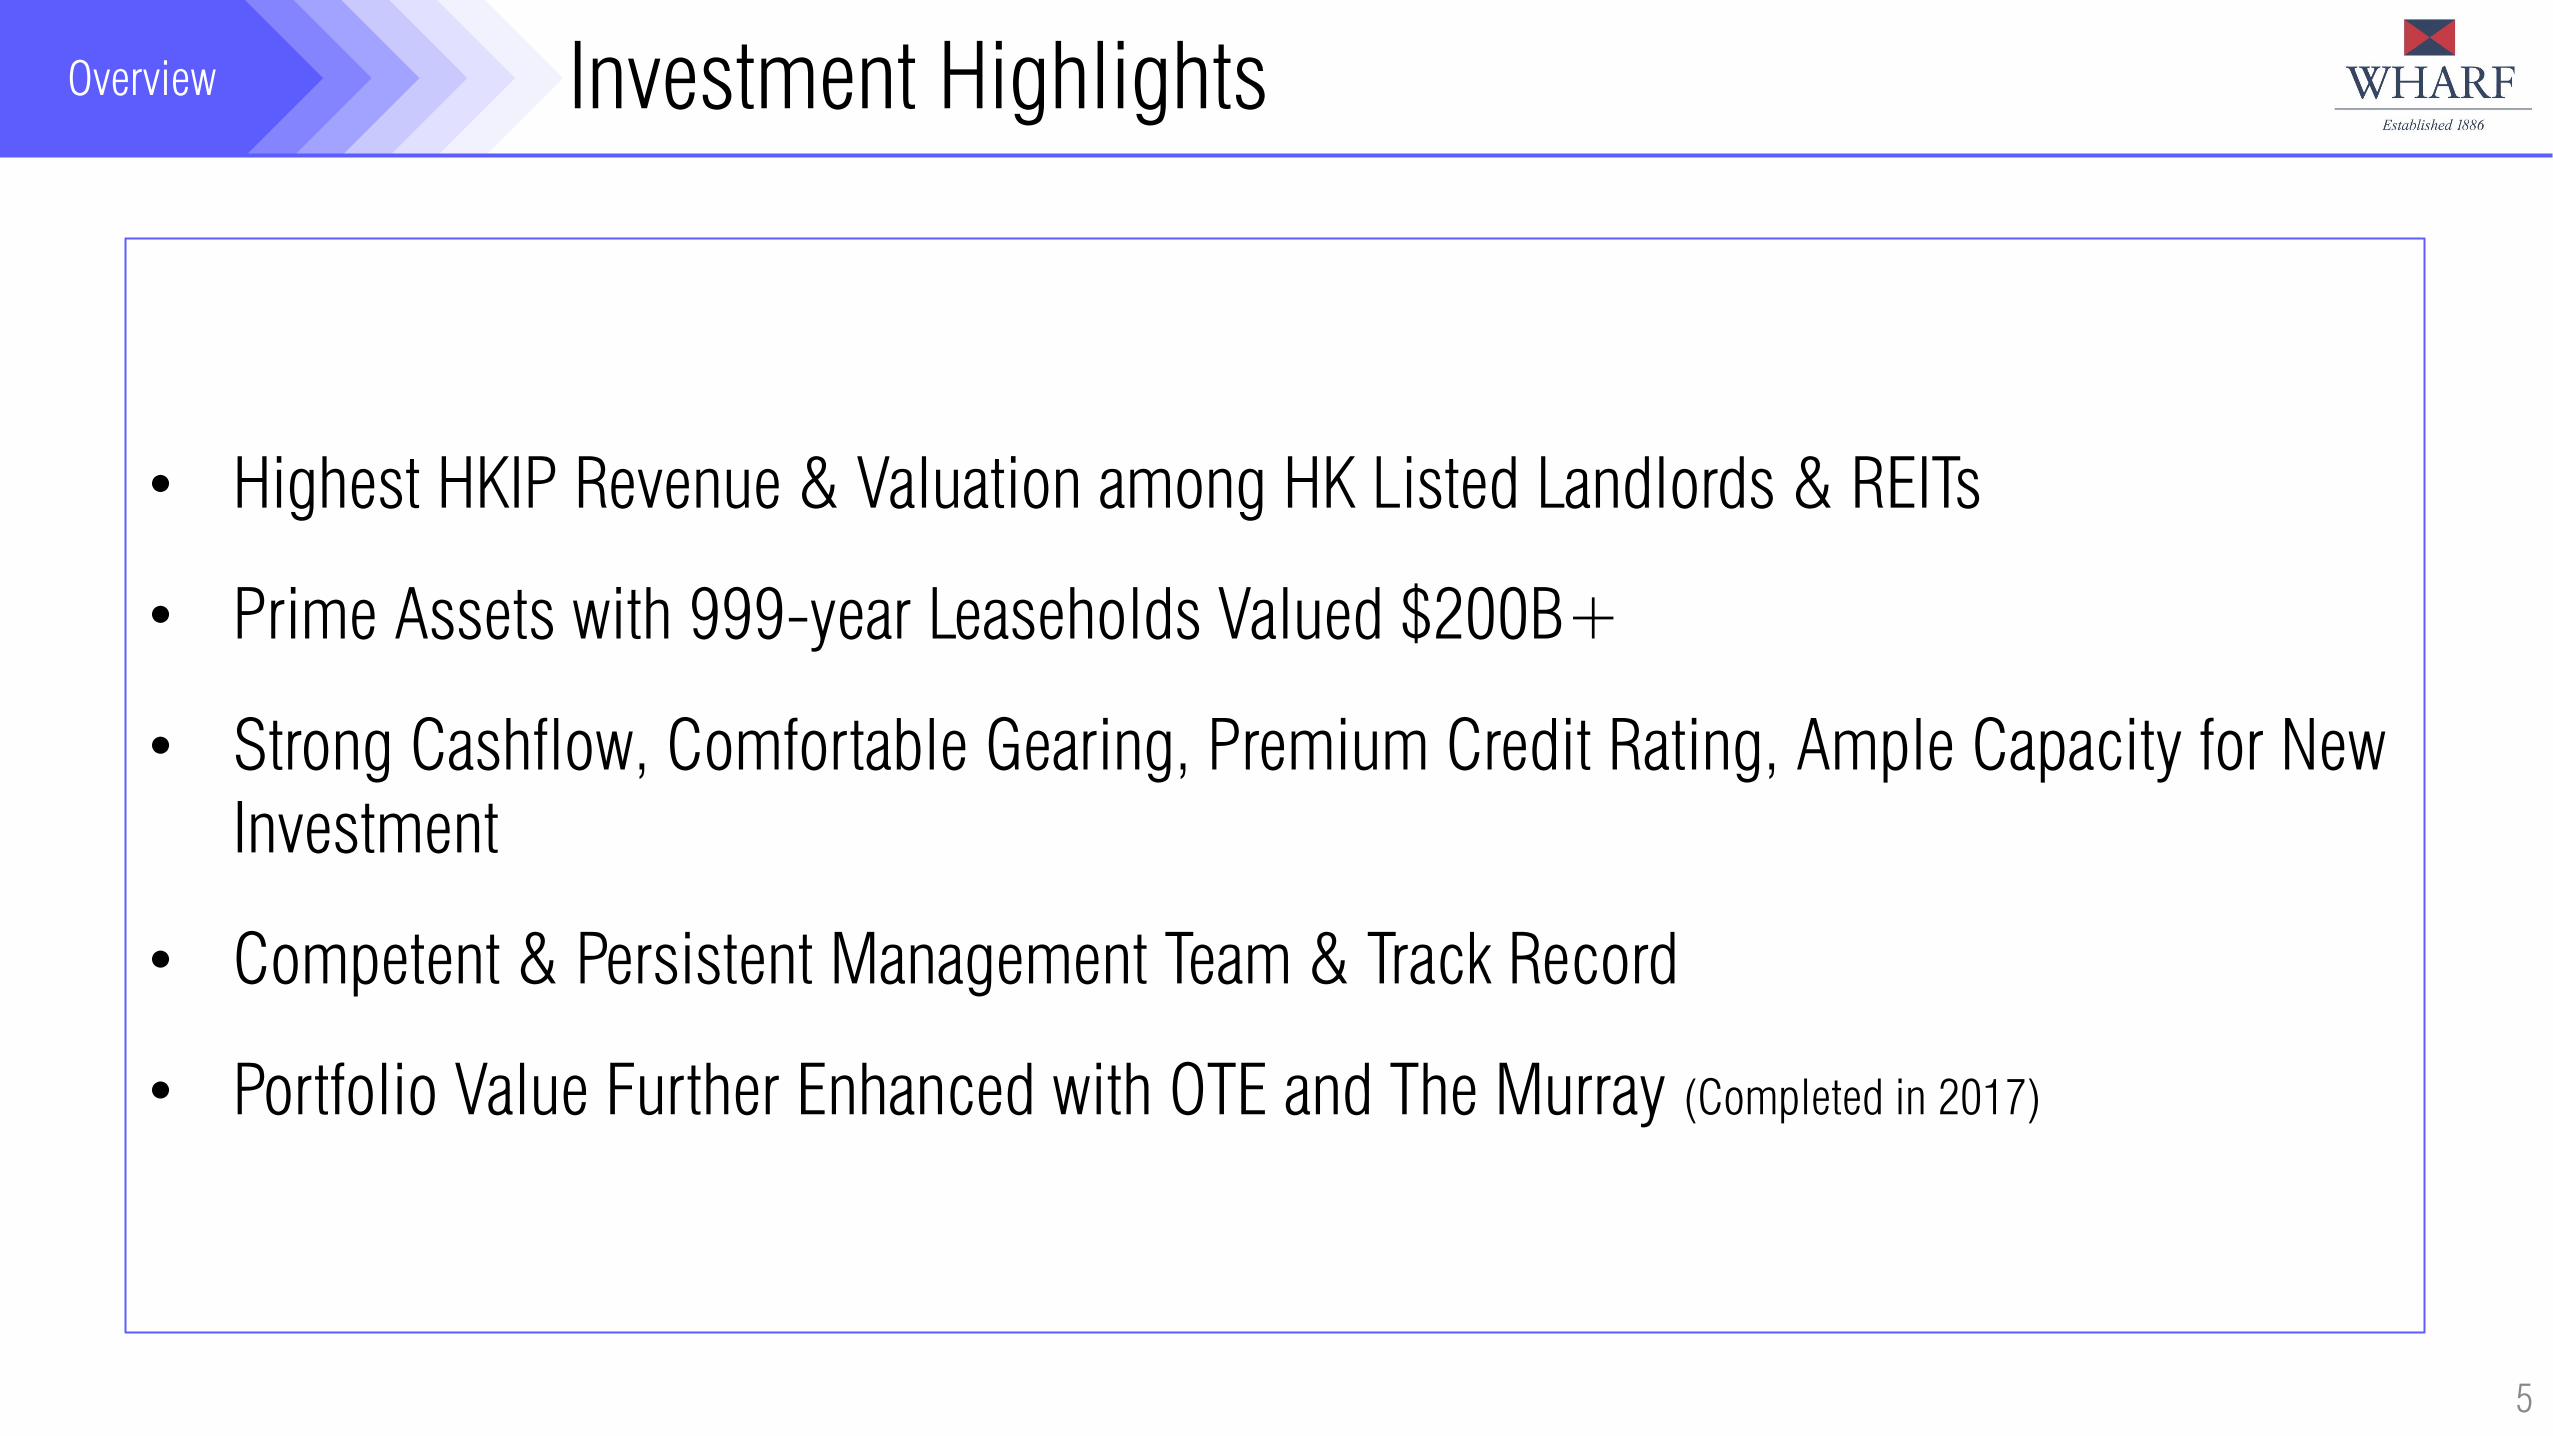
• Highest HKIP Revenue & Valuation among HK Listed Landlords & REITs
• Prime Assets with 999-year Leaseholds Valued $200B+
• Strong Cashflow, Comfortable Gearing, Premium Credit Rating, Ample Capacity for New
Investment
• Competent & Persistent Management Team & Track Record
• Portfolio Value Further Enhanced with OTE and The Murray (Completed in 2017)
5
Investment Highlights

Overview
• A Premier HKIP Play with Unrivalled Productivity
• Coveted Partner of Premium International Retailers
• A Host of Brands at Harbour City among the World’s Best-performing Stores
• Quality Retail Portfolio with Critical Mass & Unique Showcase Effects
• Constant Tenant Mix Refinement & Value Creation Initiatives Drive Performance
• Proven Retail Expertise Facilitates Resilience Through Market Downturns
6
Worldwide Retail Leader

Overview
• Hold & Invest in Premium Quality Commercial Properties in HK, Providing Strong
Cashflow & Steady Income Stream
• Create, Protect & Enhance Value Through Shopper Experience Improvements Incl.
Tenant Configuration, Events, AEIs, etc.
• Maintaining a High Level of Financial Discipline & Flexibility (Gearing <30%; LTV:
20%)
• To Provide Shareholders with Stable Dividends (Dividend Payout: 65%)
7
IP Strategies

Overview
8
• Retail Revenue (72% of Total HKIP
Revenue*)
• 3 Iconic Malls as Main Contributors
• Relentless Value Creation Initiatives
Driving Strong IP Income Base
Sturdy Recurrent Income Base
Retail
71.6%
Office
26.0%
Serviced Apts
2.4%
2017 HKIP Revenue Split
HKIP Revenue
$13.3B
*Excl. Hotel

Overview
9
Retail Resilience Through Market Down-cycles
16.1%
17.7%
14.6%
13.3%
19.6%
15.1% 14.7%
17.4%
5.3% 4.6% 4.7%
12.8%
10.3%
0.6%
18.3%
24.9%
9.8%
11.0%
-0.2%
-3.7%
-8.1%
2.2%
2007 2008 2009 2010 2011 2012 2013 2014 2015 2016 2017
HC/TS/PH Total Retail Revenue Growth vs HK Retail Sales Growth
3 Malls Retail Revenue HK Retail Sales Growth
Total Retail Revenue
10-yr CAGR 12.6%
Market Downturn Market Downturn

Overview Financial Highlights
HKD Million 2017 2016 % Chg
Group Revenue 20,904 16,851 +24%
Operating Profit 15,442 11,824 +31%
Core Profit** 9,500 8,516 +12%
Profit Before IP Revaluation Surplus 9,236 8,706 +6%
Net IP Revaluation Surplus 7,982 1,211 +559%
Profit After IP Revaluation Surplus 17,218 9,917 +74%
Earnings Per Share (HK$)
- Attributable to Shareholders
- Core**
5.67
3.13
3.27
2.81
+73%
+11%
Dividend Per Share (HK$) $0.95 NA
10
• Core Profit +12% to $9.5B, 94% from 6
Core Properties
• DPS $0.95 (65% of Recurring HKIP Core
Profit for 2H17)
• NAV $207B ($68.29/Share)
• Net Debt to Total Equity 19.9%
**Exclude IP Revaluation Surplus and Exceptional Items

Harbour City
Agenda
11
Harbour City (HC)
Times Square (TS)
Central Portfolio
Plaza Hollywood (PH)
Financial Management
Agenda

Harbour City Productivity
12
LFA (’000 s.f.)
(as of 31 Aug 2017) Occupancy
Retail 1,286 96%
Office 4,239 98%
Serviced Apartments 661 95% ^
Hotel* & Club NA NA
2017 Retail Sales
$30.2B +9.1%
2017 Sales psf/mth
~$2,300
2017 Retail Revenue
6,627M
+7%
Total GFA
8.4M s.f
HC is a 999-yr Leasehold Property (Excl. Ocean Terminal, Pacific Club)
*3 Marco Polo Hotels: Total 1,459 rooms; ^ Excl. the Vacation of Hampton Court for Premise Conversion
As Part of Asset Enhancement Strategy, Hampton Court will be
Converted into Office Premises (Completion: Jun 2019)

Harbour City “GHC” Cluster
13
• HC Mall: ~36% of GFA of Key Malls in
Greater Harbour City Cluster
• 8 Michelin-Starred Fine Dining
Restaurants*
• 14% of No. of Hotel Rooms in GHC
Cluster
* Total 55 Relevant Restaurants in GHC Cluster
Harbour City

Harbour City Global-showcase
14
• The Largest Retail Offerings in Town (570
Tenants)
• 2M s.f Mall Incl. 530m Retail Frontage
(Canton Rd)
• Must-have Location & Showcase to
Mainland Market for World’s Best Brands
• 2017 HK Market Share 6.8%*
Stores at HC -
Among their Top 3 Best Performing Stores in the World
(Selected Brands only)
2015 Retail Sales: HC US$3,681 psf = 2x U.S. Top 10 Malls Avg. US$1,828
*HK Incl. Wet Market

Harbour City
• Proven Management Driving Rental
Growth
• Tenant-mix Refinement & AEIs Driving
Value Creation
• Compelling Marketing Initiatives Driving
Patronage
15
“Retailtainment”
“Bubble Up” Art Project
“Master David Chan Contemporary
Chinese Calligraphy Performance &
Exhibition”
“Christmas in the Air”
“Giants of Christmas Forest”
Exhibition

Harbour City
Renewed
Outperformance
16
Best-in-class-management
27.3%
18.3%
15.8%
30.0%
33.8%
13.2%
10.0%
3.3%
-12.1% -9.9%
9.1%
12.8%
10.3%
0.6%
18.3%
24.9%
9.8%
11.0%
-0.2% -3.7%
-8.1%
2.2%
2007 2008 2009 2010 2011 2012 2013 2014 2015 2016 2017
Retail Sales Growth (YoY)
Harbour City Hong Kong
CAGR HC HK
2007-2017 10.2% 6.1%
2017 HK Tourist Arrival +3.2%
(Mainlander: +3.9%)
Outperformance

Harbour City
17
Rental Growth (2007-2017)
1.8 2.2
2.6 2.9
3.6 4.2
4.9
5.7 5.9 6.2
6.6
1.3
1.6
1.7 1.6
1.6
1.7
1.9
2.1
2.3 2.4
2.5
0.2
0.3
0.3 0.3
0.3
0.3
0.3
0.3
0.3
0.3
0.3
2007 2008 2009 2010 2011 2012 2013 2014 2015 2016 2017
HC Revenue Breakdown (HKD billion)
2017 $9.4B (+5%)
Retail Office S.A
Total Revenue
(2007 vs 2017)
Retail Rental Income*
(2007 vs 2017)
2.8x
(CAGR: 11%)
4.1x
(CAGR: 15%)
A Quantum Jump in Rental Income
+21%
+20%
+11%
+6%
+15%
+14%
+14%
+14%
+6%
+5%
+5%
* Excl. Management Fee, Carpark & Others

Harbour City OT Extension
18
• Breathtaking 270° Panorama of Victoria
Harbour
• West-facing Extension – Best Sunset &
Night Views of HK
• 11 Dining Outlets (7 are HK Debuts)
with Alfresco Area & Upgraded Cruise
Terminal Facilities
• Designed by Foster+Partners
Tsukada Nojo
HEXA Xihe Ya Yuan Beijing
Duck Restaurant
Paper Moon
ANA Ten
Mellow Brown Café by UCC A Nu Retrouvez-vous
Luna Cake Premium FU-RONG

Harbour City
19
New Icon
New Driver of Incremental Patronage

Times Square
20
Agenda
Harbour City (HC)
Times Square (TS)
Central Portfolio
Plaza Hollywood (PH)
Financial Management

Times Square
21
Vertical-landmark
LFA (’000 s.f.)
(as of 31 Aug 2017) Occupancy
Retail 531 96%
Office 1,026 99%
2017 Retail Sales
$8.2B +1.1%
2017 Sales psf/mth
~$1,300
2017 Retail Revenue
2,112M
-1%
Total GFA
2.0M s.f
TS is a 999-yr Leasehold Property

Times Square “GTS” Cluster
22
• CWB: Leading Shopping District on HK
Island
– Shopping Malls & Major Pedestrian
Streets
– Hotels & Office Developments
– Tourist Spots
• TS Mall: ~28% of GFA of Key Malls in
High-Traffic Greater Times Square Cluster

Times Square Lifestyle-hub
23
• Iconic Lifestyle Destination
• Linked to Causeway Bay MTR Station
• “The Living Room Museum”: Centre
Stage of Exhibitions
Mall: 17-level, ~230 Tenants

Times Square
• Constant Value-accretive Initiatives
Driving Performance
• Exciting Openings of Facesss & LEGO
Certified Store Offer Pleasant Surprises
• Innovative Cultural Exhibitions/ Events
Add Excitements
24
Excitements
“Winnie the Pooh: Be My Friend”
Exhibition
“Snoopy Celebrate Christmas at
Times Square”
“The Picasso and Jacqueline” Exhibition

Times Square
25
Sales-recovery
12.4%
10.7%
4.8%
20.0%
23.9%
1.5% 1.6%
11.1%
-12.8% -11.3%
1.1%
12.8%
10.3%
0.6%
18.3%
24.9%
9.8% 11.0%
-0.2%
-3.7%
-8.1%
2.2%
2007 2008 2009 2010 2011 2012 2013 2014 2015 2016 2017
Retail Sales Growth (YoY)
Times Square Hong Kong
CAGR TS HK
2007-2017 4.4% 6.1%
2017 HK Tourist Arrival +3.2%
(Mainlander: +3.9%)
Returned to
Positive Territory
Market Downturn Market Downturn
Times Square
26
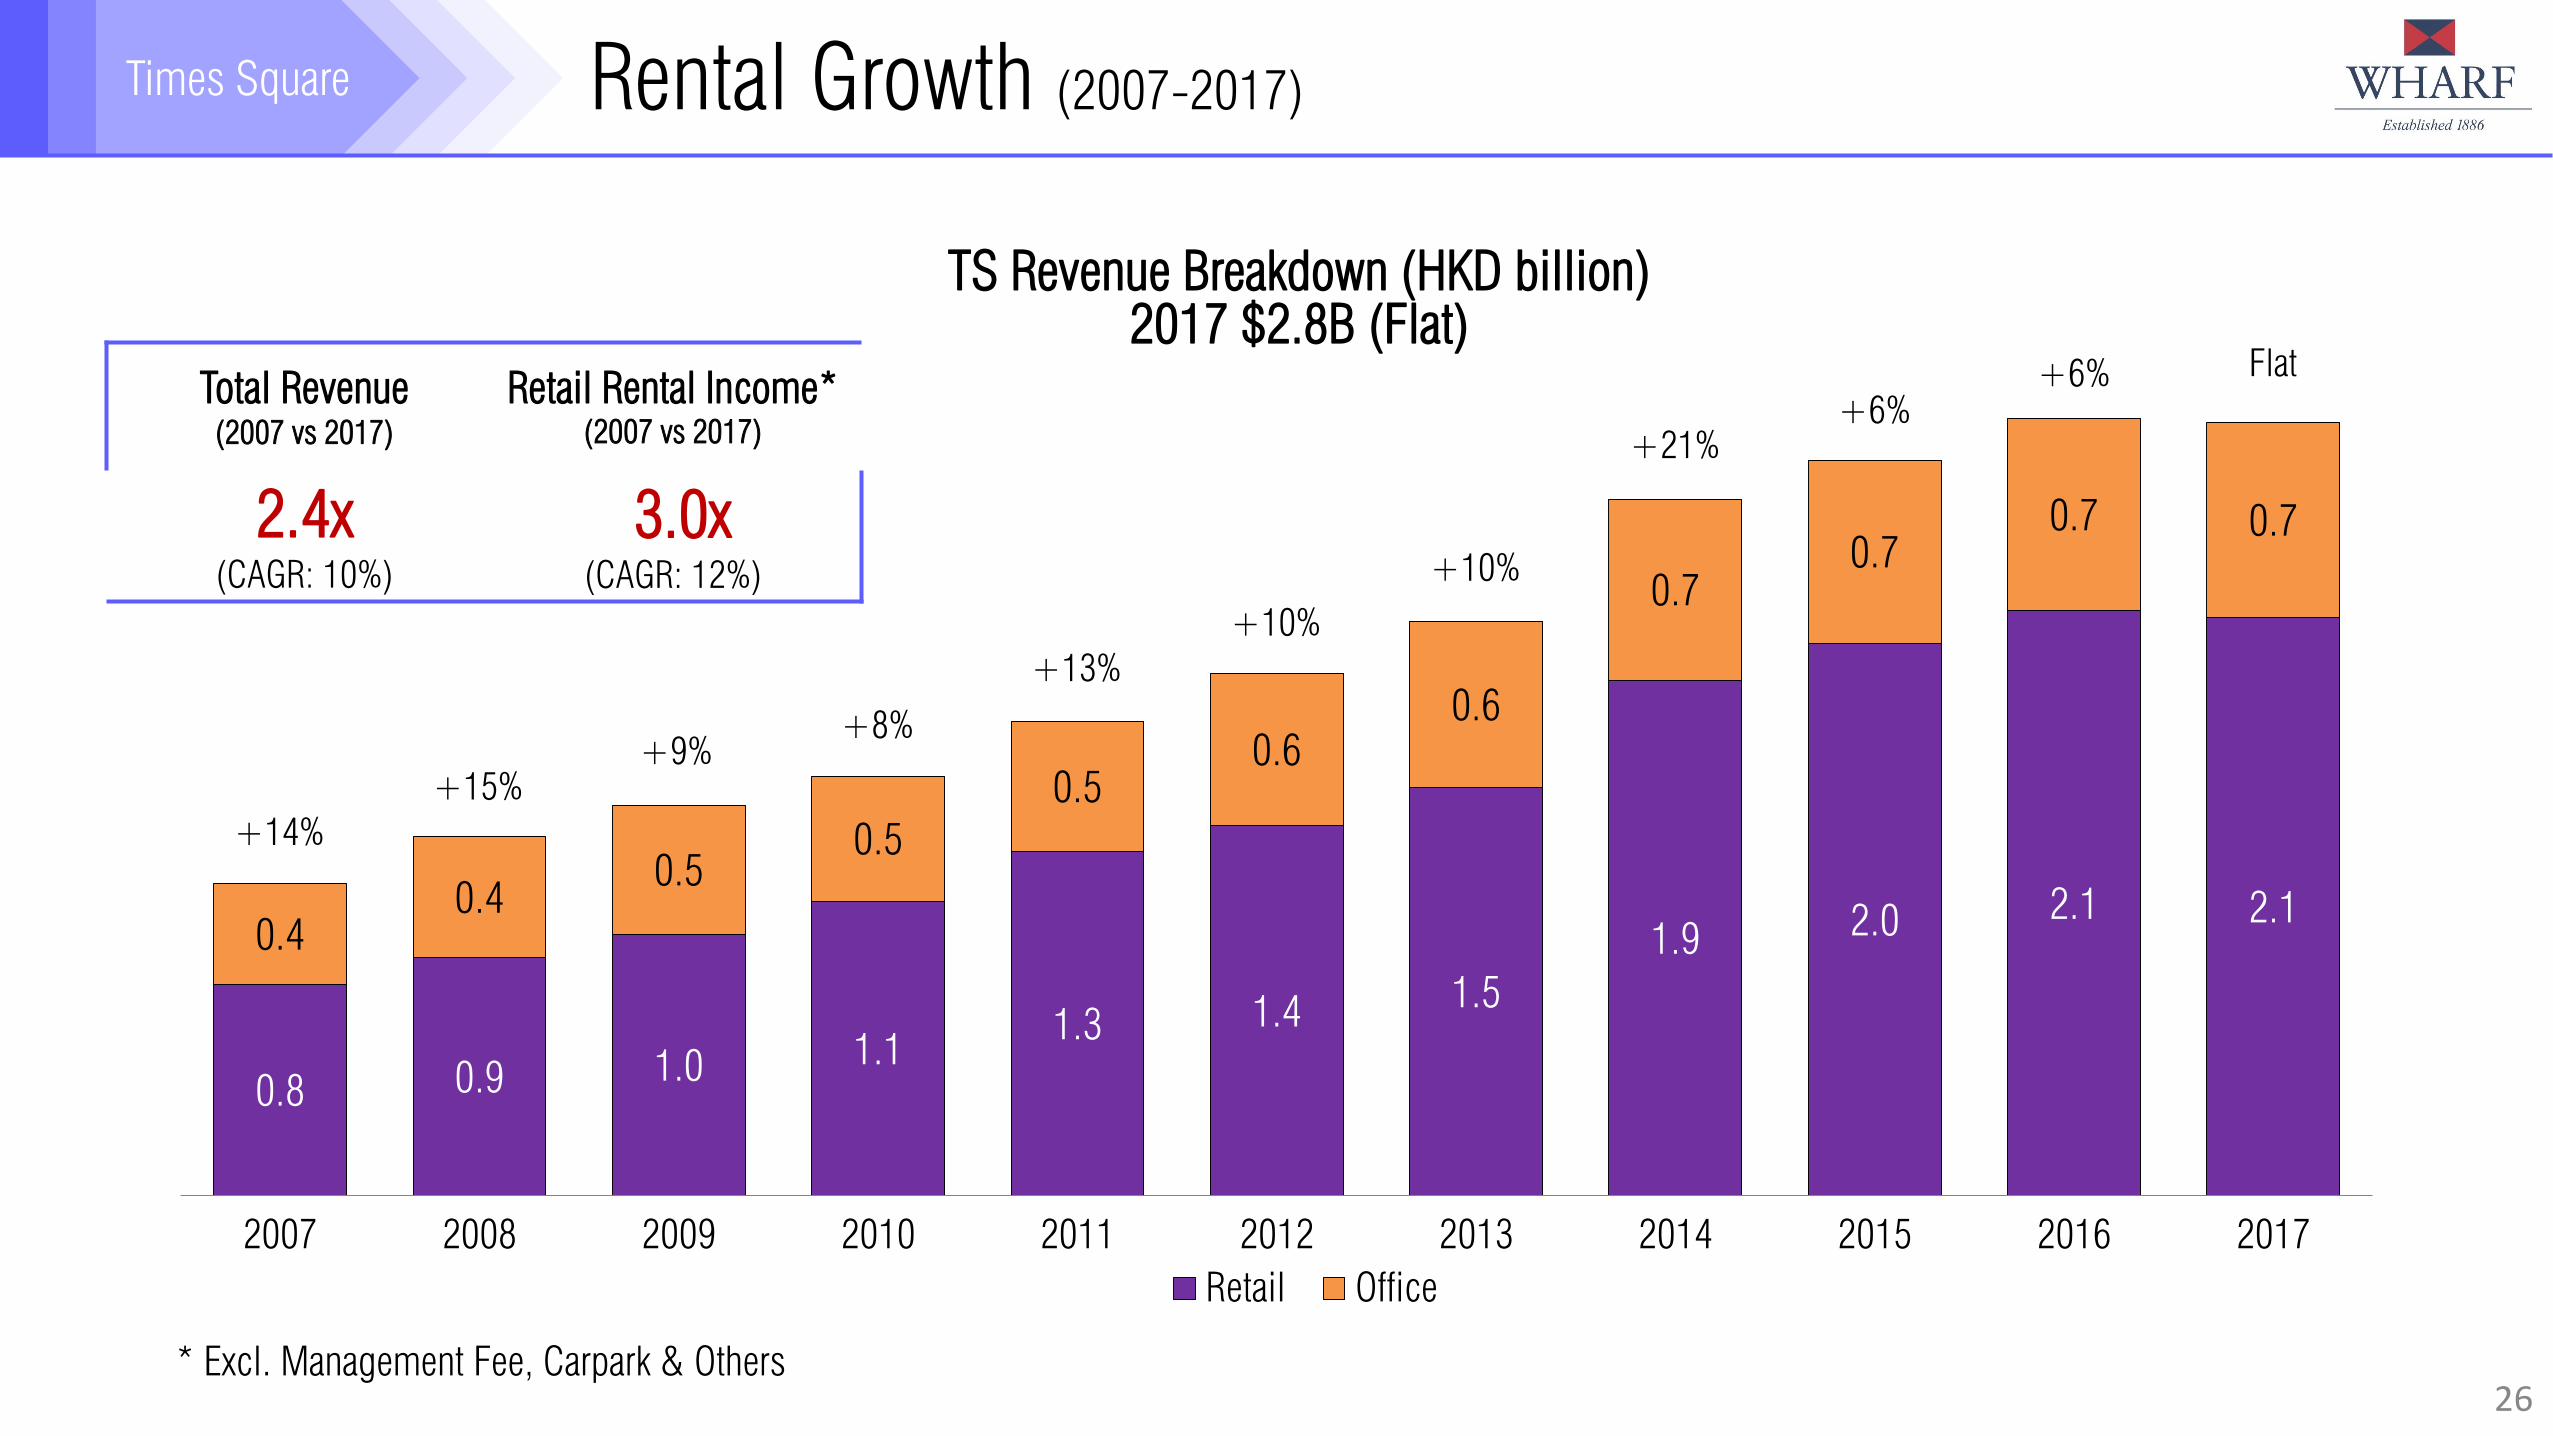
Rental Growth (2007-2017)
0.8 0.9
1.0 1.1
1.3 1.4
1.5
1.9 2.0
2.1 2.1 0.4
0.4 0.5
0.5
0.5
0.6
0.6
0.7
0.7
0.7 0.7
2007 2008 2009 2010 2011 2012 2013 2014 2015 2016 2017
TS Revenue Breakdown (HKD billion)
2017 $2.8B (Flat)
Retail Office
Total Revenue
(2007 vs 2017)
Retail Rental Income*
(2007 vs 2017)
2.4x
(CAGR: 10%)
3.0x
(CAGR: 12%)
+14%
+15%
+9%
+8%
+13%
+10%
+10%
+21%
+6%
+6% Flat
* Excl. Management Fee, Carpark & Others

Central
Portfolio
27
Agenda
Harbour City (HC)
Times Square (TS)
Central Portfolio
Plaza Hollywood (PH)
Financial Management

Central
Portfolio
28
Central Portfolio
Crawford House Wheelock House The Murray, a Niccolo Hotel

Central
Portfolio Crawford House – Premium-commercial
29
• Strategically Located in HK’s Core CBD
• Houses Zara’s HK Flagship
• 999-yr Leasehold
• 2017 Office Passing Rent $57 psf/mth
(+6%)
• 2017 Office Rental Reversion +9%

Central
Portfolio
• Prime Grade A Office, on Top of MTR
Station
• First-rate Management
• 999-yr Leasehold
• 2017 Office Passing Rent $74 psf/mth
(+7%)
• 2017 Office Rental Reversion +19%
30
Wheelock House – Ground-zero

Central
Portfolio The Murray – Contemporary Urban Chic
31
• Converted from Iconic Murray Building
• Historical Landmark Under Government’s
Conserving Central Initiative
• A Signature Piece of Architecture (~50
Yrs) Comes to Life Again
• Completion 15 Months Ahead of
Schedule
Attending the Plaque Unveiling Ceremony at The Murray are (from Left) Mr. Douglas Woo,
Mr. Peter Woo, Mrs. Carrie Lam, Mr. Stephen Ng & Ms. Yen Leng
Completion of Preservation of The Murray (20 Dec 2017),
as a Celebration for the 20th Anniversary of HKSAR

Central
Portfolio The Murray – Contemporary Urban Chic
32
• Strategic Investment in CBD with Long-
term Perspective
• A Luxury Hotel Overseeing the City’s
CBD & Serene Green Surroundings
• Soft Opening: 15 Jan 2018
Included in CNN Travel’s 2018 List
of Must-visit Luxurious New Hotel
Included in the List of World’s Best
New Hotel to Discover in 2018
by The New York Times
Central
Portfolio
33
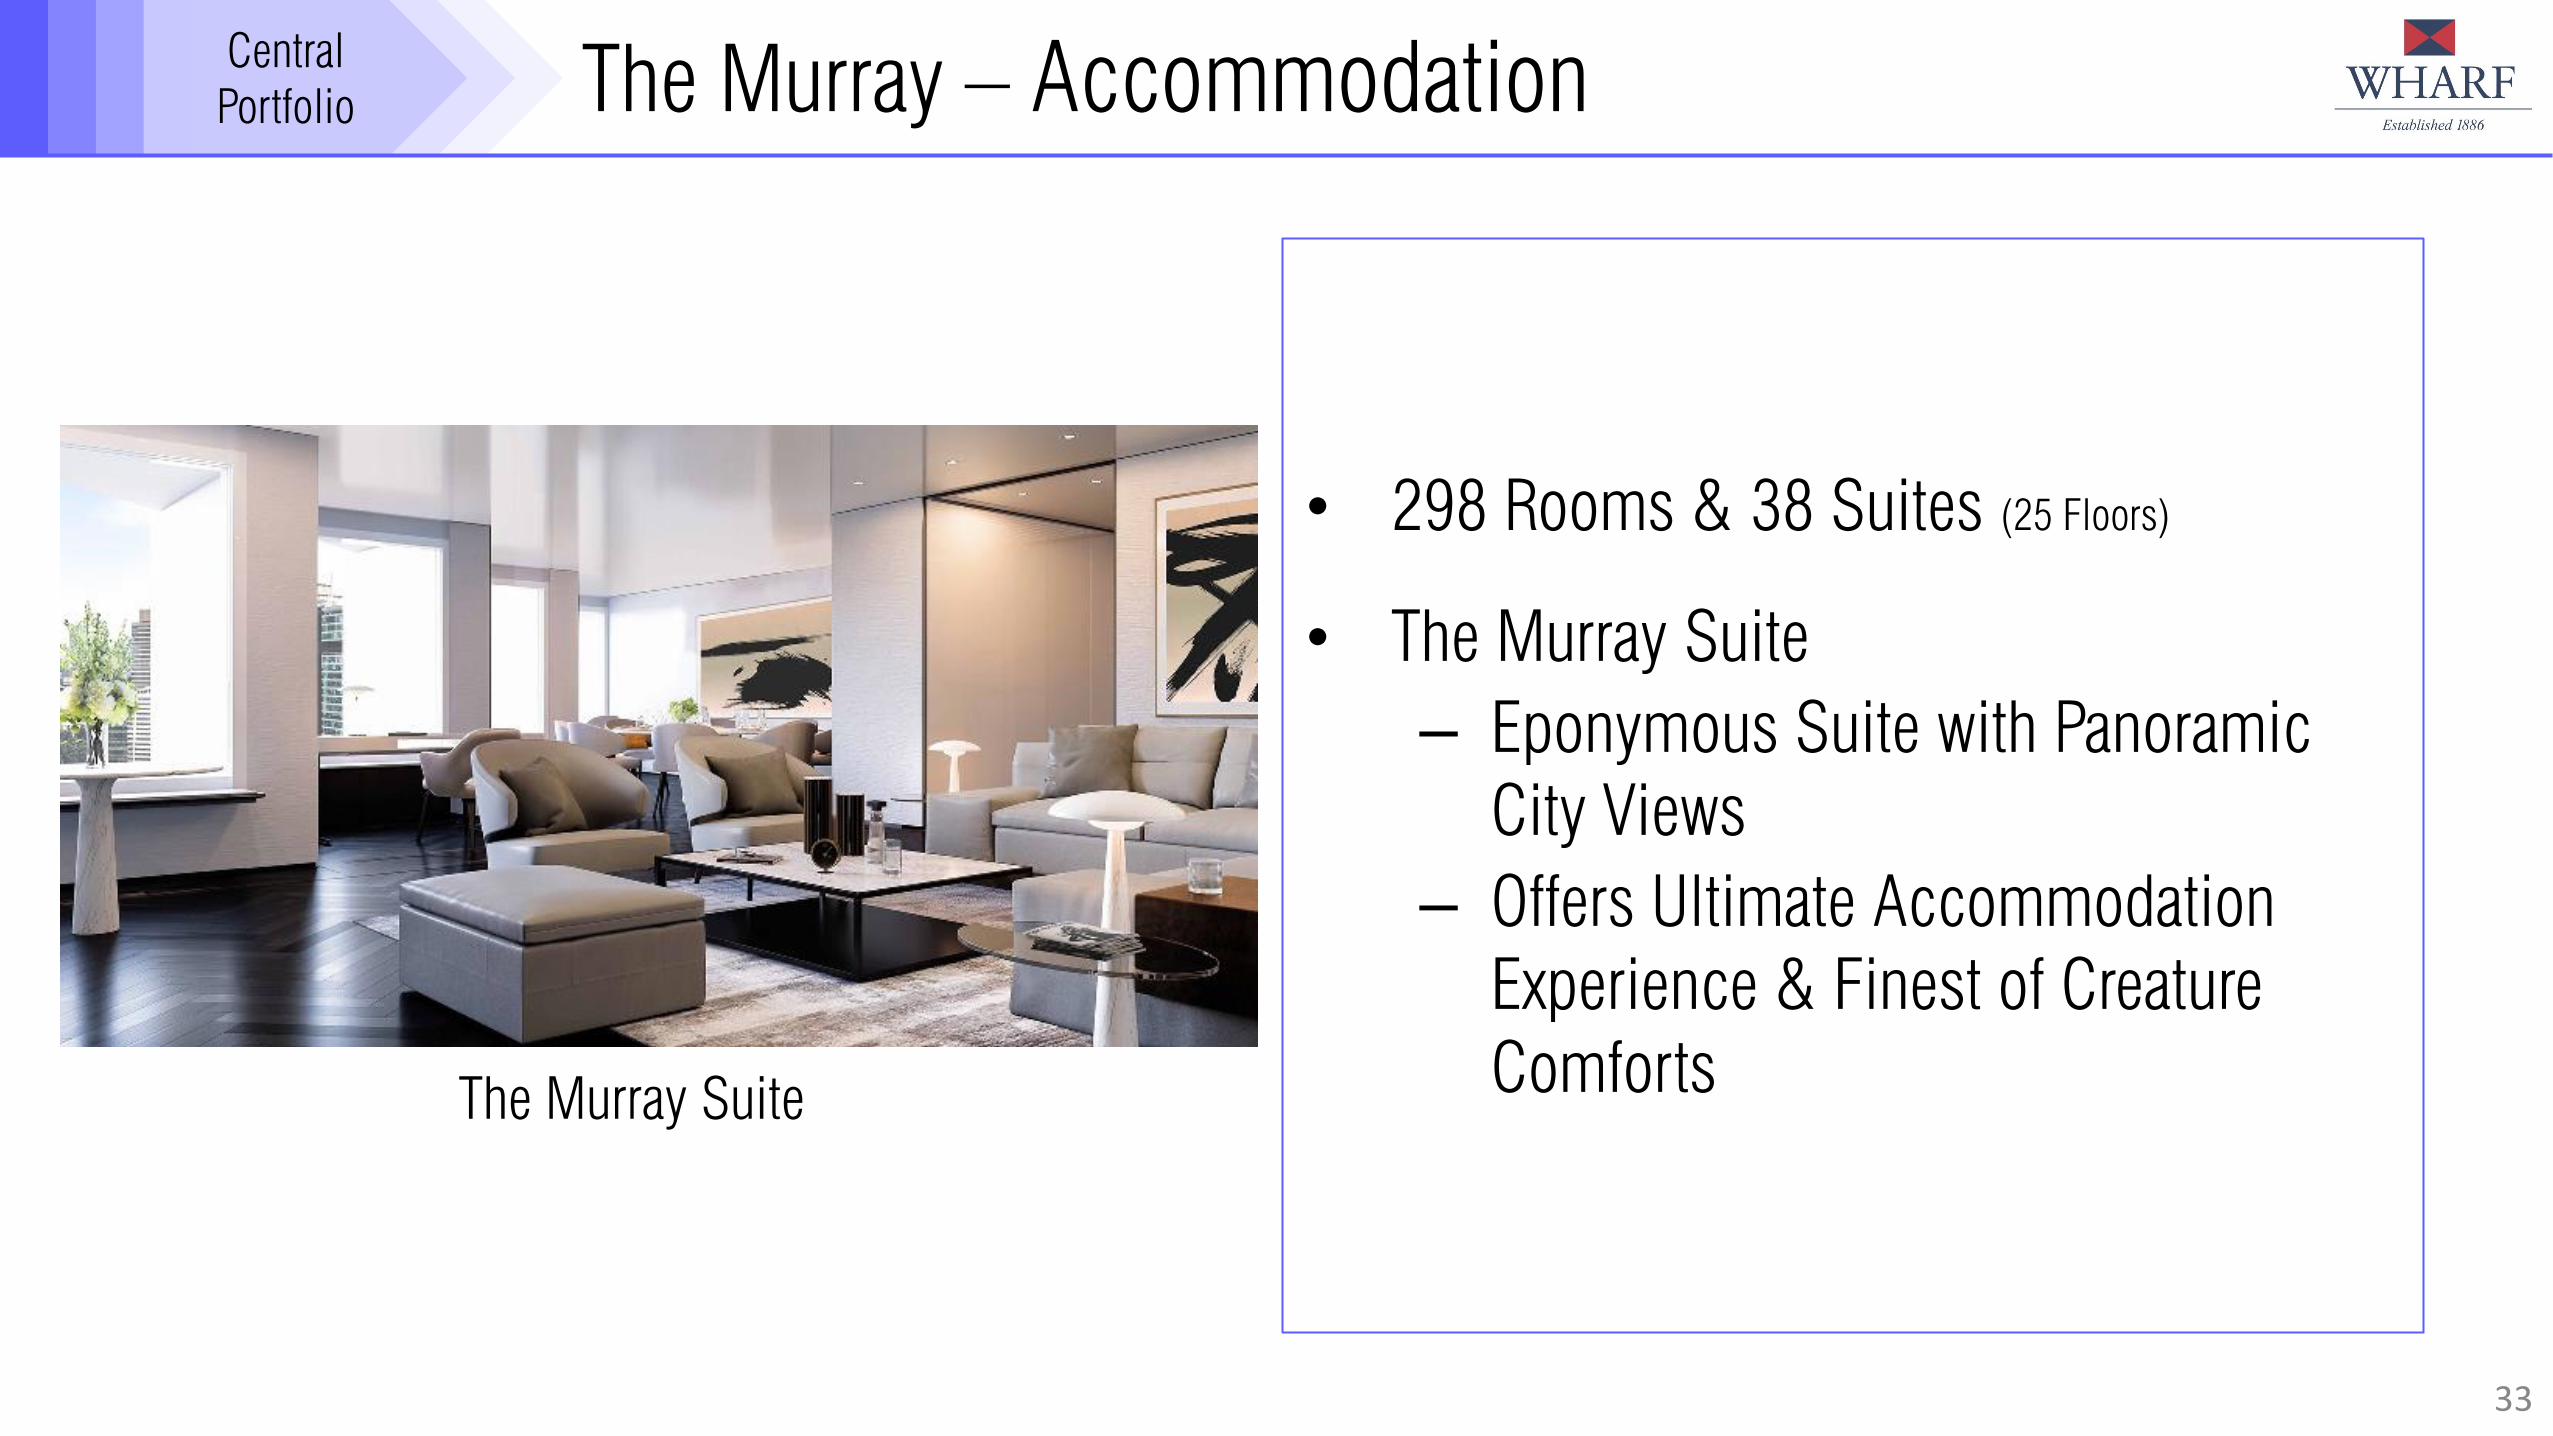
The Murray – Accommodation
The Murray Suite
• 298 Rooms & 38 Suites (25 Floors)
• The Murray Suite
– Eponymous Suite with Panoramic
City Views
– Offers Ultimate Accommodation
Experience & Finest of Creature
Comforts

Central
Portfolio
• Popinjays
– Stunning Rooftop Restaurant, Bar &
Terrace
– Offers Breath-taking Views of CBD &
Green Oasis of HK Park
• The Tai Pan (Modern European)
• Murray Lane (Lobby Bar)
• The Garden Lounge
• Guo Fu Lou (國福樓)
34
The Murray – Restaurants & Bars
Popinjays
(Rooftop Restaurant & Bar)

Central
Portfolio
35
The Murray – Facilities
Niccolo Room
• Meeting & Event Spaces>20,000 s.f
• Leisure Facilities: Spa, Gymnasium &
Swimming Pool

Plaza
Hollywood
36
Agenda
Harbour City (HC)
Times Square (TS)
Central Portfolio
Plaza Hollywood (PH)
Financial Management

Plaza
Hollywood CBD2-destination
37
• Exploit Growth Opportunities in
Kowloon East (Govt-designated CBD2)
• Atop Diamond Hill MTR Station
(Interchange for Shatin to Central Link)
– Tai Wai to Hung Hom via Diamond
Hill (2019*)
– Hung Hom to Admiralty (2021*)
• Collaborate with Kai Tak Cruise Terminal
to Drive Patronage & Boost Tourist
Spending
Mall: 210 Tenants, 24 Restaurants & a Purpose-built Stadium
* Commissioning Date

Plaza
Hollywood CBD2-destination
38
LFA (’000 s.f.)
(as of 31 Aug 2017)
Occupancy
Retail 375 97%
2017 Retail Sales
$2.5B +1.9%
Total GFA
562K s.f
2017 Retail Revenue
574M
+5%
65% GFA Lettable (Highly Efficient)

Financial
Management
39
Agenda
Harbour City (HC)
Times Square (TS)
Central Portfolio
Plaza Hollywood (PH)
Financial Management

Financial
Management Prudent Financial Management
40
• Gearing: 19.9%
• Average Interest Cost: 3.2%
• 2018 Capex for 6 Key Assets: $0.8B
(2017: $2.1B)
20.3*
1.5
4.9
3.0
7.6 6.5
Jan18-Dec18 Jan19-Dec19 Jan20-Dec20 Jan21-Dec21 Jan22-Dec22 Jan23 & After
Debt Maturity (HKD billion)
(As at 28 Feb 2018)
For Debt with Maturity in 2023 & After Incl. the 10-yr Bond of US$600M Issued
in Jan 2018
As of Late Feb 2018, Long-term Facility Available for Drawdown Amounted to
Approximately $12B, which Could be Utilized to Repay the Bridging Loan ($20B)
if Needed .
*Incl. Bridging Loan of $20B
Financial
Management
• Same Rating as HK Land, Swire Properties & Link REIT
• Per Moody’s, the Rating
– Reflects WREIC’s Sizable & Good Quality Assets, & Diversity of its Asset Types
– Considers WREIC’s Strong Management Ability in Tenancy Management, which
Provides Good Revenue & Profit Visibility
– Reflects that WREIC will Maintain a Sustainable Business Strategy & Prudent
Financial Management
41
Moody’s A2 Issuer Rating; Outlook Stable
Source: Moody’s Investors Service
42
Corporate Social Responsibility
Business-in-
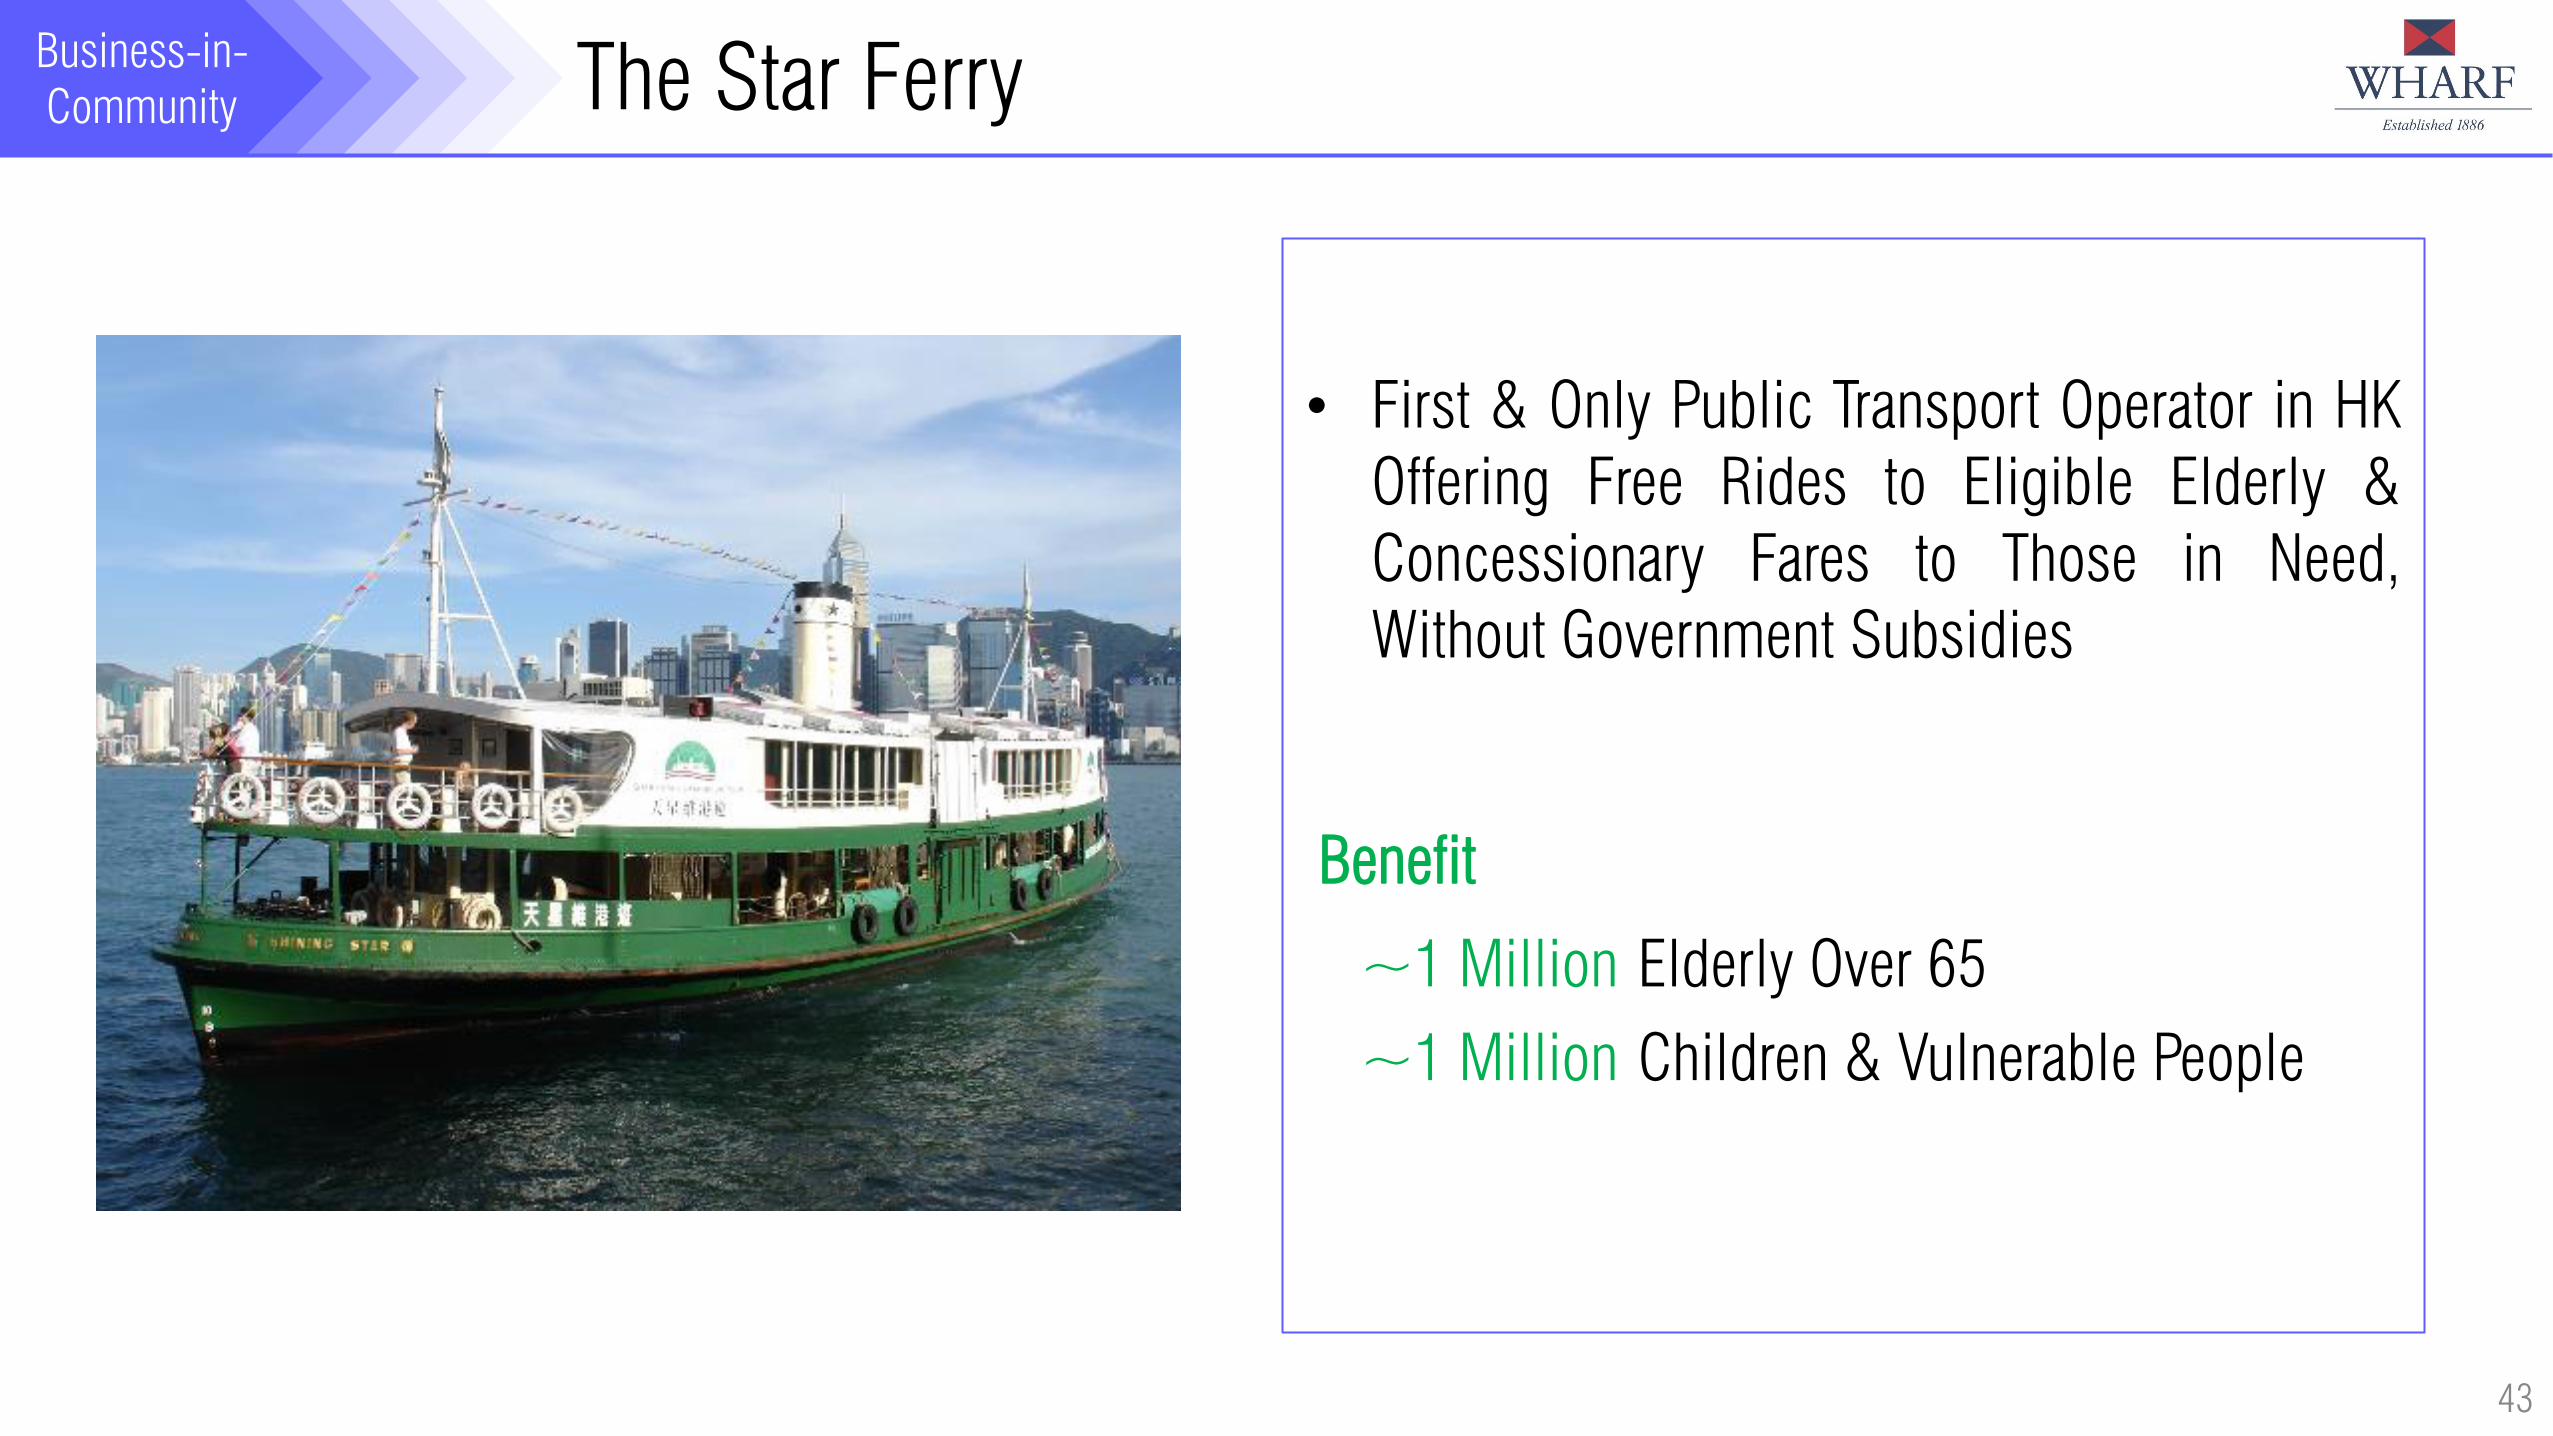
Community The Star Ferry
43
• First & Only Public Transport Operator in HK
Offering Free Rides to Eligible Elderly &
Concessionary Fares to Those in Need,
Without Government Subsidies
Benefit
~1 Million Elderly Over 65
~1 Million Children & Vulnerable People

Business-in-
Community Project WeCan
44
Launched in 2011 by Wharf, Project WeCan
is a Business-in-Community Initiative
Providing Students who are Disadvantaged
in Learning with Opportunities and Care.
Using an “Adopt a School” Model, it is
Now an Open Platform Encompassing:
34 Companies: 11 Wharf Business Units + 23 External Companies
5 Universities
3 Consulates
3 Organisations
Beneficiaries 2017 2018
50,000 66,000 (est.)
53 75

Business-in-
Community Wharf Architectural Design Internship
45
Project Partners
2 Universities
Awardees
24 Architectural Postgraduates
Countries
Denmark, Dubai, France, Germany, India, Italy,
Japan, the Netherlands, Spain, Switzerland, the
United Kingdom and the United States

Business-in-
Community Wharf Art Scholarship
46
• Launched in 2013
• Support Students to Pursue an Undergraduate
Degree in Creativity Related Subjects at a
Tertiary Institution of Their Choice
• 12 Students have Received Scholarships to
Study Art & Design Related Subjects at
Renowned Institutions Around the World

Appendix
47
Appendix

Appendix
48
Harbour City Times Square Plaza Hollywood
2017
(HKD million) Revenue % Chg Revenue % Chg Revenue % Chg
Retail 6,627 +7% 2,112 -1% 574 +5%
Office 2,492 +2% 712 +2% - -
Hotels & Club 1,336 +4% - - - -
Serviced Apt. 325 +3% - - - -
Total 10,780 +5% 2,824 Flat 574 +5%
Valuation* as of
31 Dec 2017 $178.1B $56.6B $9.6B
Retail Sales
Jan-Dec 2017 $30.2B (+9.1%) $8.2B (+1.1%) $2.5B (+1.9%)
2017 Avg. Retail
Passing Rent
(HK$ psf per
Month)
$430 $299 $108
* Incl. Hotels at Valuation as of 31 Dec 2017
HC/TS/PH Performance

Appendix
49
Premium Quality IP Driving Growth
9.7
11.3
12.0
12.8
13.3
8.4
9.8
10.4
11.2 11.7
2013 2014 2015 2016 2017
HK IP Revenue & Operating Profit (HKD Billion)
Revenue Operating Profit

Appendix Highest HKIP Revenue & Valuation (Among HK Listed Landlords & REITs)
50
Note: Excl. Hotel (Not Classified as IP Per Accounting Std.); Data for Peers Either as of End-2016 or Mar-2017
241.4
Wharf REIC Peer A Peer B Peer C Peer D Peer E Peer F
2016 HKIP Valuation (HKD Billion)
12.8
Wharf REIC Peer 1 Peer 2 Peer 3 Peer 4 Peer 5 Peer 6
2016 HKIP Revenue (HKD Billion)

Appendix
51
Transforming a Wharf & Godown to Harbour City in 1960s-Present
• Under the Government’s PUD, Kwai Chung was the Selected
Location for Cargo Containerization
• Resulting in the Creation of The Hongkong Hotel, Ocean
Centre & Rest of Harbour City (“HC”)
• Ocean Terminal (Part of HC) - 1st All-weather Mall in HK;
1st Cruise Terminal in HK
• HC is Now an International Retail Landmark & a Must Visit
“Shoppertainment” Destination for Locals & Tourists
• Ocean Terminal Extension (“OTE”) is Scheduled to Open in
4Q17, Further Enhances OT’s Positioning

Appendix One Harbour, One Harbour City
52
Unrivalled Power Centres:
• Cosmetics: Largest Single Cluster in the
City (250+ Brands)
• Shoes: Most Diversified Choices (200+
Brands)
• KidX “Petite Canton Road”: Best-in-class
Selection (50+ Brands)
• Jewellery & Watches: (100+ Brands)
• SportX: Full Range of Sporting Goods
(50+ Brands)
• F&B / Confectionary: (100+ Outlets)
One Harbour, One Harbour City
(一個海港, 只有一個海港城)

Appendix
53
Creating a Times Square from an Old Tram Depot in 1989
From an Old Tram Depot & Wet Markets To a 17-storey Vertical Mall (1M s.f)
Among the World’s Most Successful Vertical Malls

Appendix
54
3,681
3,185
2,349 2,200 2,170
1,615 1,595 1,595 1,550 1,475 1,457 1,440
0
500
1,000
1,500
2,000
2,500
3,000
3,500
4,000
Harbour City Bal Harbour Times Square The Grove The Mall at
Rockingham
Park
Forum Shop at
Caesars
Aventura Mall Phesant Lane
Mall
Woodbury
Common
Premium
Outlets
The Village at
Corte Madera
Century City Ala Moana
Centre
2015 Retail Sales (USD psf)
(California)
(L.A.)
(Honolulu)
Source: CNBC
Average: USD1,828 psf
(New York )
(Florida) (L.A.)
(New Hampshire)
(Las Vegas)
(Florida)
(New
Hampshire)
HC Annual Retail Sales psf 2x Top 10 N. America Malls’ Avg.
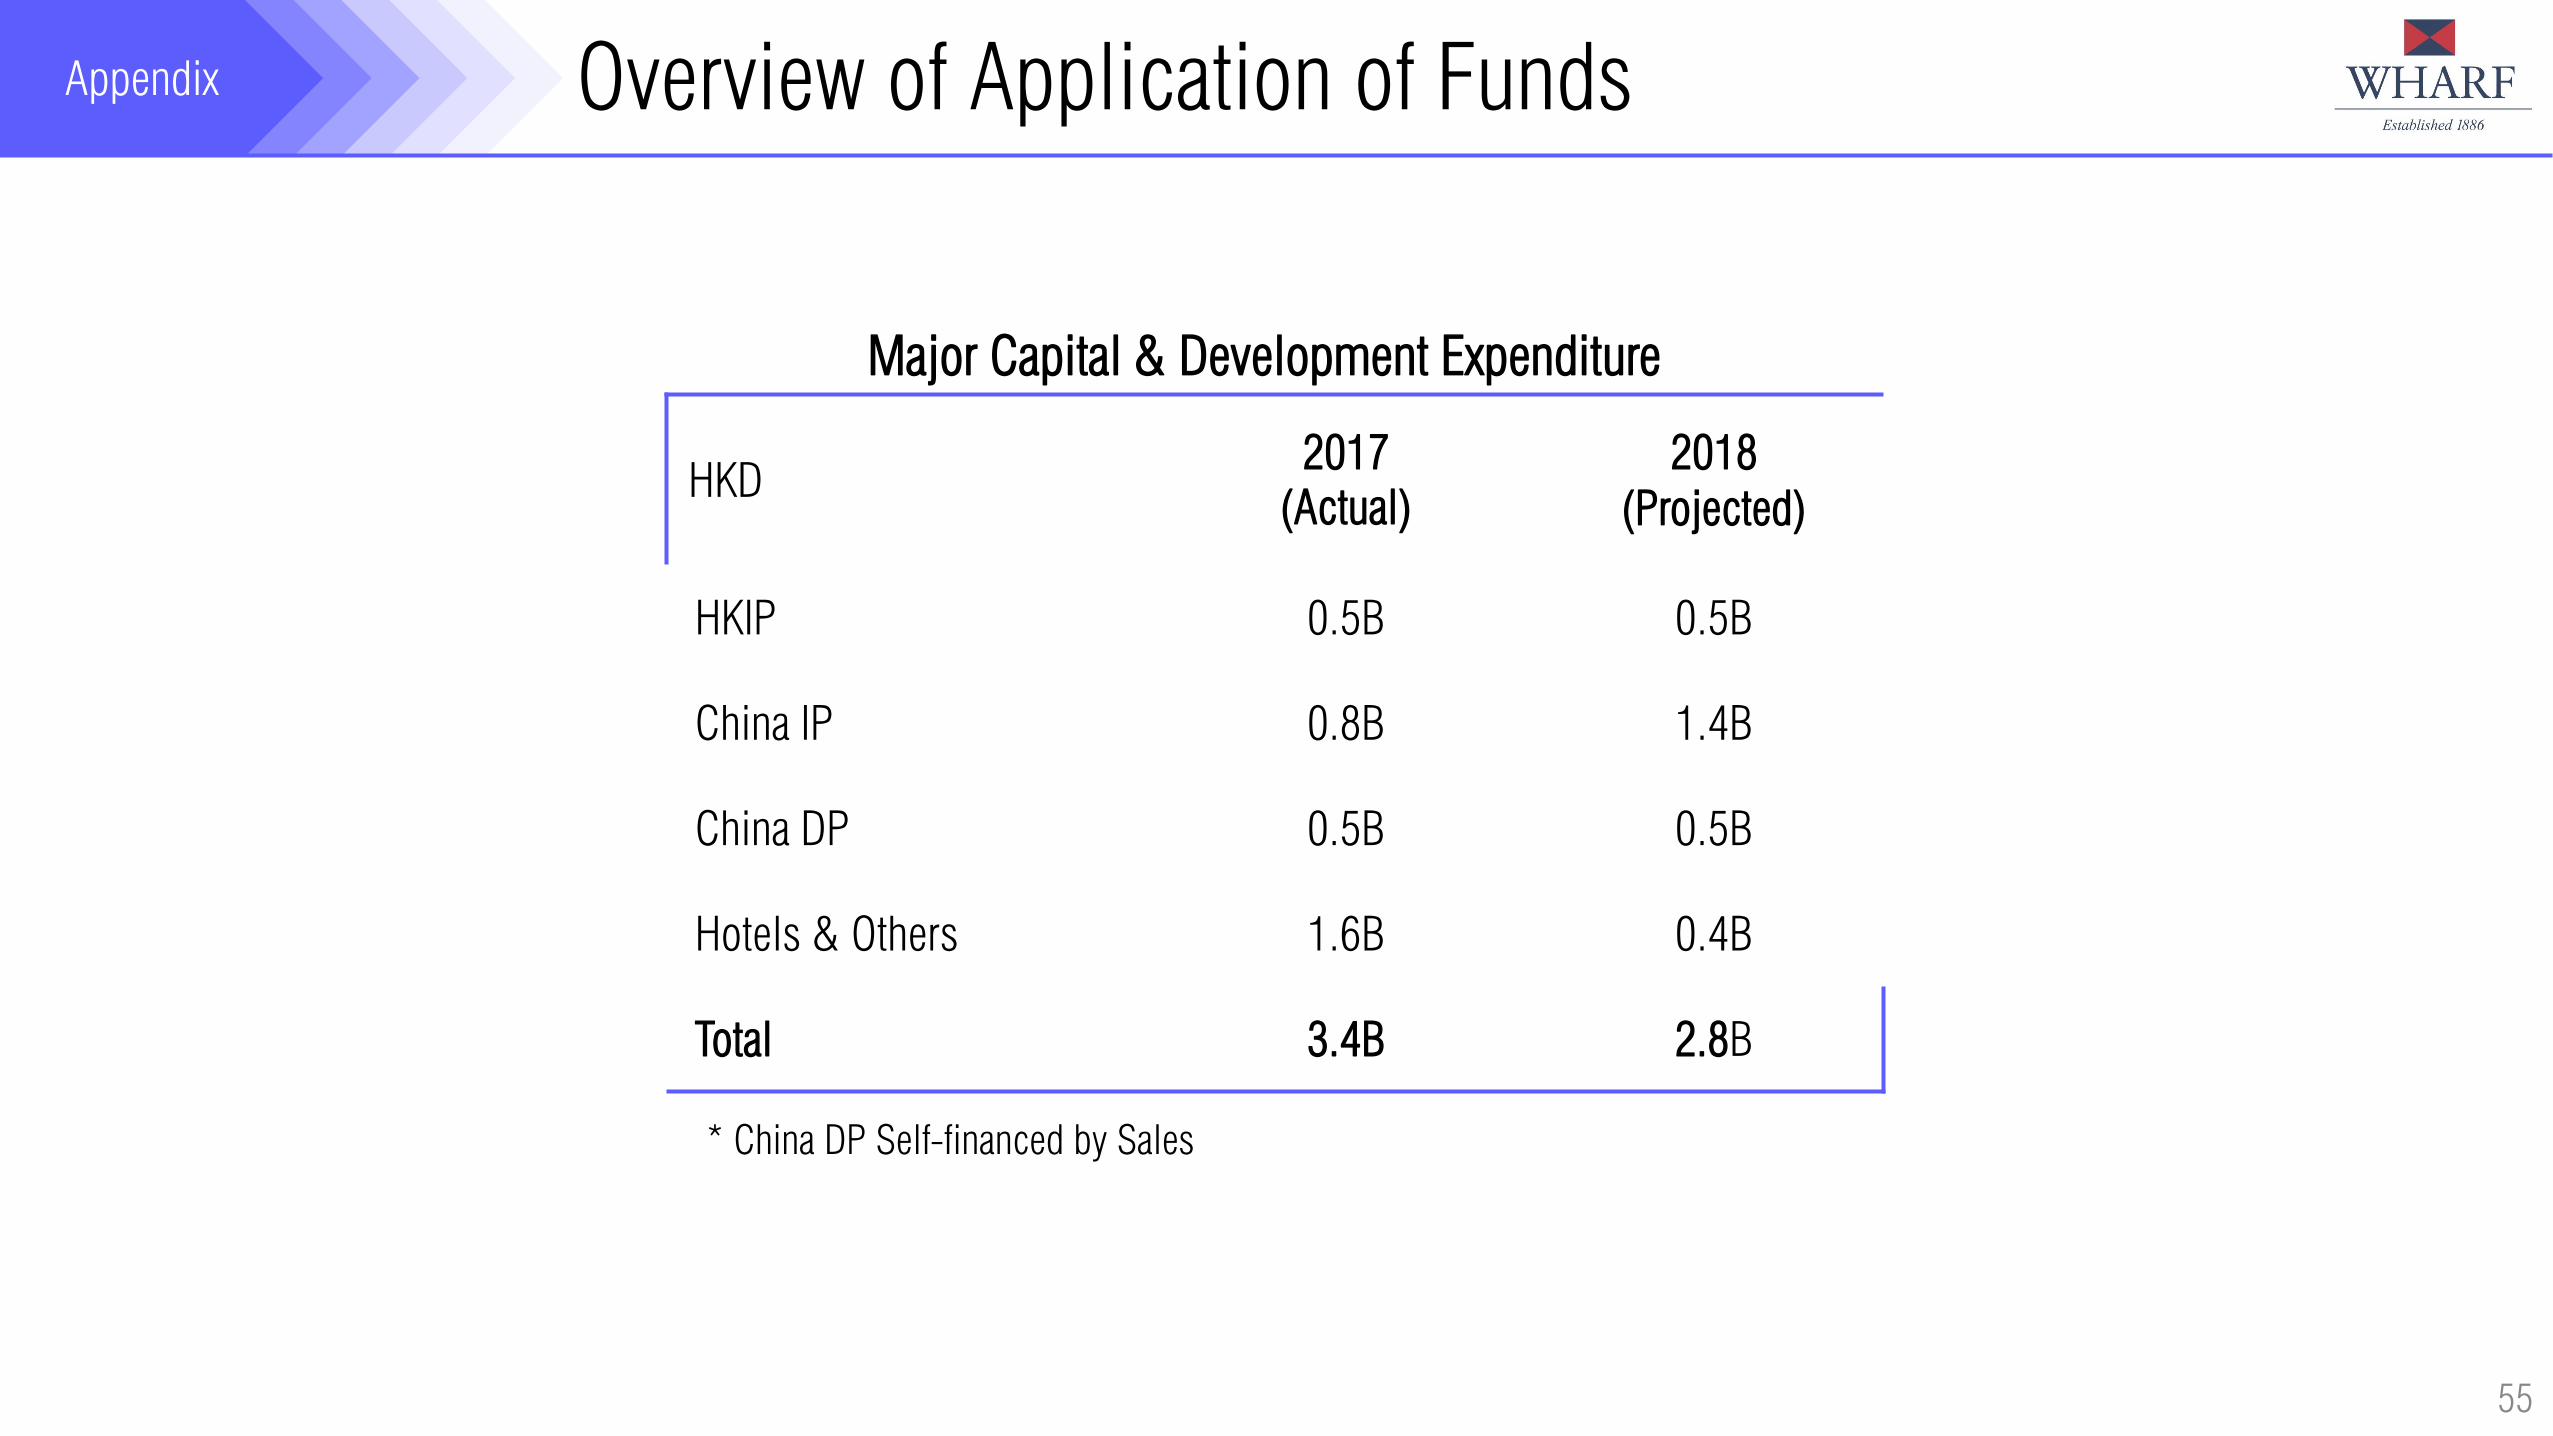
Appendix Overview of Application of Funds
55
HKD 2017
(Actual) 2018
(Projected)
HKIP 0.5B 0.5B
China IP 0.8B 1.4B
China DP 0.5B 0.5B
Hotels & Others 1.6B 0.4B
Total 3.4B 2.8B
* China DP Self-financed by Sales
Major Capital & Development Expenditure

56
Thank You
Retail Drives IP Cashflow

57
End of Presentation
Wharf Real Estate Investment Company Limited [HKEx Stock Code: 1997.HK]
Disclaimer
1) All information and data are provided for information purposes only. All opinions included herein constitute
Wharf’s judgment as of the date hereof and are subject to change without notice. The Group, its
subsidiaries and affiliates hereby disclaim (i) all express, implied, and statutory warranties of any kind to
user and/or any third party including warranties as to accuracy, timeliness, completeness, or fitness for any
particular purpose; and (ii) any liability whatsoever for any loss howsoever arising from or in reliance upon
the whole or any part of the information and data contained herein.


![Spend $1000 On Qualifying James Hardie [EXCL GST] … · Excluded products: All Accessories, Villaboard ... • For 18mm timber thickness FXSDTDSS1205025 $9900 (EXCL GST) 5.5mm (12g)](https://static.fdocuments.us/doc/165x107/5af918277f8b9aff288cb3e2/spend-1000-on-qualifying-james-hardie-excl-gst-products-all-accessories.jpg)


