Retail Division FOR EASE PRPSED TE ILLAGE AT … EASE TE ILLAGE AT RESSI RA PALOMAR AIRPORT RD. ......
6
FOR LEASE THE VILLAGE AT BRESSI RANCH PALOMAR AIRPORT RD. & EL FUERTE ST., CARLSBAD, CA 92011 Retail Division Bruce Schiff +1 760 431 4207 Bruce.Schiff@dtz.com LIC #01232733 Phil Lyons +1 760 431 4210 [email protected] LIC #01237235 1000 Aviara Parkway, Suite 100, Carlsbad, CA 92011 T: +1 760 431 4200 F: +1 760 454 8369 www.dtz.com PROPOSED For Lease • Proposed mixed use specialty Village Center to compliment Bressi Village directly across Gateway Road • The Village at Bressi Ranch will offer retailers an opportunity to be located in the highly sought after community of Bressi Ranch. • With over 30 million SF of office and industrial properties in the immediate Trade Area, The Village of Bressi Ranch has a true day and night customer base, seven days a week. Property Highlights • Palomar Airport Rd. & El Fuerte St., Carlsbad, CA 92011 Location Traffic Counts • Palomar Airport Road: ±45,100 ADT • El Fuerte Street: ±5,000 ADT ± 10 ACRE RETAIL CENTER F A R A D A Y A VE E L F U E RTE PA L O M A R AIR P O R T R D E L C A MINO R E A L C O L L E GE B L V D GATEWAY RD. 1 MILE 3 MILES 5 MILES Pop (2014) 5,233 76,330 243,775 AHH Income $135,768 $102,710 $101,630 Daytime Pop. 6,058 62,061 125,011 Demographics Property
Transcript of Retail Division FOR EASE PRPSED TE ILLAGE AT … EASE TE ILLAGE AT RESSI RA PALOMAR AIRPORT RD. ......
FOR LEASE THE VILLAGE AT BRESSI RANCH
PALOMAR AIRPORT RD. & EL FUERTE ST., CARLSBAD, CA 92011
Retail Division
Bruce Schiff +1 760 431 4207 [email protected] LIC #01232733
Phil Lyons +1 760 431 4210 [email protected] LIC #01237235
1000 Aviara Parkway, Suite 100, Carlsbad, CA 92011
T: +1 760 431 4200 F: +1 760 454 8369
www.dtz.com
PRO
POSE
D
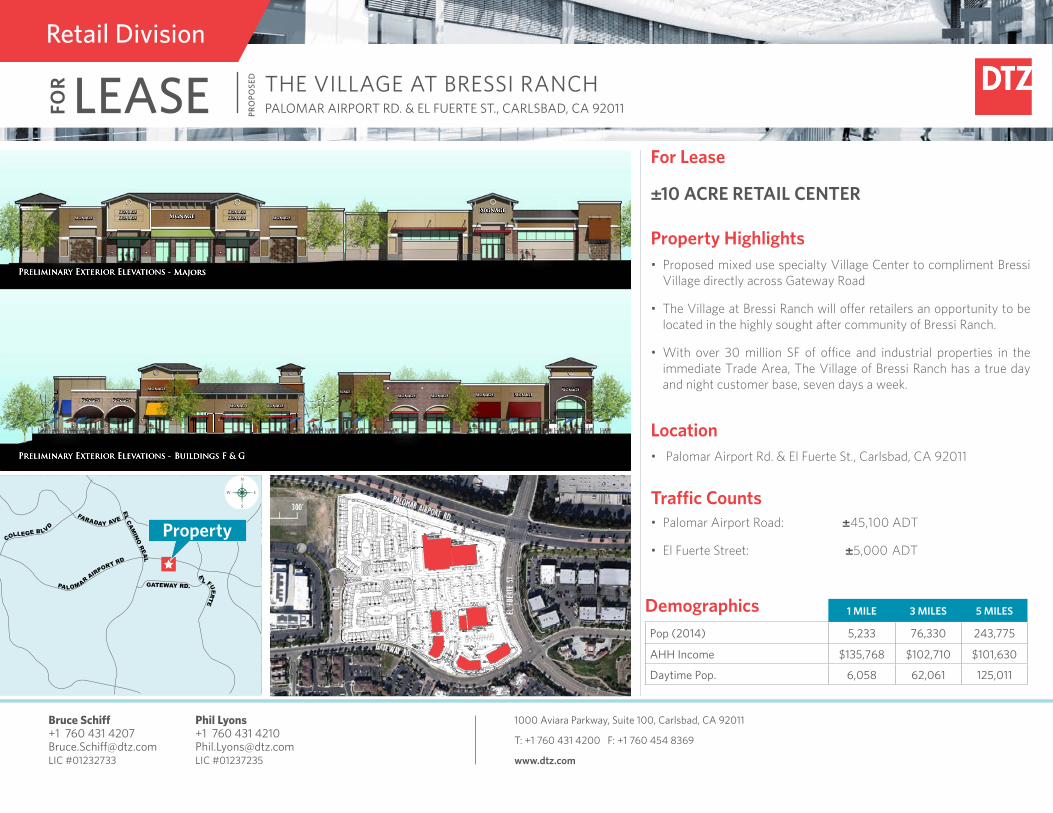
For Lease
• Proposed mixed use specialty Village Center to compliment Bressi Village directly across Gateway Road
• The Village at Bressi Ranch will offer retailers an opportunity to be located in the highly sought after community of Bressi Ranch.
• With over 30 million SF of office and industrial properties in the immediate Trade Area, The Village of Bressi Ranch has a true day and night customer base, seven days a week.
Property Highlights
• Palomar Airport Rd. & El Fuerte St., Carlsbad, CA 92011
Location
Traffic Counts• Palomar Airport Road: ±45,100 ADT
• El Fuerte Street: ±5,000 ADT
±10 ACRE RETAIL CENTER
FARADAY AVE
E
L FUERTE
PALOMAR AIRPORT RD
EL C
AMIN
O REA
L
COLLEGE BLVD
GATEWAY RD.
1 MILE 3 MILES 5 MILES
Pop (2014) 5,233 76,330 243,775
AHH Income $135,768 $102,710 $101,630
Daytime Pop. 6,058 62,061 125,011
Demographics
Property
FOR LEASE THE VILLAGE AT BRESSI RANCH
PALOMAR AIRPORT RD. & EL FUERTE ST., CARLSBAD, CA 92011
Retail Division
Bruce Schiff +1 760 431 4207 [email protected] LIC #01232733
Phil Lyons +1 760 431 4210 [email protected] LIC #01237235
1000 Aviara Parkway, Suite 100, Carlsbad, CA 92011
T: +1 760 431 4200 F: +1 760 454 8369
www.dtz.com
PRO
POSE
D
DISCLAIMER: This drawing is for general information purposes only. Any and all features, matters and other information depicted hereon or contained herein are for illustrative marketing purposes only, are subject to modification without notice, are not intended to be relied upon by any party and are not intended to constitute representations and warranties as to the size and nature of improvements to be constructed (or that any improvements will be constructed) or as to the identity or nature of any occupants thereof.
The information contained herein has been given to us by the owner of the property or other sources we deem reliable. We have no reason to doubt its accuracy, but we do not guarantee it. All information should be verified prior to purchase or lease. K:\_Retail Packages\BressiRanchCenter \Flyers\Bressiranchcenter_DTZ.indd
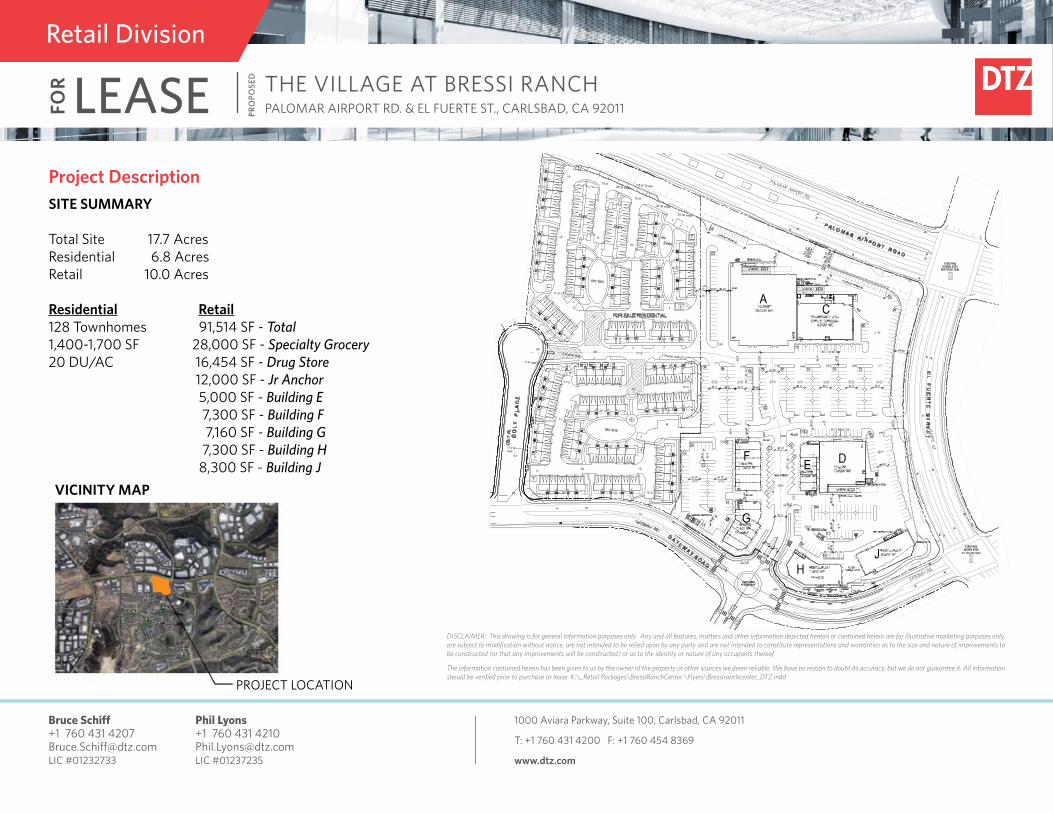
Project DescriptionSITE SUMMARY
Total Site 17.7 AcresResidential 6.8 AcresRetail 10.0 Acres
Residential Retail128 Townhomes 91,514 SF - Total1,400-1,700 SF 28,000 SF - Specialty Grocery20 DU/AC 16,454 SF - Drug Store 12,000 SF - Jr Anchor 5,000 SF - Building E 7,300 SF - Building F 7,160 SF - Building G 7,300 SF - Building H 8,300 SF - Building J
PROJECT LOCATION
VICINITY MAP
FOR LEASE THE VILLAGE AT BRESSI RANCH
PALOMAR AIRPORT RD. & EL FUERTE ST., CARLSBAD, CA 92011
Retail Division
Bruce Schiff +1 760 431 4207 [email protected] LIC #01232733
Phil Lyons +1 760 431 4210 [email protected] LIC #01237235
1000 Aviara Parkway, Suite 100, Carlsbad, CA 92011
T: +1 760 431 4200 F: +1 760 454 8369
www.dtz.com
PRO
POSE
D
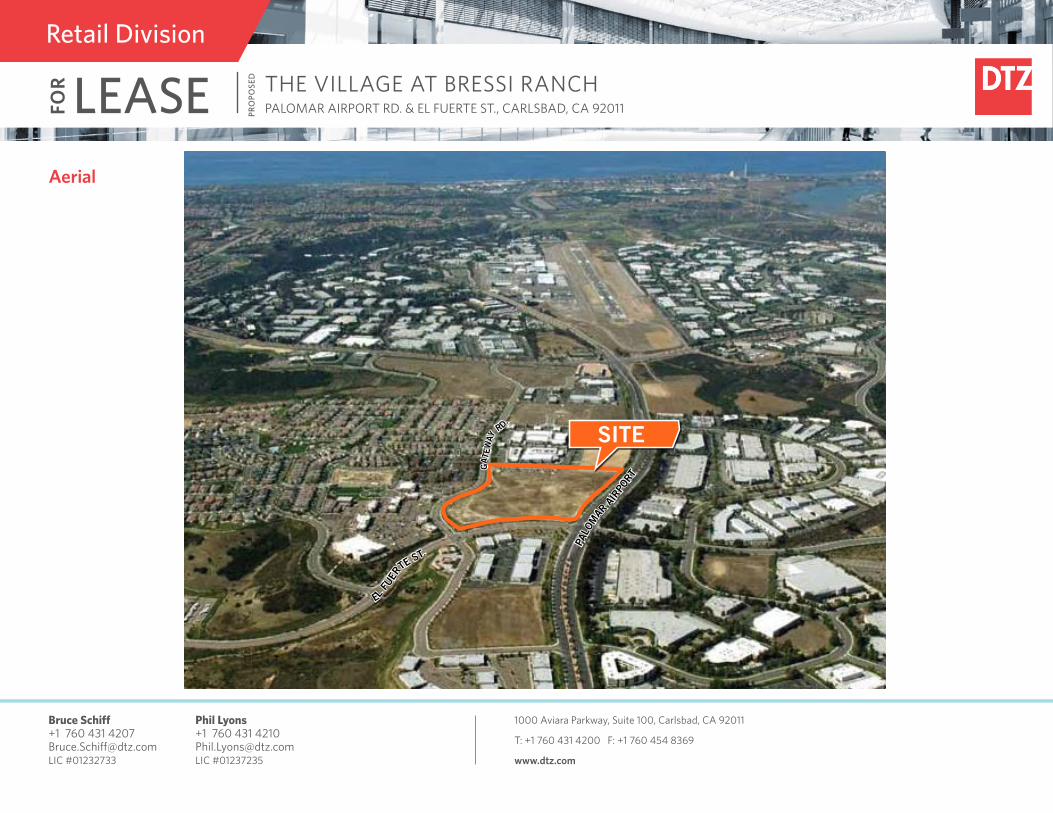
Aerial
SITE
EL FU
ER
TE ST.
PALO
MAR
AIR
PORT
GAT
EW
AY
RD.
FOR LEASE THE VILLAGE AT BRESSI RANCH
PALOMAR AIRPORT RD. & EL FUERTE ST., CARLSBAD, CA 92011
Retail Division
Bruce Schiff +1 760 431 4207 [email protected] LIC #01232733
Phil Lyons +1 760 431 4210 [email protected] LIC #01237235
1000 Aviara Parkway, Suite 100, Carlsbad, CA 92011
T: +1 760 431 4200 F: +1 760 454 8369
www.dtz.com
PRO
POSE
D
L:\BSchiff\AERIALS\Carlsbad_5 Mile Radius
XX
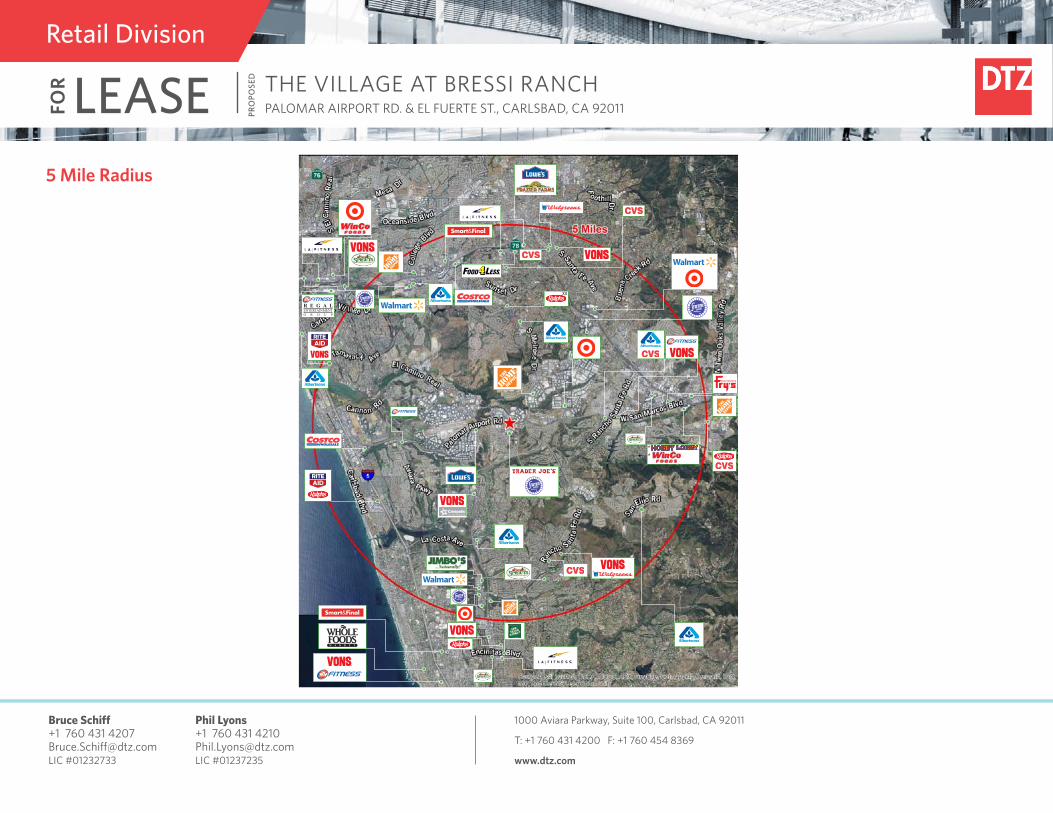
*: ProposedXX: Closing 3/2014
**
R E G A LENTERTAINMENTG R O U P
5 Mile Radius
FOR LEASE THE VILLAGE AT BRESSI RANCH
PALOMAR AIRPORT RD. & EL FUERTE ST., CARLSBAD, CA 92011
Retail Division
Bruce Schiff +1 760 431 4207 [email protected] LIC #01232733
Phil Lyons +1 760 431 4210 [email protected] LIC #01237235
1000 Aviara Parkway, Suite 100, Carlsbad, CA 92011
T: +1 760 431 4200 F: +1 760 454 8369
www.dtz.com
PRO
POSE
D
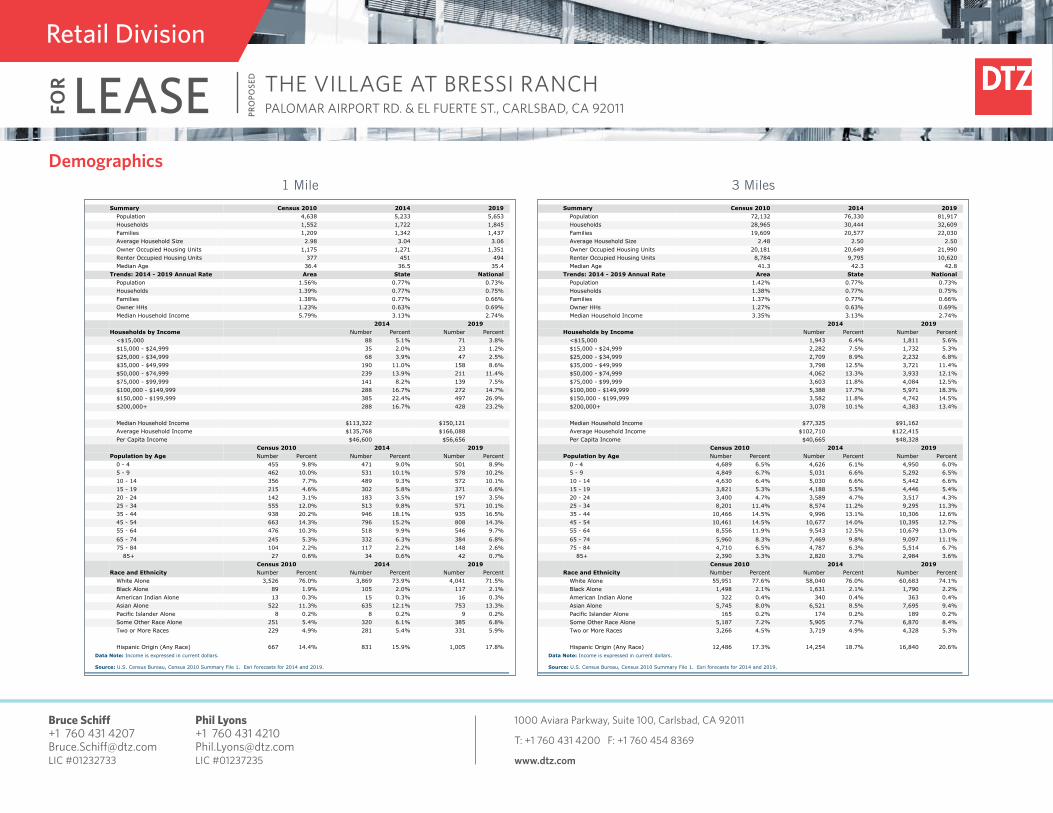
Demographics Demographic and Income ProfilePalomar Airport Rd %26 El Fuerte St2791 Loker Ave W, Carlsbad, California, 92010 Latitude: 33.12994Ring: 1 mile radius Longitude: -117.25273
Summary Census 2010 2014 2019Population 4,638 5,233 5,653Households 1,552 1,722 1,845Families 1,209 1,342 1,437Average Household Size 2.98 3.04 3.06Owner Occupied Housing Units 1,175 1,271 1,351Renter Occupied Housing Units 377 451 494Median Age 36.4 36.5 35.4
Trends: 2014 - 2019 Annual Rate Area State NationalPopulation 1.56% 0.77% 0.73%Households 1.39% 0.77% 0.75%Families 1.38% 0.77% 0.66%Owner HHs 1.23% 0.63% 0.69%Median Household Income 5.79% 3.13% 2.74%
2014 2019 Households by Income Number Percent Number Percent
<$15,000 88 5.1% 71 3.8%$15,000 - $24,999 35 2.0% 23 1.2%$25,000 - $34,999 68 3.9% 47 2.5%$35,000 - $49,999 190 11.0% 158 8.6%$50,000 - $74,999 239 13.9% 211 11.4%$75,000 - $99,999 141 8.2% 139 7.5%$100,000 - $149,999 288 16.7% 272 14.7%$150,000 - $199,999 385 22.4% 497 26.9%$200,000+ 288 16.7% 428 23.2%
Median Household Income $113,322 $150,121Average Household Income $135,768 $166,088Per Capita Income $46,600 $56,656
Census 2010 2014 2019 Population by Age Number Percent Number Percent Number Percent
0 - 4 455 9.8% 471 9.0% 501 8.9%5 - 9 462 10.0% 531 10.1% 578 10.2%10 - 14 356 7.7% 489 9.3% 572 10.1%15 - 19 215 4.6% 302 5.8% 371 6.6%20 - 24 142 3.1% 183 3.5% 197 3.5%25 - 34 555 12.0% 513 9.8% 571 10.1%35 - 44 938 20.2% 946 18.1% 935 16.5%45 - 54 663 14.3% 796 15.2% 808 14.3%55 - 64 476 10.3% 518 9.9% 546 9.7%65 - 74 245 5.3% 332 6.3% 384 6.8%75 - 84 104 2.2% 117 2.2% 148 2.6%
85+ 27 0.6% 34 0.6% 42 0.7%Census 2010 2014 2019
Race and Ethnicity Number Percent Number Percent Number PercentWhite Alone 3,526 76.0% 3,869 73.9% 4,041 71.5%Black Alone 89 1.9% 105 2.0% 117 2.1%American Indian Alone 13 0.3% 15 0.3% 16 0.3%Asian Alone 522 11.3% 635 12.1% 753 13.3%Pacific Islander Alone 8 0.2% 8 0.2% 9 0.2%Some Other Race Alone 251 5.4% 320 6.1% 385 6.8%Two or More Races 229 4.9% 281 5.4% 331 5.9%
Hispanic Origin (Any Race) 667 14.4% 831 15.9% 1,005 17.8%Data Note: Income is expressed in current dollars.
Source: U.S. Census Bureau, Census 2010 Summary File 1. Esri forecasts for 2014 and 2019.
January 21, 2015
©2014 Esri Page 1 of 6
Demographic and Income ProfilePalomar Airport Rd %26 El Fuerte St2791 Loker Ave W, Carlsbad, California, 92010 Latitude: 33.12994Ring: 3 mile radius Longitude: -117.25273
Summary Census 2010 2014 2019Population 72,132 76,330 81,917Households 28,965 30,444 32,609Families 19,609 20,577 22,030Average Household Size 2.48 2.50 2.50Owner Occupied Housing Units 20,181 20,649 21,990Renter Occupied Housing Units 8,784 9,795 10,620Median Age 41.3 42.3 42.8
Trends: 2014 - 2019 Annual Rate Area State NationalPopulation 1.42% 0.77% 0.73%Households 1.38% 0.77% 0.75%Families 1.37% 0.77% 0.66%Owner HHs 1.27% 0.63% 0.69%Median Household Income 3.35% 3.13% 2.74%
2014 2019 Households by Income Number Percent Number Percent
<$15,000 1,943 6.4% 1,811 5.6%$15,000 - $24,999 2,282 7.5% 1,732 5.3%$25,000 - $34,999 2,709 8.9% 2,232 6.8%$35,000 - $49,999 3,798 12.5% 3,721 11.4%$50,000 - $74,999 4,062 13.3% 3,933 12.1%$75,000 - $99,999 3,603 11.8% 4,084 12.5%$100,000 - $149,999 5,388 17.7% 5,971 18.3%$150,000 - $199,999 3,582 11.8% 4,742 14.5%$200,000+ 3,078 10.1% 4,383 13.4%
Median Household Income $77,325 $91,162Average Household Income $102,710 $122,415Per Capita Income $40,665 $48,328
Census 2010 2014 2019 Population by Age Number Percent Number Percent Number Percent
0 - 4 4,689 6.5% 4,626 6.1% 4,950 6.0%5 - 9 4,849 6.7% 5,031 6.6% 5,292 6.5%10 - 14 4,630 6.4% 5,030 6.6% 5,442 6.6%15 - 19 3,821 5.3% 4,188 5.5% 4,446 5.4%20 - 24 3,400 4.7% 3,589 4.7% 3,517 4.3%25 - 34 8,201 11.4% 8,574 11.2% 9,295 11.3%35 - 44 10,466 14.5% 9,996 13.1% 10,306 12.6%45 - 54 10,461 14.5% 10,677 14.0% 10,395 12.7%55 - 64 8,556 11.9% 9,543 12.5% 10,679 13.0%65 - 74 5,960 8.3% 7,469 9.8% 9,097 11.1%75 - 84 4,710 6.5% 4,787 6.3% 5,514 6.7%
85+ 2,390 3.3% 2,820 3.7% 2,984 3.6%Census 2010 2014 2019
Race and Ethnicity Number Percent Number Percent Number PercentWhite Alone 55,951 77.6% 58,040 76.0% 60,683 74.1%Black Alone 1,498 2.1% 1,631 2.1% 1,790 2.2%American Indian Alone 322 0.4% 340 0.4% 363 0.4%Asian Alone 5,745 8.0% 6,521 8.5% 7,695 9.4%Pacific Islander Alone 165 0.2% 174 0.2% 189 0.2%Some Other Race Alone 5,187 7.2% 5,905 7.7% 6,870 8.4%Two or More Races 3,266 4.5% 3,719 4.9% 4,328 5.3%
Hispanic Origin (Any Race) 12,486 17.3% 14,254 18.7% 16,840 20.6%Data Note: Income is expressed in current dollars.
Source: U.S. Census Bureau, Census 2010 Summary File 1. Esri forecasts for 2014 and 2019.
January 21, 2015
©2014 Esri Page 3 of 6
1 Mile 3 Miles
FOR LEASE THE VILLAGE AT BRESSI RANCH
PALOMAR AIRPORT RD. & EL FUERTE ST., CARLSBAD, CA 92011
Retail Division
Bruce Schiff +1 760 431 4207 [email protected] LIC #01232733
Phil Lyons +1 760 431 4210 [email protected] LIC #01237235
1000 Aviara Parkway, Suite 100, Carlsbad, CA 92011
T: +1 760 431 4200 F: +1 760 454 8369
www.dtz.com
PRO
POSE
D
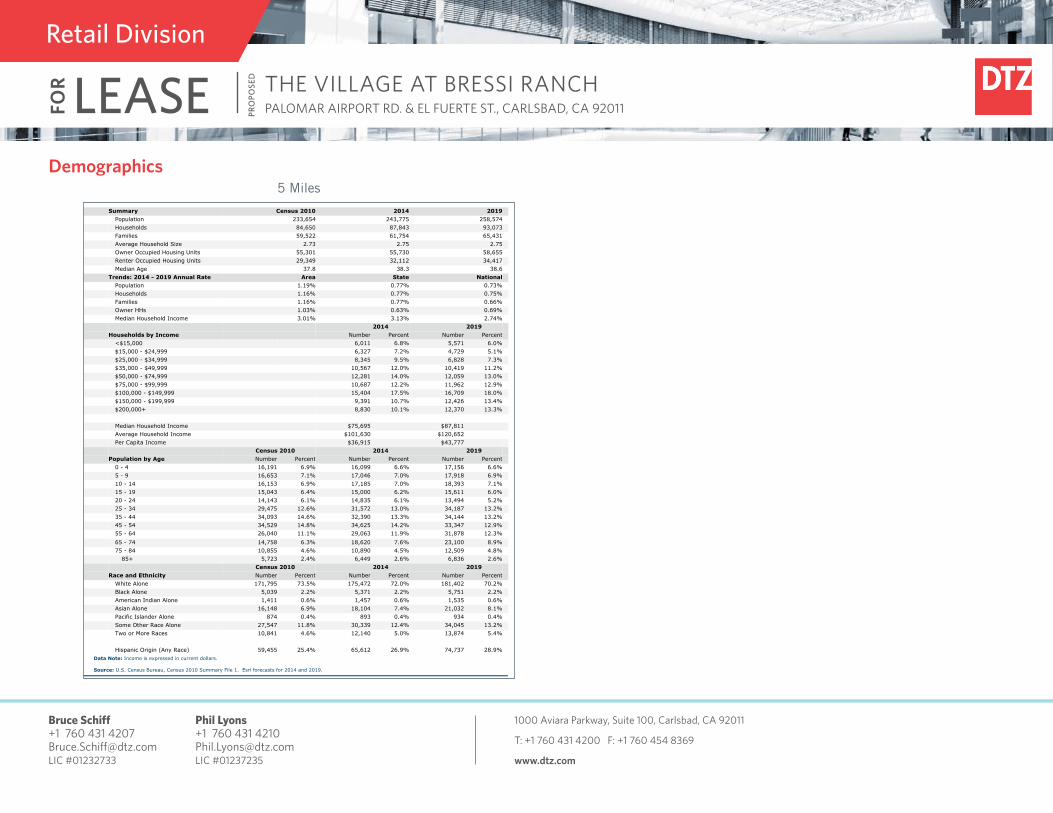
Demographics Demographic and Income ProfilePalomar Airport Rd %26 El Fuerte St2791 Loker Ave W, Carlsbad, California, 92010 Latitude: 33.12994Ring: 5 mile radius Longitude: -117.25273
Summary Census 2010 2014 2019Population 233,654 243,775 258,574Households 84,650 87,843 93,073Families 59,522 61,754 65,431Average Household Size 2.73 2.75 2.75Owner Occupied Housing Units 55,301 55,730 58,655Renter Occupied Housing Units 29,349 32,112 34,417Median Age 37.8 38.3 38.6
Trends: 2014 - 2019 Annual Rate Area State NationalPopulation 1.19% 0.77% 0.73%Households 1.16% 0.77% 0.75%Families 1.16% 0.77% 0.66%Owner HHs 1.03% 0.63% 0.69%Median Household Income 3.01% 3.13% 2.74%
2014 2019 Households by Income Number Percent Number Percent
<$15,000 6,011 6.8% 5,571 6.0%$15,000 - $24,999 6,327 7.2% 4,729 5.1%$25,000 - $34,999 8,345 9.5% 6,828 7.3%$35,000 - $49,999 10,567 12.0% 10,419 11.2%$50,000 - $74,999 12,281 14.0% 12,059 13.0%$75,000 - $99,999 10,687 12.2% 11,962 12.9%$100,000 - $149,999 15,404 17.5% 16,709 18.0%$150,000 - $199,999 9,391 10.7% 12,426 13.4%$200,000+ 8,830 10.1% 12,370 13.3%
Median Household Income $75,695 $87,811Average Household Income $101,630 $120,652Per Capita Income $36,915 $43,777
Census 2010 2014 2019 Population by Age Number Percent Number Percent Number Percent
0 - 4 16,191 6.9% 16,099 6.6% 17,156 6.6%5 - 9 16,653 7.1% 17,046 7.0% 17,918 6.9%10 - 14 16,153 6.9% 17,185 7.0% 18,393 7.1%15 - 19 15,043 6.4% 15,000 6.2% 15,611 6.0%20 - 24 14,143 6.1% 14,835 6.1% 13,494 5.2%25 - 34 29,475 12.6% 31,572 13.0% 34,187 13.2%35 - 44 34,093 14.6% 32,390 13.3% 34,144 13.2%45 - 54 34,529 14.8% 34,625 14.2% 33,347 12.9%55 - 64 26,040 11.1% 29,063 11.9% 31,878 12.3%65 - 74 14,758 6.3% 18,620 7.6% 23,100 8.9%75 - 84 10,855 4.6% 10,890 4.5% 12,509 4.8%
85+ 5,723 2.4% 6,449 2.6% 6,836 2.6%Census 2010 2014 2019
Race and Ethnicity Number Percent Number Percent Number PercentWhite Alone 171,795 73.5% 175,472 72.0% 181,402 70.2%Black Alone 5,039 2.2% 5,371 2.2% 5,751 2.2%American Indian Alone 1,411 0.6% 1,457 0.6% 1,535 0.6%Asian Alone 16,148 6.9% 18,104 7.4% 21,032 8.1%Pacific Islander Alone 874 0.4% 893 0.4% 934 0.4%Some Other Race Alone 27,547 11.8% 30,339 12.4% 34,045 13.2%Two or More Races 10,841 4.6% 12,140 5.0% 13,874 5.4%
Hispanic Origin (Any Race) 59,455 25.4% 65,612 26.9% 74,737 28.9%Data Note: Income is expressed in current dollars.
Source: U.S. Census Bureau, Census 2010 Summary File 1. Esri forecasts for 2014 and 2019.
January 21, 2015
©2014 Esri Page 5 of 6
5 Miles