
Retail Development Draft Market Study
94
BRAILSFORD & DUNLAVEY Retail Development Draft Market Study March, 2008 © Brailsford & Dunlavey, Inc. 2008
Transcript of Retail Development Draft Market Study
BRAILSFORD & DUNLAVEY
Retail Development
Draft Market Study March, 2008
© Brailsford & Dunlavey, Inc. 2008

TABLE OF CONTENTS
Florida International University Retail Demand Study 1
SECTION
1 Executive Summary 2 Existing Conditions / Supply Analysis 3 Demand Analysis - University Village/Main Street
4 Demand Analysis - 8th Street Project
EXHIBITS A Best Practices B Stakeholder / Focus Group Interviews C Quantitative Demographic and Economic Data D Management Options


Section 1


EXECUTIVE SUMMARY
Florida International University Retail Demand Study 1
Introduction In January 2008, Brailsford & Dunlavey (B&D) was engaged by Florida International University (FIU) to study the retail potential of two distinct projects on the University Park campus. Current Situation FIU is Miami-Dade County’s first public, four-year university and is one of the largest universities in the nation. Since its founding in 1965 and its opening class in 1972, the school has grown to over 38,000 students on two campuses. The University Park campus has seen significant growth over the last 30 years, and it has recently been awarded the country’s 127th medical school. As such, the campus is planning to build significant research, academic, and health facilities on the northeast portion of the campus. To serve this growing campus, FIU will need additional food and retail options. The Work Plan B&D conducted six distinct analyses to determine the market demand for new retail spaces on the FIU campus, including:
• A series of student and faculty/staff focus groups and random intercept interviews to gain qualitative information regarding retail activities, spending and possible facility enhancements;
• Case studies of seven other institutions to understand best practices across the country;
• An on- and off-campus supply analysis to determine the locations of retail, and dining
amenities in and around the University Park campus;
• A preliminary demand analysis of potential retail opportunities on the University Park campus;
• A preliminary financial analysis of potential ground lease revenue for a retail
development on the northern portion of the campus; and
• Preliminary management options that the University should consider if it moves forward with the projects.
EXECUTIVE SUMMARY
Florida International University 2 Retail Demand Study
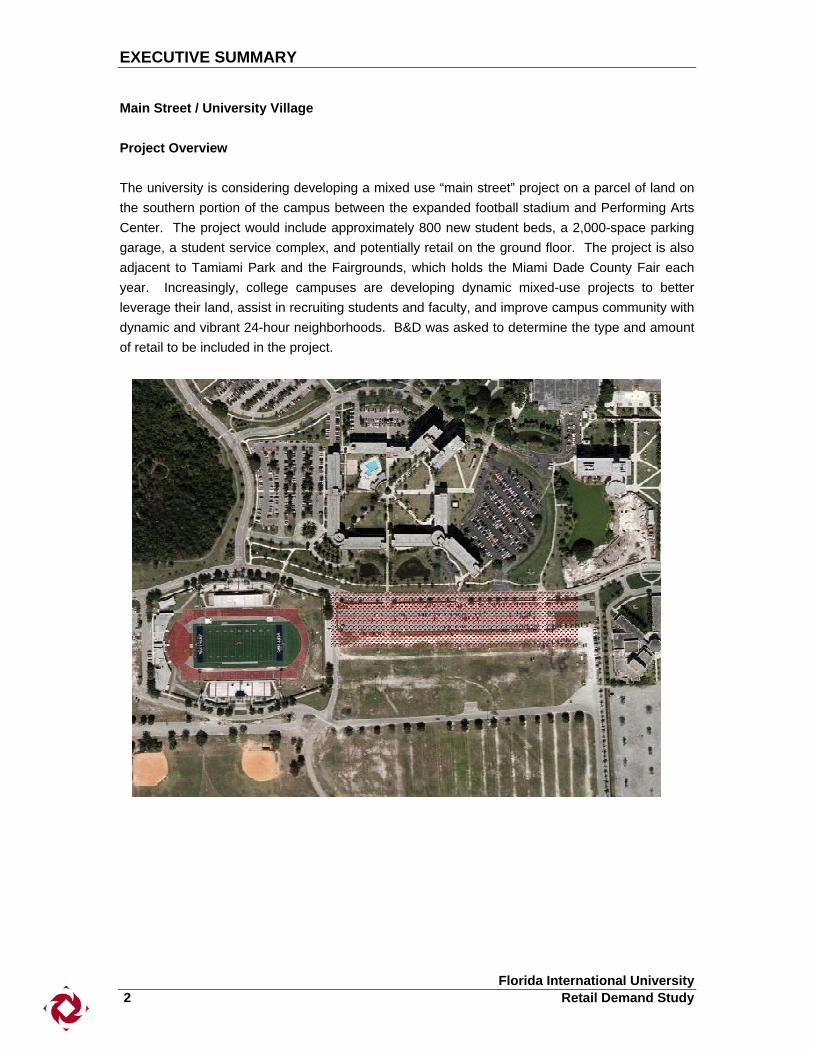
Main Street / University Village Project Overview The university is considering developing a mixed use “main street” project on a parcel of land on the southern portion of the campus between the expanded football stadium and Performing Arts Center. The project would include approximately 800 new student beds, a 2,000-space parking garage, a student service complex, and potentially retail on the ground floor. The project is also adjacent to Tamiami Park and the Fairgrounds, which holds the Miami Dade County Fair each year. Increasingly, college campuses are developing dynamic mixed-use projects to better leverage their land, assist in recruiting students and faculty, and improve campus community with dynamic and vibrant 24-hour neighborhoods. B&D was asked to determine the type and amount of retail to be included in the project.
EXECUTIVE SUMMARY
Florida International University Retail Demand Study 3
Project Drivers & Intended Outcomes B&D worked with a committee made up of FIU stakeholders, and the following drivers and outcomes were identified for the Main Street / University Village project: Drivers
Meet the growing retail and dining needs in the southern part of campus. Develop a dynamic mixed use neighborhood that will give FIU a competitive on-campus
amenity. Have long-term viability and be self-sustaining.
Outcomes
Generate additional revenues for campus. Encourage the Miami community to discover the campus. Capitalize on the synergies between the football stadium, PAC, new student support
center, and Frost Museum of the Art. Provide long-term parking and housing solutions.
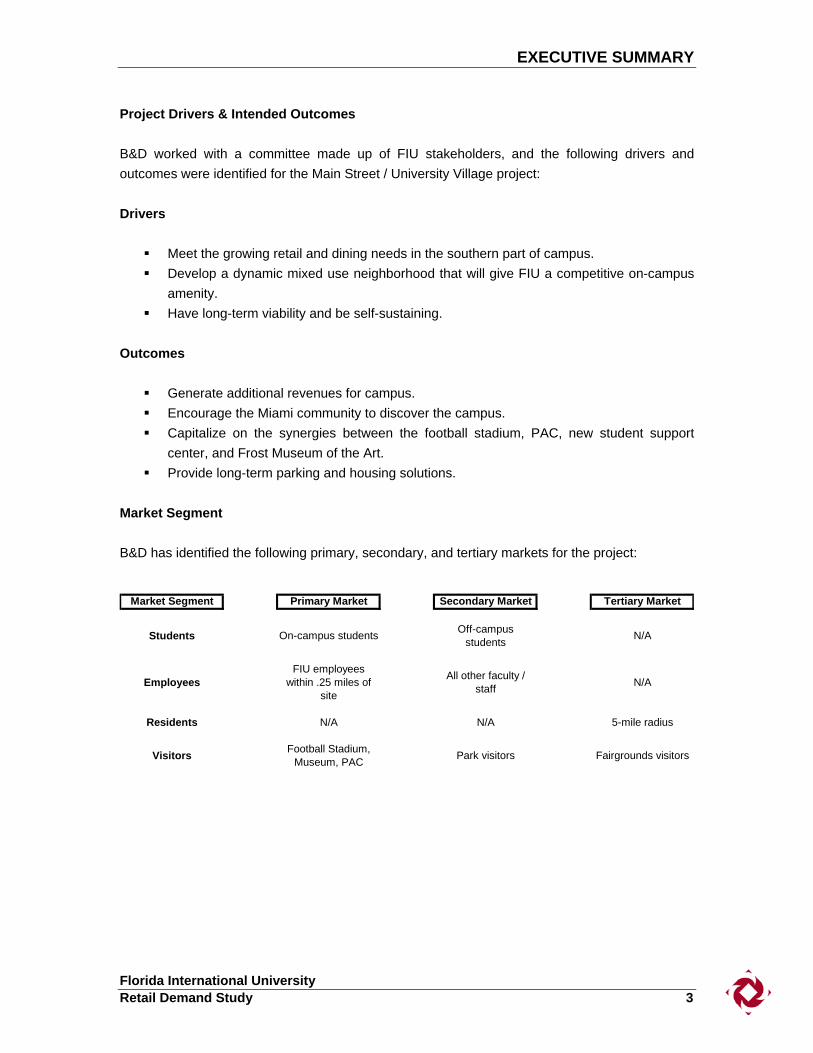
Market Segment B&D has identified the following primary, secondary, and tertiary markets for the project:
Market Segment Primary Market Secondary Market Tertiary Market
Students On-campus students Off-campus students N/A
EmployeesFIU employees
within .25 miles of site
All other faculty / staff N/A
Residents N/A N/A 5-mile radius
Visitors Football Stadium, Museum, PAC Park visitors Fairgrounds visitors

EXECUTIVE SUMMARY
Florida International University 4 Retail Demand Study
Findings & Recommendations Based on the limited community access and visibility, it is clear that this project will need to be primarily internally focused to the FIU campus population. While the expanded football stadium and PAC will attract the community, the core traffic and revenue generation to the project will come from the existing campus population. The primary market will be FIU’s growing on-campus population. With currently over 2,000 beds in that portion of campus plus an additional 800 planned beds, the project will have an active 24-hour population from which to draw. While the project will certainly be attractive to on-campus students particularly in the evening, the key to the overall success of the project will be to develop anchors that will help drive commuters, faculty/staff, and other visitors to the project during the key daytime hours. Based on the current campus configuration, this will be no small feat. To do that, B&D recommends that the project include two anchors to support its overall success. The most ideal anchors for the project will be large lecture halls/classrooms to help pull students during the day, and new dining venues, which will provide attractive alternatives to the overcrowded food concepts at the Graham Center and generate additional revenue from game-day traffic. Other potential retail ideas on main street include a convenience store, coffeehouse/performance venue, satellite bookstore, Fedex/Kinkos, greek store, diner, and a relocated rathskeller. In addition to retail, other concepts to help generate traffic (but not revenue) would be more student organization space, meeting rooms, and a parking/transportation hub. Overall, the main street project on this site can be successful and self-sustaining if it focuses on a town center concept with mostly neighborhood-oriented retail, 800 beds of student housing, parking, and two strong anchors as discussed above. Based on our preliminary demand analysis, the campus should plan for approximately 30,000-40,000 square feet of retail in the Main Street / University Village location. There was some discussion at the conclusion of the study of the possibility of the parking being relocated to a different location. Clearly, this will have an impact on the vibrancy of main street as the original intent was to have pedestrians move through main street after parking their car. The residential student retail demand would not be as affected by the parking relocation; however, proximity to parking will be critical to their interest in living in the main street housing.

EXECUTIVE SUMMARY
Florida International University Retail Demand Study 5
8th Street Project Project Overview The campus was recently approved as the first public medical school in south Florida and the 127th in the country. As part of that initiative, the campus is developing the northeast portion of the campus for its academic health science campus. Part of the plan is to include a new Miami Dade Health Center, an ambulatory care center, and other academic and support facilities. Currently, Perkins+Will is developing a Master Plan for the northeast portion of the campus, and B&D was asked to determine the type and amount of retail for that portion of the campus.

EXECUTIVE SUMMARY
Florida International University 6 Retail Demand Study
Project Drivers & Intended Outcomes Similar to the Main Street project, B&D worked with a committee comprised of FIU stakeholders, and the following drivers and outcomes were identified for the 8th Street project: Drivers
Support the growing retail and dining needs of the new Academic Health Sciences Center population on the northeast side of campus.
Generate additional revenues for the campus. Outcomes
Create a competitive advantage for FIU. Encourage the Miami community to discover the campus. Capitalize on the growing community retail and dining needs of the University area. Increase the number of retail dining options for the rest of the campus.
B&D has identified the following primary, secondary, and tertiary markets for the 8th Street project:
Market Segment Primary Market Secondary Market Tertiary Market
Students Students within .25 miles of site All ofther students
Employees New AHSC employees
All other faculty / staff
Residents 10-minute drive 20-minute drive 30-minute drive
Visitors Clinic Visitors Campus Visitors

EXECUTIVE SUMMARY
Florida International University Retail Demand Study 7
Findings & Recommendations It is clear that there will be additional demand for retail and food on the northeast portion of campus after the development of the new academic health sciences facilities. To estimate demand, B&D developed a model for the internal demand (campus) and external demand (community) assuming that the project would have visibility and access off of 8th Street. Internal (Campus) Market With the growth of the new employees and students on that portion of campus, it is estimated that there will be over 2,800 employees and students in that precinct over campus in the next five years. Based on typical spending patterns, the estimated retail campus need in 2017 is approximately 32,000 gross square feet. At full campus build out, assuming all projects are completed, the resultant retail demand could be closer to 60,000-80,000 gross square feet.
Total On-Campus Retail Demand
2012 2017Total Annual Spending Per Person $3,350 $3,884
AHSC Faculty / Staff 687 864Miami-Date County Public Health Employees 700 811Ambulatory Care Clinic 300 348Medical Students 160 480Faculty / Staff within .25 miles 327 379
Total Population 2,174 2,882
Retail Sales / SF $350 $350Resultant Retail Space Demand 21,000 32,000

EXECUTIVE SUMMARY
Florida International University 8 Retail Demand Study
External (Community) Market With its large and diverse population, Miami has a strong and active retail market. While the retail market is starting to scale back due to a general slowdown in the economy and consumer spending, the long-term prognosis for the retail market in Miami remains strong. The primary community target market for the 8th Street retail project is a 10-minute drive time, or 5 miles away from the campus. Overall, there is significant income and population growth to support additional retail in the market. Based on population growth over the next five years, it is estimated that an additional 323,000 square feet of retail is needed within the target market. Assuming a 20%-30% penetration rate for this project, the resultant retail demand is approximately 80,000-110,000 gross square feet. Should the campus proceed with a large-scale retail project to attract the community, it may want to consider combining the retail project with the new proposed campus hotel, new graduate student housing, sit-down restaurants, a natural foods grocery store, and possibly an expanded campus bookstore with a large medical component. Many similar projects have included campus bookstores since they often make a strong anchor for the development. The ability for the campus to “sweeten the pot” by increasing the density of the project will improve the overall value to developers, and subsequently the overall ground lease revenue to the campus. The challenge for this project for FIU is to balance the needs of the growing University with the ability to provide attractive, visible, and accessible retail from the street. Developers will require surface parking, easy access, and potentially different design standards than the campus. The most valuable campus real estate from a retail perspective is the corner of 8th Street and 107th St, which would significantly alter the current Perkins+Will Master Plan. It is our recommendation that the University focus this project on the internal campus demand and reorient the retail inward to best serve that population. With the limited campus acreage available, the value of any annual ground lease revenue is probably not worth the tradeoffs required by the campus to make the retail viable. For a larger retail development, the campus may want to consider partnering with the town of Sweetwater to enhance their campus town project across of 8th Street.

EXECUTIVE SUMMARY
Florida International University Retail Demand Study 9
Additional Options B&D was asked to review whether other options are more appropriate. A total of three options were identified: Option A: Proposed location on 8th Street adjacent to proposed parking garage. Option B: A corner location on 8th Street and 107th St. Option C: Internal to AHSC Neighborhood The following matrix summarizes each of the potential options:
Scenarios Retail Demand (SF) Comments
Options Location Target Market AnchorsUniversity Operated
Special Purpose
EntityThird Party Developer
Risk(High, Moderate,
Low)
Return (High,Moderate,
Low)
A8th Street Adjacent
to New Parking
5 mile radius - Sweetwater,
Doral, Kendall
Sit down restaurants and Medical Supply Store (Bookstore branch) ü High Moderate 84,000 - 113,000
Limited Visibility and access are chief concerns
BCorner
8th St. & 107
5 mile radius - Sweetwater,
Doral, Kendall
Sit down restaurants and Medical Supply Store (Bookstore branch) ü Moderate Highest 84,000 - 113,000 Most ideal site from a retail perspective
C 32,000 Most ideal location for new AHSC populationInternal to AHSC
Neighborhood Internal ü Low
Academic Health Science Complex
Management OptionsSite FinancialMarketing Strategy
Next Steps The following next steps should occur:
Refine recommendations based on findings from the Aramark study and B&D’s student housing market study.
Refine the concepts and demand figures based on a quantitative survey of the FIU population.
Coordinate with Perkins+Will to ensure that adequate retail space is included in their master plan.
Develop a detailed financial analysis of the proposed project.


Section 2


EXISTING CONDITIONS / SUPPLY ANALYSIS
Florida International University Retail Demand Study 1
Objectives The objective of the Market Supply portion of the Market Analysis was to define the overall nature and competitiveness of the retail market on FIU’s campus as well as the market proximate to the University as it exists presently and as it may exist in the future. This information is necessary to provide context when gauging the viability of new retail development at FIU. The analysis specifically addressed the character of available retail, the location and quantities of specific product types, and typical lease rates. Incorporation of each of these factors into the analysis was instrumental in predicting the likely requirements, marketability, and competitiveness of the proposed project. Methodology B&D conducted an analysis of both the on and off-campus retail markets to evaluate the retails options in the target market area. The on-campus (internal) retail research included a review of on-campus retail sales number, tour of retail options, and conversations with Aramark and university administrators. Components of the off-campus (external) research included interviews with leasing agents, tours of facilities, and Internet research. Representatives from FIU, as well as professionals in the local property management community, assisted the project team in the development of a comparable retailers / properties list. A total of 14 ‘comparable’ rental properties were researched within the target market area. The properties were evaluated and categorized based on their market segment type. Definitions for the different property types are listed below. Internal Supply FIU has a significant retail operation on its University Park campus. Primarily concentrated within the Graham Center, the retail options generally serve the campus population. Sales figures for all retail and dining establishments totaled nearly $28 million in 2006-2007 or $312 per square foot. The sales per square foot at FIU is generally higher than the average for universities similar to FIU. Non-Food Retail FIU has a robust retail and dining operation on campus. Mostly located at the Graham Center, retail options include the campus bookstore, a dry cleaners, a salon, a copy shop, a flower shop and a travel agency. The campus bookstore is the main retail anchor at the Graham Center, driving approximately $15,942,725 in sales for 2006-2007. The average sales at the bookstore are a respectable $332 per square foot. Non-bookstore retail on campus is strong averaging $440 per square foot with total sales at $2,366,725.

EXISTING CONDITIONS / SUPPLY ANALYSIS
Florida International University 2 Retail Demand Study
Non Food Retail Sales
Square Feet
Sales 2006-2007
Sales / SF
Bookstore 48,026 $15,942,725 $332Afrodita's 468 $71,466 $153Copy Center 991 N/A N/ACredit Union 1,408 N/A N/ASanti's 1,063 $662,603 $623Travel 468 $1,443,339 $3,084Waves 987 $189,317 $192
Total 53,411 $18,309,450 $343
FIGURE: 2.1: Total non food retail sales for 2006-2007. As the campus grows and retail demand increases, it is expected that the additional retail space will be placed all across the campus to meet the demand of the immediate populations. Food Services Food service options on campus are also mostly centered around the Graham Center. Managed by Aramark, current options include Fresh Foods; fast food such as Subway, Burger King, Pollo Tropical and Einstein Bagels; and various coffee and convenience vendors such as Starbucks, Bustelo Coffee, Java City and the Breezeway convenience store. The food service sales were also strong for 2006-2007 with total sales at $8,457,027 or $238 per square foot.

EXISTING CONDITIONS / SUPPLY ANALYSIS
Florida International University Retail Demand Study 3
Food Services Sales
Square Feet
Sales 2006-2007 Sales / SF
Fresh Foods 17,670 $1,020,342 $58Subway 1,238 $841,542 $680Burger King 400 $277,558 $694Pollo Tropical 1,129 $615,993 $546Gracie's Grill 5,072 $182,322 $36Faculty Club 4,142 $119,180 $29Catering 0 $636,449 $0Einstein Bagels 605 $328,491 $543Camille's 1,100 $155,463 $141Bene Pizza 119 $147,009 $1,235Sushi 337 $216,693 $643Bustelo 360 $156,530 $435Java City GC/Vending 360 $0 $0Java City Library 100 $449,426 $4,494Starbucks - Library 1,446 $35,535 $25Breezeway-Convenience 1,440 $567,484 $394Remotes - West Side 50 $0 $0Meal Plans 0 $2,707,009 $0
Total 35,568 $8,457,027 $238
FIGURE 2.2: Total food service sales for 2006-2007. The average sales per square foot at FIU are significantly higher when compared to universities of similar size and demographics. FIU’s sales for food service including meal plans are $267 per square foot when the national average is in the $180-$200 per square foot range. This indicates that some of the existing food services facilities are over-subscribed.
Total Food Service Sales Per Square Foot
Average Sales / SF
Total Food Service Square Feet 35,568Total Food Service Sales $6,784,906 $191Total Sales w/Meal Plan $9,491,915 $267
National Range $180 - $200
FIGURE 2.3: Total food service sales per square foot for 2006-2007.

EXISTING CONDITIONS / SUPPLY ANALYSIS
Florida International University 4 Retail Demand Study
Another significant source of revenue on campus is vending machine sales. For 2006-2007, the campus had 180 machines that generated $1,034,888 in sales. This is exceptionally high and indicates that there is additional demand for more retail outlets on campus.
Retail and Food Services Sales
Square Feet Sales Sales / SFBookstore 48,026 $15,942,725 $332Food Services 35,568 $8,457,027 $238Other Retail 5,385 $2,366,725 $440Vending - $1,034,888 -
Total 88,979 $27,801,365 $312
FIGURE 2.4: Total retail and food service sales for 2006-2007. Market Area Overview According to the Urban Land Institute, there are five types of shopping center types, each distinctive in its own function. In all cases, a shopping center’s type and function are determined by its major tenant or tenants and the size of its trade area; they are never based solely on the area of the site or the square footage of the structure. All five categories of shopping centers exist within the market area, many in close proximity to FIU. The five types of retail developments are outlined in the chart below:

EXISTING CONDITIONS / SUPPLY ANALYSIS
Florida International University Retail Demand Study 5
Shopping Center Definitions
Size (SF) Typical Tenants
Convenience 0 - 29,000 Convenience StoreDry CleanersFast FoodCoffee Shop
Neighborhood 30,000 - 99,000 Super MarketPharmacyFast FoodSit-Down Restaurant
Community 100,00 - 249,000 Super MarketBig Box RetailersRestaurants
Regional 250,000 - 749,000 Big Box RetailersDiscount RetailersRestaurantsEntertainment
Super - Regional 750,000 + Traditional Mall
FIGURE 2.5: Shopping Center Definitions. Convenience Centers A convenience center provides for the sale of personal services and convenience goods similar to those of a neighborhood center. It contains a minimum of three stores, with a total gross leasable area of up to 30,000 square feet. Convenience centers are typically anchored by some type of personal or convenience services such as a mini-market. There are numerous examples of convenience centers within the target market, but they are insignificant for the purposes of this study.

EXISTING CONDITIONS / SUPPLY ANALYSIS
Florida International University 6 Retail Demand Study
Neighborhood Centers A neighborhood center provides for the sale of convenience goods (foods, drugs, and sundries) and personal services (laundry and dry cleaning, barbering, shoe repair, etc.) for the day-to-day living needs of the immediate neighborhood. It is built around a supermarket as the principal tenant and typically contains a gross leasable area of about 60,000 square feet but may range from 30,000 to 100,000 square feet. There are numerous neighborhood centers within the target market area. B&D evaluated the three closest to the FIU campus, as they will have the greatest impact on the proposed development at FIU.
Neighborhood Centers
Gross Leasable
AreaRent
$/SF/YearAnchor / Major
TenantDistance from FIU
Biltmore Plaza 38,000 $21 None 3
Florida International Plaza 55,983 $20 - $25 Office Depot 0.1
University Center N/P $20 - $25 Publix 0.1
Biltmore Plaza
University Center
FIUFlorida
International Plaza
Biltmore Plaza
University Center
FIUFlorida
International Plaza
Biltmore Plaza
University Center
FIUFlorida
International Plaza
Biltmore PlazaBiltmore Plaza
University Center
University Center
FIUFlorida
International Plaza
Florida International
Plaza

EXISTING CONDITIONS / SUPPLY ANALYSIS
Florida International University Retail Demand Study 7
Community Retail Centers A community retail center provides a wider range of soft lines (apparel for men, women, and children) and hard lines (hardware and appliances). The community center makes merchandise available in a greater variety of sizes, styles, colors, and prices. Many centers are built around a junior department store, variety store, super drugstore, or discount department store as the major tenant, in addition to a supermarket. Although a community center does not have a full-line department store, it may have a strong specialty store or stores. The typical size of a community center is about 150,000 square feet of gross leasable area but may range as small as 100,000 to as large as 249,000 square feet. There are currently three community retail centers in the target market.
Community Retail Centers
Gross Leasable
AreaRent
$/SF/YearAnchor / Major
TenantDistance from FIU
Bird Bowl Shopping Center 125,438 N/P Bird Bowl 4
Festival Plaza 152,000 $20 Starbucks 3
Laroc Center 115,000 $30 Sedano's Supermarket 3.3
Festival Plaza
Bird Bowl
Laroc Center
FIU

EXISTING CONDITIONS / SUPPLY ANALYSIS
Florida International University 8 Retail Demand Study
Regional Retail Centers A regional retail center provides general merchandise, apparel, furniture, and home furnishings in depth and variety, as well as a range of services and recreational facilities. It is built around one or two full-line department stores of generally not less than 50,000 square feet. Its typical size is about 500,000 square feet of gross leasable area but may range from 250,000 to more than 749,000 square feet. The regional center provides services typical of a business district yet not as extensive as those of the super regional center. There are currently three regional retail centers in the target market.
Mall of the Americas
Flagler Park Plaza
Concord Shopping Plaza
FIU
Regional Retail Centers
Gross Leasable
AreaRent
$/SF/YearAnchor / Major
TenantDistance from FIU
Concord Shopping Plaza 325,000 N/P Home Depot 1.8
Flagler Park Plaza 452,681 N/P Publix 2.9
Mall of the Americas 650,151 N/P Home Depot 3.4

EXISTING CONDITIONS / SUPPLY ANALYSIS
Florida International University Retail Demand Study 9
Super Regional Centers A super regional center offers extensive variety in general merchandise, apparel, furniture, and home furnishings, as well as a variety of services and recreational facilities. It is built around one or two full-line department stores generally of not less than 75,000 square feet each. The typical size of a super regional center is about 1,000,000 square feet of gross leasable area but can range from 750,000 to more than 1,500,000 square feet. There are currently two super regional centers within the target market.
Super Regional Retail Centers
Gross Leasable
AreaRent
$/SF/YearAnchor / Major
TenantDistance from FIU
Dolphin Mall 1,313,000 N/P Burlington Coat Factory 1.9
International Mall 1,072,370 N/P Macy's 1.9
Dolphin Mall International Mall
FIU

EXISTING CONDITIONS / SUPPLY ANALYSIS
Florida International University 10 Retail Demand Study
New Retail Centers in Target Market There are a number of new retail centers within the target market that have recently opened or will be coming on line in early 2008. The types range from small neighborhood centers (San Miguel Shopping Plaza) to large mixed-use projects (Park Square at Doral). Dolphin plaza is a small, high-end retail and dining concept that is utilizing its location near two major super-regional centers to capture its customers.
New Retail Centers
Gross Leasable
AreaRent
$/SF/YearAnchor / Major
TenantDistance from FIU
San Miguel Shopping Plaza 60,000 $25 - $55 None 2.8
Park Square at Doral N/P $55 TBD 6
Dolphin Plaza 31,000 $30 None 1.9
San Miguel
Park Square
Dolphin Plaza
FIU

EXISTING CONDITIONS / SUPPLY ANALYSIS
Florida International University Retail Demand Study 11
Miami-Dade County Retail Trends Although the housing market was extremely soft in 2007, the retail market remained relatively healthy in Miami-Dade County. According to fourth quarter 2007 data provided by CB Richard Ellis, the market is showing signs of weakness in early 2008 due to the current housing crisis. Although the market is softening, the long-term prognosis for retail in Miami-Dade is very good. Some key retail aspects include:
Miami-Dade County is still under-retailed. Strong spending by Latin Americans and Europeans with second homes in the area. Miami is a strong entry market for European retail concepts. 585,120 (sq. ft.) of retail space was delivered in 2007. Stricter underwriting standards for new projects. Vacancy rate increased from 2.9% to 3.3% Development will be tenant-driven with a focus on infill and mixed-use.


Section 3


DEMAND ANALYSIS: MAIN STREET
Florida International University Retail Demand Study 3
Objectives and Methodology FIU is a large university that has nearly reached its capacity at the University Park campus. With enrollment projected to remain flat for the coming years the retail demand analysis for this study is based upon a comparison of current spending patterns with national on-campus spending data. An analysis of the demographics of FIU, total food service and non-food retail sales numbers was conducted to gain an understanding of the current spending characteristics of the campus population. FIU Campus Demographic Determinants Currently FIU’s University Park campus has a total population of 31,064 students and 3,191 faculty and staff. Approximately 2,428 of those students are living on campus. Campus growth is projected to be relatively minimal for the coming years as undergraduate enrollment is not projected to grow. However, any growth that occurs will result from the development of the Academic Health Sciences Center, the Miami-Dade County Public Health Center and the ambulatory care clinic. Current estimates project an additional 1,500 new people on campus by 2012. Main Street Visitors Main Street will be clearly anchored by the on-campus residents on the southern edge of campus. There are currently 2,400 beds with plans for an additional 800 to be built on Main Street. In addition to the on-campus community, a number of new projects have come on line or are in the implementation stages on or near the proposed site for Main Street. These new developments have the potential to draw a significant number of visitors to the southern edge of campus.
Main Street Visitors
Student Service Center1 12,215Financial Aid Office1 21,516Fooball Attendees2 175,000Performing Arts Center3 10,000Frost Museum3 10,000Other3 20,000
Total Visitors 248,731
Notes:1. Data provided by FIU2. CH Johnson study3. B&D estimate
FIGURE 3.1: Estimated Main Street visitors.
DEMAND ANALYSIS: MAIN STREET
Florida International University 4 Retail Demand Study
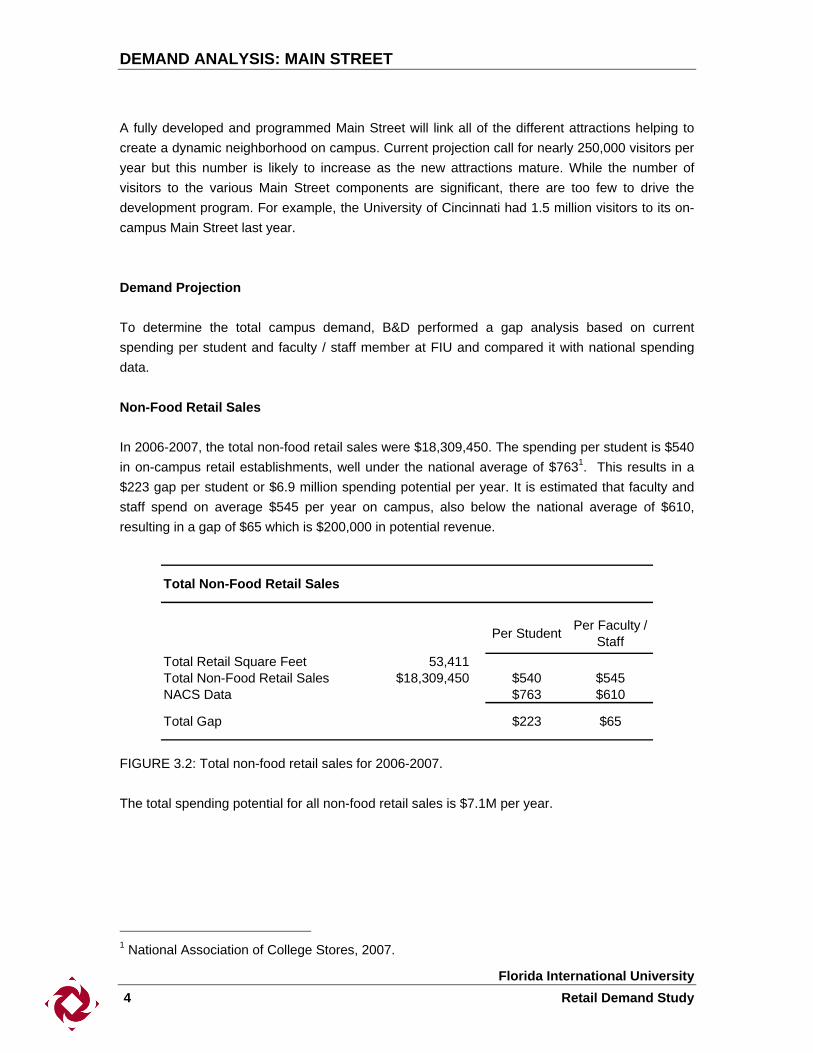
A fully developed and programmed Main Street will link all of the different attractions helping to create a dynamic neighborhood on campus. Current projection call for nearly 250,000 visitors per year but this number is likely to increase as the new attractions mature. While the number of visitors to the various Main Street components are significant, there are too few to drive the development program. For example, the University of Cincinnati had 1.5 million visitors to its on-campus Main Street last year. Demand Projection To determine the total campus demand, B&D performed a gap analysis based on current spending per student and faculty / staff member at FIU and compared it with national spending data. Non-Food Retail Sales In 2006-2007, the total non-food retail sales were $18,309,450. The spending per student is $540 in on-campus retail establishments, well under the national average of $7631. This results in a $223 gap per student or $6.9 million spending potential per year. It is estimated that faculty and staff spend on average $545 per year on campus, also below the national average of $610, resulting in a gap of $65 which is $200,000 in potential revenue.
Total Non-Food Retail Sales
Per Student Per Faculty / Staff
Total Retail Square Feet 53,411Total Non-Food Retail Sales $18,309,450 $540 $545NACS Data $763 $610
Total Gap $223 $65
FIGURE 3.2: Total non-food retail sales for 2006-2007. The total spending potential for all non-food retail sales is $7.1M per year.
1 National Association of College Stores, 2007.

DEMAND ANALYSIS: MAIN STREET
Florida International University Retail Demand Study 5
Food Service Sales For food service sales, B&D performed a similar gap analysis using national data from Envision Strategies. Total FIU food service expenditures including meal plans were $9,491,915 or $309 per person, well below the national average of $493 per student for a similar sized state institution in a metropolitan area. This gap of $184 per person translates into $5.6 million in lost revenue.
Total Food Service Sales
Per PersonTotal Food Service Sales $6,784,906 $221Total Sales w/Meal Plan $9,491,915 $309National Sales Data $493
Total Gap $184
FIGURE 3.3: Total food service sales including meal plans for 2006-2007. Based on current campus population and spending data, B&D estimates the total potential new revenue to be $12.6 million. The potential new spending translates to 40,000 square feet of retail based on the current average sales per square foot of $312. A conservative estimate of new retail sales is roughly $9.4 million, translating to an additional 30,000 square feet of retail as shown in figure 3.6.
Total Campus Demand
Conservative BaseTotal Potential New Campus Spending $9,375,000 $12,600,000Average Sales Per Square Feet $312 $312
Total Potential New Square Feet 30,000 40,000
FIGURE 3.4: Total campus retail demand.


Section 4

DEMAND ANALYSIS: 8TH STREET
Florida International University Retail Demand Study 1
Objectives and Methodology - Demographic Review An analysis of the demographics of Miami, Florida was undertaken to gain an understanding of the characteristics of the market’s current and projected populations. The objective of the demographic analysis was to determine the impact any changes in population demographics may have on the retail market. B&D’s demographic data was obtained from the Market Profile Report published by Environmental Systems Research Institute, Inc (ESRI). The demographic report includes U.S. Census data from 2000 and ESRI estimates for 2007 and projections to 2012. The complete demographic data can be found in Exhibit C: Quantitative Demographic and Economic Data. Definition of Market Area Miami and Miami-Dade County are part of the Miami-Fort Lauderdale-Pompano Beach, FL Metropolitan Statistical Area. Defined by the United States’ Office of Management and Budget, a ‘metropolitan’ area has at least one core urban area of 50,000 or more residents and includes the county our counties containing the core urban area. This standardized geographic definition of markets is the basis by which common economic and demographic data is collected by federal agencies, including the U.S. Census Bureau. While most market analyses rely on the federal market area definitions, the definition of the Miami-Fort Lauderdale-Pompano Beach Metropolitan area does not represent the market for the product types being considered in this study. Rather, a better definition of the true market area is measured by driving times to and from FIU. Considering that 62% of the Miami-Fort Lauderdale-Pompano Beach Metropolitan area residents commute between 10 and 34 minutes to work, demographic and economic data was collected based upon drive time radii of 10, 20, and 30 minutes from FIU. For the purpose of this study, the 10-minute drive time radius defines the market area and the other radii are used to identify any unique characteristics that might be otherwise overlooked.

DEMAND ANALYSIS: 8TH STREET
Florida International University 2 Retail Demand Study
FIGURE 4.1: Map of the 10-, 20-, and 30-minute drive time market areas. Population Characteristics Based upon 2007 population estimates, the defined market includes nearly 2,800,000 people. Approximately 15% of the market is located within a 10-minute drive of FIU and another 25% of the market is located within 10 additional driving minutes. As might be predicted, the population densities increase between the 10-minute drive time area and the 20- to 30-minute drive time area.
10-Minute Drive 20-Minute Drive 30-Minute Drive
2000 Total Population 370,598 1,424,592 2,559,119
2007 Total Population 408,399 1,529,289 2,840,901Growth Rate 1.96% 1.43% 2.11%
2012 Total Population 430,325 1,602,911 3,018,876Growth Rate 1.05% 0.94% 1.22%
FIGURE 4.2: Market area population and growth data.
DEMAND ANALYSIS: 8TH STREET
Florida International University Retail Demand Study 3
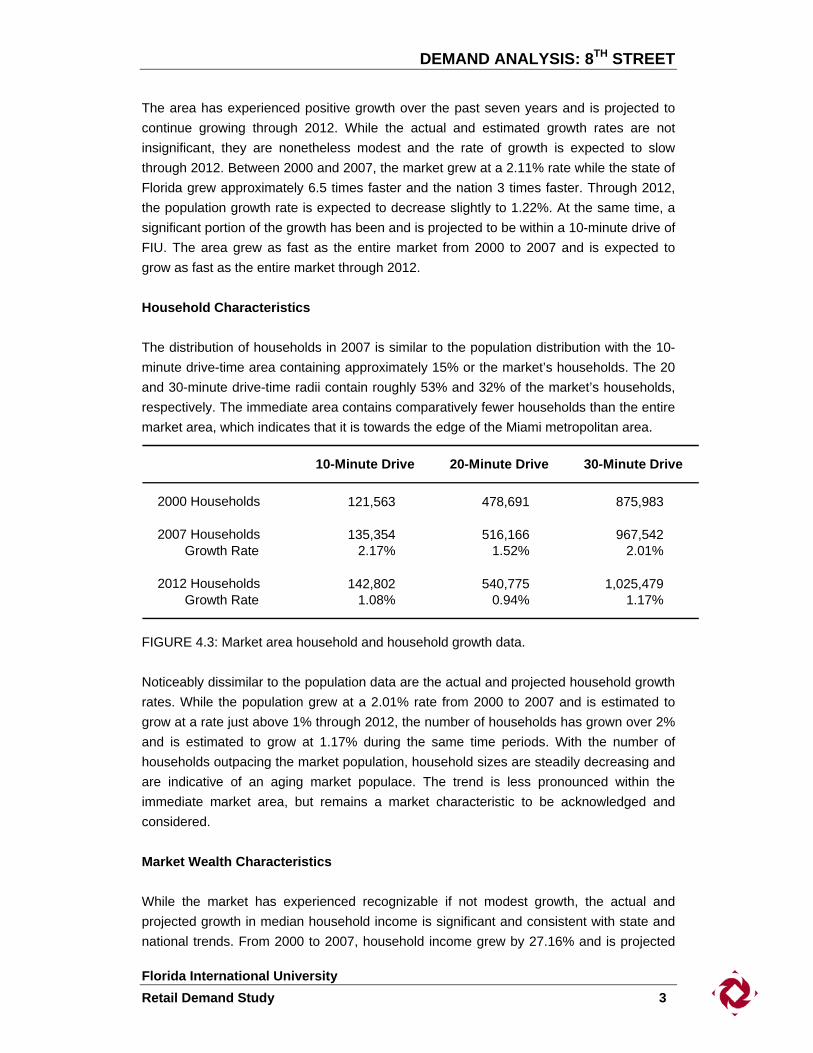
The area has experienced positive growth over the past seven years and is projected to continue growing through 2012. While the actual and estimated growth rates are not insignificant, they are nonetheless modest and the rate of growth is expected to slow through 2012. Between 2000 and 2007, the market grew at a 2.11% rate while the state of Florida grew approximately 6.5 times faster and the nation 3 times faster. Through 2012, the population growth rate is expected to decrease slightly to 1.22%. At the same time, a significant portion of the growth has been and is projected to be within a 10-minute drive of FIU. The area grew as fast as the entire market from 2000 to 2007 and is expected to grow as fast as the entire market through 2012. Household Characteristics The distribution of households in 2007 is similar to the population distribution with the 10-minute drive-time area containing approximately 15% or the market’s households. The 20 and 30-minute drive-time radii contain roughly 53% and 32% of the market’s households, respectively. The immediate area contains comparatively fewer households than the entire market area, which indicates that it is towards the edge of the Miami metropolitan area.
10-Minute Drive 20-Minute Drive 30-Minute Drive
2000 Households 121,563 478,691 875,983
2007 Households 135,354 516,166 967,542Growth Rate 2.17% 1.52% 2.01%
2012 Households 142,802 540,775 1,025,479Growth Rate 1.08% 0.94% 1.17%
FIGURE 4.3: Market area household and household growth data. Noticeably dissimilar to the population data are the actual and projected household growth rates. While the population grew at a 2.01% rate from 2000 to 2007 and is estimated to grow at a rate just above 1% through 2012, the number of households has grown over 2% and is estimated to grow at 1.17% during the same time periods. With the number of households outpacing the market population, household sizes are steadily decreasing and are indicative of an aging market populace. The trend is less pronounced within the immediate market area, but remains a market characteristic to be acknowledged and considered. Market Wealth Characteristics While the market has experienced recognizable if not modest growth, the actual and projected growth in median household income is significant and consistent with state and national trends. From 2000 to 2007, household income grew by 27.16% and is projected

DEMAND ANALYSIS: 8TH STREET
Florida International University 4 Retail Demand Study
to grow another 18.11% by 2012. Also, the increase in wealth is generally evenly distributed within the market areas with only a 4% variance in 2000, 2007, and 2012 median household income figures.
10-Minute Drive 20-Minute Drive 30-Minute Drive
2000 Median HH Income $41,973 $35,664 $37,784
2007 HH Income $53,520 $44,414 $48,045Growth Rate 27.51% 24.53% 27.16%
2012 HH Income $63,160 $51,418 $56,748Growth Rate 18.01% 15.77% 18.11%
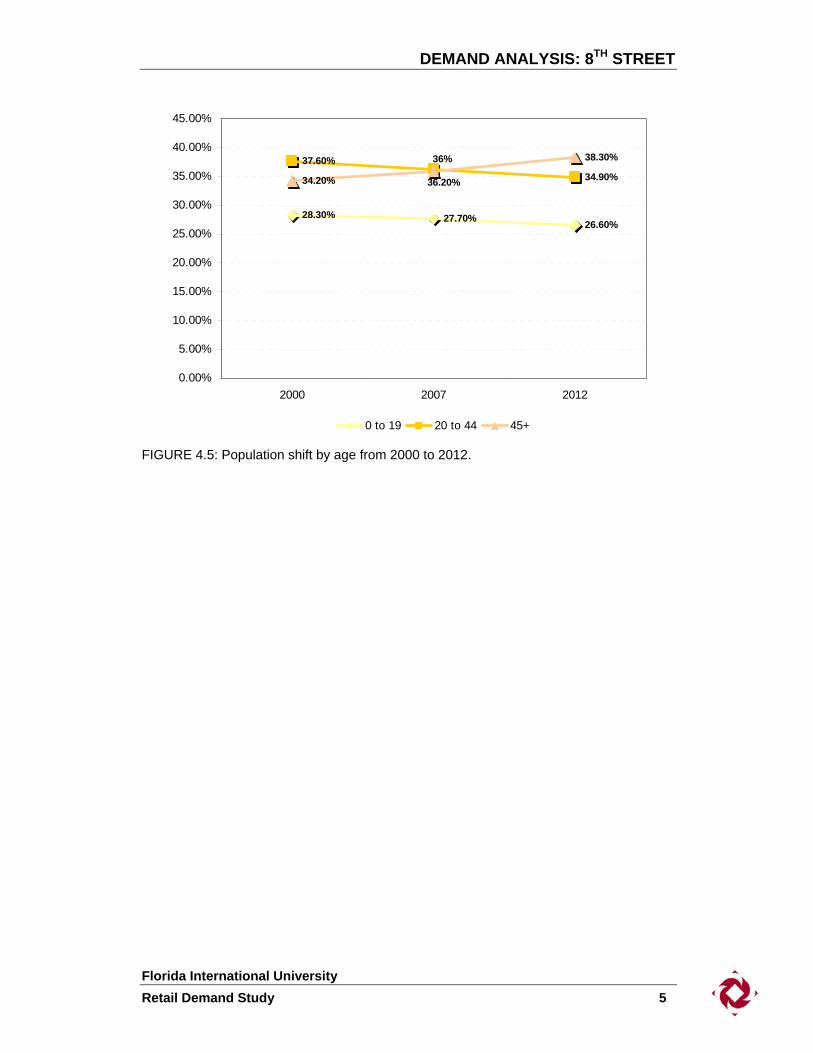
FIGURE 4.4: Market area median household income and growth data. Market Population Age Characteristics As indicated by the population and household data, the age of the market population has been increasing and will continue to increase. An analysis of the population according to 12 age categories indicates that the percentage of persons aged between 0 and 19 years has fallen 2.1% from 28.3% in 2000 to 27.7% in 2007. By 2012, the same category is estimated to fall another 4% from 27.7% of the population to 26.6% of the population. Young professionals and adults aged between 20 and 44 years have fallen similarly from 37.6% of the population in 2000 to 36.2% of the population in 2007. The fall is projected to continue with the percentage dropping another 3.6% to 34.9% by 2012. The decline in percentage of the younger population is offset by a significant increase in the portion of the population over the age of 45. Between 2000 and 2007, the older population segment rose from 34.2% of the market population to over 36%. The growth in the older population is expected to continue, albeit at a slower rate, with nearly 36.3% of the market population over the age of 45 projected by 2012.
DEMAND ANALYSIS: 8TH STREET
Florida International University Retail Demand Study 5
28.30% 27.70% 26.60%
37.60%34.90%34.20%
38.30%
36.20%
36%
0.00%
5.00%
10.00%
15.00%
20.00%
25.00%
30.00%
35.00%
40.00%
45.00%
2000 2007 2012
0 to 19 20 to 44 45+
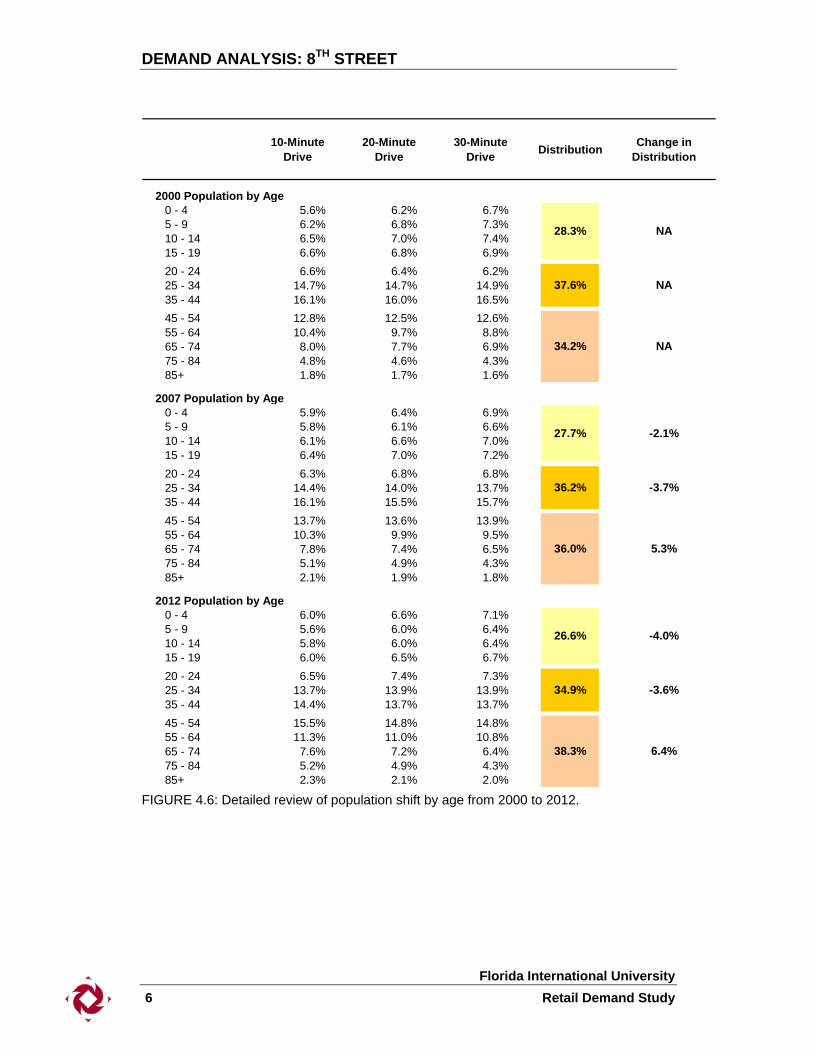
FIGURE 4.5: Population shift by age from 2000 to 2012.
DEMAND ANALYSIS: 8TH STREET
Florida International University 6 Retail Demand Study
10-Minute Drive
20-Minute Drive
30-Minute Drive Distribution Change in
Distribution
2000 Population by Age 0 - 4 5.6% 6.2% 6.7% 5 - 9 6.2% 6.8% 7.3% 10 - 14 6.5% 7.0% 7.4% 15 - 19 6.6% 6.8% 6.9% 20 - 24 6.6% 6.4% 6.2% 25 - 34 14.7% 14.7% 14.9% 35 - 44 16.1% 16.0% 16.5% 45 - 54 12.8% 12.5% 12.6% 55 - 64 10.4% 9.7% 8.8% 65 - 74 8.0% 7.7% 6.9% 75 - 84 4.8% 4.6% 4.3% 85+ 1.8% 1.7% 1.6%
2007 Population by Age 0 - 4 5.9% 6.4% 6.9% 5 - 9 5.8% 6.1% 6.6% 10 - 14 6.1% 6.6% 7.0% 15 - 19 6.4% 7.0% 7.2% 20 - 24 6.3% 6.8% 6.8% 25 - 34 14.4% 14.0% 13.7% 35 - 44 16.1% 15.5% 15.7% 45 - 54 13.7% 13.6% 13.9% 55 - 64 10.3% 9.9% 9.5% 65 - 74 7.8% 7.4% 6.5% 75 - 84 5.1% 4.9% 4.3% 85+ 2.1% 1.9% 1.8%
2012 Population by Age 0 - 4 6.0% 6.6% 7.1% 5 - 9 5.6% 6.0% 6.4% 10 - 14 5.8% 6.0% 6.4% 15 - 19 6.0% 6.5% 6.7% 20 - 24 6.5% 7.4% 7.3% 25 - 34 13.7% 13.9% 13.9% 35 - 44 14.4% 13.7% 13.7% 45 - 54 15.5% 14.8% 14.8% 55 - 64 11.3% 11.0% 10.8% 65 - 74 7.6% 7.2% 6.4% 75 - 84 5.2% 4.9% 4.3% 85+ 2.3% 2.1% 2.0%
34.9%
38.3%
-2.1%
-3.7%
5.3%
-4.0%
-3.6%
6.4%
27.7%
36.2%
36.0%
26.6%
28.3%
37.6%
34.2%
NA
NA
NA
FIGURE 4.6: Detailed review of population shift by age from 2000 to 2012.

DEMAND ANALYSIS: 8TH STREET
Florida International University Retail Demand Study 7
Market Race / Ethnicity Characteristics Based on 2007 population estimations, the target market area is predominately of Hispanic Origin. The number of Hispanics in the market area increased 1.34% to 85.6% in the period from 2000 to 2007. The Hispanic population is expected to increase another .71% to 88.7% by 2012. The rest of the population in the target market is evenly distributed between the different ethnicities. The demographics for the market area are slightly higher than Miami-Dade County, where 61% of the population is of Hispanic origin.
10-Minute Drive
20-Minute Drive
30-Minute Drive
Growth Rate
2000 Population by Race/EthnicityTotal 370,600 1,424,592 2,559,117 White Alone 88.5% 77.1% 69.2% Black Alone 2.3% 12.8% 20.5% American Indian Alone 0.1% 0.2% 0.2% Asian or Pacific Islander Alone 1.5% 1.3% 1.7% Some Other Race Alone 4.4% 4.8% 4.5% Two or More Races 3.2% 3.7% 3.8%Hispanic Origin 80.1% 68.9% 53.2%
2007 Population by Race/EthnicityTotal 408,399 1,529,289 2,840,902 White Alone 88.3% 77.5% 69.2% -0.05% Black Alone 2.3% 11.9% 19.6% 0.00% American Indian Alone 0.1% 0.2% 0.2% 0.00% Asian or Pacific Islander Alone 1.5% 1.4% 1.9% 0.00% Some Other Race Alone 4.5% 5.2% 5.1% 0.45% Two or More Races 3.2% 3.8% 4.0% 0.00%Hispanic Origin 85.6% 75.2% 59.8% 1.34%
2012 Population by Race/EthnicityTotal 430,324 1,602,911 3,018,876 White Alone 88.5% 77.9% 69.4% 0.05% Black Alone 2.2% 11.3% 18.8% -0.89% American Indian Alone 0.1% 0.2% 0.2% 0.00% Asian or Pacific Islander Alone 1.4% 1.4% 2.0% -1.37% Some Other Race Alone 4.6% 5.4% 5.5% 0.44% Two or More Races 3.2% 3.9% 4.1% 0.00%Hispanic Origin 88.7% 78.7% 64.1% 0.71%
FIGURE 4.7: Market area population by race/ethnicity.

DEMAND ANALYSIS: 8TH STREET
Florida International University 8 Retail Demand Study
Retail Demand Projection – 8th Street The retail improvements being considered by the University are not unique to FIU. In fact, many universities are looking at ways to develop excess on-campus land to generate additional revenues for these universities. Our analysis looked at internal (campus) demand and external (community) demand. Internal (Campus) Demand FIU has seen unprecedented growth in both undergraduate and graduate programs in the past decade. A significant number of new buildings have been built to meet the demand. The next phase in the University’s evolution is the development of the Academic Health Sciences Center (AHSC). Granted the 127th medical school in the United States, FIU has embarked on the planning and development of a medical campus in the northeast quadrant of campus. The campus will include the College of Nursing and Health Sciences, the College of Medicine, the Miami-Dade Department of Public Health, numerous research buildings, a medical office space and retail to support the population of the AHSC campus. The build-out of the AHSC campus is projected to last for 20 years, with the first buildings coming on line by 2012. It is important to note that the demand numbers are based on the development projects that are expected to come on line in the next five years. B&D chose to focus on the first five years because there are too many unknown variables that could impact the build out of the AHSC campus.
5-Year AHSC Development Program
College of Nursing & Health Sciences 101,000 SFMiami-Dade Dept of Health Building 106,500 SFFUI School of Public Health 33,600 SFHLS-3:Science Classroom Complex 1 138,800 SFGraduate Classroom Building 59120 SFParking Garage 5 / Public Safety 1400 spaces / 12,000 SFAmbulatory Care Clinic 120,000 SFPhase 1-Satellite Chiller Plant 15,000 SF
FIGURE 4.8: The projected 5-year development program for the AHSC campus. The University market and, more specifically, the faculty, staff and employees of the Academic Health Science Center campus represent an additional potential market with significant spending power. With a projected 2012 population of nearly 2,174 AHSC faculty and staff, medical students, and Miami-Dade County public Health Center employees—

DEMAND ANALYSIS: 8TH STREET
Florida International University Retail Demand Study 9
and with each group spending an average of $3,3501—the AHSC population will spend nearly $7.3 million per year. The community demand, in comparison, is projected to create $110M in spending over a 5-year period, or $22M per year. The $7.3M in AHSC spending would support nearly 21,000 square feet of retail space. As the AHSC campus grows in population, the retail demand will increase significantly. After full campus build out, it is likely that the internal demand alone for the AHSC could be closer to 60,000-80,000 gross square feet.
AHSC / University Market Retail Demand - 2012
Total Annual Spending Per Person $3,350
AHSC Faculty / Staff 687Miami-Date County Public Health Employees 700Ambulatory Care Clinic 300Medical Students 160Faculty / Staff within .25 miles 327
Total AHSC Population 2,174
Retail Sales / SF $350Resultant Retail Space Demand 21,000
FIGURE 4.9: AHSC and University market retail demand analysis. The demand for retail square footage on the part of the AHSC and University is a constant demand and reflects the amount of space that would support spending each year. Unless employment projections or enrollment increases, the 21,000 square feet of retail space—once put in place—will support spending in the future. The demands of the AHSC and University are applicable only because traditional campus retail spaces, such as the bookstore, could potentially be moved to a location in the NE quadrant of campus as part of the master planning effort. The community market demand number, on the other hand, represents the amount of retail space that could be absorbed each year as the population continues to grow. Community Demand The analysis of the retail market for the community relied upon the projected population change and expected sales activity within the study area to define square footage demands. Between 2007 and 2012, the population is projected to grow by 21,926 persons, or 7,448 households, and each new person will create demand for retail space. On average, each person within the market will spend approximately $19,299, including 1 ICSC Office Worker Retail Spending Patterns, 2006.

DEMAND ANALYSIS: 8TH STREET
Florida International University 10 Retail Demand Study
investments, vehicles, mortgages, food, recreation, etc. Because certain establishments are not appropriate for the study area and because certain services are already provided, the average per-person spending figure was reduced to $5,031. A home improvement store or car dealership, for example, are considered inappropriate uses for the study area, and so those spending categories were not included. The $5,031 figure generally includes food, personal care products, video equipment, and limited household supplies. The 21,926 persons will generate nearly $110M in new spending appropriate to the study area. Assuming average sales of $350 per square foot for sustainable retail businesses, the new spending will create a demand for over 315,000 square feet of retail space. On an annual basis, the spending should support an absorption of 63,000 square feet of retail space each year.
Community Market Retail Demand
Total Annual Spending Per Person $5,031Population Change, 2007-2012 21,926Retail Sales / SF $350Resultant Retail Space Demand 315,000Annual Retail Space Absorption 63,000
FIGURE 4.10: Community market retail demand analysis. Assuming a 20-30% penetration for the community retail market, the combined community and AHSC / University retail demand ranges from 81,000 square feet to 113,000 square feet.
Total Retail Demand
20% Market Penetration
30% Market Penetration
Community Retail Demand 63,000 95,000AHSC / University Demand 21,000 21,000
Resultant Retail Demand 84,000 - 113,000
FIGURE 4.11: Combined community market and AHSC / University retail demand.

Exhibit A


BEST PRACTICES
Florida International University Retail Demand Study 1
OBJECTIVES The objective of the Best Practices study was three-fold: to identify instances where universities developed Main Streets to enhance on-campus student life, to define proven options which are potentially relevant to the challenges facing FIU, and finally to inform the final recommendations in terms of how these options might be applied to the FIU Main Street and 8th Street projects. METHODOLOGY The research in this section was completed via various telephone and in-person interviews as well as Internet research of selected case studies relevant to this study. Main Street Case Studies The following university campus-related best practice case studies were selected:
• Rochester Institute of Technology • University of California, San Diego • University of Cincinnati • University of Central Florida
University Campus Edge Retail Case Studies The following campus edge retail best practice case studies were selected according to the criteria noted above:
• Florida Atlantic University • George Washington University • Ohio State University
The following matrix describes the issue each university faced and the actions that were taken to solve the problem.

BEST PRACTICES
Florida International University 2 Retail Demand Study
CASE STUDY ISSUE SOLUTION / PROJECT SUMMARY
Rochester Institute of Technology
• No real gateway to campus. • Little campus life. • Student recruitment and
retention issues.
The development of Park Point at RIT, an $85 million mixed-use development that includes housing, retail and dining options.
University of California, San Diego
• No collegetown atmosphere. • No central hub of student activity
on campus. • Recruitment and retention
issues.
The development of a campus downtown to create a hub of student activity. The project includes a student services center, student union building, dinging, retail, classrooms and a lecture hall / movie theater.
University of Cincinnati
• Little campus life. • Recruitment and retention
issues.
The creation of an internal campus main street. The $234 million mixed-use project includes a student services center, student life center, recreation center and campus housing.
University of Central Florida
• No central hub of student activity on campus.
• Little campus life. • Recruitment and retention
issues.
The development of Knight’s Plaza, a mixed-use development centered around the athletic village. The project includes a new area, housing and retail.
Florida Atlantic University
• Develop excess university land. • Generate money for the
university.
The development of University Commons, a 174,000 sf lifestyle center.
George Washington University
• Redevelopment of former university hospital.
• Generate money for the university.
• Enhance neighborhood retail options.
The development of Square 54 and the I Street retail corridor. The Square 54 mixed-use development will include 450,000 sf of office space, 330,000 sf of apartments and 88,000 sf of retail.
Ohio State University
• Revitalization of the University District.
• Enhance the housing and retail options in the neighborhood.
• Create a sense of place to foster the collegetown atmosphere.
The development of Square 54 and the I Street retail corridor. The Square 54 mixed-use development will include 450,000 sf of office space, 330,000 sf of apartments and 88,000 sf of retail.

BEST PRACTICES
Florida International University Retail Demand Study 3
ROCHESTER INSTITUTE OF TECHNOLOGY – ROCHESTER, NEW YORK Background Rochester Institute of Technology is a large private university located in the southwest section of Rochester. RIT’s suburban location with limited nearby transportation and entertainment options provided little in the way of a collegetown atmosphere. Recognizing the increasing importance of the student experience outside the classroom, RIT administrators commenced the planning and development of a collegetown-type development to create a competitive position for the University and to help with student retention. The Intervention With excess land in the northeast corner of campus, the University selected a developer to privately develop 64 acres of land to create a dynamic student community that will serve as the University’s new commercial gateway into campus. Park Point at RIT is an $85 million mixed-use project that includes 80,000 square feet of retail and 300 student apartments (900 beds). Anchored by a two-story, 40,000 square foot Barnes & Noble Academic Superstore, other retail uses include clothing stores, dining and entertainment establishments and a salon. Construction began in 2007 with a projected completion date of August 2008. As of March 2008, nearly 95% of the retail space has been leased. Deposits for the housing are going well but not as expected. In order to ensure high occupancy, the housing has been opened to the general community, much to the dismay of many RIT students. Park Point at RIT is being developed by the Wilmorite Company, a national retail and student housing developer. The University and Wilmorite entered into a ground lease agreement where the developer pays RIT a fixed amount annually for a specified period of time. Wilmorite also manages the retail leasing while United Reality Management manages the operations of the housing. Retail Concepts
• RIT Bookstore (Barnes & Noble) • Salon and Spa • Fitness Center

BEST PRACTICES
Florida International University 4 Retail Demand Study
• Cellular phone store • Clothing • Sports Bar • Multiple dining establishments
Program Outcomes RIT benefits include:
• 80,000 SF of Retail ($28 sf/year) • 300 student apartments (900 beds) • The establishment of a campus entrance • A vibrant mixed-use community • Additional revenues for the University
Lessons Learned
• The market can only support so much retail—demand for retail was not as great as the University had expected.
• Affordability is key—the cost of housing is higher than most on- and off-campus options and has had an impact on their ability to lease the apartments.
• Patience is essential—the site had significant wetland issues which provided for a long and challenging permitting process.

BEST PRACTICES
Florida International University Retail Demand Study 5
UNIVERSITY OF CALIFORNIA, SAN DIEGO – SAN DIEGO, CALIFORNIA Background The sprawling campus of the University of California, San Diego is located in the upscale coastal community of La Jolla. Completely surrounded by a residential neighborhood and far removed from the commercial center of La Jolla, UCSD lacks a traditional collegetown atmosphere or central location for campus life. The Intervention Faced with strong competition for students with other University of California schools located in more vibrant areas, UCSD was at a competitive disadvantage when it came to the traditional collegetown atmosphere. Located in the upscale La Jolla neighborhood of San Diego there was little student-focused off-campus entertainment, retail and student housing. The quiet environment was good for studying but campus life left much to be desired. In the late 1980’s the University embarked on planning and developing a central location on campus that would serve as the hub for student life. The first phase was the replacement of the small and outdated Student Center with the Price Center, the University’s student union building. The Price Center includes the dining hall, foot court, student activity space, classrooms and retail. It is anchored by the University Bookstore and a large multi-purpose lecture hall that houses classes during the day and is a movie theater in the evening. Opened in the early 1990s, the Price Center was successful from the start and was quickly at capacity. With the Price Center now an emerging hub for campus life, the University developed plans to create a “downtown” for the campus. The new downtown includes a new student services center and an expanded price center designed around expansive outdoor areas to create an “outdoor room” and to take advantage of the year-round hospitable climate. The new Student Services center is a one-stop shop for all administrative functions of the University including, admissions, financial aid and the registrar. While most functions of student service centers are now done on-line, UCSD’s Student Services center will be the first stop for all prospective students and their

BEST PRACTICES
Florida International University 6 Retail Demand Study
parents. In addition to administrative functions the center also has a number of restaurants, student activity space and meeting rooms. In addition to the Student Services center and an expanded Price Center, initial plans called for student housing in the downtown. Thus far none has been developed primarily because of a lack of developable land. Retail Concepts
• UCSD bookstore • Grocery store • Copy center • Post office • Bike shop • The Loft, a campus pub, restaurant and performance space • Various ethnic restaurants
Program Outcomes
• A vibrant mixed-use hub of activity for the campus. • Campus amenities that aid in recruitment and retention of students. • A place that students can identify with as the heart of the campus.
Lessons Learned
• Marketing and programming are essential to attracting students to the downtown in the evening.
• The Student Services Center has not drawn as many visitors as expected, primarily because most transactions are now done on-line.
• An active hub of campus life is a valuable recruitment tool for potential students. • Including student housing in the downtown would help to keep the area active well into
the evening.

BEST PRACTICES
Florida International University Retail Demand Study 7
UNIVERSITY OF CINCINNATI – CINCINNATI, OHIO Background The University of Cincinnati is a large public research institution located near downtown Cincinnati. Primarily a commuter campus with little options for student life, the University recognized the need to develop a central place on campus for students to congregate. The Intervention In an effort to create a sense of place and keep students on campus longer, the University commenced the planning and development of an on-campus main street concept that located a number of high traffic facilities along a central corridor. The University strategically located the student services center, student life center, recreation center and student residence halls in close proximity to the athletic village to create a critical mass of activity on the campus. The facilities all front onto a fully landscaped and programmed corridor creating a main street atmosphere. To further create a sense of place and brand the area, the University continued its tradition of building facilities designed by famous architects that are cutting edge in design and technology. The anchors for the $234 million main street are the 350,000 square feet recreation center, the 114,000 square feet student life center and the University of Cincinnati bookstore. Dining and retail options along Main Street are diverse ranging from a traditional dining hall to a full-service sit down restaurant. Managed by Aramark, the dining establishments are a mix of local and regional restaurants and large national chains. Retail options include a computer store, cellular phone store, a convenience store and the bookstore. A unique asset to the main street is its proximity to the athletic facilities. During athletic events, Main Street is a hub of pre- and post-game activity. Businesses along Main Street have capitalized on this by fostering a street fair atmosphere on game day. With the high number of visitors, auxiliary services recognized the area’s potential for corporate sponsorships as another way to generate revenue for the University. Retail Concepts
• UC Bookstore • Business of Main (Computers) • Main Street Express Mart (Convenience) • Cellular Phone Store

BEST PRACTICES
Florida International University 8 Retail Demand Study
Recreation Center
Athletic Facilities
Student Services Center
Student Life CenterMain Street
Recreation Center
Athletic Facilities
Student Services Center
Student Life CenterMain Street
Recreation Center
Athletic Facilities
Recreation Center
Athletic Facilities
Student Services Center
Student Life CenterMain Street
Student Services Center
Student Services Center
Student Life CenterMain Street
Student Life CenterMain Street
• Stadium View Café • Catskeller • Market on Main
Program Outcomes
• 180,000 sf Student Services Center
• 114,000 sf Student Life Center
• 350,000 sf Recreation Center
• 811 on-campus beds • Students are spending more
time on campus. • A central hub of student life on campus. • A vibrant mixed-use neighborhood. • An increase in the number of visitors to UC. • Additional revenues to the University.
Lessons Learned
• Anchors are essential—the bookstore, dining options and recreation center are the main drivers of traffic for Main Street.
• Programming is critical—Main Street needs to have daily programming to continue to attract visitors and to foster the area’s sense of place.
• Build flexibility into the retail space—the retail spaces were too large for many of the retailers that wanted to be along Main Street. Dividable spaces would have allowed for more retail options.

BEST PRACTICES
Florida International University Retail Demand Study 9
UNIVERSITY OF CENTRAL FLORIDA – ORLANDO, FLORIDA Background The University of Central Florida is a largest public institution in the state of Florida and the sixth largest in the nation. Located in Orlando, UCF has traditionally been a commuter campus with many non-traditional students. In an effort to transition to a more traditional campus atmosphere, the University has begun to develop the facilities and ammentites on more traditional campuses. Over the past decade the University has been active in building more on-campus housing, enhancing campus ammenities and improving the athletics department. The Intervention A major component of their efforts to enhance a number of aspects of the UCF campus, the University embarked on a multifaceted approach to create a hub of activity on campus, recruit and retail students and to enhance the competitiveness of the athletics department. The development of the $300 million Knights’ Plaza is an attempt to address many of the issues in one major project. Knights’ Plaza consists of a new 10,000-seat arena / convocation center, a new 45,000-seat football stadium, 89,000 square feet of retail, a 24,000 square foot dining facility, 2,000 on-campus beds and two 700-space parking garages. While still in the early stages the project has been a success and shows potential for the future. Retail Concepts
• Ron Jon Surf Shop • UCF Bookstore (Barnes & Noble) • Red Brick Pizza • Knight and Firkins English Pub • University Pharmacy • Convenience Store • Salon / Spa

BEST PRACTICES
Florida International University 10 Retail Demand Study
Program Outcomes
• Enhanced concerts and sporting events at the convocation center. • A nighttime hub of activity on the campus. • Expanded on-campus retail options. • A recruitment and retention tool for both the university and the athletics department.
Lessons Learned
• The campus bookstore, dining facility and event traffic from the convocation center drive the retail sales at Knights Plaza.
• The phased construction process has been difficult for retailers as there is not yet a critical mass of retailers and visitors are not sure that businesses are open.
• The metered parking needs to be studied and implemented in a way that is fair to both visitors and retailers.
• Many students feel that it is too far removed from the center of campus.
BEST PRACTICES
Florida International University Retail Demand Study 11
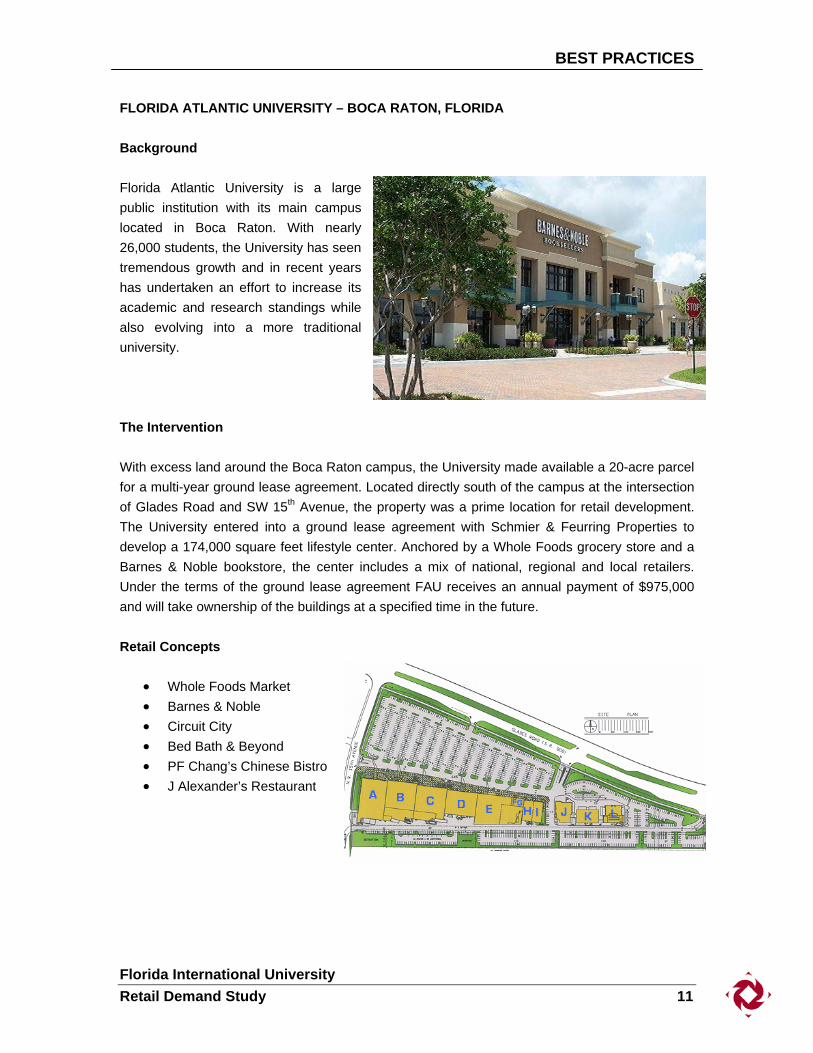
FLORIDA ATLANTIC UNIVERSITY – BOCA RATON, FLORIDA Background Florida Atlantic University is a large public institution with its main campus located in Boca Raton. With nearly 26,000 students, the University has seen tremendous growth and in recent years has undertaken an effort to increase its academic and research standings while also evolving into a more traditional university. The Intervention With excess land around the Boca Raton campus, the University made available a 20-acre parcel for a multi-year ground lease agreement. Located directly south of the campus at the intersection of Glades Road and SW 15th Avenue, the property was a prime location for retail development. The University entered into a ground lease agreement with Schmier & Feurring Properties to develop a 174,000 square feet lifestyle center. Anchored by a Whole Foods grocery store and a Barnes & Noble bookstore, the center includes a mix of national, regional and local retailers. Under the terms of the ground lease agreement FAU receives an annual payment of $975,000 and will take ownership of the buildings at a specified time in the future. Retail Concepts
• Whole Foods Market • Barnes & Noble • Circuit City • Bed Bath & Beyond • PF Chang’s Chinese Bistro • J Alexander’s Restaurant

BEST PRACTICES
Florida International University 12 Retail Demand Study

BEST PRACTICES
Florida International University Retail Demand Study 13
GEORGE WASHINGTON UNIVERSITY – WASHINGTON, D.C. Background George Washington University is a large private institution located in the Foggy Bottom neighborhood of Washington, D.C. Faced with growing student enrollment, the need to expand to meet the University’s population and mission, and a very contentious town-gown relationship, GW seeks to redevelop the only vacant parcel of land on its campus. The Intervention Square 54 is a vacant 2.5-acre parcel of land that was once the site of the old George Washington Hospital. Located on Washington Circle, the property is owned by the University and is available for development under a 60-year ground lease agreement. The development team chosen to develop Square 54 is a joint venture of Boston Properties and Kettler. GW and the development team are currently in the planning and approvals process for the Square 54 mixed-use project. Plans call for a mixed-use project that includes 450,000 square feet of Class-A office space, 330,000 square feet of market-rate apartments, 88,000 square feet of retail space and an underground parking garage. Designed by Pelli Clarke Architects, it will be a signature address along Pennsylvania Avenue. As part of the approval process, GW was forced to create more neighborhood- and student-focused retail options in Foggy Bottom. To do so, the planning team has created a 3-block long retail corridor from Square 54 and the Foggy Bottom Metro station to the 2000 Pennsylvania retail center. Plans call for the creation of retail spaces in the ground floors of existing academic and office buildings, outdoor seating, street furniture and enhanced streetscaping. The intent is to create a Main Street on the campus and within the neighborhood that will be a center of activity for both the students and the local residents. Build-out will occur over a 15-year period as properties redevelop and space becomes available. Proposed Retail Concepts
• Neighborhood grocery store. • High-end restaurant. • Upscale retail. • Neighborhood- and student-focused retail along I Street.

BEST PRACTICES
Florida International University 14 Retail Demand Study
Lessons Learned
• Neighborhood buy-in critical—with a contentious relationship with the Foggy Bottom neighborhood, it was essential that GW was inclusive during the planning process.
• Office space and housing are lucrative—the majority of income from the ground lease comes from the office and housing components of the project.
• The neighborhood’s needs are also the university’s needs—Foggy Bottom is underserved with retail and GW doesn’t have a central hub of activity on campus. The development of the I Street retail corridor meets everyone’s needs.

BEST PRACTICES
Florida International University Retail Demand Study 15
OHIO STATE UNIVERSITY: CAMPUS PARTNERS – COLUMBUS, OHIO Background Ohio State University is one of the largest public institutions in the United States with an enrollment of more than 50,000 students. After decades of disinvestment, the University District, an area located on the edge of OSU’s Columbus campus, had become a crime-ridden strip of rundown buildings and campus bars. The Intervention In 1995, Ohio State University and the City of Columbus created Campus Partners for Community Urban Redevelopment to improve the quality of life in University District. Campus Partners, a 501(c)(3) organization with its primary funding from Ohio State, spearheaded a community-based planning process to develop a comprehensive revitalization plan for the area. The major initiatives of the plan were to create a collegetown atmosphere around the campus; improve the retail and rental housing markets; and improve the quality of life in the neighborhood. A major initiative of the revitalization plan was to redevelop a 7.5-acre parcel of land on the southern edge of campus into a vibrant mixed-use community. In 1999 it commenced another community-based planning process for the site and proposed a $153 million mixed-use project featuring restaurants, an eight-screen cineplex, locally and nationally owned retailers, 184 market-rate apartments for faculty and staff, office space, and a 1,200-space parking garage. Financing for the project came from the University, city, state and a mix of New Market Tax Credits and Tax Increment Financing. Campus Partners assumed the role of developer with the help of Jones Lang LaSalle and began construction in 2003. The project opened in the fall of 2005 with much fanfare from the University, city and neighborhood. The project has created a southern gateway to the campus and has begun to spur other private development on adjacent parcels of land. Retail Concepts
• OSU Campus Bookstore (Operated by Barnes & Noble) • Salon & Spa • Potbelly Sandwich Works • Sunflower Market • Caribou Coffee • Panera Bread • McFadden’s Restaurant & Saloon

BEST PRACTICES
Florida International University 16 Retail Demand Study
Program Outcomes
• 184 market-rate apartments for faculty, staff and mature students. • 88,000 square feet of office space. • 249,000 square feet of retail space. • 1,200 space parking garage. • Increased private sector development.
Lessons Learned
• Getting neighborhood buy-in was critical to the projects success. • Patience and perseverance are essential—the planning, financing and development
process was very complex and needed committed leadership that could withstand a long rigorous process.
• The development model was critical to the projects success—Campus Partners realized early on that they did not have the capacity to develop a mixed-use project alone. Bringing in a large national real estate advisory firm to help guide the project was essential to Campus Gateway’s realization.

BEST PRACTICES
Florida International University Retail Demand Study 17
LESSONS LEARNED The following lessons garnered from the above case studies are especially noteworthy for the purposes of this study. In moving forward the University will have to utilize a number of these lessons learned because there is no single solution to the problem.
• Open, continued, and pro-active communication and education between stakeholder groups is critical to effective town-gown cooperation.
• The mixed-use development approach is a powerful urban revitalization trend nationally
and internationally, and can amplify positive results for Main Street Development.
• Programming is critical — the physical design of Main Street is not enough to attract visitors. Daily programming with events such as festivals, farmers markets and concerts are necessary to amplify the success of Main Street.
• Flexibility is essential — mixed-use, Main Street development continuously evolves as
projects mature and retail trends change. Finding the right mix of uses may take some time; it is critical that the spaces are designed in a way that they can be changed if necessary.
For further details on how the above may be translated into potential solutions, refer to Section 1: Executive Summary.


Exhibit B


FOCUS GROUP REPORT
Florida International University Retail Demand Study 1
FOCUS GROUP REPORT Objectives The purpose of the focus group and intercept interviews was to engage a variety of individuals in dynamic conversation about retail issues at Florida International University. B&D was trying to develop a better understanding of ways that retail options can be improved to positively impact FIU student life. The focus groups are intended to yield qualitative data for the researchers, while identifying sensitivities and previously unconsidered issues surrounding retail options at FIU. Methodology B&D organized focus groups to obtain a diverse mix of feedback from a wide range of FIU students, faculty, and staff. Over 65 individuals participated in nine focus groups on January 14th and 15th, 2008, on the FIU campus. In addition, B&D conducted random intercept interviews with students across different areas of campus. A moderator from B&D led each of the focus group sessions. The moderator guided the conversation to address retail issues. The moderator presented a series of open-ended questions and encouraged individuals to discuss tangential issues and engage in dynamic conversation. While the moderator was predisposed to obtaining answers to the questions asked, he or she also paid close attention to participant-generated issues raised during the interviews. Focus Groups Composition Group A: Commuter Students 10 participants (5 female, 5 male) Group B: On-Campus Students 4 participants (2 female, 2 male) Group C: Commuter Students 14 participants (10 female, 4 male) Group D: On-Campus and Commuter Students 14 participants (10 female, 4 male) Group E: Faculty and Staff 12 participants (7 female, 5 male) Group F: On-Campus Students 14 participants (10 female, 4 male) Group G: Faculty and Staff 14 participants (7 female, 7 male)

FOCUS GROUP REPORT
Florida International University 2 Retail Demand Study
Summary of Findings Why did you choose to attend or work at FIU? Many students chose to attend FIU because it is close to home and affordable. Several students indicated that they chose FIU because they like the diversity on campus and that it is a welcoming environment for international students. Faculty chose FIU because it provides many opportunities for growth and career enhancement. A number of faculty members commented that they enjoy the mix of backgrounds among faculty and staff and the sense of community on campus. Students, faculty and staff agreed that it is exciting to be on a rapidly growing campus. More specific points included: On-Campus Residents
• A number of students were attracted to FIU because of its diversity and programs for international students.
• Five students chose FIU because they were recruited to play sports. • One student responded that he chose FIU because of the growing campus and its
architecture. • Many chose FIU because it feels like it’s a large school with a small school feel. • A few students choose FIU over Miami Dade College because of the on-campus housing
options and the ability to have a “true campus experience.” Off-Campus Residents
• A number of students chose to attend FIU because their parents wanted them to stay at home in Miami.
• Many participants indicated that they came to FIU because it was affordable. • Similar to the on-campus students, several responded that they wanted to be part of a
new, growing campus. Faculty / Staff
• Many faculty chose FIU because of the diversity among students, faculty and staff. • Two faculty members chose FIU because it’s a rapidly growing campus that provides
ample opportunity. • One faculty member enjoys being part of the legacy of FIU.

FOCUS GROUP REPORT
Florida International University Retail Demand Study 3
Did FIU meet your expectations overall? Students felt that their expectations of FIU had generally been met in terms of the quality of their academic programs, faculty and staff. However, many stated that they have been let down with the lack of community on campus. Many believe the lack of community comes from the relatively young age of the school, the comparison to and presence of the University of Miami, and the lack of good sports teams. All students agreed that FIU is what you make of it. Overall, faculty and staff’s expectations have been met. Many commented that they were pleased with the variety of options on campus and the level of academic discourse among faculty and staff. On-Campus Residents
• A number of students were pleased with the quality of professors on campus. • Many felt that they were getting a quality education. • Several resident students said that there was not much to do on campus during the
weekends because most people go home. • Most students agreed that their experience at FIU got much better once they got
involved. Off-Campus Residents
• Numerous students were disappointed in the lack of campus life and school spirit at FIU. • Like the on-campus residents, many agreed that getting involved has enhanced their
experience at FIU. • Many commuter students are frustrated with the perception of the lack of parking on
campus. • Most students were tired of poor customer service and the student services “run around”
at FIU. On student said, “Miami is known for its bad service but you would think that FIU would be different, but it’s just as bad.”
Faculty / Staff
• Many faculty were pleased with the support that they get from the administration. • A number of faculty and staff commented that they were surprised at the sense of
community among the staff. • Some faculty and staff members feel that the university is growing too fast and the
campus is becoming too crowded.

FOCUS GROUP REPORT
Florida International University 4 Retail Demand Study
What retail/dining options do you use on and off campus? What do you like/dislike about them? In general participants frequented many of the retail and dining options on campus but most agreed that they were in need of improvement. All participants appreciated the concentration of restaurants in the Graham Center but also wished there were more food options spread throughout the campus including in many of the new academic buildings. Many opt to eat off campus or bring their lunch because the on-campus food options are not healthy and overpriced. Students, faculty and staff stated that the bookstore was too expensive and always crowded. The non-food retail options received favorable marks with the exception of the travel agency and the water massage spa as they are generally not used very often. Many faculty and staff avoid the Graham Center as much as possible because it is too crowded and the students are loud. On-Campus Residents • Most on-campus residents would like the food and retail options to be open later, especially
during finals. • A number of participants frequent the food and retail options because they have no other
alternatives living on-campus and not owning a car. • On-campus residents want improvements to the food and retail options on the south side of
campus. One student mentioned “it would be nice to have another on-campus dining option besides Fresh Foods.”
• A number of students want a smoothie option on campus as many are excited about the soon to be open Smoothie King across the street from FIU.
• Many students said that Fresh Foods is good during orientation and first week of school but then the quality drops. But there are currently not enough options available and the facility is too dark.
• A number of on-campus residents do not like having to walk all the way to the Graham Center to eat at Fresh Foods.
• Students currently eat and shop at: Publix, Walgreens, Fuddruckers, Subragious, Moe’s, Quiznos, Dolphin Mall, International Mall, Dadeland mall, Sawgrass, The Falls, Chicken Kitchen, TGI Fridays, Olive Garden, and the Roadhouse.
• Many of the female participants stated that they like Santi’s Salon. • On-campus students like the Dry Cleaners in the GC because it is convenient and affordable. • Most students felt that the book store was over priced and lacked merchandise that they
would purchase such as magazines and Greek apparel. • A number of students are not pleased that the copy store no longer sells stamps or sends
packages and they would like to see a post office on campus. Off-Campus Residents • Many people stated that the food options are limited. One off campus student said, “you can
only eat Pollo Tropical so many times before you get sick of it.” • Three students commented that Camille’s is located out of the way, too expensive and
doesn’t offer food that is appealing after working out.

FOCUS GROUP REPORT
Florida International University Retail Demand Study 5
• One student shared a story in which she wanted to meet someone for lunch and the person suggested Camille’s, she then cancelled lunch because it was too far to walk.
• Many off-campus residents chose to eat before or after they are on campus because their options are better, less expensive and more convenient.
• Most of the students were frustrated that the chain restaurants at the Graham Center do not offer the same menu as their counterparts’ off-campus.
• A few students walk across the street to eat at the Subway because of the student discount. • A number of students were upset that Fresh Foods went from $7 to $8 for dinner as they feel
a dollar makes a big difference. • Two students said that they would drive off campus to save a dollar. • A number of students said that they spend $8-$10 for a meal when they eat on campus for
lunch and only $4-$5 when they eat off campus. • Many commuter students eat breakfast at home as there are few good breakfast option on
campus. • Like the on-campus students, commuters feel that the campus bookstore is too expensive
and does not offer needed items. • Many commuter students utilize the Dry Cleaners at the GC because they do a great job. Faculty / Staff • A majority of the faculty were please with the Faculty Club as it affordable and comfortable
place to eat. • Many faculty and staff choose to eat at their desks of off campus because the food options
are not healthy. • Most faculty members avoid the GC because the lines are too long and it is too dominated by
students. • Like the students, faculty and staff had favorable things to say about the Dry Cleaners at the
GC. • Many faculty and staff members would like to see the magazine rack at the bookstore return. • A number faculty and staff members would like to be able to purchase stamps from the copy
store again. • Many faculty and staff feel that the 2nd floor library is like the GC (very social). They attribute
that to the opening of the Starbucks.

FOCUS GROUP REPORT
Florida International University 6 Retail Demand Study
What retail options would you like to see on FIU’s campus? Focus group participants had a number of suggestions for both retail and food concepts. The majority would like to see different, more affordable food vendors and more retail goods and services. Suggestions included a late night coffee house / programming venue, a bank, cellular phone store, post office, a pharmacy, among others. There was a strong desire for a Greek Store by students in fraternities and sororities. Students • Many on-campus students suggested a Panera Bread or similar type of restaurant as the
food is healthy and the atmosphere is comfortable. • Numerous on-campus students commented that they would like to see an expanded hours at
the convenience store. • A number of students think that a computer store on campus would be successful. • Students suggested a cellular phone store that services all wireless brands (AT&T, Verizon,
T-Mobile, etc). • Students would like to see more food options on campus, particularly ethnic food such as
Indian, Thai, Greek, etc. • A majority of students would like to see a new TGI Fridays, Applebee’s, Chili’s or a Sport Bar
in the space that Gracie’s currently occupies. Students would like to see an improved Rathskeller.
• Students want a place that serves draft beer. • A majority of students would like to have a Jamba Juice or similar type smoothie concept. • A number of students commented that would like a place to buy art supplies and engineering
materials as most are only available off campus. • One student suggested a video game store. • Many students said that they would like a bowling alley or enhanced pool / game hall. • A number of students suggested a Greek Store and expanded FIU merchandise. Faculty / Staff • Similar to the students, the faculty want a FedEx/Kinkos type of establishment on campus. • A faculty member suggested a weekly farmers market on campus. • Many faculty would like to have a place to get quick health care for non-serious ailments. • A majority of faculty and staff would like to see more banking services on campus. • Similar to the students a number of faculty and staff would like a place where students can
purchase classroom materials such as art, architecture and engineering supplies. • Many faculty and staff indicated a desire for a newsstand on campus or for the sale of
magazines at the bookstore.
FOCUS GROUP REPORT
Florida International University Retail Demand Study 7
What are your thoughts about a new Main Street concept? Participants were excited about the prospect of a Main Street on the southern edge of campus near the football stadium. Many feel that it will help to foster a sense of community on campus and will be an attractive amenity for both on and off-campus residents. A number of students were concerned with parking and through traffic. Faculty and staff were a little more skeptical in its success because it’s on the edge of campus and students would not want to walk to it. All were in agreement that it would great for tailgating during football season. On-Campus Residents • A majority of on-campus students think it would be great to have additional services on the
south part of campus. • Many think that parking will be an issue because most commuter students will want to drive
there. • On-campus residents think that a dining hall on Main Street would be a great amenity to the
residence halls. Off-Campus Residents • A number of off-campus students would like to see a sports bar or campus pub on Main
Street. They think it will help to keep students on campus. • Off-campus students stated that they would be more likely to stay on campus or come to
campus on the weekends if there were exciting places on Main Street. • A couple of students thought that the Main Street concept would have trouble being
successful because the center of activity on campus is the Graham center and Main Street is too far from most buildings on campus. The perception from many students was that they were going to drive to Main Street from other portions of the campus.
• One student commented that the school needs a winning football team to generate excitement for the area first.
Faculty / Staff • Many faculty and staff think that the key to Main Street’s success will be to get commuters to
spend time there. • Like the students, many thought it would be a great amenity for the campus. • A number of faculty and staff would like to see a few establishments that would cater to them. • All faculty and staff participants agreed that it will help to foster a sense of place on campus. • Many think that Main Street will be a great recruitment and retention tool.


Exhibit C

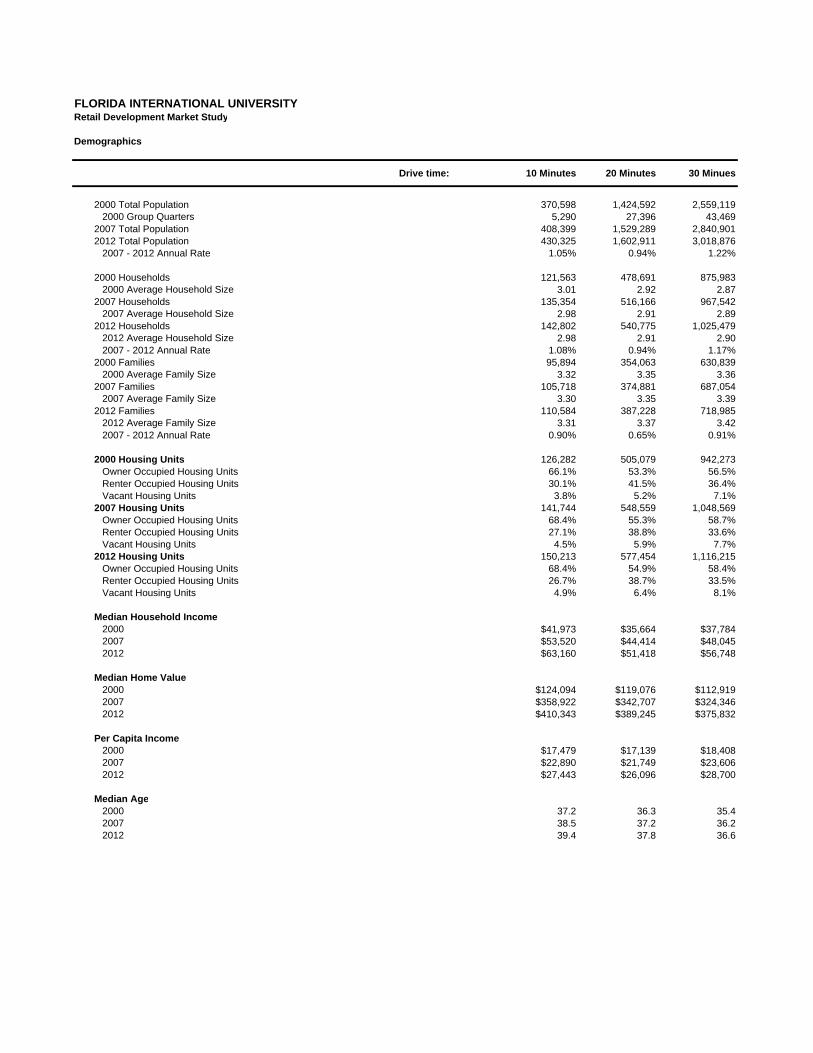
FLORIDA INTERNATIONAL UNIVERSITYRetail Development Market Study
Demographics
Drive time: 10 Minutes 20 Minutes 30 Minues
2000 Total Population 370,598 1,424,592 2,559,119 2000 Group Quarters 5,290 27,396 43,4692007 Total Population 408,399 1,529,289 2,840,9012012 Total Population 430,325 1,602,911 3,018,876 2007 - 2012 Annual Rate 1.05% 0.94% 1.22%
2000 Households 121,563 478,691 875,983 2000 Average Household Size 3.01 2.92 2.872007 Households 135,354 516,166 967,542 2007 Average Household Size 2.98 2.91 2.892012 Households 142,802 540,775 1,025,479 2012 Average Household Size 2.98 2.91 2.90 2007 - 2012 Annual Rate 1.08% 0.94% 1.17%2000 Families 95,894 354,063 630,839 2000 Average Family Size 3.32 3.35 3.362007 Families 105,718 374,881 687,054 2007 Average Family Size 3.30 3.35 3.392012 Families 110,584 387,228 718,985 2012 Average Family Size 3.31 3.37 3.42 2007 - 2012 Annual Rate 0.90% 0.65% 0.91%
2000 Housing Units 126,282 505,079 942,273 Owner Occupied Housing Units 66.1% 53.3% 56.5% Renter Occupied Housing Units 30.1% 41.5% 36.4% Vacant Housing Units 3.8% 5.2% 7.1%2007 Housing Units 141,744 548,559 1,048,569 Owner Occupied Housing Units 68.4% 55.3% 58.7% Renter Occupied Housing Units 27.1% 38.8% 33.6% Vacant Housing Units 4.5% 5.9% 7.7%2012 Housing Units 150,213 577,454 1,116,215 Owner Occupied Housing Units 68.4% 54.9% 58.4% Renter Occupied Housing Units 26.7% 38.7% 33.5% Vacant Housing Units 4.9% 6.4% 8.1%
Median Household Income 2000 $41,973 $35,664 $37,784 2007 $53,520 $44,414 $48,045 2012 $63,160 $51,418 $56,748
Median Home Value 2000 $124,094 $119,076 $112,919 2007 $358,922 $342,707 $324,346 2012 $410,343 $389,245 $375,832
Per Capita Income 2000 $17,479 $17,139 $18,408 2007 $22,890 $21,749 $23,606 2012 $27,443 $26,096 $28,700
Median Age 2000 37.2 36.3 35.4 2007 38.5 37.2 36.2 2012 39.4 37.8 36.6

FLORIDA INTERNATIONAL UNIVERSITYRetail Development Market Study
Demographics
Drive time: 10 Minutes 20 Minutes 30 Minues
2000 Households by IncomeHousehold Income Base 121,535 478,530 876,382 < $15,000 15.3% 21.7% 20.0% $15,000 - $24,999 12.3% 14.4% 13.9% $25,000 - $34,999 13.0% 13.0% 12.8% $35,000 - $49,999 18.0% 15.9% 15.7% $50,000 - $74,999 20.3% 16.7% 17.5% $75,000 - $99,999 10.5% 8.3% 9.0% $100,000 - $149,999 7.3% 6.1% 6.8% $150,000 - $199,999 1.7% 1.8% 2.0% $200,000 + 1.5% 2.1% 2.4%Average Household Income $52,794 $50,060 $52,958
2007 Households by IncomeHousehold Income Base 135,352 516,158 967,531 < $15,000 11.4% 17.2% 15.5% $15,000 - $24,999 9.4% 12.1% 11.2% $25,000 - $34,999 10.2% 11.1% 10.7% $35,000 - $49,999 15.4% 14.7% 14.2% $50,000 - $74,999 21.2% 18.2% 18.3% $75,000 - $99,999 12.9% 10.3% 11.1% $100,000 - $149,999 12.4% 9.7% 10.9% $150,000 - $199,999 3.9% 3.3% 3.9% $200,000 + 3.2% 3.5% 4.1%Average Household Income $69,250 $63,594 $68,655
2012 Households by IncomeHousehold Income Base 142,800 540,767 1,025,469 < $15,000 9.6% 15.1% 13.4% $15,000 - $24,999 7.9% 10.3% 9.5% $25,000 - $34,999 8.4% 9.9% 9.2% $35,000 - $49,999 13.1% 13.5% 12.9% $50,000 - $74,999 19.6% 17.1% 17.1% $75,000 - $99,999 14.5% 11.7% 12.0% $100,000 - $149,999 16.0% 12.6% 14.1% $150,000 - $199,999 5.3% 4.3% 5.0% $200,000 + 5.5% 5.5% 6.7%Average Household Income $83,313 $76,438 $83,844
2000 Owner Occupied HUs by ValueTotal 83,479 268,912 532,754 < $50,000 3.9% 5.3% 7.6% $50,000 - $99,999 31.4% 32.7% 34.7% $100,000 - $149,999 35.6% 32.0% 28.6% $150,000 - $199,999 19.3% 15.8% 14.5% $200,000 - $299,999 7.0% 8.2% 8.4% $300,000 - $499,999 2.5% 4.2% 4.1% $500,000 - $999,999 0.3% 1.5% 1.6% $1,000,000+ 0.1% 0.2% 0.4%Average Home Value $133,535 $144,065 $143,452
2000 Specified Renter Occupied HUs by Contract RentTotal 37,945 209,260 342,464 With Cash Rent 96.7% 97.5% 97.2% No Cash Rent 3.3% 2.5% 2.8%Median Rent $693 $566 $578Average Rent $699 $568 $593

FLORIDA INTERNATIONAL UNIVERSITYRetail Development Market Study
Demographics
Drive time: 10 Minutes 20 Minutes 30 Minues
2000 Population by AgeTotal 370,597 1,424,592 2,559,120 0 - 4 5.6% 6.2% 6.7% 5 - 9 6.2% 6.8% 7.3% 10 - 14 6.5% 7.0% 7.4% 15 - 19 6.6% 6.8% 6.9% 20 - 24 6.6% 6.4% 6.2% 25 - 34 14.7% 14.7% 14.9% 35 - 44 16.1% 16.0% 16.5% 45 - 54 12.8% 12.5% 12.6% 55 - 64 10.4% 9.7% 8.8% 65 - 74 8.0% 7.7% 6.9% 75 - 84 4.8% 4.6% 4.3% 85+ 1.8% 1.7% 1.6% 18+ 77.7% 75.9% 74.4%
2007 Population by AgeTotal 408,396 1,529,289 2,840,901 0 - 4 5.9% 6.4% 6.9% 5 - 9 5.8% 6.1% 6.6% 10 - 14 6.1% 6.6% 7.0% 15 - 19 6.4% 7.0% 7.2% 20 - 24 6.3% 6.8% 6.8% 25 - 34 14.4% 14.0% 13.7% 35 - 44 16.1% 15.5% 15.7% 45 - 54 13.7% 13.6% 13.9% 55 - 64 10.3% 9.9% 9.5% 65 - 74 7.8% 7.4% 6.5% 75 - 84 5.1% 4.9% 4.3% 85+ 2.1% 1.9% 1.8% 18+ 78.4% 76.6% 75.1%
2012 Population by AgeTotal 430,326 1,602,911 3,018,875 0 - 4 6.0% 6.6% 7.1% 5 - 9 5.6% 6.0% 6.4% 10 - 14 5.8% 6.0% 6.4% 15 - 19 6.0% 6.5% 6.7% 20 - 24 6.5% 7.4% 7.3% 25 - 34 13.7% 13.9% 13.9% 35 - 44 14.4% 13.7% 13.7% 45 - 54 15.5% 14.8% 14.8% 55 - 64 11.3% 11.0% 10.8% 65 - 74 7.6% 7.2% 6.4% 75 - 84 5.2% 4.9% 4.3% 85+ 2.3% 2.1% 2.0% 18+ 79.0% 77.6% 76.0%
2000 Population by Sex Males 47.2% 48.1% 48.2% Females 52.8% 51.9% 51.8%2007 Population by Sex Males 47.5% 48.3% 48.4% Females 52.5% 51.7% 51.6%2012 Population by Sex Males 47.6% 48.5% 48.5% Females 52.4% 51.5% 51.5%

FLORIDA INTERNATIONAL UNIVERSITYRetail Development Market Study
Demographics
Drive time: 10 Minutes 20 Minutes 30 Minues
2000 Population by Race/EthnicityTotal 370,600 1,424,592 2,559,117 White Alone 88.5% 77.1% 69.2% Black Alone 2.3% 12.8% 20.5% American Indian Alone 0.1% 0.2% 0.2% Asian or Pacific Islander Alone 1.5% 1.3% 1.7% Some Other Race Alone 4.4% 4.8% 4.5% Two or More Races 3.2% 3.7% 3.8%Hispanic Origin 80.1% 68.9% 53.2%Diversity Index 46.6 65.0 73.8
2007 Population by Race/EthnicityTotal 408,399 1,529,289 2,840,902 White Alone 88.3% 77.5% 69.2% Black Alone 2.3% 11.9% 19.6% American Indian Alone 0.1% 0.2% 0.2% Asian or Pacific Islander Alone 1.5% 1.4% 1.9% Some Other Race Alone 4.5% 5.2% 5.1% Two or More Races 3.2% 3.8% 4.0%Hispanic Origin 85.6% 75.2% 59.8%Diversity Index 41.1 61.4 73.1
2012 Population by Race/EthnicityTotal 430,324 1,602,911 3,018,876 White Alone 88.5% 77.9% 69.4% Black Alone 2.2% 11.3% 18.8% American Indian Alone 0.1% 0.2% 0.2% Asian or Pacific Islander Alone 1.4% 1.4% 2.0% Some Other Race Alone 4.6% 5.4% 5.5% Two or More Races 3.2% 3.9% 4.1%Hispanic Origin 88.7% 78.7% 64.1%Diversity Index 37.4 58.7 72.0
2000 Population 3+ by School EnrollmentTotal 358,181 1,371,567 2,458,161 Enrolled in Nursery/Preschool 1.6% 1.7% 2.0% Enrolled in Kindergarten 1.3% 1.5% 1.6% Enrolled in Grade 1-8 10.8% 11.7% 12.5% Enrolled in Grade 9-12 6.0% 6.6% 6.9% Enrolled in College 7.4% 6.2% 6.0% Enrolled in Grad/Prof School 1.6% 1.3% 1.3% Not Enrolled in School 71.4% 71.0% 69.7%
2000 Population 25+ by Educational AttainmentTotal 253,662 953,389 1,679,004 Less than 9th Grade 13.2% 16.7% 13.4% 9th - 12th Grade, No Diploma 15.4% 18.2% 16.7% High School Graduate 21.5% 21.5% 23.1% Some College, No Degree 19.4% 16.8% 18.2% Associate Degree 7.5% 6.2% 6.7% Bachelor's Degree 13.4% 11.8% 12.7% Master's/Prof/Doctorate Degree 9.7% 8.9% 9.0%

FLORIDA INTERNATIONAL UNIVERSITYRetail Development Market Study
Demographics
Drive time: 10 Minutes 20 Minutes 30 Minues
2000 Population 15+ by Sex and Marital StatusTotal 302,156 1,139,798 2,013,605 Females 53.8% 52.8% 52.7% Never Married 11.4% 12.7% 13.2% Married, not Separated 27.2% 25.1% 25.0% Married, Separated 1.9% 2.1% 2.1% Widowed 5.9% 5.8% 5.6% Divorced 7.4% 7.2% 6.9% Males 46.2% 47.2% 47.3% Never Married 12.8% 14.4% 15.0% Married, not Separated 27.3% 25.7% 25.3% Married, Separated 1.0% 1.4% 1.4% Widowed 1.0% 1.1% 1.1% Divorced 4.1% 4.5% 4.4%
2000 Population 16+ by Employment StatusTotal 297,672 1,120,814 1,977,356 In Labor Force 59.0% 56.7% 59.1% Civilian Employed 54.9% 51.8% 54.2% Civilian Unemployed 4.0% 4.8% 4.8% In Armed Forces 0.1% 0.1% 0.1% Not in Labor Force 41.0% 43.3% 40.9%
2007 Civilian Population 16+ in Labor Force Civilian Employed 94.5% 92.8% 93.1% Civilian Unemployed 5.5% 7.2% 6.9%
2012 Civilian Population 16+ in Labor Force Civilian Employed 95.4% 93.9% 94.2% Civilian Unemployed 4.6% 6.1% 5.8%
2000 Females 16+ by Employment Status and Age of ChildrenTotal 160,383 592,102 1,042,622 Own Children < 6 Only 6.7% 6.9% 7.3% Employed/in Armed Forces 3.9% 3.7% 4.1% Unemployed 0.2% 0.4% 0.5% Not in Labor Force 2.5% 2.8% 2.7% Own Children <6 and 6-17 5.3% 5.7% 6.2% Employed/in Armed Forces 3.0% 2.9% 3.4% Unemployed 0.3% 0.4% 0.4% Not in Labor Force 2.0% 2.3% 2.4% Own Children 6-17 Only 16.6% 17.0% 17.8% Employed/in Armed Forces 10.3% 10.3% 11.2% Unemployed 1.0% 1.1% 1.0% Not in Labor Force 5.3% 5.7% 5.5% No Own Children <18 71.4% 70.5% 68.7% Employed/in Armed Forces 31.2% 28.6% 29.4% Unemployed 2.5% 3.1% 3.1% Not in Labor Force 37.7% 38.8% 36.2%

FLORIDA INTERNATIONAL UNIVERSITYRetail Development Market Study
Demographics
Drive time: 10 Minutes 20 Minutes 30 Minues
2007 Employed Population 16+ by IndustryTotal 183,048 639,270 1,238,333 Agriculture/Mining 0.4% 0.4% 0.5% Construction 8.0% 9.2% 8.6% Manufacturing 4.7% 5.9% 5.2% Wholesale Trade 5.9% 5.3% 4.8% Retail Trade 12.7% 12.1% 12.1% Transportation/Utilities 8.2% 7.4% 7.0% Information 2.5% 2.3% 2.4% Finance/Insurance/Real Estate 9.8% 8.7% 8.8% Services 44.1% 45.1% 46.4% Public Administration 3.5% 3.6% 4.3%
2007 Employed Population 16+ by OccupationTotal 183,048 639,270 1,238,332 White Collar 65.0% 59.7% 60.5% Management/Business/Financial 14.1% 12.4% 13.0% Professional 17.3% 17.2% 18.4% Sales 15.4% 13.9% 13.6% Administrative Support 18.1% 16.2% 15.5% Services 16.1% 17.6% 18.5% Blue Collar 18.9% 22.6% 21.1% Farming/Forestry/Fishing 0.2% 0.2% 0.4% Construction/Extraction 5.7% 7.4% 6.8% Installation/Maintenance/Repair 4.3% 4.6% 4.4% Production 3.3% 4.4% 3.8% Transportation/Material Moving 5.3% 6.0% 5.7%
2000 Workers 16+ by Means of Transportation to WorkTotal 160,031 567,746 1,047,393 Drove Alone - Car, Truck, or Van 79.3% 75.1% 75.3% Carpooled - Car, Truck, or Van 13.7% 14.5% 14.2% Public Transportation 2.4% 4.8% 4.6% Walked 1.0% 1.8% 1.9% Other Means 0.9% 1.4% 1.4% Worked at Home 2.6% 2.4% 2.6%
2000 Workers 16+ by Travel Time to WorkTotal 160,030 567,746 1,047,393 Did not Work at Home 97.4% 97.6% 97.4% Less than 5 minutes 0.8% 1.1% 1.2% 5 to 9 minutes 4.1% 5.4% 5.6% 10 to 19 minutes 22.1% 24.2% 23.2% 20 to 24 minutes 14.4% 14.1% 14.1% 25 to 34 minutes 25.7% 24.7% 24.9% 35 to 44 minutes 8.0% 7.1% 7.6% 45 to 59 minutes 12.6% 10.8% 11.1% 60 to 89 minutes 7.5% 7.4% 7.0% 90 or more minutes 2.3% 2.8% 2.8% Worked at Home 2.6% 2.4% 2.6%Average Travel Time to Work (in min) 30.8 30.1 30.2
2000 Households by Vehicles AvailableTotal 121,473 478,619 875,897 None 7.6% 13.9% 13.1% 1 34.0% 37.0% 37.6% 2 40.7% 35.0% 35.7% 3 12.7% 10.2% 10.0% 4 3.9% 3.0% 2.7% 5+ 1.1% 1.0% 0.9%Average Number of Vehicles Available 1.8 1.5 1.5

FLORIDA INTERNATIONAL UNIVERSITYRetail Development Market Study
Demographics
Drive time: 10 Minutes 20 Minutes 30 Minues
2000 Households by TypeTotal 121,563 478,691 875,982 Family Households 78.9% 74.0% 72.0% Married-couple Family 57.3% 50.5% 49.3% With Related Children 28.8% 25.9% 26.1% Other Family (No Spouse) 21.6% 23.4% 22.7% With Related Children 11.0% 13.4% 13.9% Nonfamily Households 21.1% 26.0% 28.0% Householder Living Alone 16.1% 20.4% 22.1% Householder Not Living Alone 5.0% 5.6% 5.9%
Households with Related Children 39.7% 39.4% 40.0%Households with Persons 65+ 30.9% 29.6% 26.7%
2000 Households by SizeTotal 121,563 478,691 875,983 1 Person Household 16.1% 20.4% 22.1% 2 Person Household 27.9% 27.4% 27.6% 3 Person Household 21.2% 19.7% 18.7% 4 Person Household 18.8% 16.9% 16.4% 5 Person Household 9.4% 8.8% 8.7% 6 Person Household 3.9% 3.8% 3.8% 7+ Person Household 2.6% 2.8% 2.8%
2000 Households by Year Householder Moved InTotal 121,474 478,619 875,899 Moved in 1999 to March 2000 19.7% 21.8% 22.6% Moved in 1995 to 1998 31.1% 31.1% 32.3% Moved in 1990 to 1994 17.0% 16.4% 17.2% Moved in 1980 to 1989 19.1% 16.1% 15.2% Moved in 1970 to 1979 9.3% 9.1% 8.1% Moved in 1969 or Earlier 3.7% 5.4% 4.7%Median Year Householder Moved In 1995 1995 1996
2000 Housing Units by Units in StructureTotal 126,343 505,062 943,178 1, Detached 45.9% 45.0% 47.0% 1, Attached 19.2% 13.3% 10.4% 2 1.3% 2.9% 2.6% 3 or 4 2.5% 4.5% 3.9% 5 to 9 3.9% 6.0% 5.2% 10 to 19 4.7% 6.2% 6.3% 20+ 20.0% 20.4% 22.2% Mobile Home 2.5% 1.6% 2.4% Other 0.0% 0.0% 0.1%
2000 Housing Units by Year Structure BuiltTotal 126,211 505,062 942,189 1999 to March 2000 1.7% 1.3% 2.3% 1995 to 1998 6.7% 5.1% 7.7% 1990 to 1994 8.2% 7.4% 8.5% 1980 to 1989 29.3% 20.1% 18.6% 1970 to 1979 29.0% 22.9% 21.4% 1969 or Earlier 25.0% 43.1% 41.6%Median Year Structure Built 1979 1973 1974

FLORIDA INTERNATIONAL UNIVERSITYRetail Development Market Study
Demographics
Drive time: 10 Minutes 20 Minutes 30 Minues
Top 3 Tapestry Segments
1. Pleasant-Ville NeWest Residents
Industrious Urban Fringe
2.Industrious
Urban Fringe Industrious
Urban FringeNeWest
Residents
3.Retirement
Communities Pleasant-Ville Up and Coming Families
Apparel & Services: Total $ $325,759,356 $1,166,044,678 $2,339,703,099Average Spent $2,406.72 $2,259.05 $2,418.19Spending Potential Index 88 82 88
Computers & Accessories: Total $ $32,660,879 $115,794,163 $234,005,272Average Spent $241.30 $224.34 $241.86Spending Potential Index 97 90 97
Education: Total $ $168,566,433 $580,286,277 $1,176,534,935Average Spent $1,245.37 $1,124.22 $1,216.00Spending Potential Index 97 88 95
Entertainment/Recreation: Total $ $434,025,719 $1,497,370,283 $3,045,639,228Average Spent $3,206.60 $2,900.95 $3,147.81Spending Potential Index 94 85 92
Food at Home: Total $ $643,062,169 $2,336,517,339 $4,666,016,555Average Spent $4,750.97 $4,526.68 $4,822.55Spending Potential Index 94 90 96
Food Away from Home: Total $ $434,642,450 $1,554,536,900 $3,129,094,200Average Spent $3,211.15 $3,011.70 $3,234.07Spending Potential Index 95 89 95
Health Care: Total $ $470,285,980 $1,622,282,098 $3,315,560,498Average Spent $3,474.49 $3,142.95 $3,426.79Spending Potential Index 89 80 88
HH Furnishings & Equipment: Total $ $282,250,652 $968,246,089 $1,969,931,797Average Spent $2,085.28 $1,875.84 $2,036.02Spending Potential Index 92 83 90
Investments: Total $ $200,995,636 $638,240,903 $1,335,397,258Average Spent $1,484.96 $1,236.50 $1,380.20Spending Potential Index 100 83 93
Retail Goods: Total $ $3,286,991,544 $11,599,680,260 $23,414,553,759Average Spent $24,284.41 $22,472.77 $24,200.04Spending Potential Index 92 85 91
Shelter: Total $ $2,032,147,658 $7,186,334,398 $14,445,109,746Average Spent $15,013.58 $13,922.53 $14,929.70Spending Potential Index 100 93 99
TV/Video/Sound Equipment:Total $ $147,559,318 $527,376,253 $1,064,203,141Average Spent $1,090.17 $1,021.72 $1,099.90Spending Potential Index 94 88 95
Travel: Total $ $241,957,909 $819,335,621 $1,669,137,491Average Spent $1,787.59 $1,587.35 $1,725.13Spending Potential Index 97 86 93
Vehicle Maintenance & Repairs: Total $ $137,306,244 $488,080,094 $983,672,538Average Spent $1,014.42 $945.59 $1,016.67Spending Potential Index 95 89 95

Exhibit D


MANAGEMENT OPTIONS
Florida International University Retail Demand Study 1
Objectives
B&D was asked to take a preliminary look at potential management options for the proposed retail developments on the FIU campus. There are several potential management scenarios available to the University as the projects move forward. The final decision of which option to proceed with will be based on:
• The degree of risk the University seeks to assume or shed. • The amount of existing and future resources the University seeks to commit to
these services. • The degree of autonomy that is desired by the University for these services. • The market conditions that exist in the area. • The level of management infrastructure the University wishes to maintain in the
delivery of these services. • How these services fit into the core academic mission of the University.
Management Scenarios These structures range from the traditional, University-managed operations to the extreme of a private management entity assuming responsibility for all operations. A mix of public-private partnership options exists between these extremes. The following is a summary of three potential management scenarios that could be used by the University in the management of the new retail developments. Approach I: Traditional University-Managed Operations Using this scenario, FIU would be responsible for developing, owning and operating all aspects of auxiliary-related services. The financial resources of the University would fund all capital and operational aspects of the projects. Their budgets and development are part of the larger scheme of the University, with annual and long-range goals directly tied to University funding. Currently, UC, San Diego and the University of Cincinnati’s Main Street operate from this model. Pros:
• University has highest degree of control. • University retains surplus cash flow. • Cheapest cost of capital. • Projects can be mission focused and allow for resources to be used that can help support
certain entities and business units. • University could potentially outsource some services (similar to the current agreements
with Aramark and Barnes & Noble) which can report to a qualified manager that monitors and measures their performance.

MANAGEMENT OPTIONS
Florida International University 2 Retail Demand Study
Cons:
• All projects are on the University books and impact debt capacity. • Business side of these operations is subject to University budget pressures. • Potential lack of private company expertise. • Fund accounting used by most universities not suited to these operations. • Any losses must be absorbed by University budget. • Labor costs, including benefits mandated by the University, are generally higher than the
off-campus market. Approach I-A: A Campus Auxiliary Services Committee A subset of Approach I, the key managers from each of the service entities would be empowered by the CFO of FIU to set guidelines for the general operating conditions for both the specific entities and the overall direction of the auxiliary units. This group would control cross competition and insure that service delivery needs were met during non-peak use periods (i.e. set territorial service boundaries, determine expansion criteria and common area maintenance rates where appropriate, etc.) Approach II: Affiliated Nonprofit Organization / Special Purpose Entity (“SPE”) Under this scenario, a nonprofit entity created by FIU assumes responsibility for the day-to-day operations and capital funding of these services. The nonprofit entity is a special purpose organization tasked by the University to operate these services. The organizations can implement their own management schemes, funding sources, accounting systems, etc., and generally be more market driven. The SPE may still use tax-exempt financing, although some of the debt would show up on the University’s credit. Generally a ground lease is utilized to specify who does what and at what cost for each entity.The nonprofit Board of Directors is dominated by University personnel, with management reporting directly to it. Generally any gain after funding all costs and capital obligations is returned to the University to fund campus-wide initiatives not budgeted or funded by University budget structures. Currently, the Ohio State University South Campus Gateway and the University of Central Florida Knight Plaza operate in this scenario. Pros:
• Arms distance relationship with a special purpose entity that is tied to the mission of the University, but has operational characteristics that are more market driven.
• SPE is allowed to develop its own management and payroll policies, making it generally more efficient and customer driven.
• Surpluses from operations can be returned to fund the growth and development of these organizations, and also fund general University initiatives approved by their board of directors.
• Low cost of capital.

MANAGEMENT OPTIONS
Florida International University Retail Demand Study 3
• Project may be able to achieve off-balance sheet financing. Cons:
• No guarantee that these organizations can return any surpluses after funding all of their operational and capital needs.
• Additional layer to the organization. • Project may still be considered on-balance sheet depending on numerous factors
including the University’s involvement in the project and the SPE. Approach III: A Privately Sponsored Development Under this approach, a private developer would lease the land from the University and develop, finance, own and operate certain units and potentially lease back some space to the University for its operations. The project would be financed with a conventional commercial loan and private equity. Currently, RIT Park Point and Florida Atlantic University operate under this scenario. Pros:
• Allows for greatest expertise. • Project may be considered off-balance sheet. • Could potentially reduce the risk for the campus. • Project could be delivered faster.
Cons:
• Lack of University control, especially related to design, construction, and operations. • Highest cost of capital. • Project may still be considered on-balance sheet depending on numerous factors
including the University’s involvement in the project. Issues to Consider When Deciding Between Scenarios There are a number of issues to consider when evaluating which ownership structure best suits the needs of the University. These issues include the type and cost of financing, project control, and ease of implementation. An important factor to consider when deciding between various ownership structures is the level of control the University wants to have over the project and continuing operations. Clearly, under the traditional model (Approach I), the University has the greatest degree of control over the development and operation of the facility. As other partners are brought into the project, however, the University’s direct control will diminish. This will especially be the case if private equity funds are utilized. There are several possible areas of conflict over control issues including the design and construction materials of the facility, the types and amount of common

MANAGEMENT OPTIONS
Florida International University 4 Retail Demand Study
areas in the facility, the level of rent, the services provided to students, and the level of maintenance for the facility. The campus also needs to consider the ability to implement the project under each scenario. The ease of implementing has direct impact on costs in a number of ways. The time required to plan and develop a project will likely be different under each of the possible approaches for development and management. Private entities can usually develop the project more quickly, which provides cost savings. Another issue that may influence the ease of implementation is FIU’s contracting and procurement procedures. A complex organizational structure can add various legal and financial costs to the project. The University must determine its priorities and then closely examine each possible scenario to decide which development strategy will help the University best reach the goals of the project. Preliminary Recommendations While it is too early in the process to make final recommendations, the following observations can be made. Main Street Clearly this project is going to be critical to the University’s mission due to its location adjacent to the football stadium, PAC, and residence halls. Because the project drivers are to be self-sustaining, the campus would probably look to focus on a model that gives the campus the most control. That is likely going to be in scenario one or two. Options one or two also allow the opportunity at a later date to consider other management if FIU chose to exercise a different level of control in the future. Both models allow the University to exercise a degree of control consistent with the goals and objects of the project, while the SPE allows the ability to provide a potentially more integrated and responsive organization with more nimble management and financial flexibility. 8th Street By its location on the campus edge, the project does have the ability for a private entity to build and operate it. Therefore, option three is certainly a viable option for the campus to consider. This model will allow for private equity to come into the equation, potentially offering the University more options to utilize financial structuring not available to a typical University-funded project. 8th Street under a private entity scenario must provide the University with significant financial benefit to allow this land to pass into the hands of a private entity through a long-term ground lease, while still being consistent and in concert with the University Master Plan. The overarching question is how much control over the project does the campus want and how consistent does it need to be with the overall development of the Academic Health Sciences Campus.


![[Draft 1]retail marketing presentation](https://static.fdocuments.us/doc/165x107/549790d3b479594c4d8b5201/draft-1retail-marketing-presentation.jpg)