
Retail analytics - Improvising pricing strategy using markup/markdown
36
PRICING STARTEGY FOR RETALERS. EVERY PENNY MATTERS….. Jahnavi Gangula Reddy - 50125205 Komal Hanamasagar - 50123141 Smitha Mysore Lokesh - 50124016
-
Upload
smitha-mysore-lokesh -
Category
Data & Analytics
-
view
319 -
download
1
Transcript of Retail analytics - Improvising pricing strategy using markup/markdown

PRICING
STARTEGY
FOR
RETALERS.
EVERY PENNY MATTERS…..
Jahnavi Gangula Reddy - 50125205
Komal Hanamasagar - 50123141
Smitha Mysore Lokesh - 50124016
1 | P a g e
CONTENTS
Introduction ..................................................................................................................................... 2
Project Plan ..................................................................................................................................... 3
Budget & Timeline ...................................................................................................................... 3
Roles and Responsibility ............................................................................................................. 4
Project Development ....................................................................................................................... 5
Need Analysis .............................................................................................................................. 5
Success Criteria ........................................................................................................................... 6
Goals ............................................................................................................................................ 6
Bus Matrix. .................................................................................................................................. 7
Stakeholder matrix ....................................................................................................................... 8
Key Performance Indicator .......................................................................................................... 8
Dimensions .................................................................................................................................. 9
Fact Tables:................................................................................................................................ 10
Dimensional Model for the project. ........................................................................................... 11
ETL Process .................................................................................................................................. 12
ETL for our systems: ................................................................................................................. 13
SQL Server Integration Services: .............................................................................................. 14
Visualization for Business Intelligence ........................................................................................ 24
Inventory .................................................................................................................................... 24
Inventory Dashboard ................................................................................................................. 29
Sales ........................................................................................................................................... 30
Sales Dashboard ........................................................................................................................ 34
Conclusion .................................................................................................................................... 35

2 | P a g e
INTRODUCTION
The retail services industry provides an openly competitive environment that fosters strong
business operations and spurs innovations that increase efficiency and reliability. Numerous
opportunities for growth exist in the U.S. retail market for retail providers of all sizes, including
individual direct marketers or direct sellers, small- to medium-sized franchise unit owners, and
large “big-box” store operators. New distribution companies are opening stores and units daily to
serve a large, affluent consumer base. It is for this reason that they often involve pricing strategy.
Price Markup is a strategy used by the retail industry to introduce percentage increase in price to
increase the profit margin of highly demanded products and Price Markdown is to introduce
discount on products with an aim to get rid of slow moving products. These strategies may not
always lead to high profitability, however the need is to optimize the pricing strategies for effective
output. Our project aims to design data warehouse design for retail industry and help to achieve
maximum profit, by strategically optimizing the markup and markdown.
Price markup and markdowns are among few challenges that retail industry needs to balance
to stay ahead in the competitive market. Too frequent markdowns to assist in fast movement of
products may lead lack in goods selling at their actual price and also create reluctance in customer
towards the good. On the other hand frequent markup to increase profit may lead to loss of
customer and decrease the demand for the product. Therefore, it’s important for the retail industry
to optimize their pricing strategy.
We this project we aim to design a data warehouse to address the above issues in pricing and
suggest methodologies to develop and implement optimum pricing for retail industry.
3 | P a g e
PROJECT PLAN
BUDGET & TIMELINE
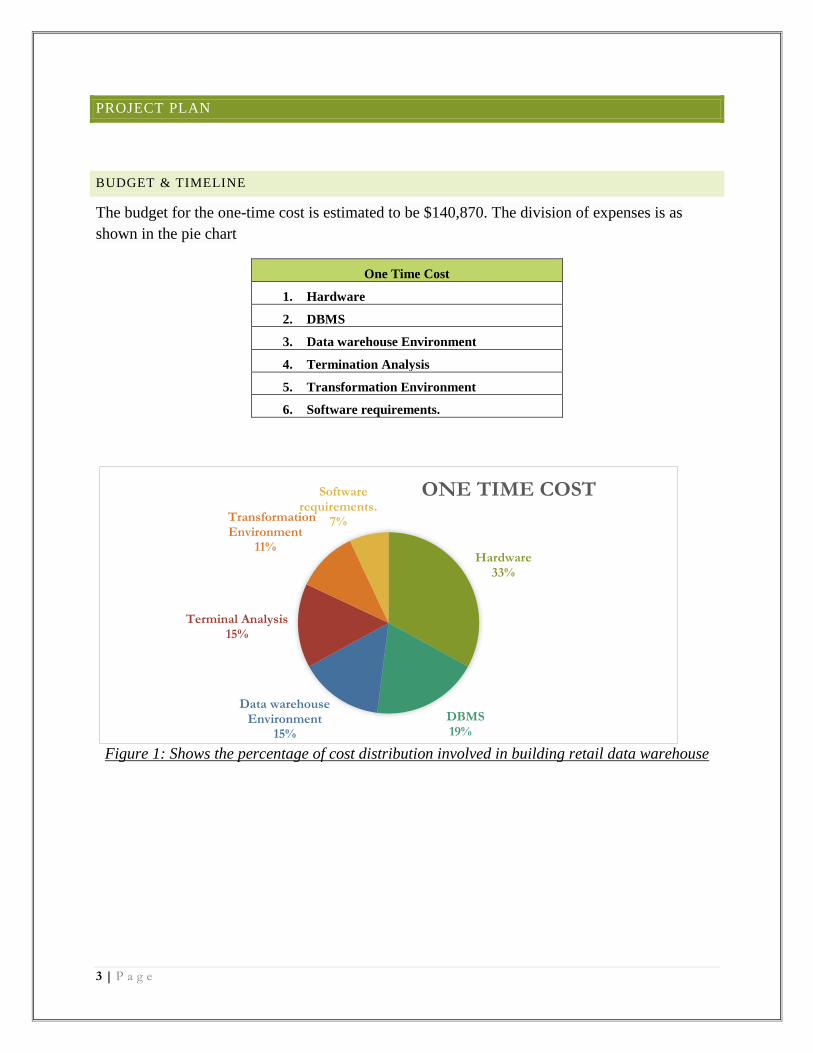
The budget for the one-time cost is estimated to be $140,870. The division of expenses is as
shown in the pie chart
One Time Cost
1. Hardware
2. DBMS
3. Data warehouse Environment
4. Termination Analysis
5. Transformation Environment
6. Software requirements.
Figure 1: Shows the percentage of cost distribution involved in building retail data warehouse
Hardware33%
DBMS19%
Data warehouse Environment
15%
Terminal Analysis15%
Transformation Environment
11%
Software requirements.
7%
ONE TIME COST
4 | P a g e
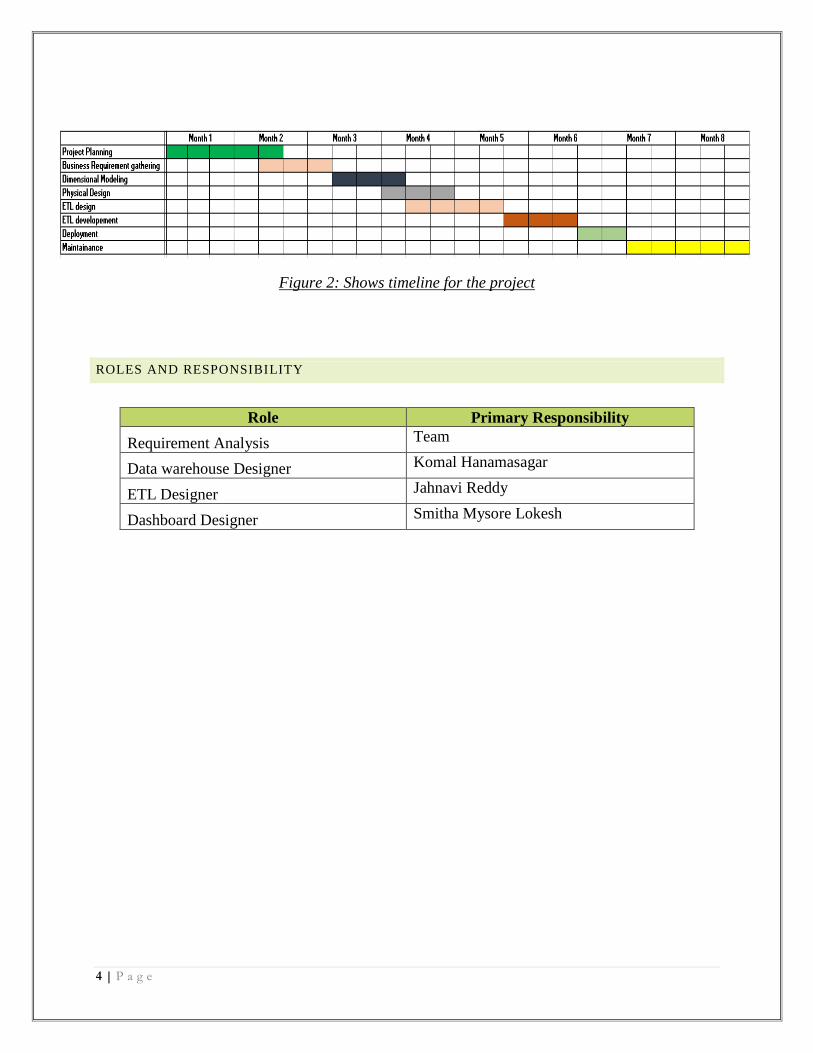
Figure 2: Shows timeline for the project
ROLES AND RESPONSIBILITY
Role Primary Responsibility
Requirement Analysis Team
Data warehouse Designer Komal Hanamasagar
ETL Designer Jahnavi Reddy
Dashboard Designer Smitha Mysore Lokesh
5 | P a g e
PROJECT DEVELOPMENT
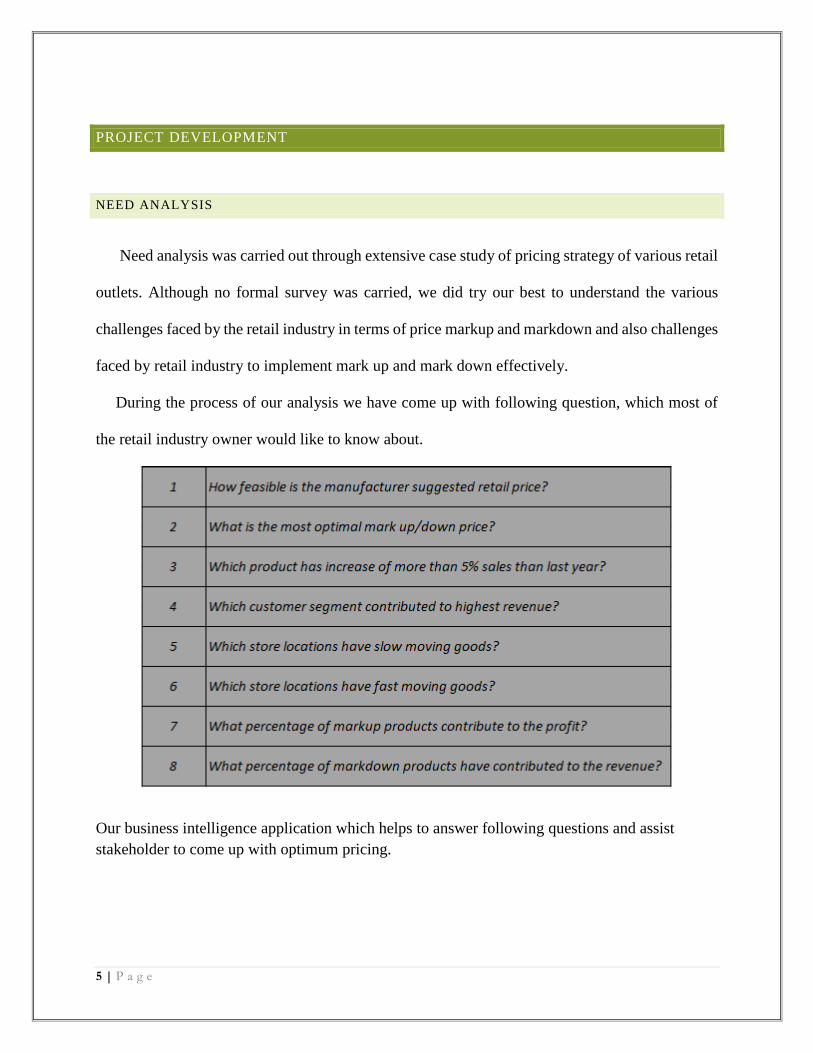
NEED ANALYSIS
Need analysis was carried out through extensive case study of pricing strategy of various retail
outlets. Although no formal survey was carried, we did try our best to understand the various
challenges faced by the retail industry in terms of price markup and markdown and also challenges
faced by retail industry to implement mark up and mark down effectively.
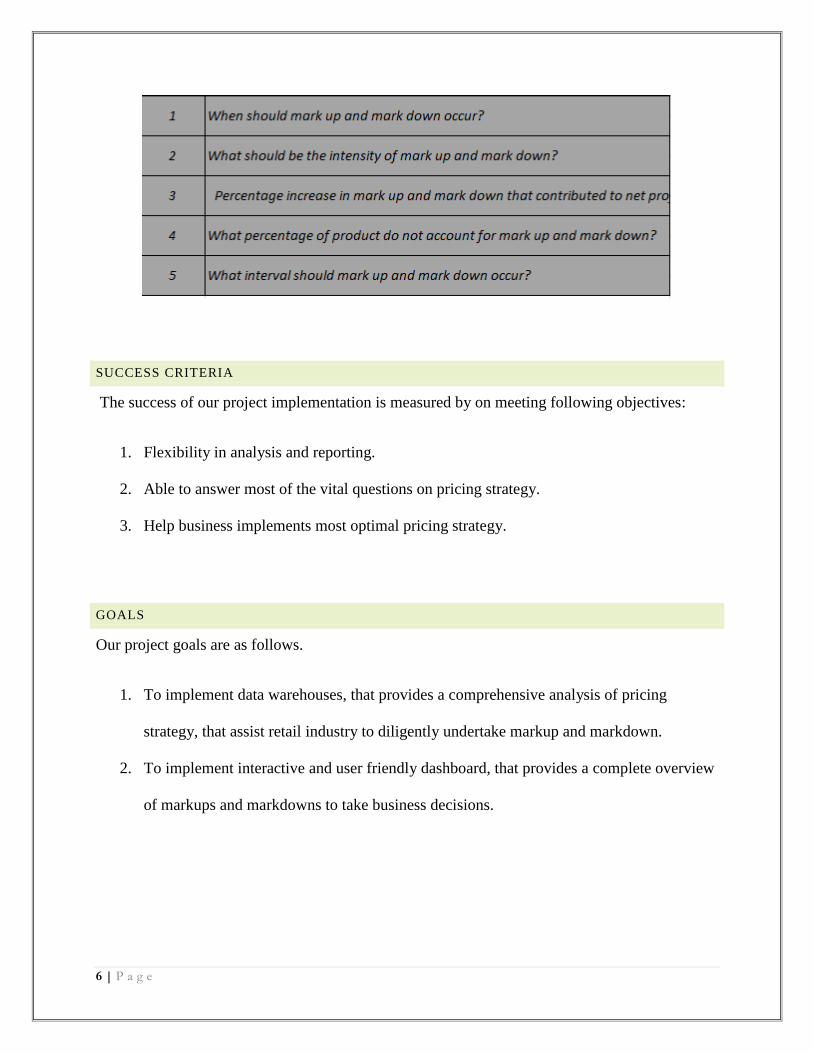
During the process of our analysis we have come up with following question, which most of
the retail industry owner would like to know about.
Our business intelligence application which helps to answer following questions and assist
stakeholder to come up with optimum pricing.
6 | P a g e
SUCCESS CRITERIA
The success of our project implementation is measured by on meeting following objectives:
1. Flexibility in analysis and reporting.
2. Able to answer most of the vital questions on pricing strategy.
3. Help business implements most optimal pricing strategy.
GOALS
Our project goals are as follows.
1. To implement data warehouses, that provides a comprehensive analysis of pricing
strategy, that assist retail industry to diligently undertake markup and markdown.
2. To implement interactive and user friendly dashboard, that provides a complete overview
of markups and markdowns to take business decisions.
7 | P a g e
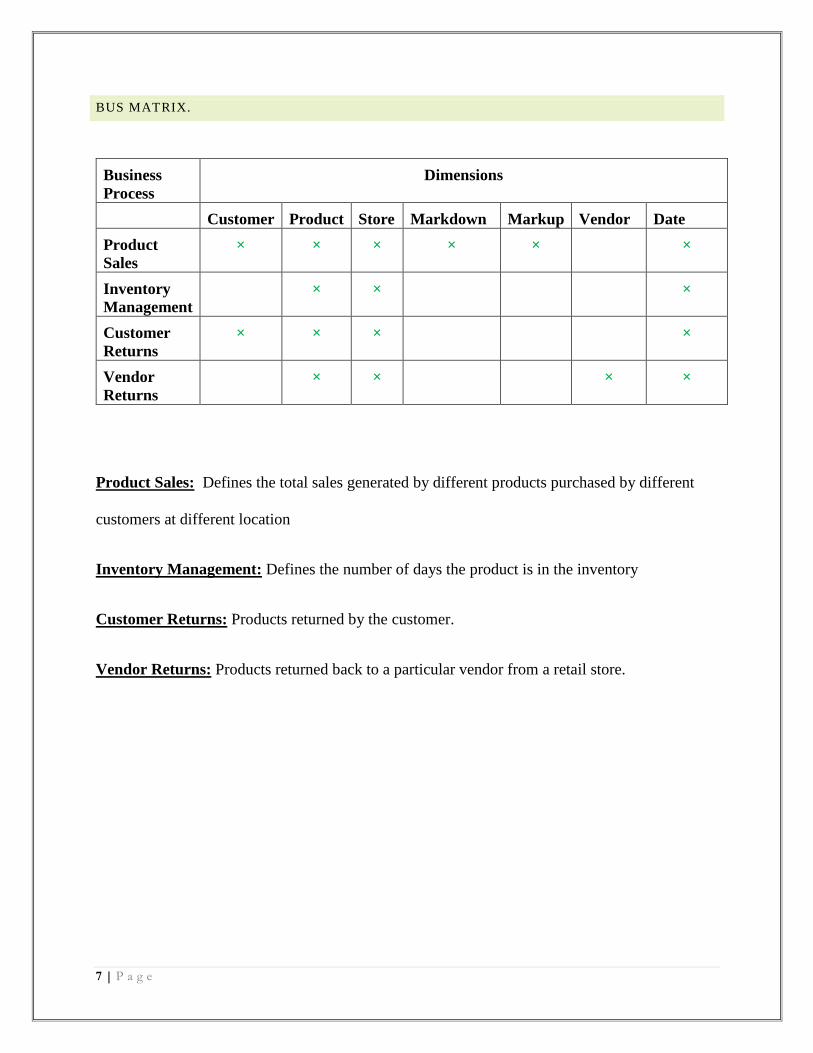
BUS MATRIX.
Business
Process
Dimensions
Customer Product Store Markdown Markup Vendor Date
Product
Sales
× × × × × ×
Inventory
Management
× × ×
Customer
Returns
× × × ×
Vendor
Returns
× × × ×
Product Sales: Defines the total sales generated by different products purchased by different
customers at different location
Inventory Management: Defines the number of days the product is in the inventory
Customer Returns: Products returned by the customer.
Vendor Returns: Products returned back to a particular vendor from a retail store.
8 | P a g e
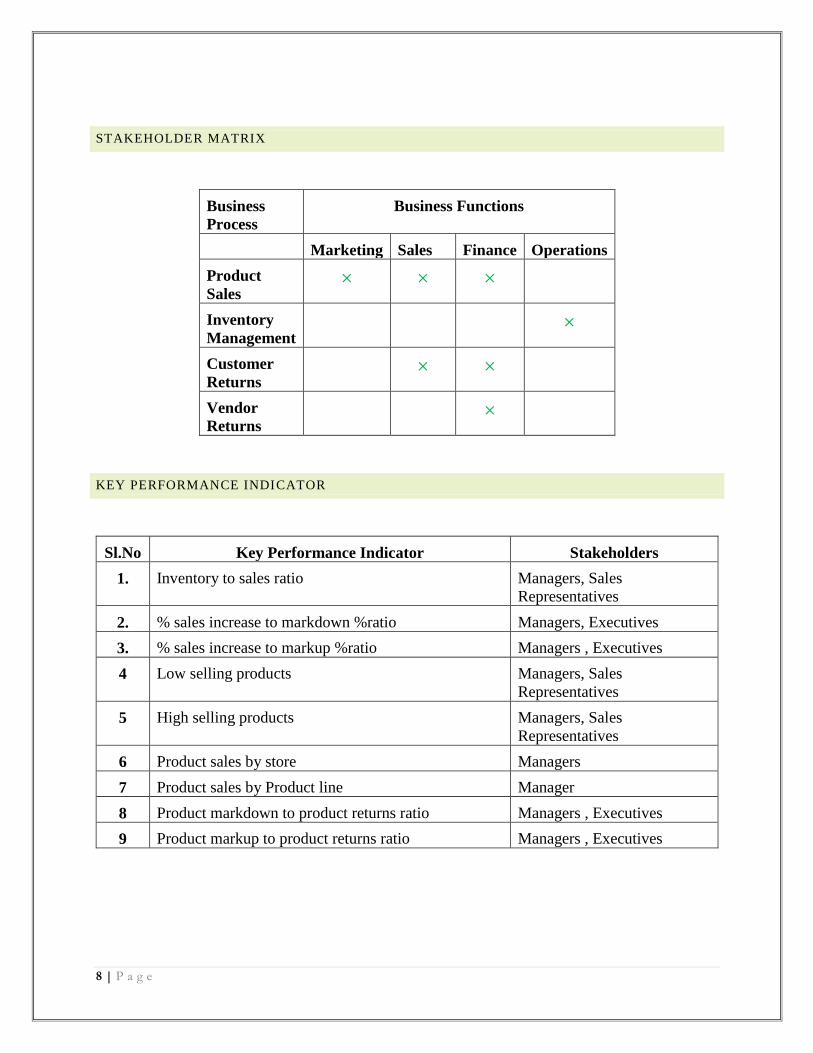
STAKEHOLDER MATRIX
Business
Process
Business Functions
Marketing Sales Finance Operations
Product
Sales × × ×
Inventory
Management ×
Customer
Returns × ×
Vendor
Returns ×
KEY PERFORMANCE INDICATOR
Sl.No Key Performance Indicator Stakeholders
1. Inventory to sales ratio Managers, Sales
Representatives
2. % sales increase to markdown %ratio Managers, Executives
3. % sales increase to markup %ratio Managers , Executives
4 Low selling products Managers, Sales
Representatives
5 High selling products Managers, Sales
Representatives
6 Product sales by store Managers
7 Product sales by Product line Manager
8 Product markdown to product returns ratio Managers , Executives
9 Product markup to product returns ratio Managers , Executives
9 | P a g e
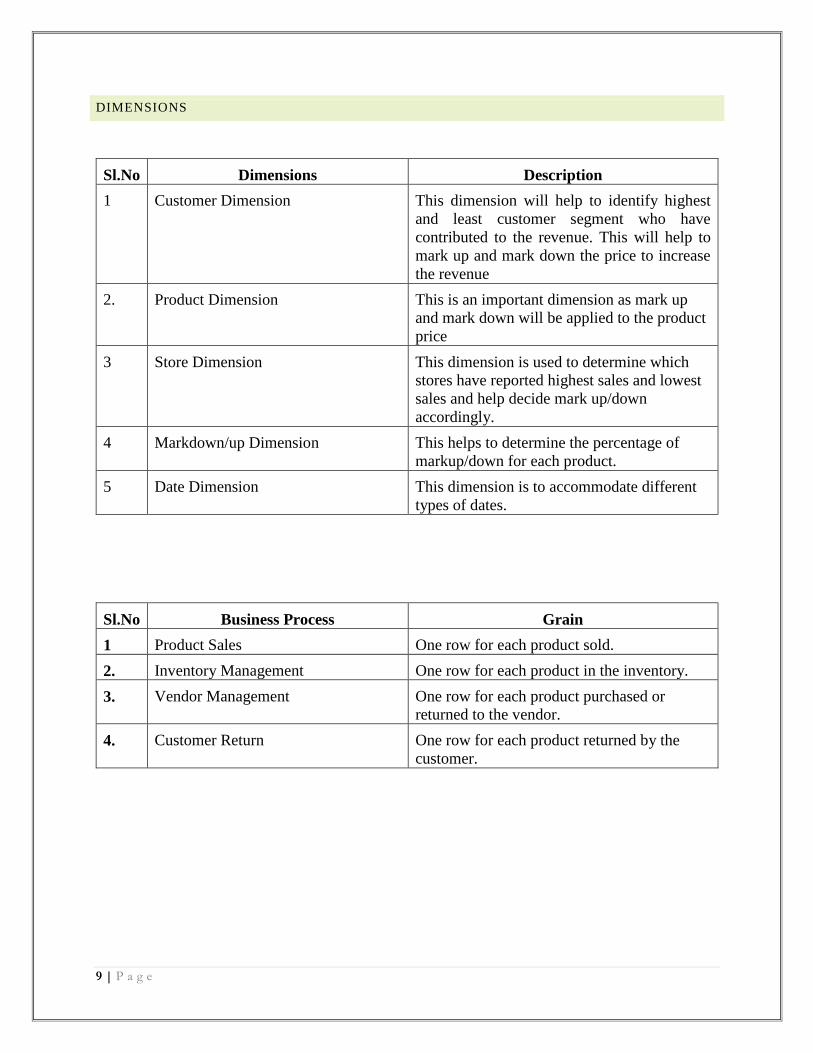
DIMENSIONS
Sl.No Dimensions Description
1 Customer Dimension This dimension will help to identify highest
and least customer segment who have
contributed to the revenue. This will help to
mark up and mark down the price to increase
the revenue
2. Product Dimension This is an important dimension as mark up
and mark down will be applied to the product
price
3 Store Dimension This dimension is used to determine which
stores have reported highest sales and lowest
sales and help decide mark up/down
accordingly.
4 Markdown/up Dimension This helps to determine the percentage of
markup/down for each product.
5 Date Dimension This dimension is to accommodate different
types of dates.
Sl.No Business Process Grain
1 Product Sales One row for each product sold.
2. Inventory Management One row for each product in the inventory.
3. Vendor Management One row for each product purchased or
returned to the vendor.
4. Customer Return One row for each product returned by the
customer.
10 | P a g e
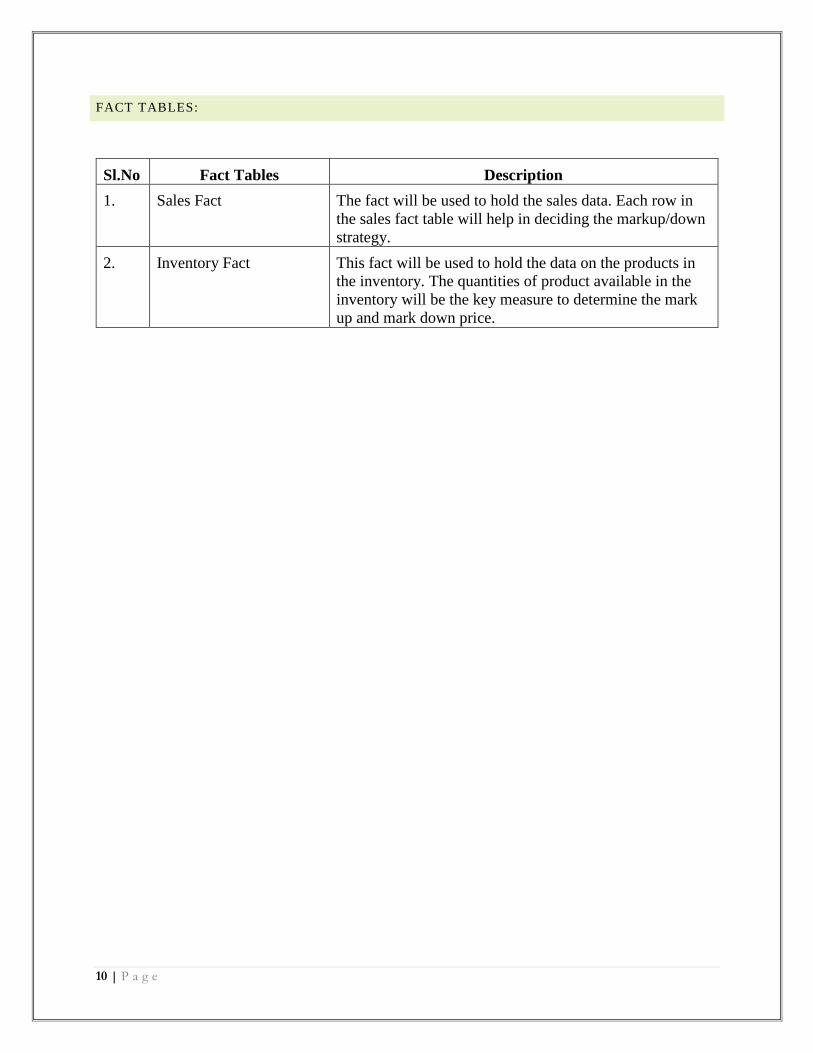
FACT TABLES:
Sl.No Fact Tables Description
1. Sales Fact The fact will be used to hold the sales data. Each row in
the sales fact table will help in deciding the markup/down
strategy.
2. Inventory Fact This fact will be used to hold the data on the products in
the inventory. The quantities of product available in the
inventory will be the key measure to determine the mark
up and mark down price.
11 | P a g e
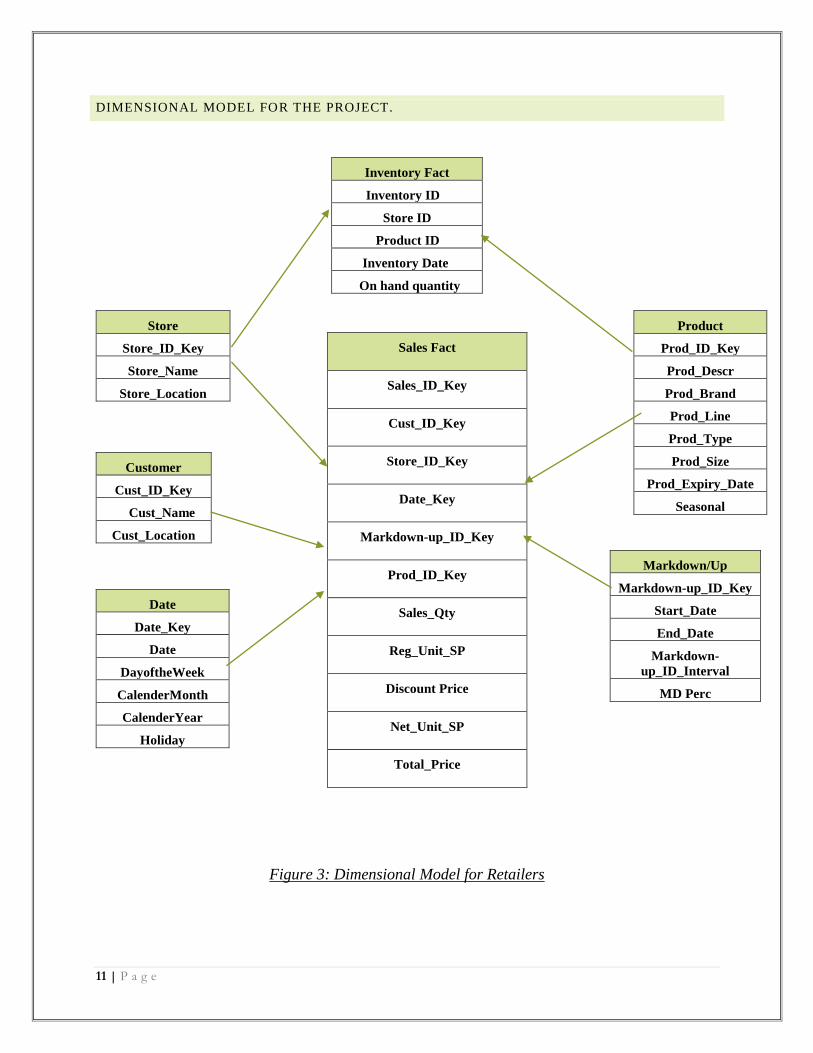
DIMENSIONAL MODEL FOR THE PROJECT.
Figure 3: Dimensional Model for Retailers
Inventory Fact
Inventory ID
Store ID
Product ID
Inventory Date
On hand quantity
Store
Store_ID_Key
Store_Name
Store_Location
Product
Prod_ID_Key
Prod_Descr
Prod_Brand
Prod_Line
Prod_Type
Prod_Size
Prod_Expiry_Date
Seasonal
Sales Fact
Sales_ID_Key
Cust_ID_Key
Store_ID_Key
Date_Key
Markdown-up_ID_Key
Prod_ID_Key
Sales_Qty
Reg_Unit_SP
Discount Price
Net_Unit_SP
Total_Price
Customer
Cust_ID_Key
Cust_Name
Cust_Location
Date
Date_Key
Date
DayoftheWeek
CalenderMonth
CalenderYear
Holiday
Markdown/Up
Markdown-up_ID_Key
Start_Date
End_Date
Markdown-
up_ID_Interval
MD Perc
12 | P a g e
ETL PROCESS
Every day large amount of data is generated. Data management has become concerned for
businesses as proper management of data helps in gaining market insights, product needs, customer
needs etc. It is a long term process that must be done methodically. In order to consolidate the
data from different source to one place data warehouse is used. Before this data is readily
consumed, it must be checked for validity, anonymity and structure. The different ways in which
data can be used for analysis are:
Generate multiple reports and consolidate to one single report.
Fetch data from different systems/application and load into a data warehouse and generate
reports as per the requirement.
To achieve this ETL tool play a significant role to extract data from different system,
cleanse and transform that and load that into the target system.
Now a days as all companies are going in the global environment and doing lots of
acquisition, there are lots of demand coming in the field of data migration and data integration. An
ETL tool plays a significant role in the data migration and data integration fields.
13 | P a g e
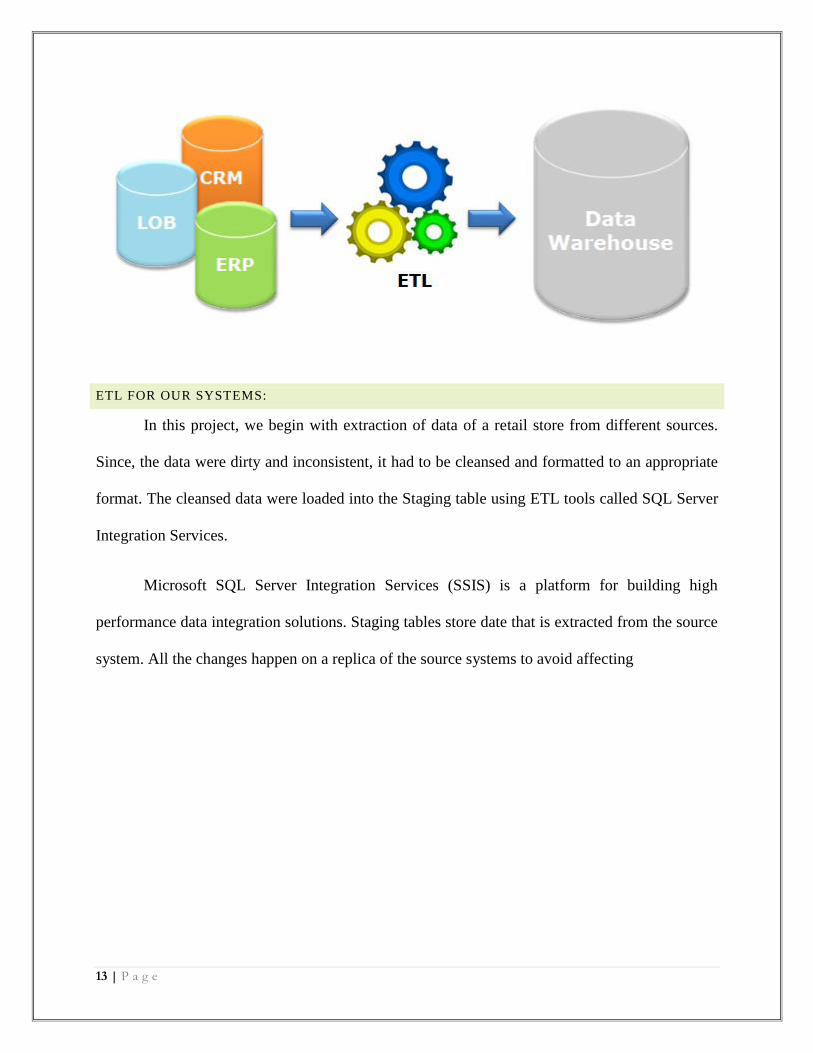
ETL FOR OUR SYSTEMS:
In this project, we begin with extraction of data of a retail store from different sources.
Since, the data were dirty and inconsistent, it had to be cleansed and formatted to an appropriate
format. The cleansed data were loaded into the Staging table using ETL tools called SQL Server
Integration Services.
Microsoft SQL Server Integration Services (SSIS) is a platform for building high
performance data integration solutions. Staging tables store date that is extracted from the source
system. All the changes happen on a replica of the source systems to avoid affecting
14 | P a g e
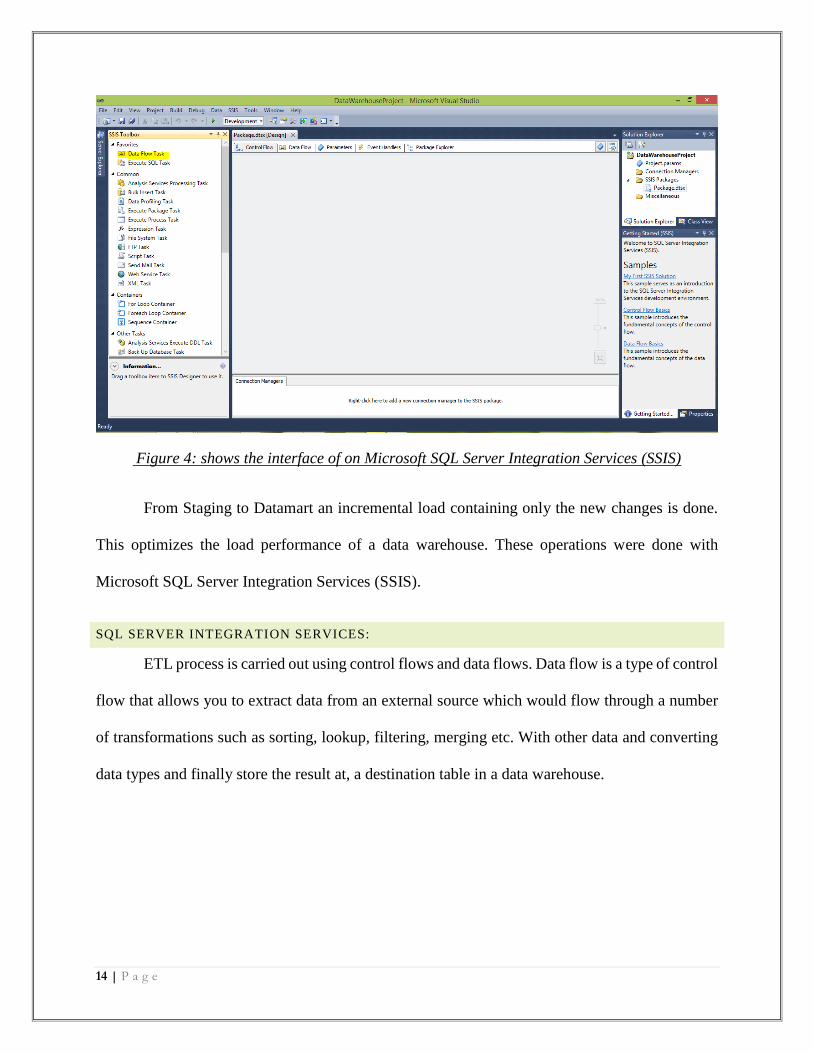
Figure 4: shows the interface of on Microsoft SQL Server Integration Services (SSIS)
From Staging to Datamart an incremental load containing only the new changes is done.
This optimizes the load performance of a data warehouse. These operations were done with
Microsoft SQL Server Integration Services (SSIS).
SQL SERVER INTEGRATION SERVICES:
ETL process is carried out using control flows and data flows. Data flow is a type of control
flow that allows you to extract data from an external source which would flow through a number
of transformations such as sorting, lookup, filtering, merging etc. With other data and converting
data types and finally store the result at, a destination table in a data warehouse.
15 | P a g e
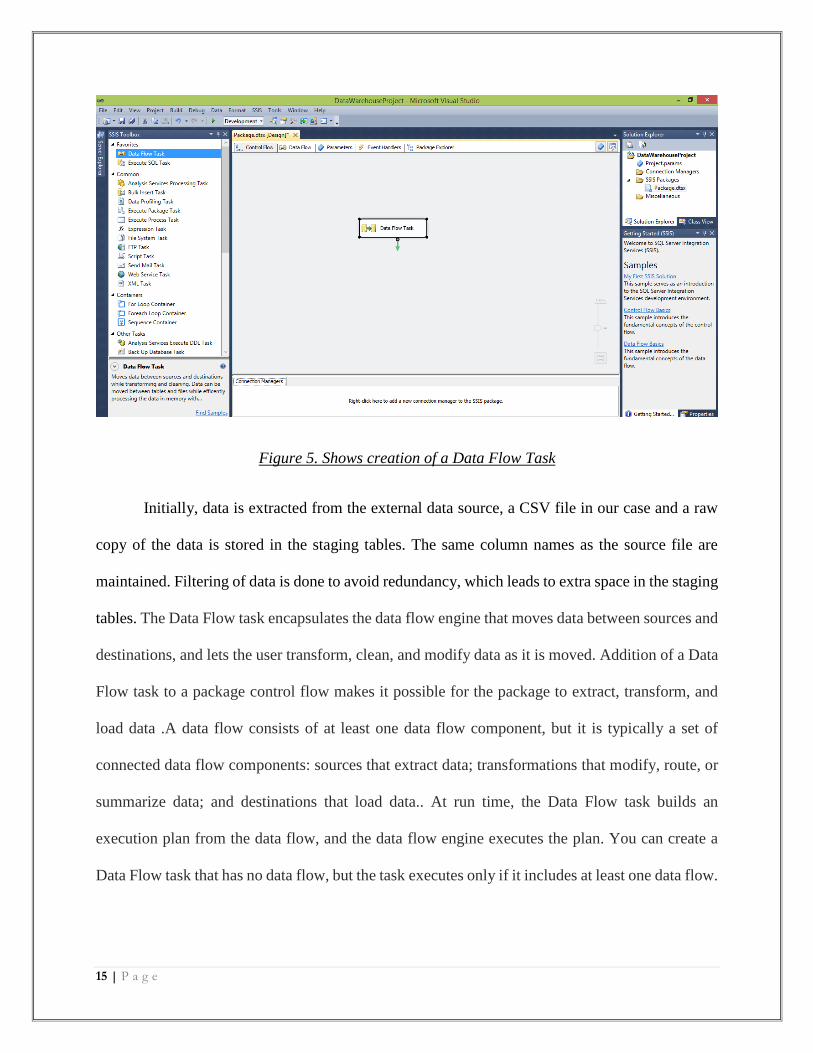
Figure 5. Shows creation of a Data Flow Task
Initially, data is extracted from the external data source, a CSV file in our case and a raw
copy of the data is stored in the staging tables. The same column names as the source file are
maintained. Filtering of data is done to avoid redundancy, which leads to extra space in the staging
tables. The Data Flow task encapsulates the data flow engine that moves data between sources and
destinations, and lets the user transform, clean, and modify data as it is moved. Addition of a Data
Flow task to a package control flow makes it possible for the package to extract, transform, and
load data .A data flow consists of at least one data flow component, but it is typically a set of
connected data flow components: sources that extract data; transformations that modify, route, or
summarize data; and destinations that load data.. At run time, the Data Flow task builds an
execution plan from the data flow, and the data flow engine executes the plan. You can create a
Data Flow task that has no data flow, but the task executes only if it includes at least one data flow.
16 | P a g e
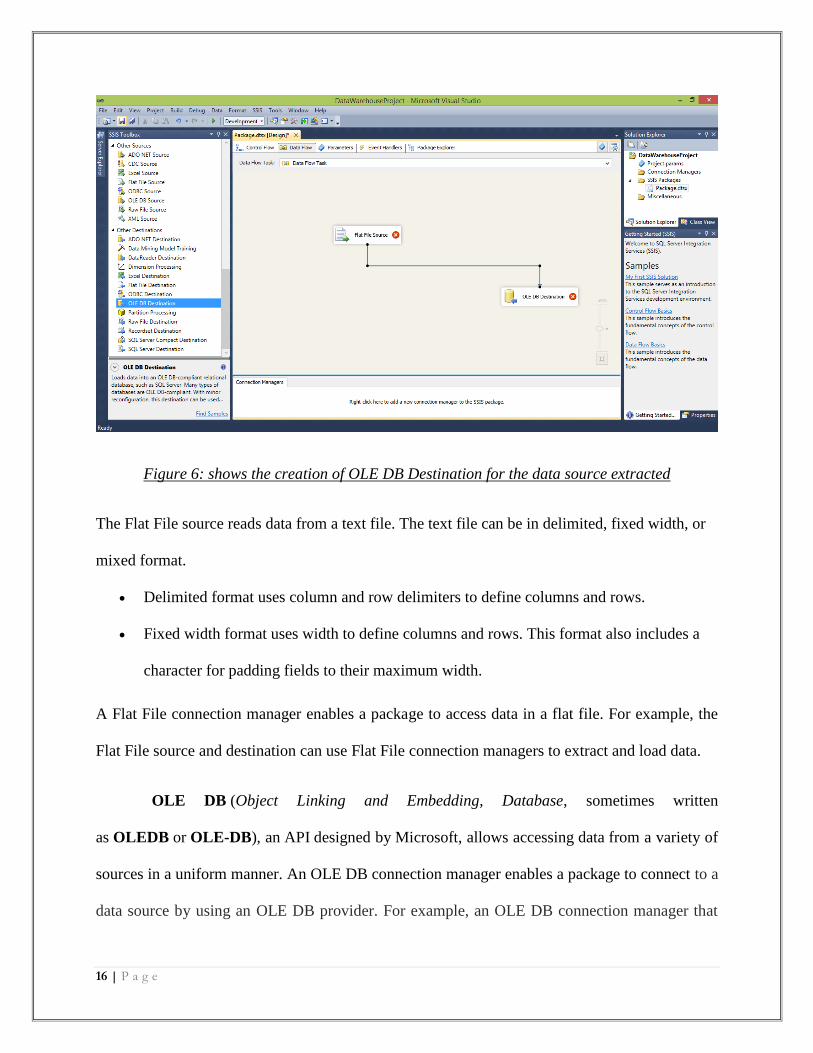
Figure 6: shows the creation of OLE DB Destination for the data source extracted
The Flat File source reads data from a text file. The text file can be in delimited, fixed width, or
mixed format.
Delimited format uses column and row delimiters to define columns and rows.
Fixed width format uses width to define columns and rows. This format also includes a
character for padding fields to their maximum width.
A Flat File connection manager enables a package to access data in a flat file. For example, the
Flat File source and destination can use Flat File connection managers to extract and load data.
OLE DB (Object Linking and Embedding, Database, sometimes written
as OLEDB or OLE-DB), an API designed by Microsoft, allows accessing data from a variety of
sources in a uniform manner. An OLE DB connection manager enables a package to connect to a
data source by using an OLE DB provider. For example, an OLE DB connection manager that
17 | P a g e
connects to SQL Server can use the Microsoft OLE DB Provider for SQL Server. Implemented
using the Component Object Model (COM); it is otherwise unrelated to OLE.
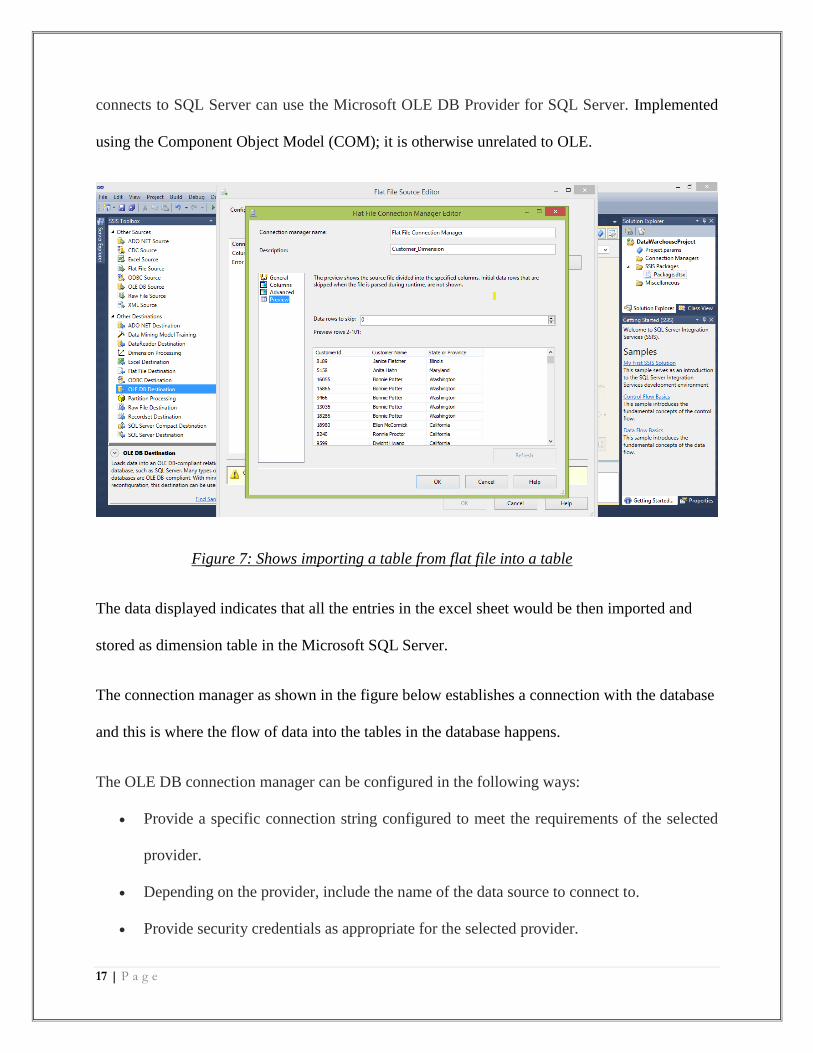
Figure 7: Shows importing a table from flat file into a table
The data displayed indicates that all the entries in the excel sheet would be then imported and
stored as dimension table in the Microsoft SQL Server.
The connection manager as shown in the figure below establishes a connection with the database
and this is where the flow of data into the tables in the database happens.
The OLE DB connection manager can be configured in the following ways:
Provide a specific connection string configured to meet the requirements of the selected
provider.
Depending on the provider, include the name of the data source to connect to.
Provide security credentials as appropriate for the selected provider.
18 | P a g e
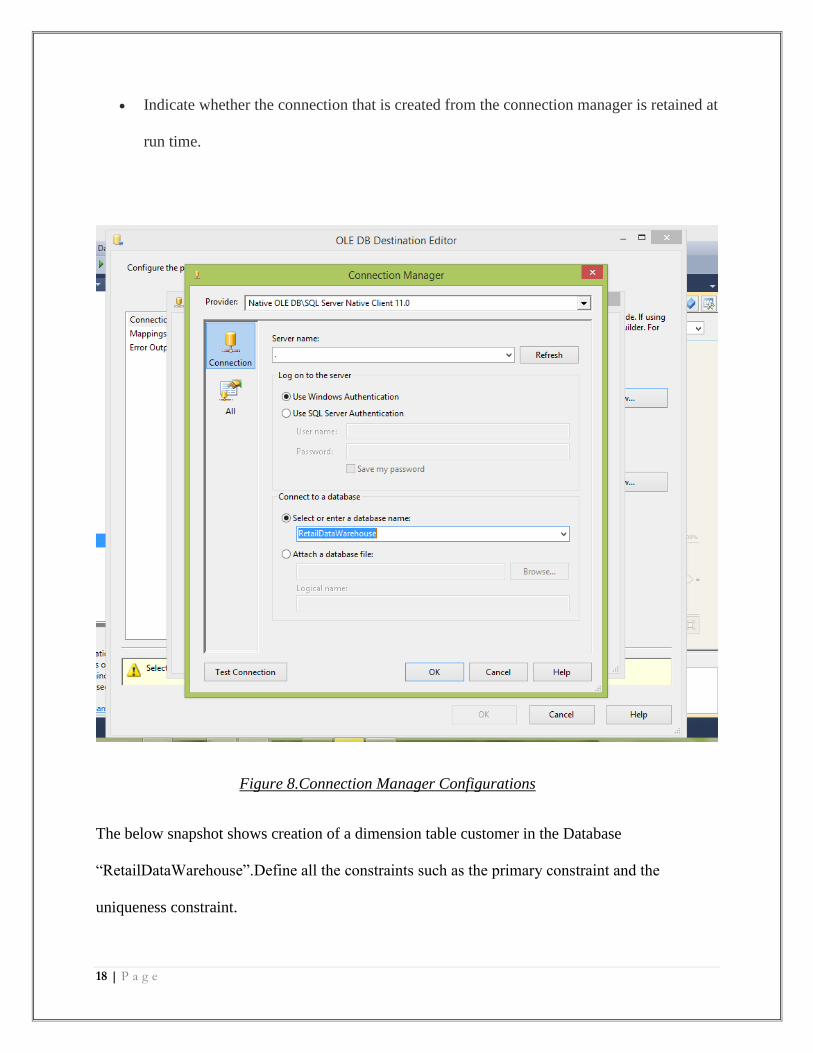
Indicate whether the connection that is created from the connection manager is retained at
run time.
Figure 8.Connection Manager Configurations
The below snapshot shows creation of a dimension table customer in the Database
“RetailDataWarehouse”.Define all the constraints such as the primary constraint and the
uniqueness constraint.
19 | P a g e
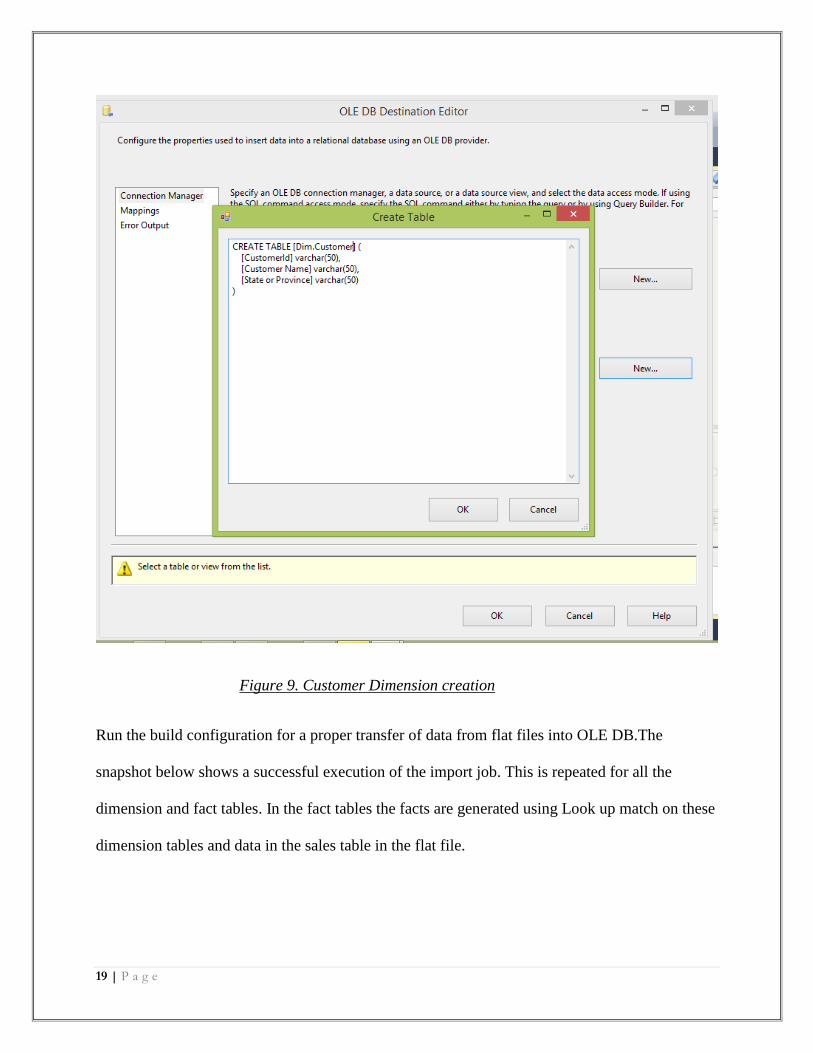
Figure 9. Customer Dimension creation
Run the build configuration for a proper transfer of data from flat files into OLE DB.The
snapshot below shows a successful execution of the import job. This is repeated for all the
dimension and fact tables. In the fact tables the facts are generated using Look up match on these
dimension tables and data in the sales table in the flat file.
20 | P a g e
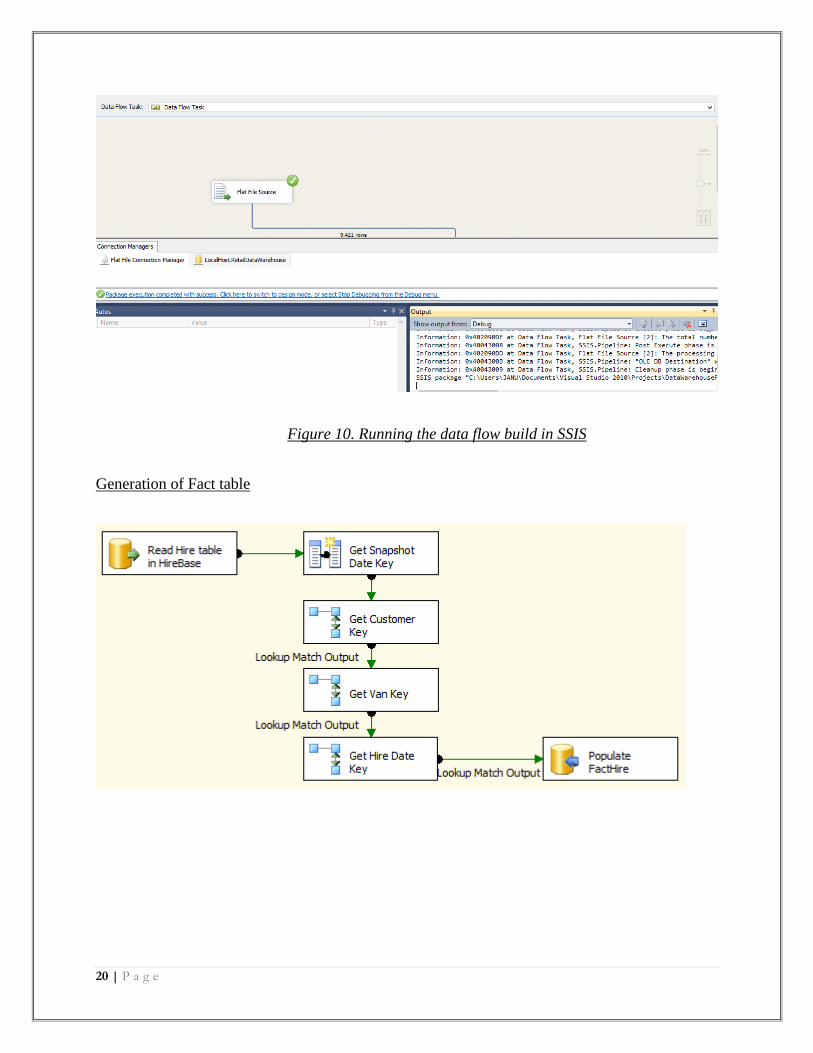
Figure 10. Running the data flow build in SSIS
Generation of Fact table
21 | P a g e
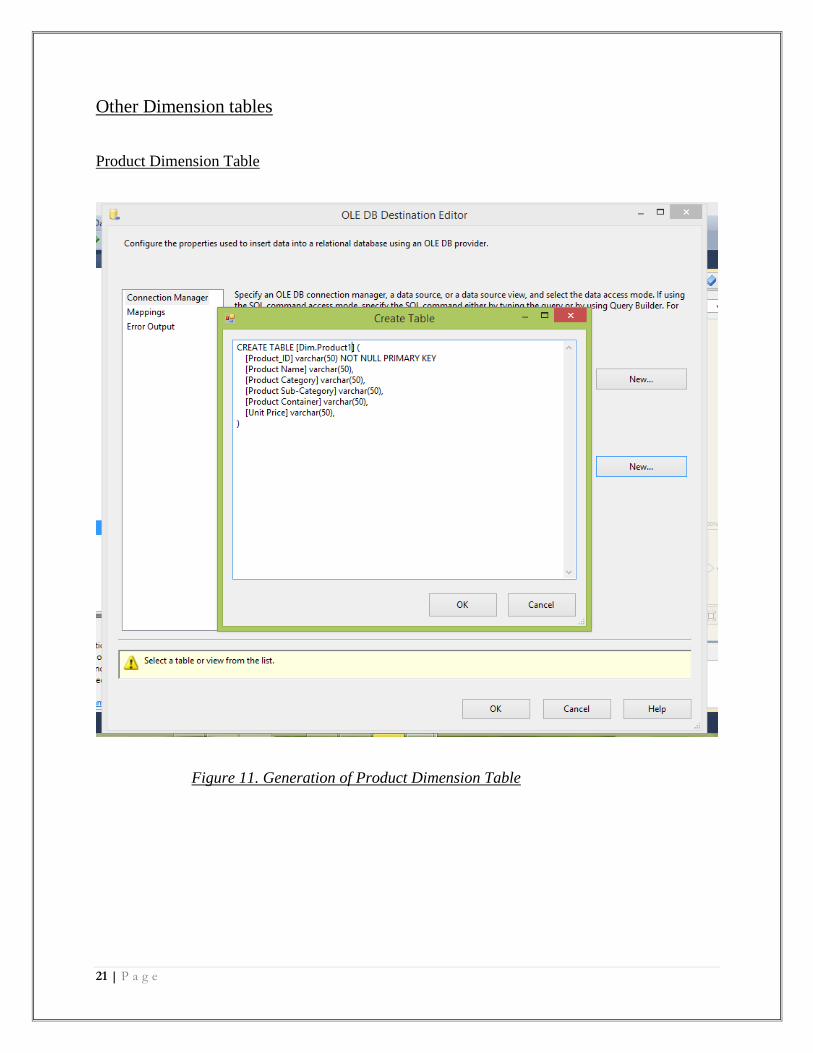
Other Dimension tables
Product Dimension Table
Figure 11. Generation of Product Dimension Table
22 | P a g e
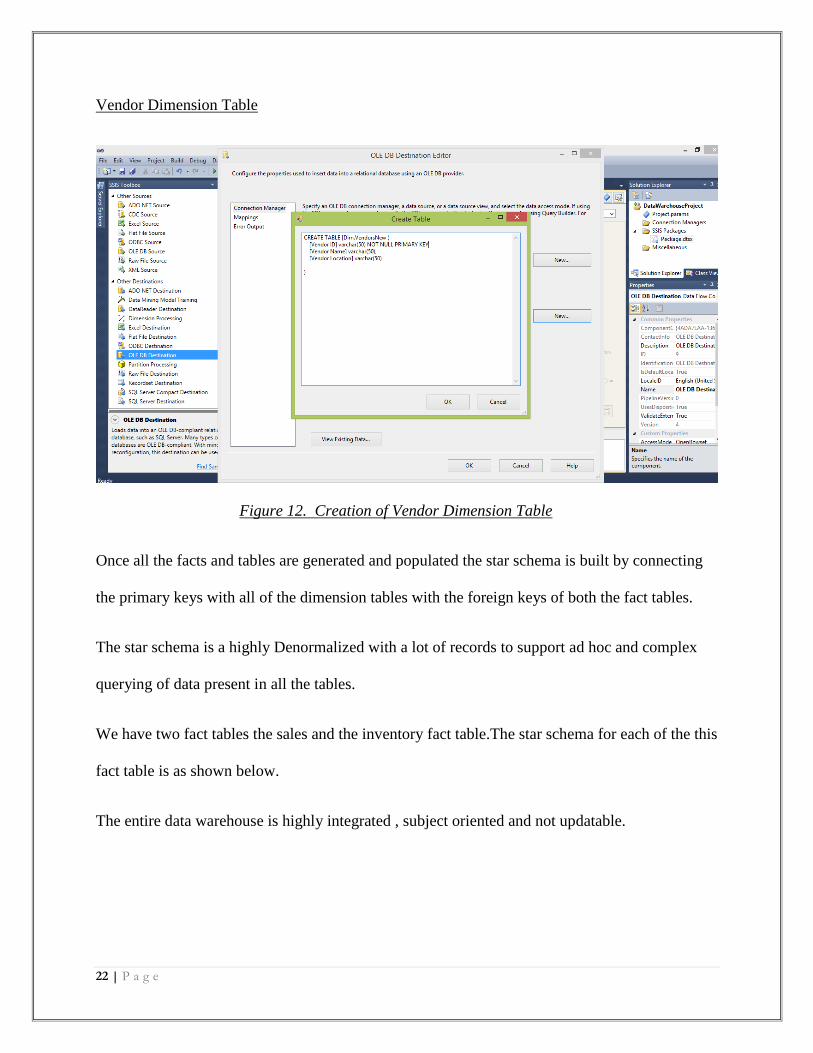
Vendor Dimension Table
Figure 12. Creation of Vendor Dimension Table
Once all the facts and tables are generated and populated the star schema is built by connecting
the primary keys with all of the dimension tables with the foreign keys of both the fact tables.
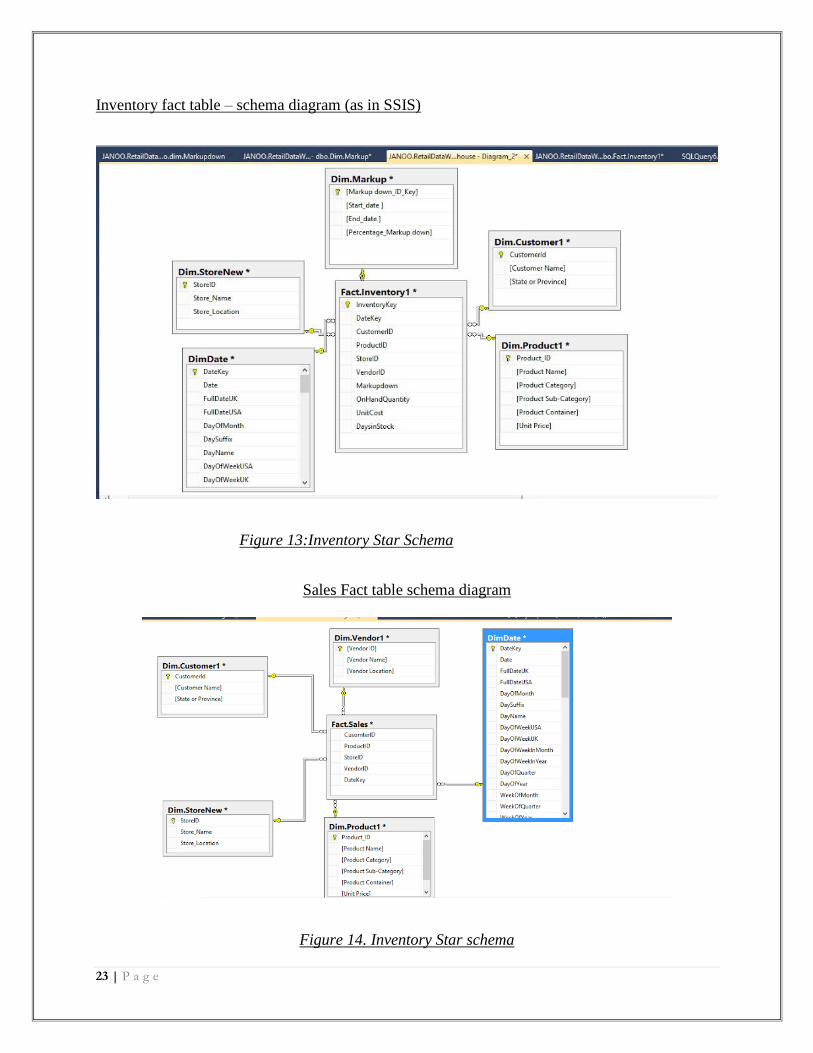
The star schema is a highly Denormalized with a lot of records to support ad hoc and complex
querying of data present in all the tables.
We have two fact tables the sales and the inventory fact table.The star schema for each of the this
fact table is as shown below.
The entire data warehouse is highly integrated , subject oriented and not updatable.
23 | P a g e
Inventory fact table – schema diagram (as in SSIS)
Figure 13:Inventory Star Schema
Sales Fact table schema diagram
Figure 14. Inventory Star schema
24 | P a g e
VISUALIZATION FOR BUSINESS INTELLIGENCE
Business Intelligence helps make informed decisions from historical data. Retail industry
works with big data. Hence, it is vital to be able to make sense out of this data. In this project, we
are using Tableau’s analytical depth and visualization capabilities to suggest pricing strategies
using markup and markdown of fast and slow moving goods.
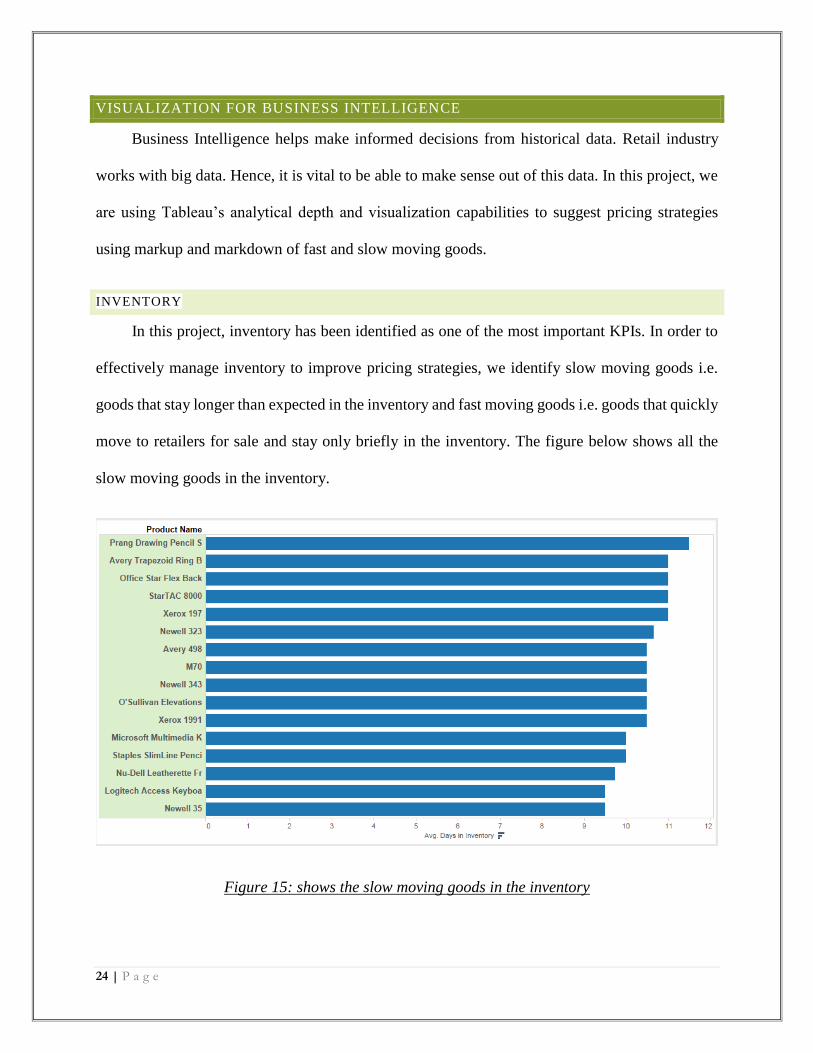
INVENTORY
In this project, inventory has been identified as one of the most important KPIs. In order to
effectively manage inventory to improve pricing strategies, we identify slow moving goods i.e.
goods that stay longer than expected in the inventory and fast moving goods i.e. goods that quickly
move to retailers for sale and stay only briefly in the inventory. The figure below shows all the
slow moving goods in the inventory.
Figure 15: shows the slow moving goods in the inventory
25 | P a g e
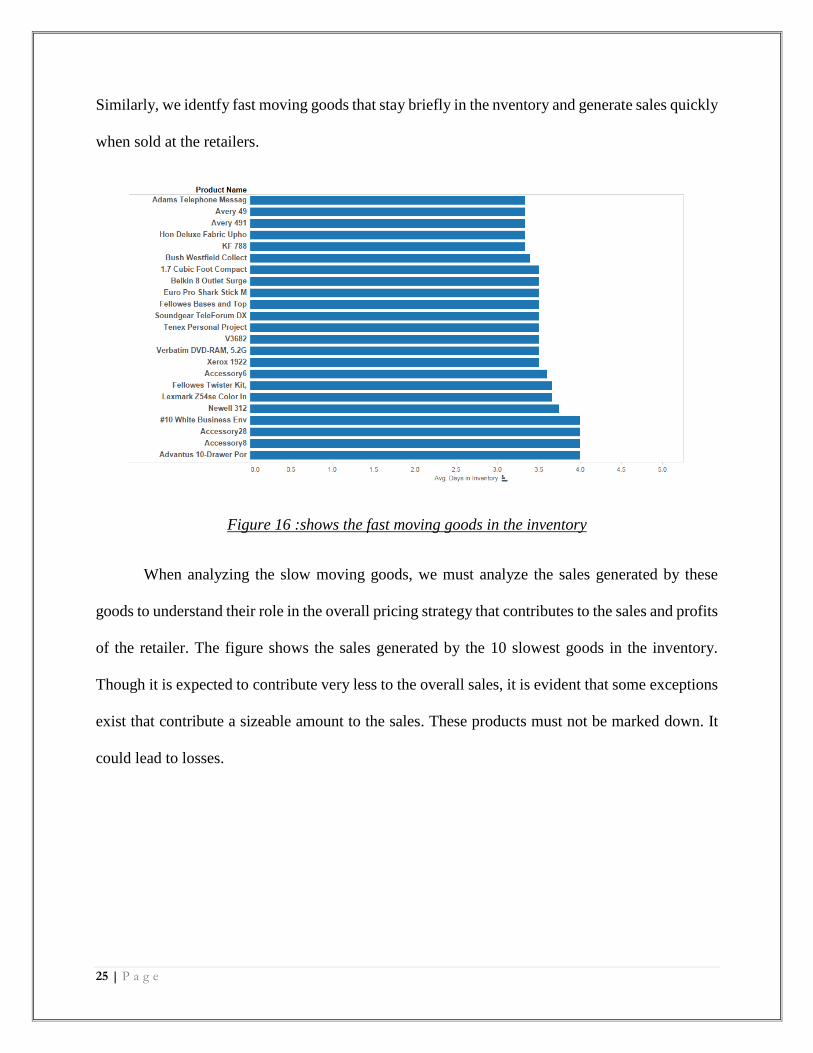
Similarly, we identfy fast moving goods that stay briefly in the nventory and generate sales quickly
when sold at the retailers.
Figure 16 :shows the fast moving goods in the inventory
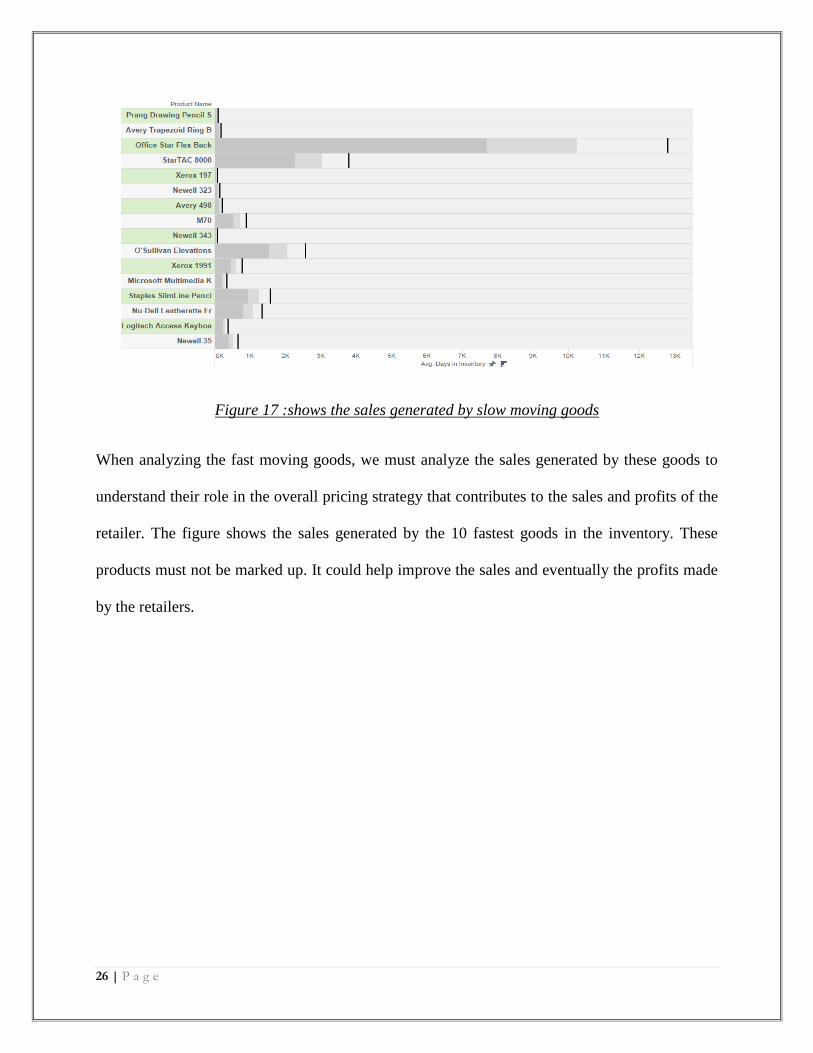
When analyzing the slow moving goods, we must analyze the sales generated by these
goods to understand their role in the overall pricing strategy that contributes to the sales and profits
of the retailer. The figure shows the sales generated by the 10 slowest goods in the inventory.
Though it is expected to contribute very less to the overall sales, it is evident that some exceptions
exist that contribute a sizeable amount to the sales. These products must not be marked down. It
could lead to losses.
26 | P a g e
Figure 17 :shows the sales generated by slow moving goods
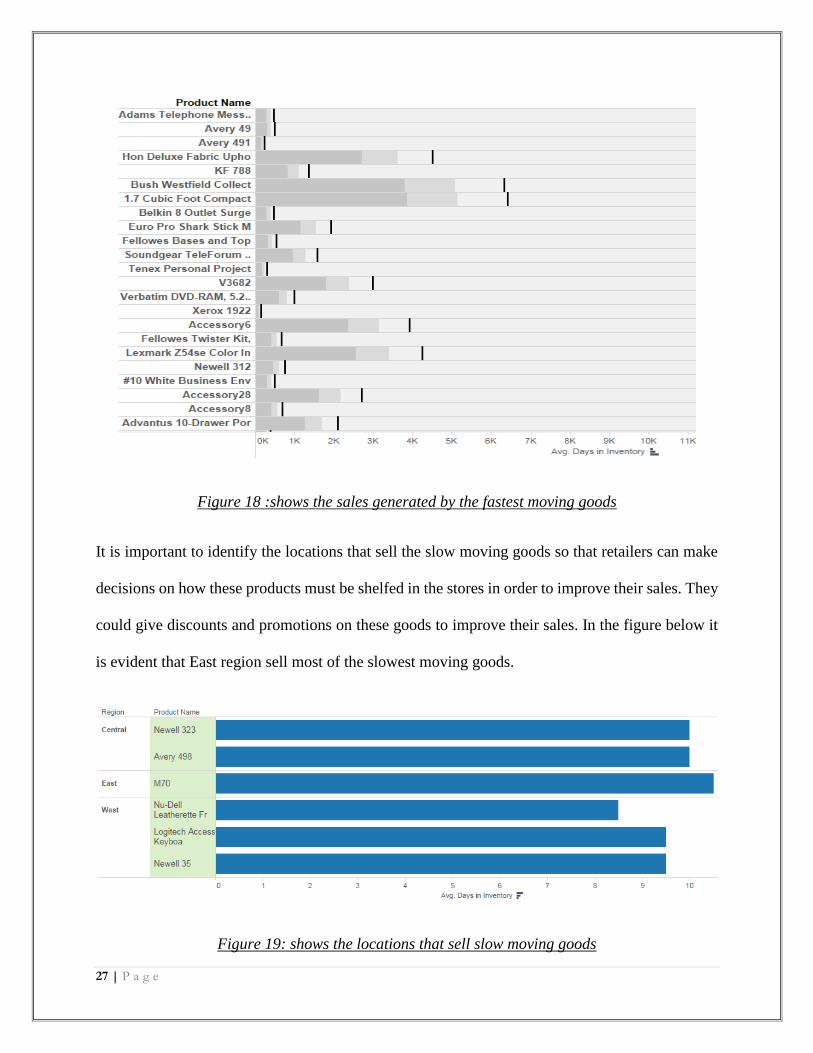
When analyzing the fast moving goods, we must analyze the sales generated by these goods to
understand their role in the overall pricing strategy that contributes to the sales and profits of the
retailer. The figure shows the sales generated by the 10 fastest goods in the inventory. These
products must not be marked up. It could help improve the sales and eventually the profits made
by the retailers.
27 | P a g e
Figure 18 :shows the sales generated by the fastest moving goods
It is important to identify the locations that sell the slow moving goods so that retailers can make
decisions on how these products must be shelfed in the stores in order to improve their sales. They
could give discounts and promotions on these goods to improve their sales. In the figure below it
is evident that East region sell most of the slowest moving goods.
Figure 19: shows the locations that sell slow moving goods
28 | P a g e
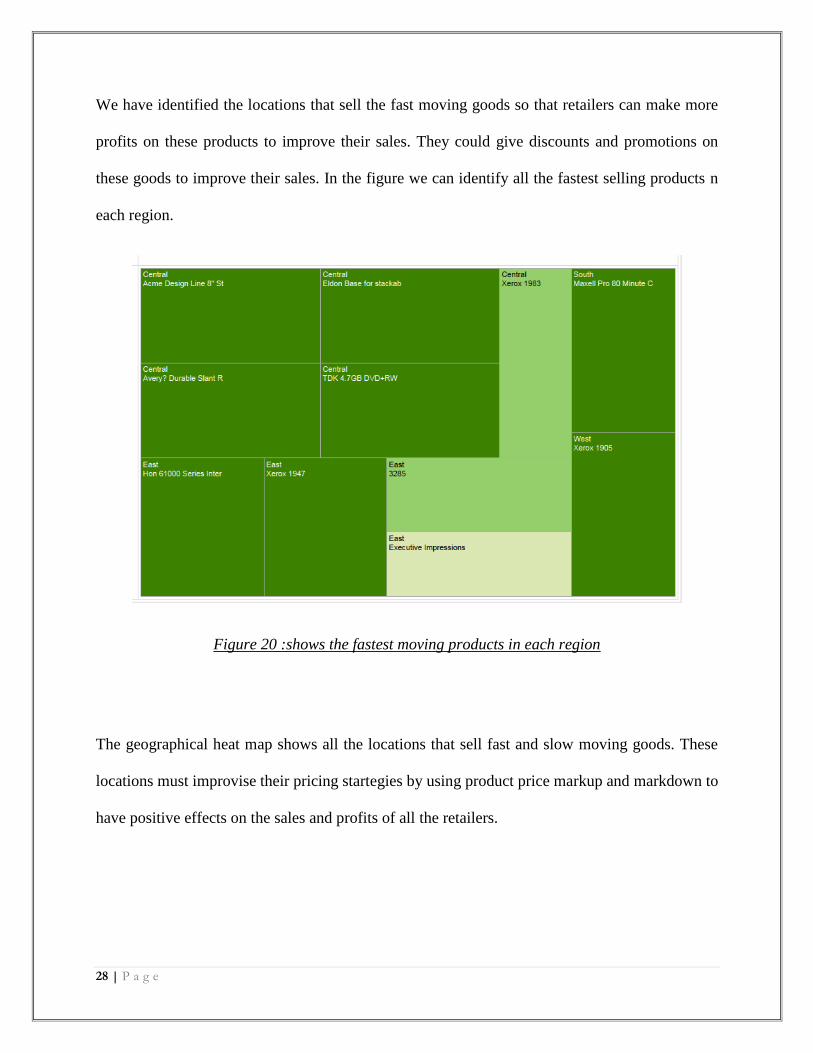
We have identified the locations that sell the fast moving goods so that retailers can make more
profits on these products to improve their sales. They could give discounts and promotions on
these goods to improve their sales. In the figure we can identify all the fastest selling products n
each region.
Figure 20 :shows the fastest moving products in each region
The geographical heat map shows all the locations that sell fast and slow moving goods. These
locations must improvise their pricing startegies by using product price markup and markdown to
have positive effects on the sales and profits of all the retailers.
29 | P a g e
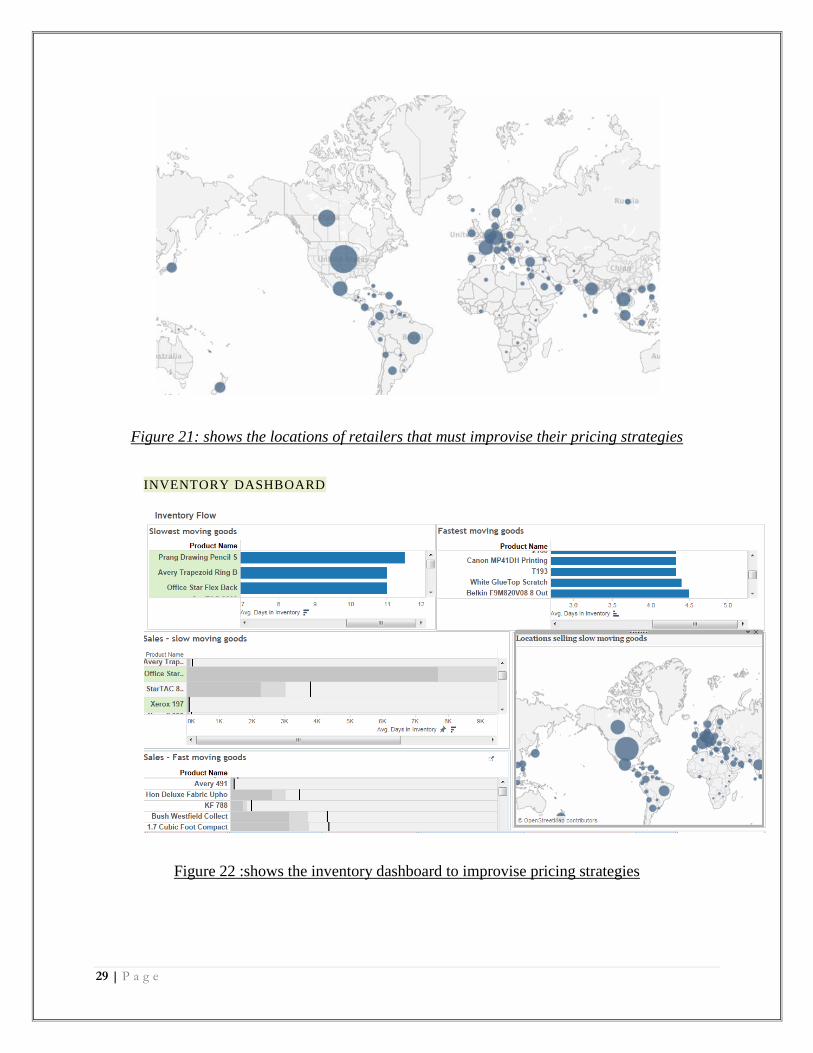
Figure 21: shows the locations of retailers that must improvise their pricing strategies
INVENTORY DASHBOARD
Figure 22 :shows the inventory dashboard to improvise pricing strategies
30 | P a g e
The figure above shows all the KPIs of inventory management that help identify slow moving
goods, fast moving goods, the sales generated by slow and fast moving goods and identifying any
exceptions, locations that sell these goods which need to improvise their sales strategies.
SALES
In this project, inventory has been identified as one of the most important KPIs. In order to
effectively manage inventory to improve pricing strategies, we identify slow moving goods i.e.
goods that stay longer than expected in the inventory and fast moving goods i.e. goods that quickly
move to retailers for sale and stay only briefly in the inventory. The figure below shows all the
slow moving goods in the inventory.
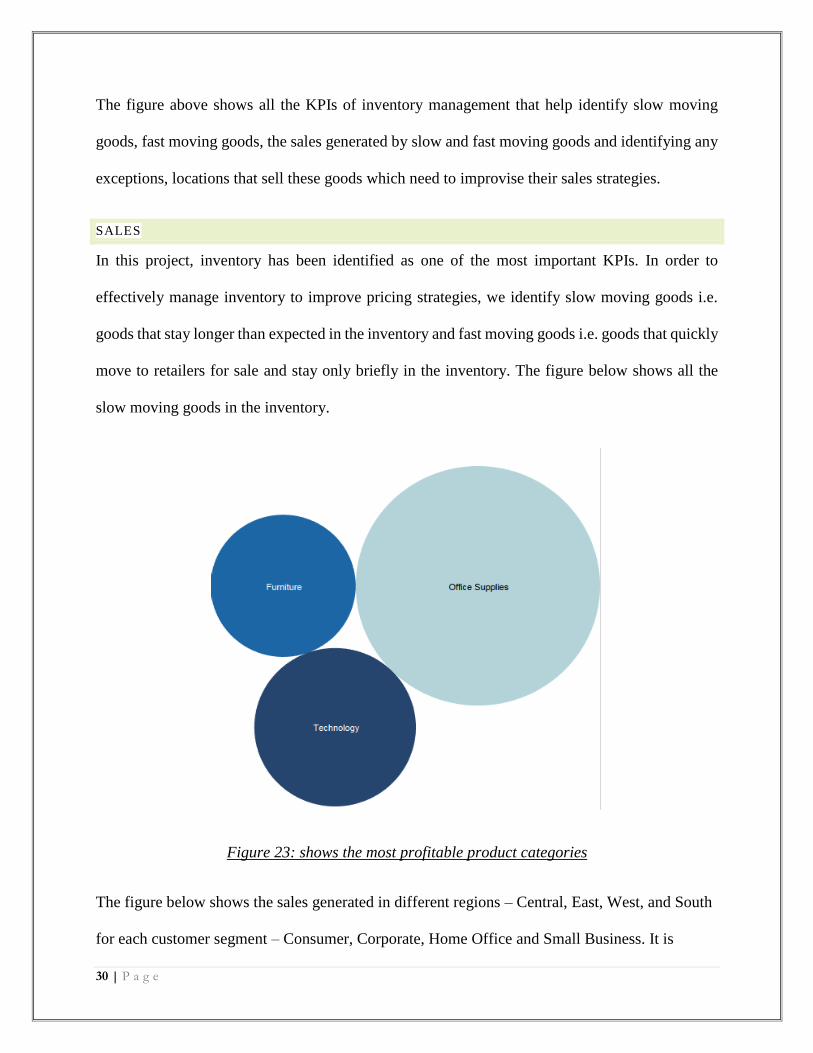
Figure 23: shows the most profitable product categories
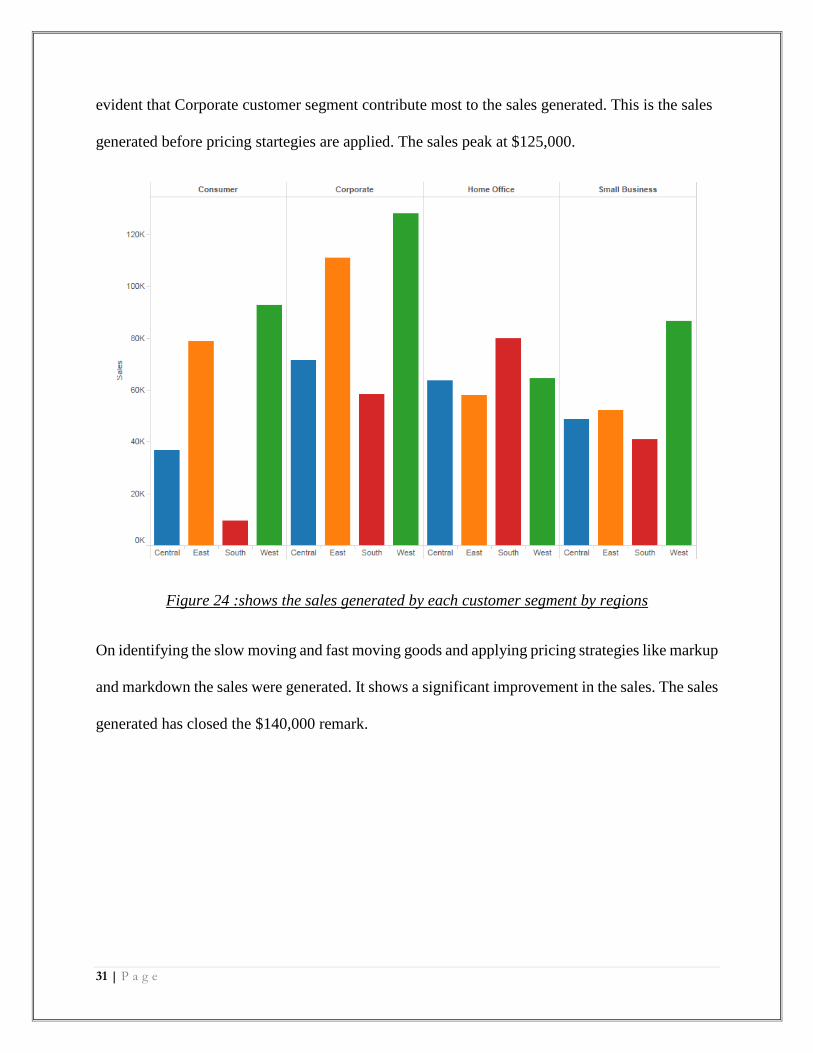
The figure below shows the sales generated in different regions – Central, East, West, and South
for each customer segment – Consumer, Corporate, Home Office and Small Business. It is
31 | P a g e
evident that Corporate customer segment contribute most to the sales generated. This is the sales
generated before pricing startegies are applied. The sales peak at $125,000.
Figure 24 :shows the sales generated by each customer segment by regions
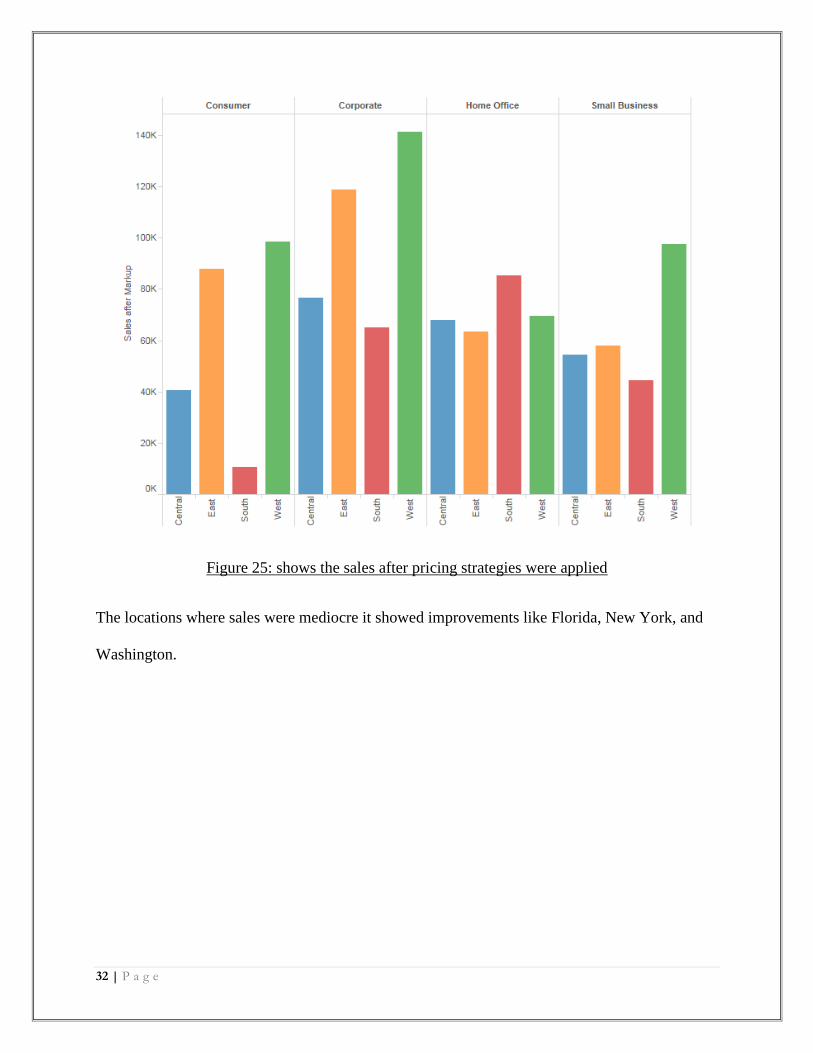
On identifying the slow moving and fast moving goods and applying pricing strategies like markup
and markdown the sales were generated. It shows a significant improvement in the sales. The sales
generated has closed the $140,000 remark.
32 | P a g e
Figure 25: shows the sales after pricing strategies were applied
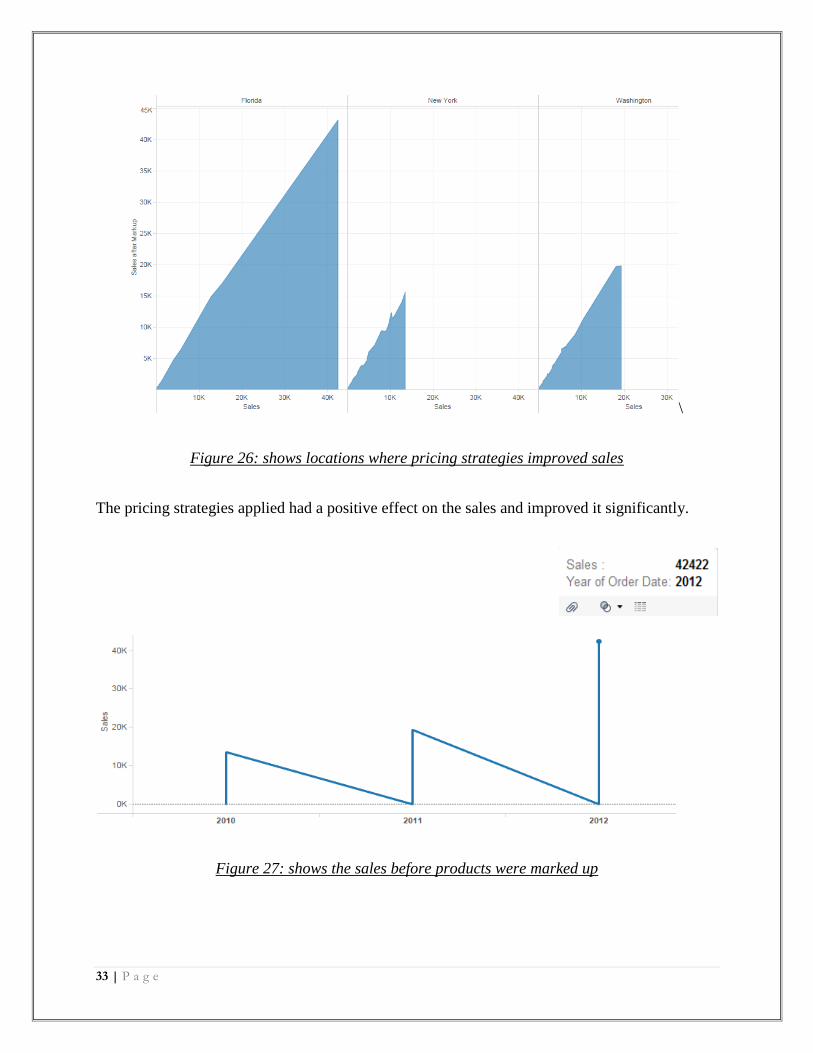
The locations where sales were mediocre it showed improvements like Florida, New York, and
Washington.
33 | P a g e
\
Figure 26: shows locations where pricing strategies improved sales
The pricing strategies applied had a positive effect on the sales and improved it significantly.
Figure 27: shows the sales before products were marked up
34 | P a g e
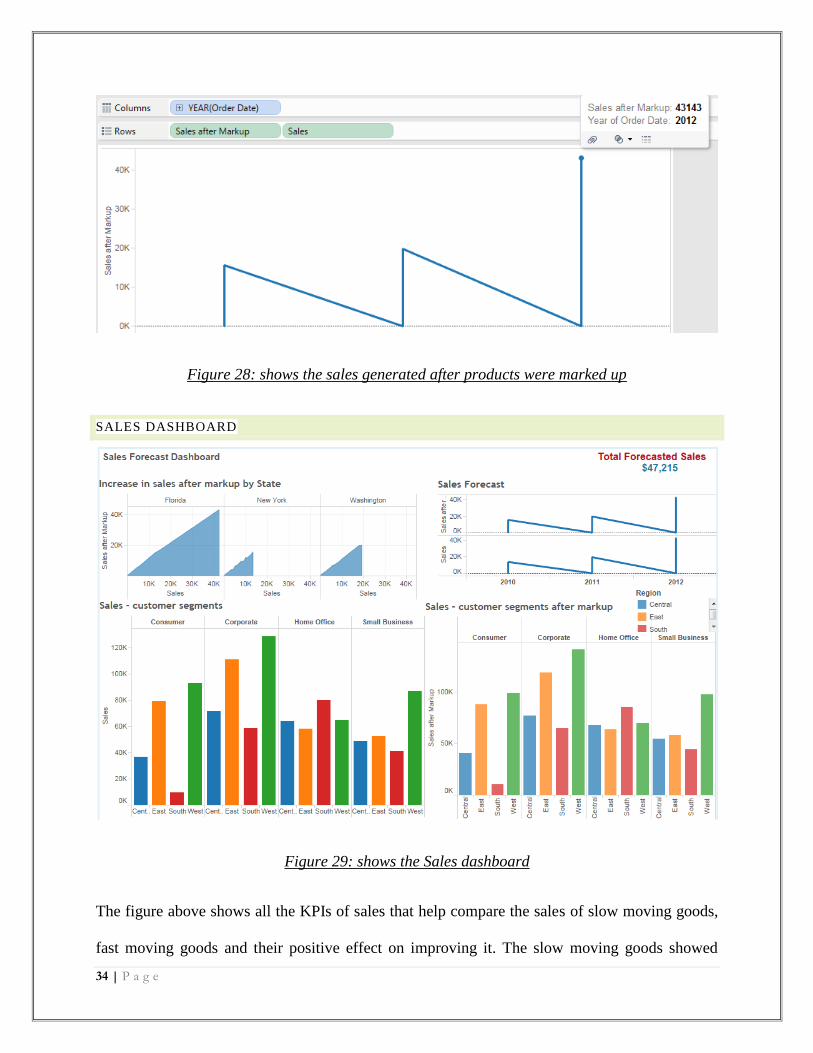
Figure 28: shows the sales generated after products were marked up
SALES DASHBOARD
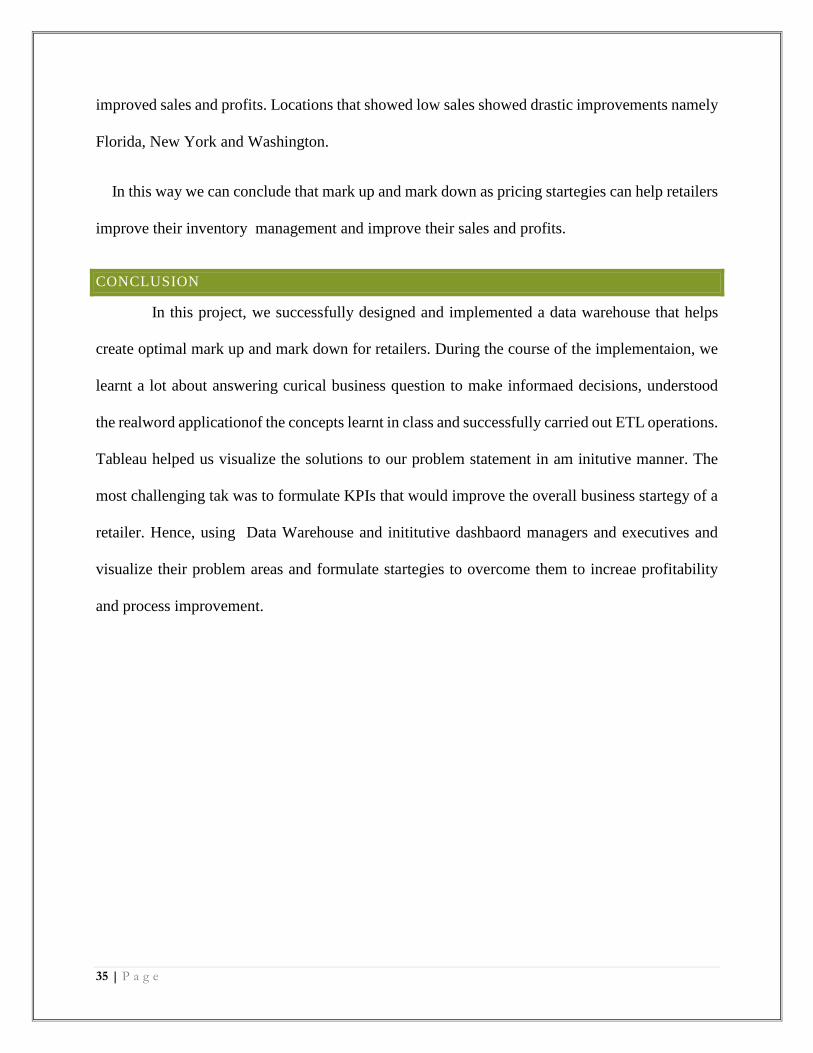
Figure 29: shows the Sales dashboard
The figure above shows all the KPIs of sales that help compare the sales of slow moving goods,
fast moving goods and their positive effect on improving it. The slow moving goods showed
35 | P a g e
improved sales and profits. Locations that showed low sales showed drastic improvements namely
Florida, New York and Washington.
In this way we can conclude that mark up and mark down as pricing startegies can help retailers
improve their inventory management and improve their sales and profits.
CONCLUSION
In this project, we successfully designed and implemented a data warehouse that helps
create optimal mark up and mark down for retailers. During the course of the implementaion, we
learnt a lot about answering curical business question to make informaed decisions, understood
the realword applicationof the concepts learnt in class and successfully carried out ETL operations.
Tableau helped us visualize the solutions to our problem statement in am initutive manner. The
most challenging tak was to formulate KPIs that would improve the overall business startegy of a
retailer. Hence, using Data Warehouse and inititutive dashbaord managers and executives and
visualize their problem areas and formulate startegies to overcome them to increae profitability
and process improvement.


![A Markdown Interpreter for TeX - TeXdoc Onlinetexdoc.net/texmf-dist/doc/generic/markdown/markdown.pdf10if not modules then modules = { } end 11modules['markdown'] = metadata 1.1 Feedback](https://static.fdocuments.us/doc/165x107/5f98527ba4d31247186114b5/a-markdown-interpreter-for-tex-texdoc-10if-not-modules-then-modules-end.jpg)