
Resumo alargado - Instituto Superior T©cnico
13
João Paulo Costa Kinematic and dynamic characterization of stationary flows in rectilinear micro-channels and micro-valves, recurring to micro-PIV technique and to numerical Simulation 1 Kinematic and dynamic characterization of stationary flows in rectilinear micro-channels and micro-valves, recurring to micro-PIV technique and to numerical Simulation João Paulo Costa Mechanical Engineering Department Instituto Superior Técnico, Technical University of Lisbon Abstract Microfluidics is a developing technology and micro-Particle Image Velocimetry has affirmed itself in the last decades as one of the most promising visualization techniques. However, the small dimensional characteristics of the geometries to which the flows are confined, introduce some inherent obstacles to measuring. For this reason, there is still a lack of understanding in what concerns the major governing physical mechanisms. The main objective of the present work is the kinematic and dynamic characterization of flows in micro-components typical of Lab-on-a-Chip, namely straight micro-channels, rectangular and triangular valves. The influence of varying the height (in rectangular micro-valves) and width (in triangular micro-valves) of the micro-valves expansions was quantified through numerical simulations using the CFD-code Fluent 6.12.6®. For different sections of the micro-components, several two- dimensional velocity profiles were obtained experimentally and numerically in horizontal planes at various heights, allowing for the calculation of flow rate, using the trapezoidal method. These were also grouped into three-dimensional velocity fields. The numerical results were preceded by a study of grid dependence and validated with experimental measurements obtained with the technique μPIV. The fluid used in the experimental studie was deionized water, the characteristical dimensions of the micro-channels vary from 100 μm to 1200 μm and the characteristic Reynolds number of these flows is aproximatelly 12. There was good agreement between experimental and numerical results in most cases. The influence of vertical and horizontal expansions in the channels was confirmed to be the expected one in terms of the velocity dependence on the characteristic dimension of the valves. The usefulness of the numerical simulation in predicting the flow behaviour was confirmed, and the observed discrepancies are due to limitations of both the experimental technique and the numerical simulations. Values of pressure drop in sequences of straight micro-channels and valves were measured after the design and assembly of a signal-conditioning circuit for the use of micro-pressure sensors. Higher values of pressure drop than those expected theoretically were found and it is concluded that wall irregularities can lead to significant changes in the parameters that characterize the dynamics of microfluidic flows. 1. Introduction The advantages related to the use of microfluidic devices in several areas of interest have caught the attention within the scientific community. Their reduced dimensions and enhanced efficiency when
Transcript of Resumo alargado - Instituto Superior T©cnico
João Paulo Costa
Kinematic and dynamic characterization of stationary flows in rectilinear micro-channels and micro-valves, recurring to micro-PIV technique and to numerical Simulation
1
Kinematic and dynamic characterization of stationar y flows in rectilinear micro-channels and micro-valves, recurring to micro-PIV technique and to numerical Simulation
João Paulo Costa
Mechanical Engineering Department
Instituto Superior Técnico, Technical University of Lisbon
Abstract Microfluidics is a developing technology and micro-Particle Image Velocimetry has affirmed itself in the
last decades as one of the most promising visualization techniques. However, the small dimensional
characteristics of the geometries to which the flows are confined, introduce some inherent obstacles to
measuring. For this reason, there is still a lack of understanding in what concerns the major governing
physical mechanisms.
The main objective of the present work is the kinematic and dynamic characterization of flows in
micro-components typical of Lab-on-a-Chip, namely straight micro-channels, rectangular and
triangular valves. The influence of varying the height (in rectangular micro-valves) and width (in
triangular micro-valves) of the micro-valves expansions was quantified through numerical simulations
using the CFD-code Fluent 6.12.6®. For different sections of the micro-components, several two-
dimensional velocity profiles were obtained experimentally and numerically in horizontal planes at
various heights, allowing for the calculation of flow rate, using the trapezoidal method. These were
also grouped into three-dimensional velocity fields. The numerical results were preceded by a study of
grid dependence and validated with experimental measurements obtained with the technique µPIV.
The fluid used in the experimental studie was deionized water, the characteristical dimensions of the
micro-channels vary from 100 µm to 1200 µm and the characteristic Reynolds number of these flows
is aproximatelly 12.
There was good agreement between experimental and numerical results in most cases.
The influence of vertical and horizontal expansions in the channels was confirmed to be the expected
one in terms of the velocity dependence on the characteristic dimension of the valves.
The usefulness of the numerical simulation in predicting the flow behaviour was confirmed, and the
observed discrepancies are due to limitations of both the experimental technique and the numerical
simulations.
Values of pressure drop in sequences of straight micro-channels and valves were measured after the
design and assembly of a signal-conditioning circuit for the use of micro-pressure sensors.
Higher values of pressure drop than those expected theoretically were found and it is concluded that
wall irregularities can lead to significant changes in the parameters that characterize the dynamics of
microfluidic flows.
1. Introduction The advantages related to the use of microfluidic devices in several areas of interest have caught the
attention within the scientific community. Their reduced dimensions and enhanced efficiency when

João Paulo Costa
Kinematic and dynamic characterization of stationary flows in rectilinear micro-channels and micro-valves, recurring to micro-PIV technique and to numerical Simulation
2
surface phenomena are involved give additional importance to these systems, in comparison with
corresponding larger-scale applications [1].
Although many studies focusing on this area have been reported, consensual conclusions regarding
the correspondence between macro and micro scale applications and their governing physical
mechanisms have not been reached. In fact, there are a considerable number of works where similar
experiments conducted in similar conditions led to different results and conclusions.
The quantification of the pressure drop value of flows inside small geometries or the determination of
the critical Reynolds number for which laminar/turbulent transition takes place is a good example. The
asymmetry of the existing experimental data is well reflected in [2-7], where some authors state that
the equations traditionally applied to macro-scale flows must be adapted in order to comprise relevant
phenomena such as surface roughness, while others say that the deviations found in results between
micro-scale experiments and macro-scale theory are only due to errors accounted in experimental
error analysis.
The work of [8] presented the first micro-PIV application with the study of a Hele-Shaw flow around a
cylinder. The results allowed the authors to conclude positively about the viability of micro-PIV in
micro-flow characterization. Many other authors presented studies referring to micro-PIV experiments
[9-17]. One the most promising applications of micro-fluidics are the devices Lab-on-a-Chip and Lab-
on-a-CD. These consist of numerous micro-geometries in which develops a fluid flow to be analysed.
In many of the work referred early, the main objective was to study flows inside components of these
micro-devices, in order to enhance its capabilities. Numerical methods have been also very helpful in
finding answers to the questions raised in experimental studies [18-31].
The present work intends to bring some insight on the less clear aspects of this subject. For that, fluid
flow measurements using both the µPIV technique and pressure micro-sensors are carried out and
compared against numerical predictions provided by a numerical study also carried out, recurring to
commercial CFD software (Fluent 6.2).
The use of the µPIV technique allows one to characterise the flow local velocity field at two-
dimensional planes. To quantify the pressure drop it was necessary to develop electronic circuits to
use an electronic pressure micro-sensor. The micro-channel geometries under study are often used in
Lab-on-a-Chip/Lab-on-a-CD platforms. The influence of variations in height and width of micro-valves
is investigated.
2. Experimental setup
2.1. Kinematic characterization
The µPIV equipment (see figure 2) consists of four distinct elements: a pulsed Nd:YAG laser New
Wave® Solo II-15 (emitting at 532=excλ nm); a Flowsense® 2M CCD camera providing an image field
of 1600×1186 pixels (pixel size=7.4 µm) at maximum repetition rate of 15 Hz and 8/10-bit intensity
resolution, fluorescent nile red flow-tracing particles with an average diameter of 1 µm; and an epi-
fluorescent prism (filter cube) used to filter out background noise allowing the red light emitted by the
João Paulo Costa
Kinematic and dynamic characterization of stationary flows in rectilinear micro-channels and micro-valves, recurring to micro-PIV technique and to numerical Simulation
3
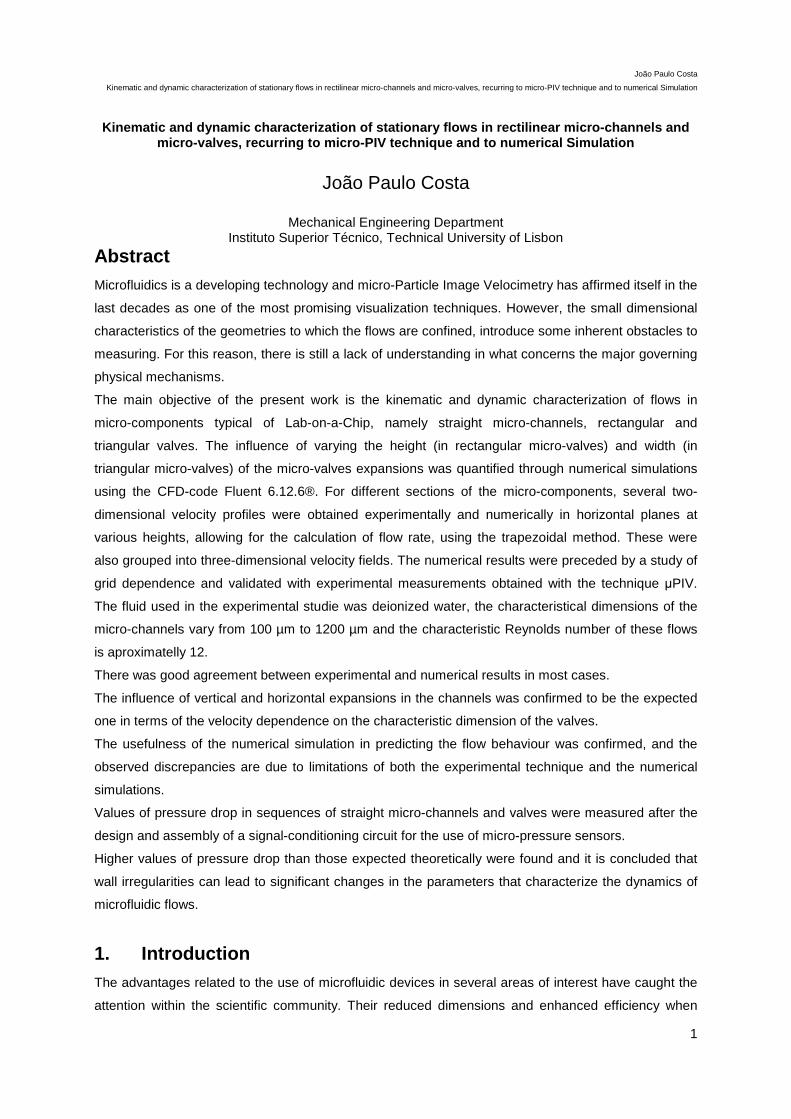
fluorescent tracing particles ( 575=emλ nm) to reach the camera. Software capable of performing
several correlation and validation is also used.
Figure 2 – Micro-PIV technique main components
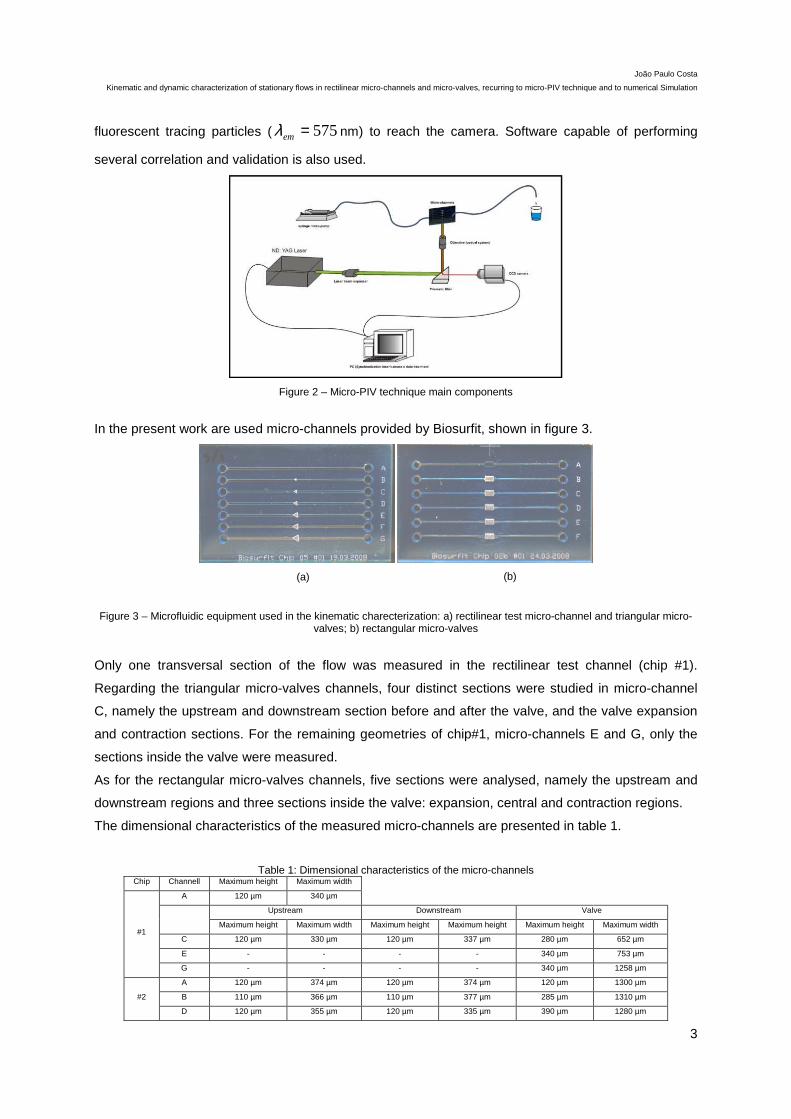
In the present work are used micro-channels provided by Biosurfit, shown in figure 3.
Figure 3 – Microfluidic equipment used in the kinematic charecterization: a) rectilinear test micro-channel and triangular micro-
valves; b) rectangular micro-valves
Only one transversal section of the flow was measured in the rectilinear test channel (chip #1).
Regarding the triangular micro-valves channels, four distinct sections were studied in micro-channel
C, namely the upstream and downstream section before and after the valve, and the valve expansion
and contraction sections. For the remaining geometries of chip#1, micro-channels E and G, only the
sections inside the valve were measured.
As for the rectangular micro-valves channels, five sections were analysed, namely the upstream and
downstream regions and three sections inside the valve: expansion, central and contraction regions.
The dimensional characteristics of the measured micro-channels are presented in table 1.
Table 1: Dimensional characteristics of the micro-channels Chip Channell Maximum height Maximum width
#1
A 120 µm 340 µm
Upstream Downstream Valve
Maximum height Maximum width Maximum height Maximum height Maximum height Maximum width
C 120 µm 330 µm 120 µm 337 µm 280 µm 652 µm
E - - - - 340 µm 753 µm
G - - - - 340 µm 1258 µm
#2
A 120 µm 374 µm 120 µm 374 µm 120 µm 1300 µm
B 110 µm 366 µm 110 µm 377 µm 285 µm 1310 µm
D 120 µm 355 µm 120 µm 335 µm 390 µm 1280 µm
(b) (a)

Kinematic and dynamic characterization of stationary flows in rectilinear micro
The fluid used in all experiments is deionised water and the required flow rate is pr
micro-pump.
2.2 Dynamic characterization
The differential pressure microsensor used in this work is the 24PCCFA6D, provi
The microsensor power supply was performed through an electronic circuit designed to
constant electrical current value of approxi
the entire electronic circuit board with a voltage of
Since the band signal emitted by the microsensor is between 0 and 285 mV, and because the reading
band of the acquisition board is between 0 and 10 V,
The use of an electronic circuit to amplify the output signal requires that one determines the operation
curve of the microsensor. In order to determine this o
performed, using a portable DRUCK®
in figure 5.
The acquisition board USB-6211 provided by National In
obtained from the micro-sensor to a computer.
was developed in the LabVIEW 8.5
the pressure drop of flows in micro
Figure
Kinematic and dynamic characterization of stationary flows in rectilinear micro-channels and micro-valves, recurring to micro-PIV technique and
The fluid used in all experiments is deionised water and the required flow rate is pr
characterization
pressure microsensor used in this work is the 24PCCFA6D, provided by Honeywell.
The microsensor power supply was performed through an electronic circuit designed to
stant electrical current value of approximately 2mA. An AC/DC transformer was used to provide
the entire electronic circuit board with a voltage of 17,5 V.
Since the band signal emitted by the microsensor is between 0 and 285 mV, and because the reading
nd of the acquisition board is between 0 and 10 V, a signal amplification circuit was
an electronic circuit to amplify the output signal requires that one determines the operation
curve of the microsensor. In order to determine this operation curve, a calibration process was
DRUCK® DPI 610 pressure calibrator. The calibration curve is presented
Figure 5 – Pressure sensor calibration curve
6211 provided by National Instruments® was used to transfer the data
sensor to a computer. A program for data visualization, treatment and storage
was developed in the LabVIEW 8.5 software. The experimental apparatus assembled for measuring
f flows in micro-channels with different configurations is illustrated in figure 6.
Figure 6 – pressure acquisition system scheme
João Paulo Costa
PIV technique and to numerical Simulation
4
The fluid used in all experiments is deionised water and the required flow rate is provided by a syringe
ded by Honeywell.
The microsensor power supply was performed through an electronic circuit designed to provide a
An AC/DC transformer was used to provide
Since the band signal emitted by the microsensor is between 0 and 285 mV, and because the reading
signal amplification circuit was developed.
an electronic circuit to amplify the output signal requires that one determines the operation
, a calibration process was
DPI 610 pressure calibrator. The calibration curve is presented
was used to transfer the data
for data visualization, treatment and storage
The experimental apparatus assembled for measuring
illustrated in figure 6.

João Paulo Costa
Kinematic and dynamic characterization of stationary flows in rectilinear micro-channels and micro-valves, recurring to micro-PIV technique and to numerical Simulation
5
As for the kinematic characterization, the micro-channels used for this study were provided by
Biosurfit. These channels and their dimensions are shown in figure 7 and table 2.
Figure 7 – Microfluidic equipment used in the dinamic study: (a) micro-channeles pictures and pressure output points detail; (b)
top view scheme; (c) and (d) side view scheme
Table 2: Dimensional characteristics of the micro-channels
Channel Valve
Width Height Width Height Length
Rectilinear channel 200 µm 100 µm - - - Valve channel 200 µm 100 µm 1000 µm 250 µm 1500 µm
3. Characterization techniques
3.1. Kinematic characterization experimental techni que
PIV is a non-intrusive optical technique used to measure kinematic parameters of fluid flows. It
determines the flow velocity by measuring the displacement of a group of seeding particles between
two recorded images separated by a known period of time. Each image is then divided into a
determined number of cells (interrogation areas), in which is present a certain number of seeding
particles [32].
The displacement of the particles contained in each interrogation area is averaged through a cross-
correlation process between the two images. Knowing the time period occurred, velocity vectors are
then calculated by dividing both quantities.
Micro-PIV is a technique similar to PIV, but with a few alterations in order to achieve higher resolutions
when measuring flows at micro-scale.
Although there are more differences pointed between both techniques, the main aspect that
differentiates micro-PIV and PIV is the illumination of the flow field.
Instead of using a laser light sheet, micro-PIV uses volume illumination. A consequence of this method
is the arising of background noise from out-of-focus particles.

João Paulo Costa
Kinematic and dynamic characterization of stationary flows in rectilinear micro-channels and micro-valves, recurring to micro-PIV technique and to numerical Simulation
6
3.1.1 Error sources
Considering the intricate particularities of the experimental technique used in this work, several error
sources should be accounted in this analysis. However, and as described in detail in [33] and [34],
some error sources are negligible. Therefore, only the most important ones will be discussed.
A major error source arises when the study concerns three-dimensional velocity fields. Since the
micro-PIV technique is limited to two-dimensional flows, an erroneous influence of a third velocity
component will be accounted [32].
The uncertainty associated with the exact determination of the channels’ geometries also affects the
results. This influence of this error is then translated to the numerical simulation, and many of the
differences depicted in the results will be attributed to this.
Although some suggestions have been raised to determine the width of the micro-channels [34], these
can only be applied to flows where the velocity profiles have an expectable parabolic shape. The
location of the micro-channels walls was then determined by visual inspection. Theoretically, the error
associated to this method is calculated in accordance with eq. 1,
Mmd pixel
14,7 ×= µ (1)
where pixeld represents the pixel dimension and M the microscope’s magnification.
However, as the signal-to-noise ratio decreases and the image defocusing increases near the walls,
the visual detection of the position of the walls is almost impossible. Hence, the associated deviation is
much larger than the one demonstrated.
The error associated with the exact determination of the correlation plane width has to do with the
influence of out of plane particles expressed in eq. 2.
( ) 2
1
2
2
22
222 1
1)1(49,1
2
1
−
−
++=ε
ελNA
n
NAM
Mdz pcorr
(2)
In equation 2, ����� is the correlation plane thickness, � represents the refraction indice, � the
objective amplification, � the numerical aperture of the objective, � the diameter of the particles, �
is the wavelenght and the contribution from another particle. The correlation plane width is then
given by 2����� .For the objectives used in the present work, mzcorr µ4,18±= and
mzcorr µ83,6±= for the N PLAN 10X and HI PLAN 20X respectively.
An additional analysis is carried out to estimate the accuracy of the micro-PIV results. The procedure
adopted consists in computing and adding, for several fixed streamwise flow locations, the volumetric
flow rate of two-dimensional velocity profiles obtained through micro-PIV measurements. Multiplying
this value by the vertical distance between horizontal measuring planes we have the volumetric flow
rate of the three-dimensional profile. The results are compared against the volumetric flow imposed in
the syringe pump. This difference provides an indication of the order of magnitude of the micro-PIV
technique bias error.

João Paulo Costa
Kinematic and dynamic characterization of stationary flows in rectilinear micro-channels and micro-valves, recurring to micro-PIV technique and to numerical Simulation
7
3.2. Kinematic characterization numerical technique
To create a numerical domain representative of the geometry of the micro-channels measured
experimentally, the software Gambit® was used. As boundary conditions it is set a plug flow velocity
profile with a specified mass flow rate value at the inlet; and an outflow boundary condition at the
outlet of the micro-channel.
The mass and momentum equations were solved using a commercial CFD (Computational Fluid
Dynamics) software, Fluent® (Fluent 6.2, 2005). The mass and momentum equations are solved for a
steady laminar incompressible flow case. The segregated algorithm used to solve these set of
equations uses an iterative approach so that a solution is only considered to be valid after
convergence is reached.
The discretization of the convective term in the momentum balance equation was performed using the
QUICK scheme. The discretization of the diffusive term of Navier-Stokes equation was done through a
Second-Order Central Scheme.
For the pressure-velocity coupling, the PISO algorithm was used.
All numerical simulations were preceded by a grid independence study. All meshes used were
structured and constructed with hexaedrical elements. In figure 8 is shown a picture of two different
grids used in the present work. The number of grid elements for each micro-channel is depicted in
table 3.
Table 3 – Grid refinement
Number of elements
Less refined Medium refined More refined
Chip#1
Channel A 47.232 212.544 956.448
Channel B 222.912 5015.52 1.128.492
Channel D 247.552 556.992 1.253.232
Chip#2
Channel A 129.600 291.600 656.100
Channel C 3.520 15.840 71.280
Channel E 16.288 73.296 329.832
Channel G 9.168 41.256 185.652
3.2.1 Error analysis
The error estimation for this case was calculated through the same method used in the kinematic
experimental characterization. The volumetric flow rate was calculated by the volumetric integral
enclosing two-dimensional velocity profiles obtained in the numerical simulation. The results are
compared against the volumetric flow defined in the syringe pump. This gives us an order of
magnitude of the error committed when performing the integration.
3.2. Dynamic characterization experimental techniqu e
The pressure drop/friction factor of flows confined to different geometrical configurations was
investigated. For this purpose, a differential micro-sensor was used to measure the pressure
difference between two points of the channel length.

João Paulo Costa
Kinematic and dynamic characterization of stationary flows in rectilinear micro-channels and micro-valves, recurring to micro-PIV technique and to numerical Simulation
8
The flow inside a rectilinear channel and through a rectangular micro- valve was measured and the
solutions were compared with either theoretical solutions or numerical ones.
For the straight rectilinear channel, the solution is given by eq. 3 [35], where b and a are the
dimensions of the micro-channel, � is the dynamic viscosity, L the lenght of the channel and Q is the
volumetric flow:
−=∆ ∑
∞
= ...5,3,1553
)2/tanh(1921
4
3
i i
abi
b
a
ba
LQP
ππ
µ (3)
Facing difficulties in determining the theoretical solution for the flow inside a micro-valve, the results of
experimental pressure measuring in this geometry were compared with the ones provided by
numerical simulation, as well as with the rectilinear channel ones.
3.2.1 Error sources
Based on statistical methods [36] to determine the order of magnitude of the error associated with
both the experimental technique and the theoretical solutions adopted, the uncertainty of the results
was investigated. Considering the error associated with the sensors and the portable calibrator, a
value of 9% was established for the error of the friction factor experimental determination
Considering the influence of the uncertainty in the geometrical characteristics of the channels, a value
of 19% was found for the possible deviation of the friction factor when associated to the theoretical
solution for flows in a rectilinear channel.
3. Results and discussion
3.1. Kinematic characterization
In the present section, the data obtained through µPIV and its comparison with CFD results is
presented. These data include three-dimensional reconstruction of velocity profiles from two-
dimensional ones and the mass flow balances computation using the data provided by the two-
dimensional velocity profiles. The mass flow rate imbalance value provides an order of magnitude of
the error generated in the micro-PIV experiments. The analysis was conducted for different relevant
cross sections of the several micro-geometries studied. An example of the analysis carried out through
the present work is shown in figs. 8 and 9.
Figure 8 – Two-dimensional velocity profiles obtained in Chip#2 in the horizontal plane z=70 µm: a) channel A - expansion; b)
channel A - contraction
(a) (b)

João Paulo Costa
Kinematic and dynamic characterization of stationary flows in rectilinear micro-channels and micro-valves, recurring to micro-PIV technique and to numerical Simulation
9
Figure 9 – Three-dimensional velocity profile obtained in Chip#2 – channel A – expansion section: a) Experimental profile; b) CFD profile
Table 4 – Flow mass and momentum balances for micro-PIV and CFD results
Chip Micro-channel Section Imposed QV
[m3/s]
QV [m3/s] Qqm [m4/s2] ∆Qqm [%] ∆Qqm [%]
CFD Error [%] Micro-PIV Error
[%] CFD Micro-PIV CFD Micro-PIV
#1
C
Upstream 2,50E-09 2,36E-09 -5,8 2,27E-09 -9,1 - - - -
Valve expansion
2,50E-09 2,44E-09 -2,6 2,98E-09 19 4,49E-11 7,62E-11 0,00% 0,00%
Valve contraction 2,50E-09 2,40E-09 -4,1 2,34E-09 -6,4 6,11E-11 5,56E-11 36,28% -27,11%
Downstream 2,50E-09 2,35E-09 -5,9 2,27E-09 -9,3 - - - -
E
Upstream
- - - -
Valve expansion 2,50E-09 2,49E-09 -0,36 2,27E-09 -9,2 3,05E-11 2,62E-11 0,00% 0,00%
Valve contraction 2,50E-09 2,50E-09 -0,19 2,25E-09 -9,9 4,52E-11 3,68E-11 48,20% 40,08%
Downstream - - - - - - - - -
G
Upstream - - - - - - - - -
Valve expansion 2,50E-09 2,50E-09 -0,01 2,45E-09 -1,9 2,63E-11 2,47E-11 0,00% 0,00%
Valve contraction
2,50E-09 2,49E-09 -0,32 2,38E-09 -4,8 3,38E-11 2,13E-11 28,72% -13,86%
Downstream - - - - - - - - -
#2
A
Upstream 2,65E-09 2,61E-09 1,4 2,51E-09 -5,1 - - - -
Expansion 2,50E-09 2,48E-09 -0,8 2,36E-09 -5,5 5,44E-11 6,97E-12 0,00% 0,00%
Central 2,50E-09 2,48E-09 -0,9 2,67E-09 6,7 3,75E-11 4,61E-11 -31,04% 561,32%
C ontraction 2,65E-09 2,63E-09 0,9 2,71E-09 2,3 5,40E-11 5,59E-11 44,06% 21,40%
Downstream 2,65E-09 2,61E-09 1,4 2,46E-09 -7,1 - - - -
B
Upstream 2,50E-09 2,47E-09 -1,3 2,22E-09 -11,2 - - - -
Expansion 2,50E-09 2,50E-09 0,5 2,32E-09 -7,3 3,99E-11 2,13E-11 0,00% 0,00%
Central 2,50E-09 2,49E-09 -0,3 2,09E-09 -16,3 2,01E-11 1,65E-11 -49,50% -22,51%
C ontraction 2,50E-09 2,49E-09 -0,2 2,48E-09 -0,8 2,19E-11 2,15E-11 8,83% 30,26%
Downstream 2,50E-09 2,47E-09 -1,3 2,07E-09 -17 - - - -
D
Upstream 2,50E-09 2,47E-09 -1,3 - - - - - -
Expansion 2,50E-09 2,49E-09 -0,4 - - 2,37E-11 - 0,00% -
Central 2,50E-09 2,49E-09 -0,6 - - 1,52E-11 - -35,74% -
C ontraction 2,50E-09 2,49E-09 -0,6 - - 1,55E-11 - 1,80% -
Downstream 2,50E-09 2,47E-09 -1,4 - - - - - -
One point of discussion risen after the experimental results analysis regards some differences verified
in the experimental and numerical comparison, particularly in planes located at heights close to the
upper and lower walls of the straight channels. These are mainly due to the influence of the
uncertainty associated with the micro-channel geometries and to erroneous contributions of the three-
(b) (a)

João Paulo Costa
Kinematic and dynamic characterization of stationary flows in rectilinear micro-channels and micro-valves, recurring to micro-PIV technique and to numerical Simulation
10
dimensional velocity components. It is important to discuss the increase of the experimental error with
the increase of valve height (case of rectangular valves with constant width) and also with the
decrease of valve width (case of triangular valves with constant height).
This is clearly a consequence of the effect of velocity gradients outside the focus plane, including
vertical velocity components in the horizontal one calculated with micro-PIV.
The experimental error verified was acceptable, with the exception of particular sections which were
more affected by the difficulties and deviations attributed to the experimental technique.
3.2. Dynamic characterization
The pressure drop inside micro-geometries was investigated for rectilinear channels and rectangular
valves.
Figure 10 – Friction factor ƒx(Re) for rectilinear channel
For the rectilinear case, a higher value for the friction factor was depicted, in comparison with the
theoretical values, as seen in fig. 10. The main reasons for this fact are the influence of wall
roughness, which introduce perturbations that raise the flow in line pressure drop; and the uncertainty
in the determination of the micro-channels dimensions, which, although accounted in the error
analysis, may have a bigger influence in the results than expected.
0,1
1,0
10,0
100,0
5 50 500
ƒƒ ƒƒ
Re
Friction factor .vs. Reynolds number
ExperimentalTheoreticaldeviation due to uncertainties in the channels dimensions - upper limitdeviation due to uncertainties in the channels dimensions - lower limit

João Paulo Costa
Kinematic and dynamic characterization of stationary flows in rectilinear micro-channels and micro-valves, recurring to micro-PIV technique and to numerical Simulation
11
Figure 11 – Pressure drop inside a micro-valve: experimental and numerical results
For the pressure drop in the rectangular micro-valve, a higher pressure drop was verified, comparing
these results both with the rectilinear correspondent (experimental) and with the numerical simulation
of a similar geometry. This is due to the sudden conversion of kinetic energy into pressure energy
experienced in the expansion section.
4. Conclusions In this work the effective influence of valve size variation on the laminar microscopic liquid flows
behaviour was investigated. For that, data measured with micro-PIV were compared against CFD
predictions for similar conditions but, in order to quantify effects not predicted by the macroscopic
theory. The numerical predictions were performed for a hydrodynamically smooth geometry.
Since micro-PIV provides only two-dimensional velocity data, horizontal planes along the micro-
channel cross-sections were used for velocity measurements allowing the reconstruction of the three-
dimensional velocity profiles.
The analysis of the results allows to conclude that micro-PIV is an experimental technique that,
although producing good and reliable results, is strongly affected by the presence of errors such as
the uncertainty of the geometry of the micro-channels, low quality signal and the influence of vertical
velocity components due to three-dimensional velocity fields.
The differences shown between CFD and micro-PIV results are mainly due to disparities between the
real geometry and the one numerically simulated.
As for the pressure drop measurements, microfluidic devices revealed to suffer the influence of wall
roughness, inducing an increase in the friction factor in comparison with hidrodynamically smooth
surfaces.
The micro-channel with valve revealed lower pressure drop along its length. This is due to the
instantaneous conversion of kinetic energy into pressure in the sudden expansion.
These results are in accordance with the simulations.
y = 0,0065x - 0,2233R² = 0,9998
y = 0,0074x + 0,5433R² = 0,9979
0
1
2
3
4
5
6
7
8
9
10
300 500 700 900 1100 1300∆
P[k
Pa]
Q [µl/min]
∆P - Numerical ∆P - ExperimentalLinear (∆P - Numerical) Linear (∆P - Experimental)

João Paulo Costa
Kinematic and dynamic characterization of stationary flows in rectilinear micro-channels and micro-valves, recurring to micro-PIV technique and to numerical Simulation
12
References [1] Peng X. F., Peterson G. P., Convective heat transfer and flow friction for water flow in microchannel structures, International Journal of Heat and Mass Transfer 1996, 39: 2599-2608 [2] Mala G.M., Li D., 1999. Flow characteristics of water in microtubes. Int. J. of Heat and Fluid Flow 20: 142-148 [3] Yu D., Warrington R., Barron R., Ameel T., 1995. An experimental and theoretical investigation of fluid flow and heat transfer in microtubes. Proc. of ASME/JSME Thermal Engineering Joint Conf., Maui, HI, 523-530 [4] Pfund D., Rector D. Shekarriz A., 2000. Pressure drop measurements in a micro-channel, AIChE J. 46: 1496-1507 [5] Judy J., Maynes D., Webb B., 2002. Characterization of frictional pressure drop for liquid flows through microchannels. Int. J. of Heat and Mass Transfer 45: 3477-3489 [6] Sharp K., Adrian R., 2004. Transition from laminar to turbulent flow in liquid filled microtubes. Exp. in Fluids 36: 741-747 [7] Celata G., Cumo M., McPhail S., Zummo G., 2005. Characterization of fluid dynamic behaviour and channel wall effects in microtube. Int. J. Heat Fluid Flow 27: 135-143 [8] Santiago J.G., Wereley S.T., Meinhart C.D., Beebe D.J., Adrian R.J., A particle image velocimetry system for microfluidics, Experiments in Fluids 1998; 25: 316-319 [9] Brody J.P., Yager P., Goldstein R.E., Austin R.H., Biotechnology at low Reynolds numbers, Biophysical Journal 1996; 71: 3430-3441 [10] Santiago J.G., Wereley S.T., Meinhart C.D., Beebe D.J., Adrian R.J., A particle image velocimetry system for microfluidics, Experiments in Fluids 1998; 25: 316-319 [11] Meinhart C.D., Wereley S.T., Santiago J.G., PIV measurements of a microchannel flow, Experiments in Fluids 1999; 27: 414-419 [12] Meinhart C.D., Wereley S.T., Gray M. H. B., Volume illumination for two-dimensional particle image velocimetry; Measurement Science and Technology 2000.b, 11: 809-814 [13] Meinhart C.D., Wereley S.T., Second-order accurate Particle Image Velocimetry; Experiments in Fluids 2001, 31: 258-268 [14] Devasenathipathy S., Santiago J.G., Wereley S.T., Meinhart C.D., Takehara K., Particle imaging techniques for microfabricated fluidic systems. Experiments in Fluids 2003; 34: 504-515 [15] Olsen M.G., Bourdon C.J., Out-of-Plane Motion Effects in Microscopic Particle Image Velocimetry; Journal of Fluids Engineering 2003, 125: 895-901 [16] Bown M.R., MacInnes J.M., Allen R.W.K., Micro-PIV simulation and measurement in complex microchannel geometries, Measurement Science and Technology 2005, 16: 619–626 [17] Ozalp C., Pinarbasi A., Fakilar M.S., Sahin B., PIV measurements of flow through a sudden contraction; Flow Measurement and Instrumentation 2007, 18: 121–128 [18] Hu Y., Werner C., Li D., Influence of three-dimensional roughness on pressure-driven flow through microchannels; Journal of Fluids Engineering 2003, 125: 871-879 [19] Rawool A. S., Mitra S. K., Kandlikar S. G., Numerical simulation of flow through microchannels with designed roughness; Microfluid and Nanofluid 2005, 2: 215–221 [20] Valdés J. R., Miana M. J., Pelegay J. L., Núñez J. L., Pütz T., Numerical investigation of the influence of roughness on the laminar incompressible fluid flow through annular microchannels; International Journal of Heat and Mass Transfer 2007, 50: 1865–1878 [21] Chein R., Tsai S. H., Microfluidic flow switching design usinv volume of fluid model; Biomedical Microdevices 2004, 6: 1, 81-90 [22] Chen J. M., Horng T., Tan W. Y., Analysis and measurements of mixing in pressure-driven microchannel flow; Microfluid and Nanofluid 2006, 2: 455–469 [23] Jayaraj S., Kang S., Suh Y. K., A review on the analysis and experiment of fluid flow and mixing in micro-channels; Journal of Mechanical Science and Technology 2007, 21:5 36-548

João Paulo Costa
Kinematic and dynamic characterization of stationary flows in rectilinear micro-channels and micro-valves, recurring to micro-PIV technique and to numerical Simulation
13
[24] Croce G., D’Agaro P., Nonino C., Three-dimensional roughness effect on microchannel heat transfer and pressure drop; International Journal of Heat and Mass Transfer 2007, 50: 5249–5259 [25] Khadem M.H., Shams M., Hossainpour S., Numerical simulation of roughness effects on flow and heat transfer in microchannels at slip flow regime; International Communications in Heat and Mass Transfer 2009, 36: 69–77 [26] Haller D., Woias P., Kockmann N., Simulation and experimental investigation of pressure loss and heat transfer in microchannel networks containing bends and T-junctions; International Journal of Heat and Mass Transfer 2009, 52: 2678–2689 [27] Tretheway D. C., Meinhart C. D., Towards numerical prototyping of labs-on-chip: modeling for integrated microfluidic devices; Microfluid and Nanofluid 2005 1: 301–318 [28] Renaud L., Malhaire C., Kleimann P., Barbier D., MorinP., Theoretical and experimental studies of microflows in silicon microchannels; Materials Science and Engineering 2008, C 28: 910–917 [29] Janakiraman V., Sastry S., Kadambi J. R., Baskaran H., Experimental investigation and computational modeling of hydrodynamics in bifurcating microchannels; Biomedical Microdevices 2008, 10: 355–365 [30] Mott D. R., Howell Jr. P. B., Obenschain K. S. , Oran E. S. , The Numerical Toolbox: An approach for modeling and optimizing microfluidic components; Mechanics Research Communications 2009, 36: 104–109 [31] Silva G., Leal N., Semião V., Micro-PIV and CFD characterization of flows in a microchannel: Velocity profiles, surface roughness and Poiseuille numbers; International Journal of Heat and Fluid Flow 2008, 29: 1211–1220 [32] Raffel M., Willert C.E., Kompenhans J., Particle Image Velocimetry – A Pratical Guide, Spinger; 1998 [33] Silva G., Caracterização Experimental de um Escoamento Microfluídico, Trabalho final de curso, Departamento de Engenharia Mecânica 2006, Instituto Superior Técnico, Universidade Técnica de Lisboa [34] Silva G., Leal N., Semião V., Determination of microchannels geometric parameters using micro-PIV; Chemical engineering research and design 2008 [35] White F. M., Viscous Fluid Flow, Mc-Graw Hill, Inc, New York; 1991 [36] Miller J. C., Miller J. N., 1993; Statistics of Analytical Chemistry, 3ª Edição, Prentice-Hall, Englewood Cliffs, NJ


![Control t Cnico Economico y Marco Legal[1]](https://static.fdocuments.us/doc/165x107/577c810f1a28abe054ab4dd2/control-t-cnico-economico-y-marco-legal1.jpg)


