RESULTS PREVIEW October 09, 2015 Outlook...
75
Ambit Capital and / or its affiliates do and seek to do business including investment banking with companies covered in its research reports. As a result, investors should be aware that Ambit Capital may have a conflict of interest that could affect the objectivity of this report. Investors should not consider this report as the only factor in making their investment decision. Outlook deteriorates further Following two dismal earnings seasons and continuing signs of weak economy, our team’s outlook turns downbeat for nearly half of the sectors for FY16; this is in sharp contrast to positive outlook nearly 3-6 months back. Since the last earnings season, we have reversed our positive outlook on Agri inputs, Consumer, E&C and NBFCs. Barring a few sectors/stocks we have downgraded our earnings for most stocks and we continue to remain behind consensus in nearly all sectors except Autos; we are ahead of consensus in a few IT, Cement, E&C and Pharma companies. We believe consensus’ view of 12% Sensex EPS growth (we expect 8-9% growth) and 7% GDP growth is misplaced. Consequently, we have lowered our FY16 Sensex target to 28k; we prefer quality to cyclicals. A decelerating economy A combination of a broken banking system, a sliding real estate sector and a PM determined to reset the way the Indian economy works poses a threat to GDP growth in India in FY16 (our thematic dated 28 August, “Exit the fantasy, enter the reality, for more details). GDP growth in FY15 was recorded at 7.3% YoY. We expect GDP growth to be recorded at 6.8% YoY in FY16, thereby resulting in a 50bps sequential deceleration. RBI’s repo rate cut provides conclusive proof regarding the RBI’s realisation of decelerating economy. Portfolio implications: stick to quality, avoid cyclicals We continue to stick with quality (even at higher valuations) and advise being underweight on cyclicals (E&C, Banking). The proportion of cyclicals has come down in the recent iterations of our G&C portfolio largely due to a reduction in the valuation discount of cyclicals vs defensives even as macroeconomic conditions remain weak. Key Large cap BUYs: Axis Bank, ITC, PGCIL, HCL Tech, Coal India, Ashok Ley Key Large cap SELLs: L&T, Aurobindo Pharma, BHEL, GCPL Key Mid cap BUYs: IPCA, PI Ind, Century Ply, Finolex Cables, Sadbhav Eng, Titan, Page Industries, Cholamandalam Finance 2QFY16 Results Preview RESULTS PREVIEW October 09, 2015 Continuing disappointments and near-term concerns Watch out for Outlook Recommendations Positives Negatives Jul-Sept 2015 Qtr FY16 vs FY15 Top BUYs Top SELLs Agri Inputs New product launches Pricing, competitive intensity in generics PI, SRF Rallis Automobiles Weak commodity prices Currency movements Ashok Leyland Hero MotoCorp Banking Lower fresh bad assets Loan growth, NIMs and credit costs Axis Bank - Capital Goods Demand uptick in powergen Deceleration in light electrical demand Finolex Cables, Greaves Cotton Bajaj Electricals, BHEL Consumer/ Retail Margin expansion Weak volume growth ITC, Page, Bata, Titan, Trent Jubilant Food Cement Coal costs Volumes, realisation Orient Cement ACC E&C Stability in working capital Slow execution Power Grid, BEL L&T Healthcare Product-specific upsides in US Adverse currency, intensifying competition in US IPCA Aurobindo Metals/Mining Coal production Steel, aluminium and e- auction realisations Coal India Hindalco NBFCs NIMs Weak growth and asset quality pressure Cholamandalam Fin Bajaj Fin Technology Currency, seasonal strength Downgrades to outlook on weak global macro HCL Tech - Utilities Decline in imported coal prices Increase in SEB backdown Tata Power JSW Energy Source: Ambit Capital research Analyst Details Nitin Bhasin +91 22 3043 3241 [email protected] Research Team +91 22 3043 3000 [email protected]
Transcript of RESULTS PREVIEW October 09, 2015 Outlook...
Ambit Capital and / or its affiliates do and seek to do business including investment banking with companies covered in its research reports. As a result, investors should be aware that Ambit Capital may have a conflict of interest that could affect the objectivity of this report. Investors should not consider this report as the only factor in making their investment decision.
Outlook deteriorates further Following two dismal earnings seasons and continuing signs of weak economy, our team’s outlook turns downbeat for nearly half of the sectors for FY16; this is in sharp contrast to positive outlook nearly 3-6 months back. Since the last earnings season, we have reversed our positive outlook on Agri inputs, Consumer, E&C and NBFCs. Barring a few sectors/stocks we have downgraded our earnings for most stocks and we continue to remain behind consensus in nearly all sectors except Autos; we are ahead of consensus in a few IT, Cement, E&C and Pharma companies. We believe consensus’ view of 12% Sensex EPS growth (we expect 8-9% growth) and 7% GDP growth is misplaced. Consequently, we have lowered our FY16 Sensex target to 28k; we prefer quality to cyclicals.
A decelerating economy A combination of a broken banking system, a sliding real estate sector and a PM determined to reset the way the Indian economy works poses a threat to GDP growth in India in FY16 (our thematic dated 28 August, “Exit the fantasy, enter the reality, for more details). GDP growth in FY15 was recorded at 7.3% YoY. We expect GDP growth to be recorded at 6.8% YoY in FY16, thereby resulting in a 50bps sequential deceleration. RBI’s repo rate cut provides conclusive proof regarding the RBI’s realisation of decelerating economy.
Portfolio implications: stick to quality, avoid cyclicals We continue to stick with quality (even at higher valuations) and advise being underweight on cyclicals (E&C, Banking). The proportion of cyclicals has come down in the recent iterations of our G&C portfolio largely due to a reduction in the valuation discount of cyclicals vs defensives even as macroeconomic conditions remain weak.
Key Large cap BUYs: Axis Bank, ITC, PGCIL, HCL Tech, Coal India, Ashok Ley
Key Large cap SELLs: L&T, Aurobindo Pharma, BHEL, GCPL
Key Mid cap BUYs: IPCA, PI Ind, Century Ply, Finolex Cables, Sadbhav Eng, Titan, Page Industries, Cholamandalam Finance
2QFY16 Results Preview
RESULTS PREVIEW October 09, 2015
Continuing disappointments and near-term concerns
Watch out for Outlook Recommendations
Positives Negatives Jul-Sept 2015 Qtr FY16 vs FY15 Top BUYs Top SELLs
Agri Inputs New product launches Pricing, competitive intensity
in generics PI, SRF Rallis
Automobiles Weak commodity
prices Currency movements
Ashok Leyland Hero MotoCorp
Banking Lower fresh bad assets Loan growth, NIMs and credit
costs Axis Bank -
Capital Goods Demand uptick in
powergen Deceleration in light electrical
demand Finolex Cables, Greaves Cotton
Bajaj Electricals, BHEL
Consumer/ Retail Margin expansion Weak volume growth ITC, Page, Bata, Titan,
Trent Jubilant Food
Cement Coal costs Volumes, realisation
Orient Cement ACC
E&C Stability in working
capital Slow execution Power Grid, BEL L&T
Healthcare Product-specific upsides in US
Adverse currency, intensifying competition in US IPCA Aurobindo
Metals/Mining Coal production Steel, aluminium and e-
auction realisations Coal India Hindalco
NBFCs NIMs Weak growth and asset
quality pressure Cholamandalam Fin Bajaj Fin
Technology Currency, seasonal
strength Downgrades to outlook on
weak global macro HCL Tech -
Utilities Decline in imported
coal prices Increase in SEB backdown Tata Power JSW Energy
Source: Ambit Capital research
Analyst Details
Nitin Bhasin +91 22 3043 3241 [email protected]
Research Team +91 22 3043 3000 [email protected]

2QFY16 Results Preview
October 09, 2015 Ambit Capital Pvt. Ltd. Page 2
Exhibit 1: Material revisions to estimates and valuations ahead of earnings season (more than 5%)
Company New EPS estimate (%) Change in EPS estimates (%)
Valuation Stance
FY16E FY17E FY16E FY17E New Old Change (%) Ashok Leyland 4 5 10% 4% 105 99 7% BUY
BHEL 4 6 -37% -34% 128 116 9.8% SELL
Cummins 28 33 3% 2% 638 608 4.9% SELL
Bajaj Electrical 12 14 -12% -6% 229 225 2.0% SELL
V-Guard 32 40 -9% -14% 1,163 1,241 -6.3% BUY
Finolex Cables 15 17 -2% -6% 301 308 -5.4% BUY
Crompton 4 9 -4% 11% 155 154 0.7% SELL
AIA Engineering 42 50 -8% -10% 950 1,038 -8% SELL
Voltas 13 15 11.9 13.1 220 157 40% SELL
MOFS 13 18 -14% -9% 354 373 -5% BUY
Source: Ambit Capital research
Exhibit 2: Sectoral snapshot ahead of results
FY16 estimate revisions before results Compared to FY16 consensus Stance
Up Down Higher Lower BUY SELL
Agri Inputs - SRF, PI PI, SRF Rallis PI Rallis
Automobiles Ashok Leyland Maruti Suzuki
Ashok Leyland, Bajaj Auto,
Maruti Suzuki, Eicher Motors,
TVS Motor, Mahindra CIE,
Exide Industries,
Balkrishna Industries, Tata Motors, Hero
MotoCorp
Tata Motors, Maruti Suzuki, Ashok Leyland,
Mahindra CIE
Hero MotoCorp, Eicher Motors, Exide
Industries, Bajaj Auto, TVS Motor, Balkrishna
Industries
Banking - South Indian Bank
-
HDFC Bank, ICICI Bank, Axis Bank, SBI,
PNB, BOI, Karur Vysya Bank, Federal
Bank, City Union Bank
Axis Bank, IndusInd Bank, Bank of Baroda,
City Union Bank
ICICI Bank, Kotak Mahindra Bank,
HDFC Bank, SBI, PNB, Karur Vysya Bank
Capital Goods Cummins, Havells BHEL, Finolex, Bajaj, V-Guard, Crompton
Finolex Cables, Greaves Cotton
BHEL, Thermax, Cummins, Havells, V-
Guard, Bajaj Electricals, Crompton,
Inox
V-Guard, Greaves,
Finolex Cables
BHEL, Thermax, Cummins, Havells,
Bajaj, Crompton, Inox
Consumer
Asian Paints, Jubilant Foodworks, Berger
Bata, Page, Trent Pidilite, Jubilant
Foodworks, Asian Paints, Berger, Titan
Bata, TTK, Page, Titan, Trent
Jubilant, Asian Paints, Berger, Pidilite
Cement - -
UltraTech, Ambuja, Orient,
ACC Ramco, Shree orient
UltraTech, Ambuja, ACC, Ramco, Shree
E&C L&T, Power Grid, Voltas, Blue Star
AIA Engineering, Engineers India
Power Grid, Bharat
Electronics, Voltas, Engineers
India
L&T, AIA Engineering, VA Tech, Blue Star
Power Grid, Bharat Electronics
L&T, AIA Engineering, Voltas, Engineers
India, VA Tech, Blue Star
Healthcare NA NA Sun, IPCA,
Lupin, Torrent Pharma
Aurobindo, Dr. Reddy, Cadila
Lupin, Torrent, IPCA, Cadila
Aurobindo, Dr. Reddy, Cipla
Metals & Mining - - Nalco, Hindalco, Tata
Steel, SAIL, Coal India
Coal India Hindalco, Nalco, Tata
Steel, SAIL
NBFCs NA MOFS
NA SCUF, LICHF, MMFS, BAF, MGMA, CIFC
MGMA, SCUF, MOFS, CIFC
LICHF, MMFS, SHTF, BAF
Technology TCS, Infosys, Wipro,
TechM, eClerx, MindTree, Persistent
HCL Tech
HCLT, TechM, MindTree, eClerx
TCS, Infosys, Persistent
TCS, Infosys, HCLT, TechM
Wipro, MindTree, Persistent, eClerx
Utilities NTPC Tata Power,
Torrent Power JSWE, NTPC, Tata Power, Torrent
Power NTPC, JSWE
Source: Ambit Capital research
2QFY16 Results Preview
October 09, 2015 Ambit Capital Pvt. Ltd. Page 3
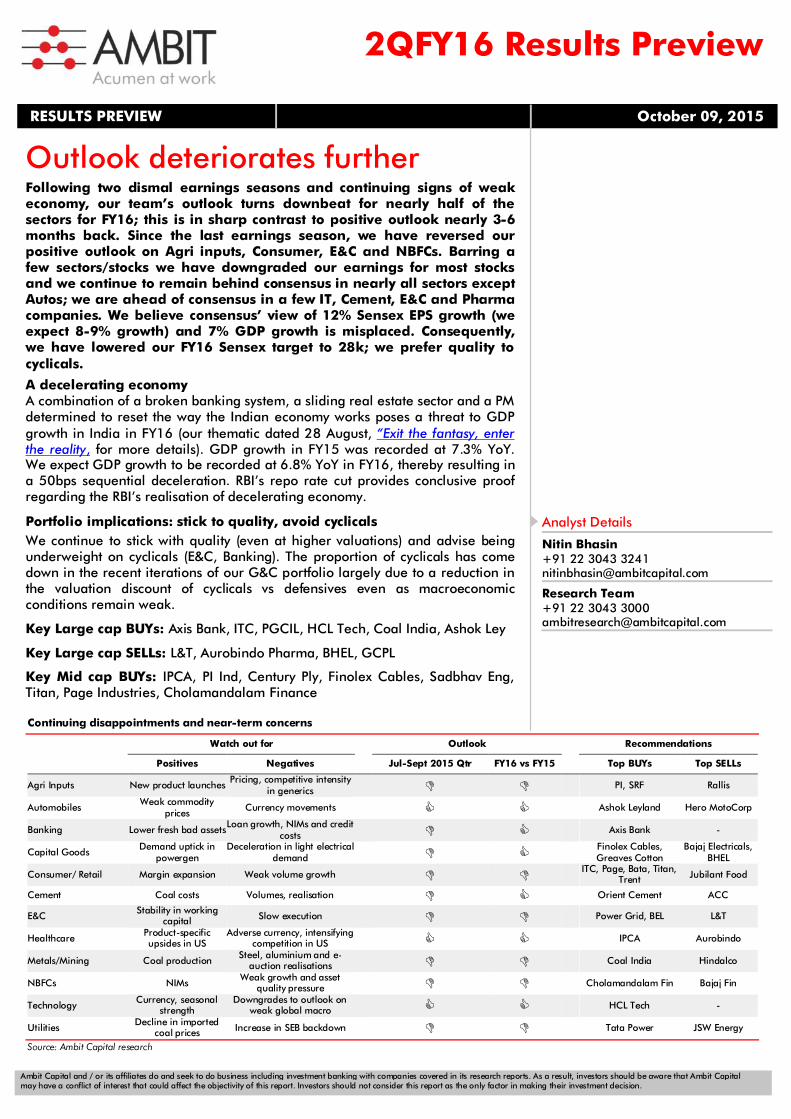
Exhibit 3: Sector views
Sector Views Estimate revisions for FY16
Agri Inputs Rallis will continue to underperform the agrochem industry growth rates given high competitive intensity
Players with higher share of generics were most adversely impacted given poor monsoon
Specialty chemical exports continue to stay steady
Down
Automobiles CVs and PVs growth to exceed that of 2Ws (the latter getting impacted by weak rural demand)
Competitive intensity to remain high in 2Ws but relatively modest in PVs and CVs
Benign commodity prices to aid margins but currency risks prevail
Unchanged
Banking Loan growth slowdown, NIMs compression and asset quality pressure are likely to continue in near term
Banks with stronger balance sheets and liability franchise to benefit from upturn in growth cycle Unchanged
Capital Goods
Declining order book for BTG for most players
Slight uptick in demand for gensets due to increase in power outages
Deceleration in demand for light electricals due to weak real estate activity
Down
Consumer
FMCG volume growth at 4.7% YoY for 2QFY16 vs 5.0%/5.6% in 1QFY16/2QFY15
Gross margin benefits of ~300bps YoY in 2Q from lower input costs; tailwind will last until 3QFY16
We expect macro demand revival for most categories, earliest by 1QFY17
Down
Cement
Weak infra demand amid slowdown in rural/ urban housing will hurt volume growth and pricing growth
Some volume recovery in 2Q but strong pricing recovery in North India but weakening prices in South/West
Demand super-cycle will commence in 2HFY18 at best, FY17 to be an average year
Unchanged
Healthcare Revenue growth to be led by growth in domestic offset by decline in EMs due to adverse currency movement
EBITDA margins to compress by 47bps YoY largely due to incremental competition in key products
Adverse currency movements could impact profitability
Unchanged
Engineering & Construction (E&C)
Increase in order inflows in select pockets such as roads, Power T&D; execution to be slow
Margins pressure due to weak topline growth
Consensus expectation of a near-term cyclical recovery are misplaced; will lead to disappointments
Down
Metals & Mining Overcapacity in aluminium coupled with high inventory keeps price outlook muted
Weaker raw material prices globally and muted domestic steel demand to keep a pressure on prices
Domestic coal offtake to rise to 9% CAGR in FY14-17E vs 1.6% over FY10-14; however, price hikes unlikely
Unchanged
NBFCs Loan growth slowdown to continue along with asset quality stress
Decline in cost of funds should result in some ease in margins Down
Technology Expect robust revenue growth in Sep-15 driven by seasonal strength and INR depreciation
However, there is some uncertainty due to rising macro risks in the US and emerging markets
We expect margins to improve due to INR depreciation and lack of visa related costs
Up
Utilities
Fall in PLF due to higher back-down from SEBs
Declining prices of imported coal
Lower incentives due to new tariff norms
Down
Source: Ambit Capital research

2QFY16 Results Preview
October 09, 2015 Ambit Capital Pvt. Ltd. Page 4
TOP BUY RECOMMENDATIONS Recommendation Upside (%) Rationale/catalysts
ITC
22
Expect flat cigarette volume growth YoY in 2HFY16 due to weak base (vs -15% YoY in 1HFY16)
Government’s hawkish stance against cigarette taxation is not sustainable
Upside from improvement in profitability of non-cigarette FMCG business
(ITC IN)
CMP: Rs332
TP: Rs405
Coal India
23
Offtake growth to revive to 9% CAGR in FY15-20E vs 1.6% CAGR recorded over FY10-14
Volume growth coupled with rising mix of contracted labour to derive operating leverage
CIL trades at FY17 P/E of 12.7x, in line with historical average
(COAL IN)
CMP: Rs 346
TP: Rs425
Axis Bank
40
The bank aggressively diversified and de-risked its balance sheet on the assets and liabilities side
Strong capital position, provision coverage and operating profitability offset asset quality risks
Trading at valuation of 11.7x FY17E EPS (a ~24% discount to new private sector banks’ average)
(AXSB IN)
CMP: Rs 492
TP: Rs690
HCL Tech
39
Better portfolio mix (higher exposure to cost-focused service-lines such as IMS)
Stable senior management team, efficient use of capital (RoE of 33% in FY15)
We expect that recent investments in the business will accelerate organic growth
(HCLT IN)
CMP: Rs838
TP: 1,150
Power Grid
29%
Capitalisation momentum ot sustain (Rs293bn in FY16) resulting in a 23% earnings CAGR (FY15-18)
Ability to raise capital at lower cost than peers makes it the front runner to win TBCB contracts
Inexpensive valuation of 1.4x FY16 P/B given its regulated business model and strong earnings visibility
(PWGR IN)
CMP: Rs 132
TP: Rs171
Titan Company
24
New Golden Harvest Scheme will begin contributing materially from FY17E (12% of jewellery revenues)
Low making charges, high debt:equity and restrictions on customer deposits will reduce competition
Stock trades at 27x FY17E earnings (FY17E EPS growth of 33%) at a discount to 5-year average of 32x
(TTAN IN)
CMP: Rs325
TP: Rs404
Bharat Electronics
16%
Moving up the value chain by increasing focus on system integration projects
Its project management skills, technical know-how and large manufacturing base are key advantages.
Well placed to leverage structural changes in defence procurement; 19x FY17 PE reasonable
(BHE IN)
CMP: Rs1,203
TP: Rs1,390
Ashok Leyland
15
MHCV demand continues to revive and AL continues to gain market share
Operating leverage, non-core asset sale and limited capex to improve profitability and balance sheet
Core CV business currently trades at 9.8x FY17E net earnings,10% higher than historical average
(AL IN)
CMP: Rs 92
TP: Rs105
Tata Power
50
Improving cash flows of Mumbai and Delhi distribution circle
Reducing losses at Mundra led by falling imported coal prices
Improving performance of Maithon led by sign up of long term PPAs
(TPW IN)
CMP: Rs70
TP: Rs106
Page Industries
19
Kidswear launch in 3QFY16, implementation of new IT platform, rapid expansion of EBOs
Competitive advantages include manufacturing prowess, brand and product development
Weak sales growth in 2QFY16E given distributor liquidity issues; ~100bps EBITDA margin gains
(PAG IN)
CMP: Rs 13,570
TP: Rs 15,764
Cholamandalam Finance
18
RoAs would improve to 2% by FY18E due to declining cost of funds and improving operating leverage
Growth in lucrative LCV financing and old CV financing should drive long term sustainable growth
Current valuations at 2.5x 1yr fwd P/B ignore the long-term growth prospects of the company
(CIFC IN)
CMP: Rs625
TP: Rs740

2QFY16 Results Preview
October 09, 2015 Ambit Capital Pvt. Ltd. Page 5
Recommendation Upside (%) Rationale/catalysts
IPCA
31
Earnings bottomed out; expect normalised revenue from HCQS and Insti business from 3QFY16
Import alert to be resolved by FY18E and see lumpy product approvals in FY19-20E
Strong positioning in the DNA and 5’R’ frameworks comforts us on the sustainability of earnings
(IPCA IN)
CMP: Rs 821
TP: Rs952
PI Industries
23
Credible play on the rising chemical exports opportunity plus the underpenetrated agri inputs sector
Industry-leading execution (27% revenue CAGR over FY09-15, 14-27% RoCEs over FY09-15)
Valuation implies 26x FY17 eps, we build 30% eps FY15-17 CAGR, high RoCEs, strong cash conversion
(PIIN)
CMP Rs652
TP Rs800
Sadhav Engineering
25
3.2x LTM book-to-bill and reducing leverage will drive 20%/37% EPC revenue/PAT CAGR over FY15-18
Improving traffic and debt refinancing to improve cash flows and generate growth capital
Inexpensive implied valuation of 11x for the construction basis the current market cap of SIPL
(SADE IN)
CMP: Rs 300
TP: Rs375
Trent Ltd
31
Improving sales density in Westside will result in doubling standalone EBITDA from FY15 to FY17E
Westside and Zara (49%JV) are plays on the largely unorganized 18bn womens wear market.
The stock trades at 15X FY17E EBITDA with EBITDA growth of 3x over FY15-17E.
(TRENT IN)
CMP: Rs1,315
TP: Rs1,717
Century Plyboards
38
Strengthening brand/distribution and raw material security aiding market share gains
Margin expansion (to 17.3%-17.7& in FY16-17 against 15.9% in FY15) led by benign commodity prices
30% + RoEs over FY16-18 and trading at a reasonable 16x FY17 EPS
(CPBI IN)
CMP: Rs 175
TP: Rs242
Finolex Cables
26
Expect Finolex to report the highest revenue growth in cables and wires led by pan India expansion
Ability to leverage brand is the highest given strong brand re-call (more than 50 year old brand)
Valuation at 13x FY17 P/E is attractive
(FNXC IN)
CMP: Rs 236
TP: Rs301
Greaves Cotton
67
Uptick in demand in FY16 led by recovery in 3W and 4Ws
Signing-up of at least one large OEM in FY16 in the 4W space in the 1.5-3.5 tonne
Doubling of market share in gensets over FY15-17E from 4% in FY15
(GRV IN)
CMP: Rs126
TP: Rs214
Source: Bloomberg, Ambit Capital research

2QFY16 Results Preview
October 09, 2015 Ambit Capital Pvt. Ltd. Page 6
TOP SELL RECOMMENDATIONS Recommendation Downside (%) Rationale/catalysts
L&T
7%
Due to rising proportion of civil projects, book-to-bill continues to increase; only 10% revenue growth in FY16
High proportion of capital employed (nearly half) in non-capex-recovery-oriented segments Our valuation for the standalone business implies 17x FY17 core P/E and see limited room for re-rating
(LT IN)
CMP: Rs1,534
TP: Rs1,420
BHEL
37 ~31% of BHEL’s order book is moving at slow pace and an additional 13% has actually been stalled. Enquiries from the private sector continue to be negligible Enquiries from NTPC may decelerate given its shift towards expanding through the acquisition route
BHEL IN
CMP: Rs 203
TP: Rs 128
Hero MotoCorp
2 Muted domestic motorcycle sales on the back of weak rural demand Rising competitive intensity and scooterisation to continue impacting Hero’s domestic market share The stock currently trades at 15.2x FY17 net earnings, marginally higher than historical average
HMCL IN
CMP: Rs 2,542
TP: Rs 2,500
Aurobindo Pharma
45 Aurobindo’s profits and future pipeline will be under threat as incumbents return in US over FY16-18 Lack of investments in long-term growth drivers; material governance issues with the promoter’s FY17E P/E is at 16.2x vs our implied multiple of 10.5x due to structural issues in its business
ARBP IN
CMP: Rs 755
TP: Rs 414
Godrej Consumer
30 Market share saturation in household insecticides; MNC competition in Hair Colour Macro/integration issues in its Africa business; Macro headwinds in Indonesia International business RoCE due above headwinds and management's inorganic growth ambitions.
(GCPL IN)
CMP: Rs1,265
TP: Rs890
Bajaj Finance
39 BAF’s asset quality risks due to slowdown in real-estate prices and increasing high-risk borrowers Increasing delinquencies in unsecured business loans pose additional risks Valuations of ~3.4x one-year forward P/B, do not factor in increased risks to asset quality and growth
(BAF IN)
CMP: Rs5,120
TP: Rs3,239
ACC
9 Weak demand and ongoing loss in market share leading to only marginal volume growth Poor cost efficiency leading to rising costs despite reduction in fuel prices Trading at a rich 10x one-year forward EBITDA, a 20% premium to its five-year average
(ACEM IN)
CMP: Rs1,357
TP: Rs1,241
Hindalco
5 Overcapacity in aluminium and high inventory keeps aluminium price outlook muted Deallocation of coal blocks has significantly impacted profitability of Mahan and Aditya smelters The stock is trading at FY17E EV/EBITDA of 6.6x, a premium to the historical average of 6.0x
(HNDL IN)
CMP: Rs81
TP: Rs78
JSW Energy
22 Decline in merchant realisation in FY16 and FY17 Limited decline in imported coal prices from hereon Limited organic growth expansion given leveraged balance sheet (FY16 net debt:equity of 1.8x).
(JSWE IN)
CMP: Rs89
TP: Rs71
Jubilant Foodworks
21 Over 40% price hikes cumulatively over the past two years amidst price elastic demand Pressure on SSG from high competitive intensity and store splits; >10% SSG at least 3 quarters away ~150bps EBITDA margin drag from Dunkin Donuts to continue for another three years
(JUBI IN)
CMP: Rs1,675
TP: Rs1,320
Rallis
21 Higher share of highly competitive generics facing price erosion in the domestic agro chemicals market Exports sales also muted as the major markets of Brazil and Australia are drought hit Muted margins in the fast growing seeds segments to drag the overall margin
RALI IN
CMP: Rs 217
TP: Rs 180
Bajaj Electricals
7 Loss of market share in consumer durables business due to roll out of theory of constraints (TOC) Minimal margin expansion in lightings given rising participation in Government tenders E&P business’s RoCE to remain capped at 6%
(BJE IN)
CMP: Rs 250
TP: Rs229
Source: Bloomberg, Ambit Capital research

2QFY16 Results Preview
October 09, 2015 Ambit Capital Pvt. Ltd. Page 7
Economy GDP growth to decelerate in FY16; expect 25bps rate cut in FY16 form hereon A combination of a broken banking system, a sliding real estate sector and a PM determined to reset the way the Indian economy works poses a threat to GDP growth in India in FY16 (see our thematic dated 28 August, “Exit the fantasy, enter the reality, for more details). GDP growth in FY15 was recorded at 7.3% YoY. We expect GDP growth to be recorded at 6.8% YoY in FY16, thereby resulting in a 50bps sequential deceleration. As regards inflation, we expect CPI inflation to bottom out by 2QFY16 and then rise to an average of 5% YoY in 4QFY16. As the CPI inflation remains well below the RBI’s comfort zone and as the downside risks to the GDP growth increases, we expect the RBI to cut the repo rate by another 25bps in FY16 (over and above the 125bps which the RBI has already administered in CY15).
In our note dated March 23, 2015, “Modi hits the ‘reset’ button,” we made the point that PM Modi is seeking to engineer three structural resets: (1) shift India’s savings landscape away from gold & land and towards the formal financial system, (2) disrupt the Indian model of crony capitalism model, and (3) redefine India’s subsidy mechanism. The new structure will take some time to become fully operational; hence, the three resets look likely to adversely impact GDP growth in FY16. The short-term pain in GDP growth will be driven by: (1) alterations in the subsidy regime, which will adversely affect rural/semi-urban consumption and construction activity; (2) crony capitalists’ refusal to begin capex activity, as they see reduced scope for supernormal profits under Modi; and (3) Modi’s attack on black money, leading to a crack in land & real estate prices, which will adversely impact lenders’ balance sheets.
Furthermore, in our note dated August 28 (click here for the note) we had highlighted the challenges faced by the macro environment both from rising domestic risks (PM Modi’s three resets, a major real estate slowdown, banking system breakdown and the NDA’s inability to expedite structural reforms) and global risks (a failing Chinese economy likely to lead to further yuan devaluation).
In view of the above-mentioned dynamics, we believe that the GDP growth rate in FY16 will be lower than FY15 (see Exhibit 1 on the right-hand side).
Inflation to average at 4.5% in Fy16
CPI inflation was recorded at an average of 6% YoY in FY15. We expect average inflation to be recorded at ~4.5% YoY in FY16 which implies that whilst CPI inflation is likely to abate in FY16. In terms of the trajectory, we expect CPI inflation to bottom out to an average of ~4% YoY in 2QFY16 and then rise to an average of ~5% YoY in 4QFY16.
Overall, we expect CPI inflation to be recorded at an average of 4.5% YoY in FY16 (see Exhibit 2 on the right-hand side).
Monetary policy implications
In its previous policy review on September 29, the RBI cut the repo rate by 50bps. Whilst we continue to expect the RBI to cut the repo rate by another 25bps over the remaining part of FY16, we do not expect the RBI to administer this rate cut at the next monetary policy review scheduled for December 1, 2015, given that we expect the Fed to administer a rate hike before the end of CY15 and given that the RBI has clearly said that in the immediate term it will focus on ensuring that banks pass on the RBI’s policy rate cuts.
We expect GDP growth in FY16 to be recorded at 6.8% YoY
Source: CEIC, Ambit Capital research
We expect CPI inflation to average at 4.5% YoY in FY16
Source: CEIC, Ambit Capital research
5.1%
6.9%7.3%
6.8%
4%
5%
6%
7%
8%
FY13 FY14 FY15 FY16(E)
Rea
l GD
P g
row
th(Y
oY
cha
ng
e, i
n %
)
2%
3%
4%
5%
6%
1Q
FY16
2Q
FY16
(E)
3Q
FY16
(E)
4Q
FY16
(E)
CPI in
fla
tion
(YoY
ch
an
ge,
in %
)
2QFY16 Results Preview
October 09, 2015 Ambit Capital Pvt. Ltd. Page 8
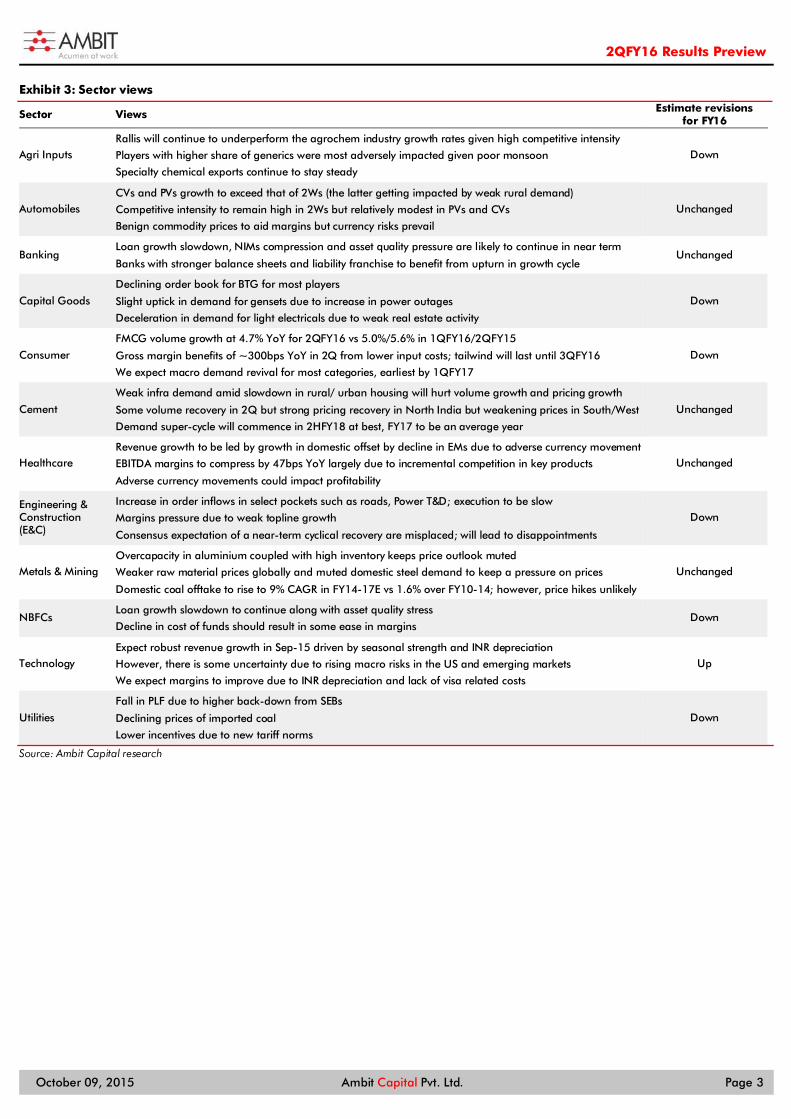
Automobiles The 2QFY16 demand environment mirrored 1QFY16 trends, with medium and heavy commercial vehicles (MHCV) outperforming the two-wheelers (2Ws) and passenger vehicle (PV) categories on a YoY basis. Revenues of all auto companies would likely improve YoY, except Hero MotoCorp (lower volumes) and Tata Motors (muted sales at Jaguar Land Rover/JLR). We expect QoQ improvement in margins for most auto companies on the back of soft commodity prices. However, we expect the QoQ margins of Hero, Maruti and Tata Motors (JLR) to be impacted by lower volumes and weak product mix. The highest YoY improvement in margin would likely be recorded by Ashok Leyland (396bps), Maruti Suzuki (374bps) and Eicher Motors (247bps). Going forward, retail sales demand in the festival season will be a key thing to watch out for. Ashok Leyland is our top BUY for the 2QFY16 results season.
Revenue growth helped by low base: The demand for 2Ws remained subdued on account of weak rural demand (lower than expected monsoons and weak crop prices). On the other hand, MHCVs continue to record healthy growth on the back of a low base, replacement demand from fleet operators and pre-buying due to anti-braking system becoming mandatory wef October 1, 2015. We expect highest revenue growth to be recorded by Ashok Leyland (66% YoY, driven by healthy growth in its volumes), Eicher Motors (41% YoY, due to strong sales at both Royal Enfield and VECV) and Maruti Suzuki (13% YoY, driven by higher volumes). Amongst the auto ancillary stocks, we expect Exide’s revenues to increase 2% YoY and Balkrishna Industries (BKT) to witness a 9% YoY decline in revenues driven by lower volumes. Mahindra CIE would witness a 3% QoQ revenue growth on the back of a improvement in European business.
Margins to witness improvement across most auto/auto ancillary companies: We expect QoQ improvement in the gross margins of most auto companies due to soft commodity prices. However, we except Hero MotoCorp (lower revenues), and Tata Motor’s JLR (impacted by lower volume share from China and lower volumes) margin to show QoQ decline. On a YoY basis, the highest improvement in margin would likely be recorded by Ashok Leyland (396bps, due to operating leverage benefits), Eicher Motors (247bps, due to strong revenue growth) and Maruti Suzuki (374bps, due to favourable currency movement). On the other hand, we expect Tata Motors’ margin to decline by 234bps YoY.
Preparing for the upcoming results We have largely maintained our earnings estimates for the sector. However, we have upgraded our earnings estimates for Ashok Leyland as company continues to surprise on market share front. On the other hand, we have marginally downgraded our volume estimate for Maruti due to weaker than expected export volumes in recent months. For most of the other stocks, whilst we have not changed earnings estimates, the roll forward of the target price date to October 2015 results in around 2-3% valuation upgrades.
Ambit vs consensus Based on the limited consensus data for 2QFY16, our earnings estimates are ahead of consensus for most of the stocks except Bajaj Auto, Hero MotoCorp, Tata Motors, Exide Industries and Balkrishna Industries (where our estimates are below consensus estimates). Our FY16 EPS estimates are ahead of consensus estimates for most of the stocks except Hero MotoCorp, Tata Motors and BKT.
Recommendation We highlight Ashok Leyland as our top BUY idea in the sector. AL faces a strong business outlook due to the MHCV demand revival (24% CAGR over FY15-17) and consequent benefits of operating leverage and improved sales realisation (EBITDA margin to improve to 11.0% in FY16 and 11.2% in FY17 vs 7.6% in FY15).
Stock Performance
(%) 3-month
Absolute Rel to Sensex
Ashok Leyland 28 32
Bajaj Auto (6) (2)
Hero MotoCorp (1) 3
Maruti Suzuki 10 14
Tata Motors (21) (17)
Eicher Motor (7) (3)
Exide Inds Ltd 6 10
Balkrishna Ind. (7) (3)
Mahindra CIE 9 13
Sep’15E Qtrly EPS
(Rs) Ambit Consensus
Ashok Leyland 1.1 0.6
Bajaj Auto 31.3 32.8
Hero MotoCorp 35.1 39.0
Maruti Suzuki 41.5 39.5
Tata Motors 7.4 8.0
Eicher Motor 98.4 84.7
TVS Motor 2.3 2.1
Exide Industries 1.7 1.7
Mahindra CIE 2.1 2.0
Balkrishna Ind. 11.4 13.6
FY16E EPS
(Rs) Ambit Consensus
Ashok Leyland 4.04 3.33
Bajaj Auto 131 130
Hero MotoCorp 150 153
Maruti Suzuki 182 180
Tata Motors 44.0 44.8
Eicher Motors 545 501
TVS Motor 10.6 10.2
Exide Industries 7.56 7.46
Mahindra CIE 10.8 10.1
Balkrishna Ind. 50.6 57.1
Source: Ambit Capital research

2QFY16 Results Preview
October 09, 2015 Ambit Capital Pvt. Ltd. Page 9
Exhibit 4: Detailed Sep'15E quarterly estimates
Company Sep'15E Sep'14 Jun‘15 YoY QoQ Comments
Ashok Leyland
Sales (Rs mn) 53,274 32,177 38,412 66% 39% Volumes (ex-Dost) have increased by 64% YoY and 39% QoQ (including Dost, volumes up 47% YoY and 32% QoQ). Price hikes to further help YoY revenue growth.
EBITDA (Rs mn) 5,990 2,344 3,887 156% 54% Operating leverage benefits from higher volumes and benign raw material prices to drive margin strong expansion. EBITDA margin (%) 11.2% 7.3% 10.1% 396bps 113bps
PBT (Rs mn) 4,480 563 2,349 696% 91% EBITDA margin improvement and moderating interest costs to significantly lift the bottom-line. PAT (Rs mn) 3,226 117 1,593 2653% 102%
Bajaj Auto
Sales (Rs mn) 59,734 59,933 56,559 0% 6% While volumes have been flat YoY, 4% volume growth to drive the QoQ revenue growth
EBITDA (Rs mn) 12,664 12,244 11,821 3% 7% Lower commodity prices and better export realisations (due to INR depreciation relative to US$) to drive margin improvement EBITDA margin (%) 21.2% 20.4% 20.9% 77bps 30bps
PBT (Rs mn) 12,938 12,391 14,980 4% -14% YoY EBITDA trend to reflect at the net earnings level. QoQ earnings impacted by higher other income base in 1QFY16. PAT (Rs mn) 9,057 8,530 10,148 6% -11%
Hero MotoCorp
Sales (Rs mn) 67,001 69,153 69,553 -3% -4% 7% YoY and 4% QoQ decline in volumes lead to de-growth in revenues
EBITDA (Rs mn) 9,764 9,348 10,479 4% -7% EBITDA margin to witness YoY improvement on the back of lower commodity prices EBITDA margin (%) 14.6% 13.5% 15.1% 105bps (49)bps
PBT (Rs mn) 9,729 10,484 10,463 -7% -7% YoY net earnings trend impacted by high ‘other income’ base of 3QFY15 PAT (Rs mn) 7,005 7,634 7,503 -8% -7%
Maruti Suzuki
Sales (Rs mn) 139,565 123,038 134,249 13% 4% Revenue growth led by 10% YoY and 4% QoQ increase in volumes.
EBITDA (Rs mn) 22,470 15,208 21,891 48% 3% Improvement in YoY margin largely driven by favourable currency movement (Yen depreciation vs INR) and operating leverage benefits from higher volumes EBITDA margin (%) 16.1% 12.4% 16.3% 374bps (21)bps
PBT (Rs mn) 17,404 10,805 16,705 61% 4% YoY EBITDA trend to reflect at the net earnings level
PAT (Rs mn) 12,531 8,625 11,929 45% 5%
Tata Motors
Sales (Rs mn) 593,401 605,642 610,195 -2% -3% Muted JLR volumes to impact YoY and QoQ revenue trends
EBITDA (Rs mn) 79,833 95,666 91,088 -17% -12% JLR's margin to witness YoY and QoQ decline on the back of unfavourable geographical mix (lower volume share from China) and weaker product mix EBITDA margin (%) 13.5% 15.8% 14.9% (234)bps (147)bps
PBT (Rs mn) 31,709 56,444 44,754 -44% -29% Net earnings to be further impacted by higher depreciation and tax rates PAT (Rs mn) 23,782 32,805 29,052 -28% -18%
Eicher Motor
Sales (Rs mn) 32,086 22,750 29,167 41% 10% We expect strong volume growth in Eicher’s commercial vehicle and Royal Enfield business to drive robust revenue growth.
EBITDA (Rs mn) 5,097 3,053 4,316 67% 18% Consolidated EBITDA margin uplift driven by strong YoY margin improvement (205bps) at Royal Enfield and commercial vehicle business (142bps). EBITDA margin (%) 15.9% 13.4% 14.8% 247bps 109bps
PBT (Rs mn) 4,394 2,672 3,573 64% 23% Net earnings performance to mirror the EBITDA level performance.
PAT (Rs mn) 2,667 1,650 2,218 62% 20%
TVS Motor
Sales (Rs mn) 27,972 26,831 26,212 4% 7% Despite flat YoY volumes, improvement in realisations (due to higher share of motorcycles/scooters) to drive revenue growth
EBITDA (Rs mn) 1,876 1,627 1,637 15% 15% Margins to improve due to higher volumes/capacity utilisation
EBITDA margin (%) 6.7% 6.1% 6.2% 64bps 46bps
PBT (Rs mn) 1,446 1,313 1,180 10% 23% Net earnings performance to mirror the EBITDA level performance.
PAT (Rs mn) 1,085 948 902 14% 20%
2QFY16 Results Preview
October 09, 2015 Ambit Capital Pvt. Ltd. Page 10
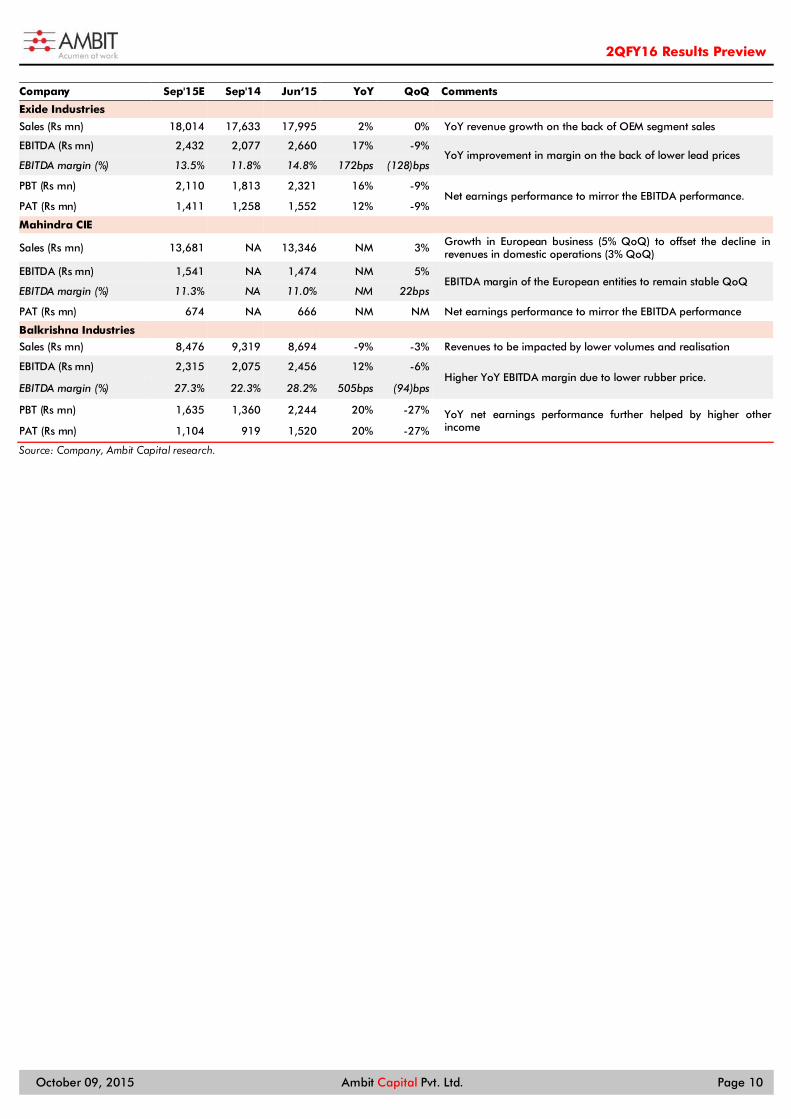
Company Sep'15E Sep'14 Jun‘15 YoY QoQ Comments
Exide Industries
Sales (Rs mn) 18,014 17,633 17,995 2% 0% YoY revenue growth on the back of OEM segment sales
EBITDA (Rs mn) 2,432 2,077 2,660 17% -9% YoY improvement in margin on the back of lower lead prices
EBITDA margin (%) 13.5% 11.8% 14.8% 172bps (128)bps
PBT (Rs mn) 2,110 1,813 2,321 16% -9% Net earnings performance to mirror the EBITDA performance.
PAT (Rs mn) 1,411 1,258 1,552 12% -9%
Mahindra CIE
Sales (Rs mn) 13,681 NA 13,346 NM 3% Growth in European business (5% QoQ) to offset the decline in revenues in domestic operations (3% QoQ)
EBITDA (Rs mn) 1,541 NA 1,474 NM 5% EBITDA margin of the European entities to remain stable QoQ
EBITDA margin (%) 11.3% NA 11.0% NM 22bps
PAT (Rs mn) 674 NA 666 NM NM Net earnings performance to mirror the EBITDA performance
Balkrishna Industries
Sales (Rs mn) 8,476 9,319 8,694 -9% -3% Revenues to be impacted by lower volumes and realisation
EBITDA (Rs mn) 2,315 2,075 2,456 12% -6% Higher YoY EBITDA margin due to lower rubber price.
EBITDA margin (%) 27.3% 22.3% 28.2% 505bps (94)bps
PBT (Rs mn) 1,635 1,360 2,244 20% -27% YoY net earnings performance further helped by higher other income PAT (Rs mn) 1,104 919 1,520 20% -27%
Source: Company, Ambit Capital research.

2QFY16 Results Preview
October 09, 2015 Ambit Capital Pvt. Ltd. Page 11
Exhibit 5: Revisions ahead of earnings season
New Estimates Old Estimates Change
Comments FY16E FY17E FY16E FY17E FY16E FY17E
Bajaj Auto
Recommendation SELL SELL
Whilst we maintain our earnings estimates, upgrades to valuation is driven by roll-forward of DCF target date to October 1, 2016 (vs July 2016 earlier)
TP (Rs) 2,410 2,350 3%
Revenues (Rs mn) 247,928 278,539 247,928 278,539 0% 0%
EBITDA (Rs mn) 52,051 58,478 52,051 58,478 0% 0%
EBITDA margin (%) 21.0% 21.0% 21.0% 21.0% - -
PBT (Rs mn) 54,000 61,279 54,000 61,279 0% 0%
PAT (Rs mn) 37,800 42,895 37,800 42,895 0% 0%
EPS (Rs) 131 148 131 148 0% 0%
Ashok Leyland
Recommendation BUY BUY
We have upgraded the volumes to account for better than expected volume trends in the recent months. This drives revenue, margin and valuation upgrades for Ashok Leyland.
TP (Rs) 105 99 7%
Revenues (Rs mn) 191,003 230,909 185,594 227,867 3% 1%
EBITDA (Rs mn) 20,953 25,943 19,593 25,178 7% 3%
EBITDA margin (%) 11.0% 11.2% 10.6% 11.0% 41 19
PBT (Rs mn) 15,339 20,698 11,608 16,954 32% 22%
PAT (Rs mn) 11,504 15,524 10,484 14,950 10% 4%
EPS (Rs) 4.04 5.45 3.68 5.25 10% 4%
Maruti Suzuki
Recommendation BUY BUY We have marginally downgraded the export volumes for Maruti based on recent monthly trends which has led to revenue and EBITDA downgrades. We have also marginally increased the tax rates. Despite the 3-4% downgrades to earnings estimates, TP remains unchanged due to roll-forward of DCF TP to October 1, 2016 and higher tax rates adequately built in our long term estimates (FY18 onwards).
TP (Rs) 4,750 4,750 0%
Revenues (Rs mn) 584,498 670,231 588,007 674,569 -1% -1%
EBITDA (Rs mn) 93,461 110,588 94,022 111,304 -1% -1%
EBITDA margin (%) 16.0% 16.5% 16.0% 16.5% 0 0
PBT (Rs mn) 74,188 93,028 74,796 93,902 -1% -1%
PAT (Rs mn) 54,899 68,841 56,845 71,365 -3% -4%
EPS (Rs) 182 228 188 236 -3% -4%
TVS Motor
Recommendation SELL SELL
Whilst we maintain our earnings estimates, upgrades to valuation is driven by roll-forward of DCF target date to October 1, 2016 (vs August 2016 earlier)
TP (Rs) 245 240 2%
Revenues (Rs mn) 115,682 135,527 115,682 135,527 0% 0%
EBITDA (Rs mn) 8,246 11,278 8,246 11,278 0% 0%
EBITDA margin (%) 7.1% 8.3% 7.1% 8.3% - -
PBT (Rs mn) 6,733 9,865 6,733 9,865 0% 0%
PAT (Rs mn) 5,050 7,399 5,050 7,399 0% 0%
EPS (Rs) 10.6 15.6 10.6 15.6 0% 0%
Hero MotoCorp
Recommendation SELL SELL
Whilst we maintain our earnings estimates, upgrades to valuation is driven by roll-forward of DCF target date to October 1, 2016 (vs July 2016 earlier)
TP (Rs) 2,500 2,425 3%
Revenues (Rs mn) 293,768 331,291 293,768 331,291 0% 0%
EBITDA (Rs mn) 41,123 46,376 41,123 46,376 0% 0%
EBITDA margin (%) 14.0% 14.0% 14.0% 14.0% - -
PBT (Rs mn) 41,677 46,744 41,677 46,744 0% 0%
PAT (Rs mn) 30,008 33,422 30,008 33,422 0% 0%
EPS (Rs) 150 167 150 167 0% 0%

2QFY16 Results Preview
October 09, 2015 Ambit Capital Pvt. Ltd. Page 12
New Estimates Old Estimates Change
Comments FY16E FY17E FY16E FY17E FY16E FY17E
Eicher Motors
Recommendation SELL SELL
Whilst we maintain our earnings estimates, upgrades to valuation is driven by roll-forward of DCF target date to October 1, 2016 (vs July 2016 earlier)
TP (Rs) 16,500 15,800 4%
Revenues (Rs mn) 167,034 175,827 167,034 175,827 0% 0%
EBITDA (Rs mn) 25,985 29,101 25,985 29,101 0% 0%
EBITDA margin (%) 15.6% 16.6% 15.6% 16.6% - -
PBT (Rs mn) 23,811 27,359 23,811 27,359 0% 0%
PAT (Rs mn) 14,827 16,696 14,827 16,696 0% 0%
EPS (Rs) 545 613 545 613 0% 0%
Source: Company, Ambit Capital research

2QFY16 Results Preview
October 09, 2015 Ambit Capital Pvt. Ltd. Page 13
Agri Inputs/Chemicals Agri input players are likely to have a muted quarter driven by weak demand in the domestic and exports markets. On the domestic side, weak monsoons (14% below normal) have put pressure on agrochemical offtake. Globally too, weak weather patterns and low commodity prices have impacted overall demand. We continue to expect PI and SRF to outperform their peers led by their competitive strengths in specialty chemicals exports. In domestic agrochem, we expect PI to perform well vs peers, delivering 12% revenue growth; Rallis will continue underperforming, with flat sales in the domestic and international business. We expect margin expansion for PI, SRF, and Rallis, driving earnings growth of 22%, 53% and 2% respectively. We will watch out for the growth outlook and balance sheet management amidst a weaker operating environment in the quarterly management commentary. North resilient but south and west India on a weak footing Our channel checks across India suggest a cocktail of problems: (a) poor rains and weaker profitability impacting farmer sentiments; (b) weak infestation of insects and other plant diseases due to an unfavourable climate (humidity and sporadic rains); (c) drop in pricing on some fast-selling technicals (Acephate, Cypermethrin, Chloropyriphos, Prophenophos, Imidacloropid, Fipronil, and Dichlorophos) due to drop in global demand/weakened crude prices, leading to MTM losses on inventory; and (d) heightened aggression amongst generic players amidst a weak monsoon. Players with a higher share of novelty products/branded products are able to combat such pressures to a certain extent. North has done better than south and west Our agri channel checks seem to suggest that north India has relatively performed better partly driven by good irrigation facilities; however, the upcoming Rabi season will face pressure from lower reservoir levels. North India in particular was infested with white flies which helped products such as Ulala (from UPL). Mancozeb (one of the big generic molecules for UPL) has seen a sharp jump in realisations, combating the trend seen in generics. Of late, the incidence of BPH (brown plant hopper) insects in rice has been high, leading to better agrochemical offtake (favourable for Osheen – an insecticide from PI). Weak demand in west India (Gujarat, Maharashtra), Madhya Pradesh and integrated Andhra Pradesh (Telangana and Seemandhra) was led by pressure on farmer profitability. Commodity pricing (soybean and cotton) was weak and farmer sentiments to invest were also poor given the lower rainfall. Players focused on generics have also faced the ire of falling technical prices. International business facing challenges from weak environment International business offtake for generic exporters, such as Rallis and Insecticides India, has been weak amidst a cocktail of weakening currencies, lower commodity prices and crash in technical prices. Agrochem demand for Maize and Soybean has declined given weaker maize/soybean demand, as lower crude prices have reduced ethanol requirements for blending. We see some impact from these issues on PI (CSM business) and SRF (Fluorospecialty chemicals). However, on an absolute basis, we still expect them to deliver 20-25% YoY revenue growth. Balance sheet issues likely to be crucial The third continued bad season (Kharif 2014, Rabi 2014-15 and Kharif 2015) is also likely to put pressure on companies with higher receivable days. Our channel checks suggest much lower secondary offtake than primary sales. As a result, we see pressure from both inventory and receivables. Sales growth needs to be seen in conjunction with WC deterioration for agrochem companies. Amongst prominent agrochem companies, Insecticides India and Dhanuka Agritech have the longest working capital cycles and they may be impacted the most. Rallis too had been relaxing its working capital norms, which needs to be watched out for.
Stock Performance
(%) 3-month
Absolute Rel to Sensex
PI Industries -3 1
Rallis India -13 -8
SRF Ltd -6 -1
Sep’15E Qtrly EPS
(Rs) Ambit Consensus
PI Industries 4.3 4.3
Rallis India 4.15 8.1
SRF Ltd 20.5 DNA
FY16E EPS
(Rs) Ambit Consensus
PI Industries 21.8 22.0
Rallis India 9.2 9.5
SRF Ltd 79.6 76.9

2QFY16 Results Preview
October 09, 2015 Ambit Capital Pvt. Ltd. Page 14
PI – CSM growth likely to sustain; domestic business to remain steady We expect PI to report robust growth of 17% led by 22% growth in the CSM business and 12% growth in the domestic business. CSM business growth would be led by continued execution of high order book of US$600mn (3.2x last 12 month revenues) and marginal benefit from a softer base in the corresponding quarter in the previous year. Domestic business growth is likely to be ~12% driven by good growth in Nominee Gold and good traction on Keefun. We expect a ~200bps expansion in EBITDA margins primarily led by: (a) higher share of CSM business and (b) operating leverage due to higher revenue base. PI’s management has historically maintained that it is able to pass on any impact of RM/forex fluctuations to clients. SRF – Chemicals and packaging to drive healthy earnings growth We expect SRF to deliver 17% topline growth primarily led by 25% growth in chemicals and 10% growth each in the technical textiles and packaging films business. We expect growth in chemicals to be led by higher exports in R134a, better realisations for R22, and 25% growth in the specialty chemicals business. We expect EBITDA margin expansion of 260bps led by: (a) positive mix impact from the higher-margin chemicals business and (b) improving profitability of technical textiles and packaging films business. Rallis – Expect a weak quarter We expect Rallis to report flat sales growth in both the domestic and exports agrochem business. Our channel checks continue to suggest negative impact on the generic segment through: (a) significant price erosion for most generic technical (b) aggressive trade margins and credit period by relatively unorganised players and topline focused players. Such players have been very aggressive with their product placements, sales incentives, dealer credits, product packaging etc., which could create pressure on sales of the erstwhile leaders such as Rallis. On exports, challenges in Europe and Latin America are pretty evident. The drought situation in Australia is also grave. On Metahelix we build in 25% growth for 2Q, leading to overall consolidated sales growth of ~2%. We believe 100bps of margin expansion (led by lower technical prices) which would drive EBITDA growth of 8%. Growth looks high primarily because of a softer base. We expect PAT growth of 2% due to higher depreciation charges and lower tax rates in base quarter. Other non-covered players Dhanuka would likely report flat sales growth along with some compression in overall margins due to weaker demand for soybean herbicides. Insecticides India would pressure on both domestic and exports due to lower technical prices and lower demand offtake. UPL will benefit from good performance of Ulala and realisation jump in Mancozeb. Monsanto India will continue to witness pressure from lower glyphosate demand and weaker demand for high-priced corn seed products. Kaveri will also see decline in sales due to poor outlook for cotton and corn. Margins for Kaveri will be impacted due to royalty issues. PI Industries – BUY; SRF – BUY; Rallis – SELL We continue to hold on to our conviction on PI to deliver 30% EPS CAGR over FY15-17E. Our belief of 26% FY15-17E CSM growth (vs the management’s conservative guidance of 20%) is premised on the following: (a) healthy order book growth of 38% YoY in 1QFY16 to US$600mn (3.2x last 12-month revenues), (b) on-track commissioning of two plants in Jambusar, for which capacities are tied up, and (c) improvement in farmer sentiments globally post a difficult CY14/CY15. In the domestic business, we are building in FY15-17E revenue CAGR of 15% (vs 21% CAGR over FY10-15) driven by the base portfolio and continued strength in new launches. We are also building in 150bps of margin expansion over FY15-FY17E, with mix improvement and operating efficiencies. We retain our BUY stance with a TP of Rs800, implying 26x FY17E multiples.

2QFY16 Results Preview
October 09, 2015 Ambit Capital Pvt. Ltd. Page 15
SRF is set to benefit from three positive catalysts—(a) Refrigerants business is witnessing better realisations in R22 (led by volume cuts as per Montreal protocol) and export-led volume uptick in R134a; (b)improving profitability in packaging/technical textiles due to improving realisations/efficiencies; and (c) incremental revenues from new plant additions in the specialty chemicals business. Change in estimates We cut our EPS estimates for PI by 4%/6% for FY16/17. Despite rolling forward, our TP reduces to Rs800 from Rs825, implying an earnings multiple of 26xFY17 EPS. We downgrade SRF revenue growth marginally by 1% for FY16 and FY17. Our TP of Rs1,500 does not change as we roll forward our earnings estimates, implying 15x FY17E earnings. We roll forward our earnings for Rallis and our new target price or Rs180 implies 17x FY17E EPS.
Key things to watch out for: (a) Commentary for domestic agrochemicals growth in FY16; (b) channel inventory and receivable levels; (c) export situation given slowdown in agri businesses.

2QFY16 Results Preview
October 09, 2015 Ambit Capital Pvt. Ltd. Page 16
Exhibit 6: Detailed Sept’15 quarterly estimates
Rs mn Sep'15 Sep'14 Jun''15 YoY QoQ Comments
Rallis India
Standalone (Rs mn) 5,784 5,784 2,440 0% 137% We expect standalone business growth to remain flat driven by similar growth rates in domestic and international business.
Metahelix (Rs mn) 720 576 2,209 25% -67% We expect Metahelix to continue doing well, with 25% YoY growth during the quarter
Sales (Rs mn) 6,563 6,419 4,683 2% 40% We expect overall sales growth of 2% primarily led by Metahelix.
EBITDA (Rs mn) 1,315 1,219 565 8% 133%
EBITDA Margin 20.0% 19.0% 12.1% 104bps 797bps
On margins, we expect some improvement driven by lower technical prices supporting standalone margins. We do not build in much improvement in Metahelix margins
PBT (Rs mn) 1,133 1,075 (28) 5% -4162%
PAT (Rs mn) 747 734 331 2% 126% PAT growth is muted at 2% due to poor sales growth
PI Industries
Domestic (Rs mn) 2,426 2,166 2,717 12% -11% We expect domestic business growth of 12%
CSM (Rs mn) 2,561 2,099 2,825 22% -9% On the CSM business, we believe strong growth rates to continue leading to 22% growth in CSM for FY16
Sales (Rs mn) 4,998 4,266 5,548 17% -10% We expect sales growth to be good led by strong performance in both domestic and exports business
EBITDA (Rs mn) 955 726 1,358 31% -30%
EBITDA Margin 19% 17% 24% 207 bps -538 bps We expect margins to improve driven by higher share of high-margin CSM business and operating leverage
PBT (Rs mn) 891 717 1,302 24% -32%
PAT (Rs mn) 597 490 873 22% -32% PAT growth of 22% driven by strong sales growth and steady margin expansion
SRF Ltd.
Technical Textiles Business 4,781 4,346 4,042 10% 18%
Chemicals & Polymers Business 3,995 3,196 3,798 25% 5% We expect the chemicals business to grow @25% due to a larger base effect.
Packaging Films 1,939 1,762 1,851 10% 5%
Sales (Rs mn) 10,714 9,169 9,522 17% 13%
EBITDA (Rs mn) 2,463 1,869 2,293 32% 7% We expect the overall EBITDA margin to improve as operating leverage kicks in and the packaging films improving realisations
EBITDA margin (%) 23.0% 20.4% 24.1% 261 bps -109 bps Increase in EBITDA margins due to improvement in realisations of Packaging films and operating leverage in the Chemicals segment.
PBT (Rs mn) 1,679 1,092 1,653 54% 2%
Adjusted PAT (Rs mn) 1,175 769 1,211 53% -3% We expect the PAT to grow around 53% on a YoY basis due to a low base effect
Source: Company, Ambit Capital research

2QFY16 Results Preview
October 09, 2015 Ambit Capital Pvt. Ltd. Page 17
Exhibit 7: Revisions ahead of earnings season
New Estimates Old Estimates Change
Comments FY16E FY17E FY16E FY17E FY16E FY17E
PI Industries Recommendation BUY BUY TP (Rs) 800 825 -3% We have brought down our domestic
business growth estimates from 18% earlier to 12%. Accordingly our margins are also adjusted by 40-80bps for FY16/FY17 driven by lower operating leverage. Our TP is revised to Rs 800 vs Rs 825 earlier due to ~5% cut in earnings
Revenues (Rs mn) 22,639 28,405 23,506 29,384 -4% -3%
EBITDA (Rs mn) 4,433 5,964 4,691 6,399 -6% -7%
EBITDA margin (%) 20% 21% 20% 22% -38 bps -78 bps
PBT (Rs mn) 4113 5629 4,291 5,981 -4% -6%
PAT (Rs mn) 2,961 4,165 3,090 4,426 -4% -6%
EPS (Rs) 22 31 23 33 -4% -6%
SRF Recommendation BUY BUY TP (Rs) 1,500 1,500 0%
We have brought down our specialty chemicals growth estimates from 30% to 25% for FY16. Our TP remains the same due to roll forward.
Revenues (Rs mn) 49,979 55,467 50,278 55,871 -1% -1%
EBITDA (Rs mn) 10,380 12,183 10,457 12,296 -1% -1%
EBITDA margin (%) 21% 22% 21% 22% -3 bps -4 bps
PBT (Rs mn) 6,350 8,081 6,428 8,194 -1% -1%
PAT (Rs mn) 4,572 5,737 4,628 5,817 -1% -1%
EPS (Rs) 80 100 81 101 -1% -1%
Rallis Recommendation SELL SELL TP (Rs) 180 170 6%
Our target price is upgraded by 6% due to earnings roll forward
Revenues (Rs mn) 20,352 22,981 20,374 23,007 0% 0%
EBITDA (Rs mn) 3,122 3,573 3,119 3,569 0% 0%
EBITDA margin (%) 15.3% 15.5% 15.3% 15.5% -3 bps -4 bps
PBT (Rs mn) 2,532 2,948 2,551 2,967 -1% -1%
PAT (Rs mn) 1,823 2,123 1,802 2,094 1% 1%
EPS (Rs) 9.2 10.7 9.3 10.8 -1% -1%
Source: Company, Ambit Capital research

2QFY16 Results Preview
October 09, 2015 Ambit Capital Pvt. Ltd. Page 18
Banking The 2QFY16 results for the banking sector are likely to remain muted, with slowing balance sheet growth, NIM pressure and elevated credit costs. Credit growth would stay muted (~9-10% for the entire banking system), as corporate loan demand has failed to improve. Low growth is resulting in intensifying competition on pricing amongst banks to sustain market share, which coupled with base rate cuts during the quarter would lead to NIM compression. Credit costs would remain higher, as slippages from restructured assets to NPAs plus fresh NPAs addtions remain elevated. Overall, we estimate net profit growth of 8% YoY (vs 2% decline in 1QFY16) for banks in our coverage universe during the quarter, with private sector banks growing profits at 14% YoY. Our top picks are Axis Bank and IndusInd Bank. We are negative on most PSU banks, as we believe elevated credit costs and weak operating performance would keep their financial performance subdued.
Credit growth stays muted: RBI data shows muted system-level loan growth of ~9.6% as at end-September 2015. Corporate credit growth has been muted due to weak demand, corporates opting for bond market, wherever possible, and asset quality stress faced by banks for such loans. PSU banks would grow slower than the system and new private sector banks on average should grow at ~18%. Overall, we expect loan growth of 9% during the quarter for banks under our coverage.
NIMs to come under pressure: Full impact of base rate cuts in 1QFY16, further base rate cuts in 2QFY16 and slow loan growth pressuring yields will lead to margin pressure for banks across the board, except for a few. Overall, for banks under our coverage, we do not expect any revival in income growth and we build in NII growth of ~7% YoY, slowing from 9-11% NII growth seen in the last three quarters.
Asset quality stress unlikely to ease: Credit costs would remain higher, as a combined impact of fresh formation of NPAs, restructured loans slipping to NPAs and incremental provisions on aging NPAs. PSU banks with large restructured books and low provision coverage are at a particular disadvantage.
Treasury gains to cushion the earnings: With bond yields easing by ~35bps during the quarter, banks are likely to partly utilise treasury gains in 2Q to offset profitability pressure, the way they did in FY15. With bond yields falling by ~90-120bps during FY15, treasury gains had contributed to 15% of banks’ PBT during FY15 (FY14: 5%).
Cost lever pushed to the hilt: Amidst a weak income growth environment, banks, particularly private sector banks, have tightly controlled their operating expenses. Whilst this is likely to continue, further improvement appears difficult and resumption in growth would increasingly become critical to support earnings growth. The cost-to-income ratio for new private sector banks, having improved from 46% in FY12 to 42% in FY15, is expected to be at 44% in 2QFY16 vs 45% in 2QFY15.
Preparing for the upcoming results We highlight trends in slippage from the pool of restructured loans to NPLs, NIMs and loan mix trends for various set of banks as key variables to monitor during the quarter.
Ambit vs consensus Whilst our earnings estimates for the quarter are ~5% lower than consensus estimates, our earnings estimates for FY16 and FY17 are ~5-10% below consensus. The divergence is predominantly driven by weaker loan book growth forecasts, NIM pressure and our higher slippage assumptions and weaker upgrades/recovery forecasts.
Stock Performance
(%) 3-month
Absolute Rel to Sensex
HDFC Bank 1 4
ICICI Bank (9) (6)
Axis Bank (15) (12)
Kotak Mahindra Bk. (8) (5)
IndusInd Bk. 6 9
State Bk. of India (9) (6)
Bank of Baroda 23 26
Punjab National Bk. (2) 1
Bank of India (19) (16)
Union Bk. of India 15 18
Federal Bank (14) (11)
Karur Vysya Bk. (8) (5)
City Union Bank (11) (8)
South Indian Bk. (7) (4)
FY16E EPS
(Rs) Ambit Consensus
HDFC Bank 48.2 50.1
ICICI Bank 20.6 21.7
Axis Bank 34.1 36.7
Kotak Mahindra Bk. 22.1 21.2
IndusInd Bk. 38.9 41.1
State Bk. of India 17.7 21.3
Bank of Baroda 21.4 20.3
Punjab National Bk. 20.1 20.6
Bank of India 16.8 25.7
Union Bk. of India 34.1 33.8
Federal Bank 5.5 6.1
Karur Vysya Bk. 42.4 45.0
City Union Bank 7.3 7.7
South Indian Bk. 3.2 3.0
Sept'15E Quarterly PAT
(Rs mn) Ambit Consensus
HDFC Bank 29,339 27,316
ICICI Bank 28,637 29,168
Axis Bank 19,381 19,438
Kotak Mahindra Bk. 6,159 5,844
IndusInd Bk. 5,350 5,127
State Bk. of India 31,331 34,087
Bank of Baroda 9,652 9,000
Punjab National Bk. 9,360 8,671
Bank of India 3,008 3,568
Union Bk. of India 5,688 4,959
Federal Bank 2,327 2,406
Karur Vysya Bk. 1,226 1,216
City Union Bank 1,035 1,056
South Indian Bk. 812 843

2QFY16 Results Preview
October 09, 2015 Ambit Capital Pvt. Ltd. Page 19
Recommendation
Consolidated net profit for banks in our coverage universe is likely to grow by 8% YoY, compared to a decline of 2% in 1QFY16. Consolidated RoAs are likely to be ~0.92% (down 4bps YoY, up 7bps QoQ). New private sector banks are likely to deliver an average RoA of 1.7% vs PSU banks’ ~0.5%. We are BUYers of Axis Bank (AXSB IN, US$18.0bn, TP `690, 40% upside) and IndusInd Bank (IIB IN, US$8.6bn, TP `1,075, 14% upside). We are SELLers on most PSU banks, as we believe the elevated credit costs and weak operating performance would keep financial performance subdued. We are SELLers on HDFC Bank (HDFCB IN, US$41.9bn, TP `1,045, 3% downside) and Kotak Mahindra Bank (KMB IN, US$18.4bn, TP `515, 21% downside) due to their expensive valuations and the market’s lofty earnings expectations, which these companies would find difficult to meet.
Exhibit 8: Detailed Sept'15E quarterly estimates
Sep'15 Sep'14 Jun'15 YoY QoQ Comment
HDFC Bank
Net Interest Income (Rs mn) 67,663 55,110 63,888 23% 6%
Growth in PAT is in line with growth in assets
Operating Profit (Rs mn) 51,101 40,602 48,499 26% 5%
Cost to income (%) 44.8% 46.3% 45.2% PBT (Rs mn) 44,386 36,043 41,219 23% 8%
PAT (Rs mn) 29,339 23,815 26,957 23% 9%
ICICI Bank
Net Interest Income (Rs mn) 52,801 46,566 51,151 13% 3%
Higher provisions to result in muted net profit growth
Operating Profit (Rs mn) 52,596 46,979 50,378 12% 4%
Cost to income (%) 36.2% 36.5% 37.8% PBT (Rs mn) 40,910 38,484 40,824 6% 0%
PAT (Rs mn) 28,637 27,090 29,762 6% -4%
Axis Bank
Net Interest Income (Rs mn) 42,179 35,249 40,562 20% 4%
We expect PAT growth of 20% in-line with loans growth. Credit costs to be broadly unchanged at 122bps.
Operating Profit (Rs mn) 37,928 31,623 40,921 20% -7%
Cost to income (%) 40.0% 42.2% 35.6% PBT (Rs mn) 29,144 24,373 29,703 20% -2%
PAT (Rs mn) 19,381 16,107 19,784 20% -2%
Kotak Mahindra Bank
Net Interest Income (Rs mn) 17,467 10,389 15,982 68% 9%
YoY earnings growth is entirely driven by kicker from acquisition of ING Vysya Bank. On a pro-forma basis (KMB+ING), earnings would be down 1% YoY due to pressure on fee income and credit cost.
Operating Profit (Rs mn) 11,146 7,336 5,970 52% 87%
Cost to income (%) 52.9% 51.3% 72.7% PBT (Rs mn) 9,332 6,800 2,917 37% 220%
PAT (Rs mn) - standalone 6,159 4,445 1,898 39% 225%
IndusInd Bank
Net Interest Income (Rs mn) 10,304 8,331 9,807 24% 5%
Stronger operating profit growth (30% YoY) to support PAT growth of 24% YoY.
Operating Profit (Rs mn) 9,434 7,247 9,227 30% 2%
Cost to income (%) 46.4% 47.9% 45.9% PBT (Rs mn) 8,046 6,515 7,994 24% 1%
PAT (Rs mn) 5,350 4,302 5,250 24% 2%

2QFY16 Results Preview
October 09, 2015 Ambit Capital Pvt. Ltd. Page 20
Sep'15 Sep'14 Jun'15 YoY QoQ Comment
State Bank of India
Net Interest Income (Rs mn) 136,614 132,746 137,320 3% -1%
Expect muted NIM and elevated credit cost.
Operating Profit (Rs mn) 89,942 84,219 92,021 7% -2%
Cost to income (%) 53.2% 52.8% 51.1% PBT (Rs mn) 44,758 41,469 52,024 8% -14%
PAT (Rs mn) 31,331 31,004 36,924 1% -15%
Bank of Baroda
Net Interest Income (Rs mn) 32,861 34,011 34,596 -3% -5%
Elevated credit cost to limit RoAs at 0.55%
Operating Profit (Rs mn) 21,302 24,029 22,020 -11% -3%
Cost to income (%) 50.9% 45.3% 50.3% PBT (Rs mn) 13,594 15,149 16,022 -10% -15%
PAT (Rs mn) 9,652 11,042 10,522 -13% -8%
Punjab National Bank
Net Interest Income (Rs mn) 40,272 42,542 41,765 -5% -4%
Muted loan growth (7% YoY), NIM compression and elevated credit costs to lead to RoAs of 0.6%.
Operating Profit (Rs mn) 29,591 28,760 31,321 3% -6%
Cost to income (%) 44.9% 49.6% 43.1% PBT (Rs mn) 14,076 11,081 13,207 27% 7%
PAT (Rs mn) 9,360 5,753 7,207 63% 30%
Bank of India
Net Interest Income (Rs mn) 29,167 30,307 29,127 -4% 0%
Muted loan growth (1% YoY) and elevated provision, including unamortised provisions sitting on balance sheet, to lead to RoAs of just 0.2 %.
Operating Profit (Rs mn) 17,759 21,355 17,042 -17% 4%
Cost to income (%) 53.9% 47.1% 54.6% PBT (Rs mn) 3,760 11,721 1,895 -68% 98%
PAT (Rs mn) 3,008 7,860 1,297 -62% 132%
Union Bank of India
Net Interest Income (Rs mn) 22,233 20,844 21,302 7% 4%
Muted loan growth (6% YoY), NIM compression and elevated credit costs to lead to RoAs of 0.6%.
Operating Profit (Rs mn) 15,728 13,339 14,882 18% 6%
Cost to income (%) 48.7% 53.9% 48.9% PBT (Rs mn) 8,553 5,485 8,458 56% 1%
PAT (Rs mn) 5,688 3,713 5,188 53% 10%
Federal Bank
Net Interest Income (Rs mn) 6,694 6,058 6,048 10% 11%
Expect muted operating profit (up 2% YoY) and eleavted credit costs .
Operating Profit (Rs mn) 4,321 4,098 3,672 5% 18%
Cost to income (%) 50.9% 48.9% 54.0% PBT (Rs mn) 3,526 3,641 2,141 -3% 65%
PAT (Rs mn) 2,327 2,403 1,414 -3% 65%
Karur Vysya Bank
Net Interest Income (Rs mn) 4,283 3,374 4,231 27% 1%
We expect some recovery in margins but muted loan growth and elevated credit costs to keep RoAs subdued at 0.9%.
Operating Profit (Rs mn) 2,979 2,071 2,957 44% 1%
Cost to income (%) 48.7% 56.2% 49.5% PBT (Rs mn) 1,844 1,140 1,781 62% 4%
PAT (Rs mn) 1,226 905 1,346 35% -9%

2QFY16 Results Preview
October 09, 2015 Ambit Capital Pvt. Ltd. Page 21
Sep'15 Sep'14 Jun'15 YoY QoQ Comment
City Union Bank
Net Interest Income (Rs mn) 2,294 2,062 2,236 11% 3%
Loan growth is likely to remain muted but superior margins to protect profitability at ~1.5%.
Operating Profit (Rs mn) 1,953 1,728 1,972 13% -1%
Cost to income (%) 39.8% 41.7% 40.0% PBT (Rs mn) 1,380 1,182 1,521 17% -9%
PAT (Rs mn) 1,035 937 1,116 10% -7%
South Indian Bank
Net Interest Income (Rs mn) 3,524 3,584 3,403 -2% 4%
Elevated cost to income ratio and provisions to lead to muted RoAs of 0.5%.
Operating Profit (Rs mn) 1,954 2,110 1,809 -7% 8%
Cost to income (%) 57.7% 53.3% 59.3% PBT (Rs mn) 1,194 1,152 1,014 4% 18%
PAT (Rs mn) 812 763 653 6% 24%
Source: Company, Ambit Capital research
Exhibit 9: Revisions ahead of earnings season
New Estimates Old Estimates Change
Comments FY16E FY17E FY16E FY17E FY16E FY17E
HDFC Bank Recommendation SELL SELL
TP (Rs) 1,045 990 Net interest income (Rs mn) 262,996 308,716 262,996 308,716 0% 0%
Roll forward leads to a minor upgrade in our target price.
Operating profit (Rs mn) 204,818 246,875 204,818 246,875 0% 0%
Cost to income (%) 44.0% 42.8% 44.0% 42.8% PBT (Rs mn) 181,664 217,873 181,664 217,873 0% 0%
PAT (Rs mn) 120,807 144,885 120,807 144,885 0% 0%
EPS (Rs) 48.2 57.8 48.2 57.8 0% 0%
ICICI Bank Recommendation SELL SELL TP (Rs) 290 280 Net interest income (Rs mn) 214,717 249,218 214,717 249,218 0% 0%
Roll forward leads to a minor upgrade in our target price.
Operating profit (Rs mn) 218,103 253,743 218,103 253,743 0% 0%
Cost to income (%) 37.2% 37.2% 37.2% 37.2% PBT (Rs mn) 169,886 192,505 169,886 192,505 0% 0%
PAT (Rs mn) 119,260 135,139 119,260 135,139 0% 0%
EPS (Rs) 20.6 23.3 20.6 23.3 0% 0%
Axis Bank Recommendation BUY BUY
TP (Rs) 690 665 Net interest income (Rs mn) 169,622 198,037 169,622 198,037 0% 0%
Roll forward leads to a minor upgrade in our target price.
Operating profit (Rs mn) 150,217 176,102 150,217 176,102 0% 0%
Cost to income (%) 41.6% 41.6% 41.6% 41.6% PBT (Rs mn) 119,757 147,963 119,757 147,963 0% 0%
PAT (Rs mn) 80,836 99,875 80,836 99,875 0% 0%
EPS (Rs) 34.1 42.1 34.1 42.1 0% 0%

2QFY16 Results Preview
October 09, 2015 Ambit Capital Pvt. Ltd. Page 22
New Estimates Old Estimates Change
Comments FY16E FY17E FY16E FY17E FY16E FY17E
Kotak Mahindra Bank Recommendation SELL SELL TP (Rs) 515 498 Net interest income (Rs mn) 73,581 85,385 73,581 85,385 0% 0%
Roll forward leads to a minor upgrade in our target price.
Operating profit (Rs mn) 48,416 56,678 48,416 56,678 0% 0%
Cost to income (%) 54.5% 54.4% 54.5% 54.4% PBT (Rs mn) 39,101 49,102 39,101 49,102 0% 0%
PAT (Rs mn) - standalone 26,589 33,389 26,589 33,389 0% 0%
PAT (Rs mn) - consolidated 44,530 52,635 43,602 51,600 2% 2%
EPS (Rs) - consolidated 48.9 57.8 47.9 56.6 2% 2%
IndusInd Bank Recommendation BUY BUY TP (Rs) 1075 1,030 Net interest income (Rs mn) 43,353 55,371 43,483 55,485 0% 0%
Incorporating the impact of the just completed QIP
Operating profit (Rs mn) 39,919 51,239 39,726 51,150 0% 0%
Cost to income (%) 45.7% 44.8% 46.0% 45.0% PBT (Rs mn) 34,183 44,522 34,062 44,527 0% 0%
PAT (Rs mn) 22,903 29,830 22,822 29,833 0% 0%
EPS (Rs) 38.9 50.6 38.7 50.6 0% 0%
State Bank of India Recommendation SELL SELL TP (Rs) 235 235 Net interest income (Rs mn) 576,591 640,601 576,591 640,601 0% 0%
Our 28 September note on SBI covered the change in estimate and valuation
Operating profit (Rs mn) 410,559 470,769 410,559 470,769 0% 0%
Cost to income (%) 50.2% 49.1% 50.2% 49.1% PBT (Rs mn) 194,383 238,128 194,383 238,128 0% 0%
PAT (Rs mn) 132,180 161,927 132,180 161,927 0% 0%
EPS (Rs) 17.7 21.7 17.7 21.7 0% 0%
Bank of Baroda Recommendation BUY BUY TP (Rs) 215 210 Net interest income (Rs mn) 148,956 167,326 148,026 168,204 1% -1%
Roll forward leads to a minor upgrade in our target price.
Operating profit (Rs mn) 106,605 120,519 105,675 121,397 1% -1%
Cost to income (%) 44.9% 45.1% 45.1% 44.9% PBT (Rs mn) 64,991 76,810 64,060 77,068 1% 0%
PAT (Rs mn) 47,443 56,071 46,764 56,259 1% 0%
EPS (Rs) 21.4 25.3 21.1 25.4 1% 0%
Punjab National Bank Recommendation SELL SELL TP (Rs) 140 138 Net interest income (Rs mn) 188,224 216,719 185,759 215,118 1% 1%
Roll forward leads to a minor upgrade in our target price.
Operating profit (Rs mn) 132,943 155,564 130,479 153,962 2% 1%
Cost to income (%) 44.7% 43.3% 45.2% 43.6% PBT (Rs mn) 53,896 68,304 51,432 66,702 5% 2%
PAT (Rs mn) 37,188 47,130 35,488 46,025 5% 2%
EPS (Rs) 20.1 25.4 19.1 24.8 5% 2%

2QFY16 Results Preview
October 09, 2015 Ambit Capital Pvt. Ltd. Page 23
New Estimates Old Estimates Change
Comments FY16E FY17E FY16E FY17E FY16E FY17E
Bank of India Recommendation SELL SELL TP (Rs) 150 145 Net interest income (Rs mn) 124,601 133,006 124,299 133,476 0% 0%
Roll forward leads to a minor upgrade in our target price.
Operating profit (Rs mn) 80,540 80,967 80,238 81,437 0% -1%
Cost to income (%) 51.6% 54.7% 51.7% 54.5% PBT (Rs mn) 13,530 25,966 13,228 26,436 2% -2%
PAT (Rs mn) 10,824 20,773 10,582 21,149 2% -2%
EPS (Rs) 16.8 31.2 16.5 31.8 2% -2%
Union Bank of India Recommendation SELL SELL TP (Rs) 150 147 Net interest income (Rs mn) 95,361 109,554 95,362 109,555 0% 0%
Roll forward leads to a minor upgrade in our target price.
Operating profit (Rs mn) 67,774 76,858 67,775 76,858 0% 0%
Cost to income (%) 49.0% 49.0% 49.0% 49.0% PBT (Rs mn) 32,289 41,109 32,290 41,110 0% 0%
PAT (Rs mn) 21,472 27,338 21,473 27,338 0% 0%
EPS (Rs) 34.1 43.0 34.1 43.0 0% 0%
Federal Bank Recommendation SELL SELL TP (Rs) 70 68 Net interest income (Rs mn) 26,819 31,473 26,819 31,473 0% 0%
Roll forward leads to a minor upgrade in our target price.
Operating profit (Rs mn) 17,734 20,967 17,734 20,967 0% 0%
Cost to income (%) 50.7% 49.7% 50.7% 49.7% PBT (Rs mn) 14,296 17,848 14,296 17,848 0% 0%
PAT (Rs mn) 9,436 11,780 9,436 11,780 0% 0%
EPS (Rs) 5.5 6.9 5.5 6.9 0% 0%
Karur Vysya Bank Recommendation SELL SELL TP (Rs) 430 415 Net interest income (Rs mn) 16,718 18,116 16,718 18,116 0% 0%
Roll forward leads to a minor upgrade in our target price.
Operating profit (Rs mn) 11,396 12,350 11,396 12,350 0% 0%
Cost to income (%) 51.2% 52.2% 51.2% 52.2% PBT (Rs mn) 6,876 7,856 6,876 7,856 0% 0%
PAT (Rs mn) 5,157 5,892 5,157 5,892 0% 0%
EPS (Rs) 42.4 48.4 42.4 48.4 0% 0%
City Union Bank Recommendation BUY BUY TP (Rs) 115 115 Net interest income (Rs mn) 9,186 10,660 9,186 10,660 0% 0%
No change in estimates and valuation.
Operating profit (Rs mn) 7,845 9,012 7,822 8,983 0% 0%
Cost to income (%) 42.8% 43.1% 42.9% 43.2% PBT (Rs mn) 5,598 6,696 5,575 6,667 0% 0%
PAT (Rs mn) 4,366 5,223 4,348 5,200 0% 0%
EPS (Rs) 7.3 8.8 7.3 8.7 0% 0%
2QFY16 Results Preview
October 09, 2015 Ambit Capital Pvt. Ltd. Page 24
New Estimates Old Estimates Change
Comments FY16E FY17E FY16E FY17E FY16E FY17E
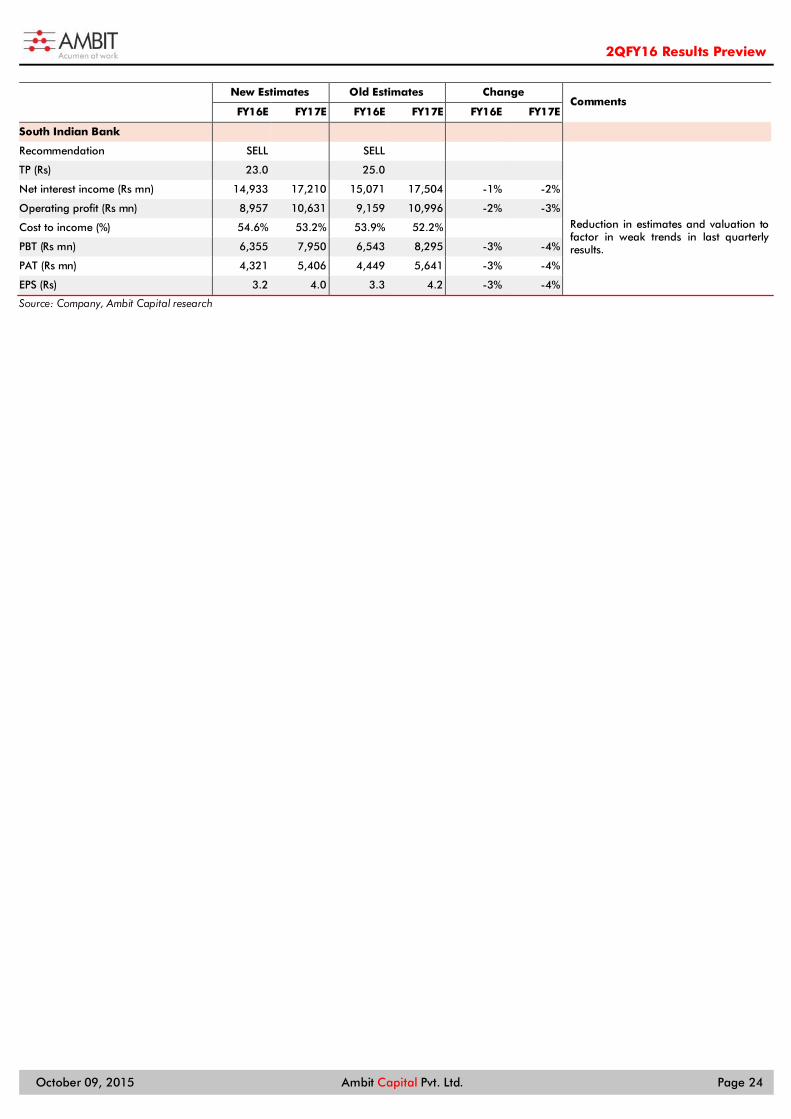
South Indian Bank Recommendation SELL SELL TP (Rs) 23.0 25.0 Net interest income (Rs mn) 14,933 17,210 15,071 17,504 -1% -2%
Reduction in estimates and valuation to factor in weak trends in last quarterly results.
Operating profit (Rs mn) 8,957 10,631 9,159 10,996 -2% -3%
Cost to income (%) 54.6% 53.2% 53.9% 52.2% PBT (Rs mn) 6,355 7,950 6,543 8,295 -3% -4%
PAT (Rs mn) 4,321 5,406 4,449 5,641 -3% -4%
EPS (Rs) 3.2 4.0 3.3 4.2 -3% -4%
Source: Company, Ambit Capital research

2QFY16 Results Preview
October 09, 2015 Ambit Capital Pvt. Ltd. Page 25
Capital Goods Demand across various sub-sectors in 2QFY16 is likely to be weak (except for Inox Wind) given industrial capex deceleration and weak order execution due to liquidity challenges. However, companies under our coverage would report higher profitability growth (vs their revenue growth) led by softening of raw material prices. BHEL and Inox Wind are likely to report the strongest PAT growth of 81% and 76% YoY. Cummins (KKC) is likely to report PAT growth of 5% YoY due to higher growth in exports, and Greaves (GRV) is likely to report a PAT decline of 2% YoY (despite 16% EBITDA growth) due to higher tax rate. We expect PAT growth of 8% and 10% for Havells and V-Guard respectively due to expansion in gross margins. We expect Bajaj Electricals (BJE) to turn into black led by the turnaround of the E&P business. Thermax, Finolex Cables (Finolex) and Crompton (CRG) may report YoY decline in profits. Our top BUYs are V-Guard and GRV and our top SELL is BJE.
Muted revenue growth: We expect muted growth for all companies in our coverage except KKC (strong export growth), Inox Wind (strong growth due to strong order backlog) and BJE (strong growth in E&P). Whilst for BHEL and Thermax we expect revenue decline given slow execution; for Havells, V-Guard and Finolex we expect less than 10% YoY growth due to sluggish demand as highlighted in our B2C distributor survey (click here). For KKC’s domestic business we model flat YoY growth despite 12-15% volume growth given price cuts and for GRV we model 2% YoY decline given production decline reported by 3Ws as per SIAM data. For CRG we expect 3% YoY growth led by sluggish growth in all businesses except consumer. EBITDA margin expansion: We expect EBITDA margin improvement for all companies under our coverage except KKC, V-Guard, CRG and Finolex. In BTG, we expect YoY improvement in margin of BHEL (80bps) and Thermax (10bps) due to lower commodity prices. For KKC, we expect a 50bps YoY decline in margin due to price cuts and increase in competitive intensity in the domestic market. For GRV, we expect a margin improvement of 240bps YoY due to closure of the loss-making infra equipment business. In light electricals, we expect margin improvement of 20bps for Havells due to favourable product mix, 550bps for BJE due to turnaround of E&P business. For V-Guard, Finolex and CRG we expect 10/10/20bps decline in margin led by unfavourable operating leverage. Where do we go from here? We remain negative on the BTG sector due to over-supply. For engines we have a mixed outlook. Whilst the near-term outlook for power gensets remains weak given the slowdown in industrial capex), we expect a recovery in FY17 on the back of a recovery in corporate capex. However, we are positive on 3W and 4W small commercial vehicle auto engine manufacturers, as the penetration of 3W vehicles still remain weak and the trend for outsourcing 4W engines is expected to pick-up over the next three years given the roll out of GST. The near-term outlook for light electricals remains weak given the only marginal pickup from B2B demand and a weak recovery in the B2C demand as consumer sentiments are still weak. We expect a recovery in light electrical demand only from 2HFY16. Ambit vs consensus: Currently no credible consensus estimates are available for all companies under coverage. Recommendations V-Guard (BUY, TP Rs1,163/share, 26% upside): V-Guard is fast emerging as a pan-India player through senior talent hiring and product portfolio expansion. We expect EBITDA margin improvement of 110bps over FY15-17E led by rising share of non-south revenue to 50% by FY17 vs 33% in FY15. This revenue increase would likely be led by expansion of distribution network in non-south (by leveraging relationships of senior recruits) and introduction of new products (appliances and fans). At CMP, V-Guard is trading at 22.5x FY17 P/E, 15% discount to Havells standalone P/E. We expect the discount to narrow given higher FY15-17E EPS CAGR of 31% vs Havells’ standalone 20% and higher FY17E RoE of 25% vs Havells’ 20%. We believe a ‘growth company’ like V-Guard deserves to trade closer to ‘market leader’ like Havells.
Stock Performance
(%) 3-month
Absolute Rel to Sensex
BHEL (20) (17)
Thermax (19) (16)
Cummins 8 11
Greaves Cotton (2) 1
Havells (15) (12)
Bajaj Electricals (13) (10)
V-Guard 0 (3)
Crompton Greaves 1 4
Finolex Cables (9) (6
Inox Wind (18) (15)
September’15E Qtrly EPS
(Rs) Ambit Consensus
BHEL 0.9 NA
Thermax 6.5 NA
Cummins 7.7 NA
Greaves Cotton 1.7 NA
Havells 2.0 NA
Bajaj Electricals 2.6 NA
V-Guard 7.0 NA
Crompton Greaves 1.0 NA
Finolex Cables 4.0 NA
Inox Wind 4.4 NA
FY16E EPS
(Rs) Ambit Consensus
BHEL 4.0 8.5 Thermax 24.7 27.2 Cummins 28.2 30.5 Greaves Cotton 7.2 6.8 Havells 8.0 8.8 Bajaj Electricals 12.1 12.1 V-Guard 31.9 31.9 Crompton Greaves 3.9 6.7 Finolex Cables 14.6 13.7 Inox Wind 21.8 23.6

2QFY16 Results Preview
October 09, 2015 Ambit Capital Pvt. Ltd. Page 26
Greaves Cotton (BUY, TP Rs214/share, 67% upside): Greaves’ auto business would see a strong volume growth in FY16 (we model revenue growth of 5% in FY16 vs 2% over FY13-15), led by uptick in demand for cargo vehicles (40% of FY15 volumes) due to: (a) softening interest rates; and (b) reduction in foreclosure inventory of LCVs with bankers. Strong focus on product development (R&D spend up 128% YoY in FY14) would result in Greaves adding at least one large OEM in the 4W space in addition to Multix announced in June. Moreover, with the renewed focus in the power genset business, the company is likely to double its genset revenues over FY15-17E. Greaves is trading at 13.6x FY17E P/E despite FY17E RoE of 21.7% and EPS CAGR of 19% over FY15-17E. At CMP, the auto business’ low valuations (FY17E P/E of 12.6x, a 40% discount to peers) ignore the 21% margin and 30% RoE generated by this business.
Bajaj Electricals (SELL, TP Rs229/share, 7% downside): Bajaj’s consumer business continued to report market share loss in 1QFY16, due to the fast-paced implementation of the Theory of Constraint (ToC) strategy. We believe the market share loss will continue until FY17, as the TOC roll-out has happened only in 6% of the country vs the targeted 80% by FY17. Alongside, competition in ‘domestic appliances’ (Bajaj’s core business) is at its peak, given rising competition from Crompton (CRG) which recently tied up with a Spanish player ‘SOGO’ for marketing its appliances in India. Also, CRG under the new management has become aggressive, with rising focus on advertisements and new product launches. In this scenario, it remains to be seen if Morphy’s contract with Bajaj is renewed in April 2017. Bajaj’s consumer business is still trading at 27x FY17E EPS, an unjustified 25% premium to its peers, despite the weakening franchise.
Exhibit 10: Detailed September’15E quarterly estimates
Company name Sept'15E Sept'14 Jun'15 YoY QoQ Comment
BHEL
Sales (Rs mn) 58,368 61,440 43,617 -5% 34% Decline in revenue led by weaker execution due to lower offtake by SEBs (balance sheet stress) and leveraged balance sheets of IPPs
EBITDA (Rs mn) 3,187 2,915 (2,093) 9% NA Led by lower raw material prices (40% YoY decline in international steel prices)
EBITDA margin (%) 5.5% 4.7% -4.8% 80bps NA
APBT (Rs mn) 3,230 2,088 373 55% 766% Trickle-down impact of higher EBITDA
APAT (Rs mn) 2,261 1,248 339 81% 567%
Thermax
Sales (Rs mn) 11,312 11,908 10,012 -5% 13% Decline in revenue led by lower opening order book at Rs55bn (down 7% YoY) in 2QFY15
EBITDA (Rs mn) 1,173 1,222 910 -4% 29% Whilst we expect gross margin improvement of 170bps YoY, we expect EBITDA margin to improve only 10bps YoY given the unfavourable operating leverage EBITDA margin (%) 10.4% 10.3% 9.1% 10bps 130bps
PBT (Rs mn) 1,160 1,248 919 -7% 26% Trickle-down impact of lower EBITDA
PAT (Rs mn) 778 860 617 -10% 26%
Cummins
Sales (Rs mn) 12,952 11,441 13,143 13% -1% Led by 25% YoY increase in exports led by low KVA. We model flat growth in domestic power genset
EBITDA (Rs mn) 2,079 1,899 2,180 9% -5% Whilst we expect gross margin to decline by 180bps YoY due to price cuts, we expect EBITDA margin to decline by only 50bps YoY due to favourable operating leverage. EBITDA margin (%) 16.1% 16.6% 16.6% -50bps -50bps
PBT (Rs mn) 2,594 2,412 2,575 8% 1% Increase in PBT is lower than EBITDA increase as we expect other income to remain flat
APAT (Rs mn) 2,127 2,024 2,107 5% 1% Increase in PAT is lower than PBT increase as we expect tax rate to increase from 16% in 2QFY15 to 18% in 2QFY16
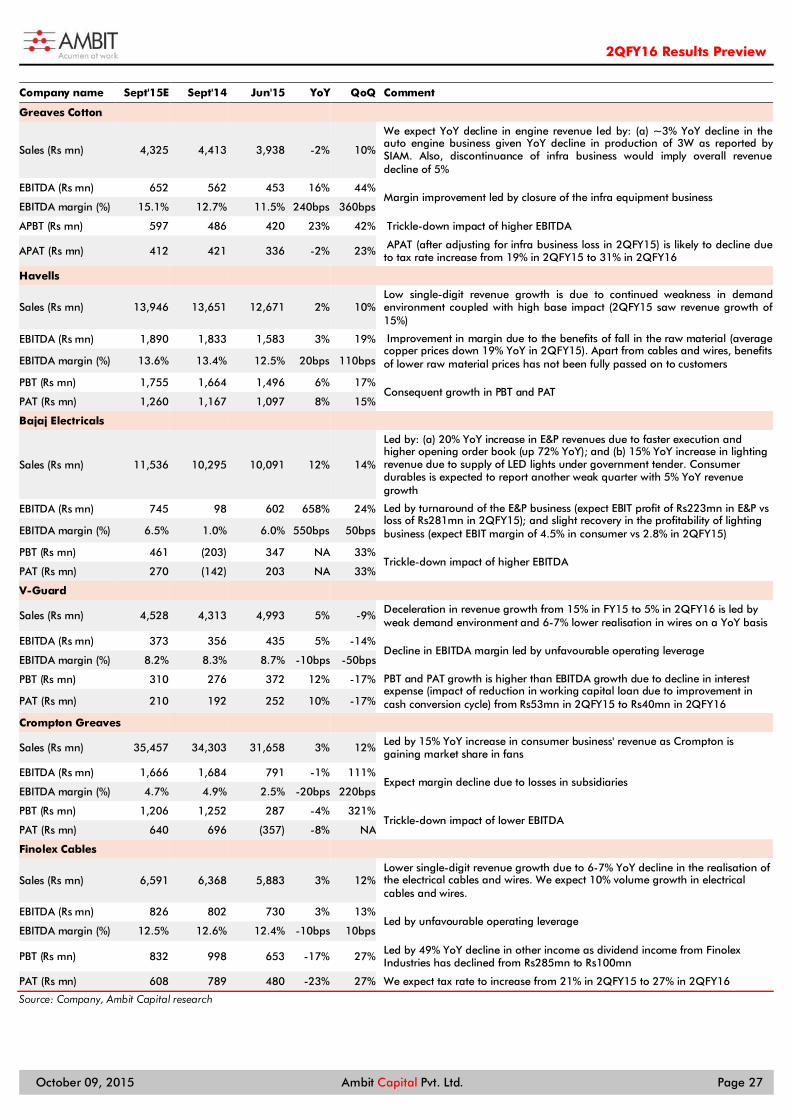
2QFY16 Results Preview
October 09, 2015 Ambit Capital Pvt. Ltd. Page 27
Company name Sept'15E Sept'14 Jun'15 YoY QoQ Comment
Greaves Cotton
Sales (Rs mn) 4,325 4,413 3,938 -2% 10%
We expect YoY decline in engine revenue led by: (a) ~3% YoY decline in the auto engine business given YoY decline in production of 3W as reported by SIAM. Also, discontinuance of infra business would imply overall revenue decline of 5%
EBITDA (Rs mn) 652 562 453 16% 44% Margin improvement led by closure of the infra equipment business
EBITDA margin (%) 15.1% 12.7% 11.5% 240bps 360bps
APBT (Rs mn) 597 486 420 23% 42% Trickle-down impact of higher EBITDA
APAT (Rs mn) 412 421 336 -2% 23% APAT (after adjusting for infra business loss in 2QFY15) is likely to decline due to tax rate increase from 19% in 2QFY15 to 31% in 2QFY16
Havells
Sales (Rs mn) 13,946 13,651 12,671 2% 10% Low single-digit revenue growth is due to continued weakness in demand environment coupled with high base impact (2QFY15 saw revenue growth of 15%)
EBITDA (Rs mn) 1,890 1,833 1,583 3% 19% Improvement in margin due to the benefits of fall in the raw material (average copper prices down 19% YoY in 2QFY15). Apart from cables and wires, benefits of lower raw material prices has not been fully passed on to customers EBITDA margin (%) 13.6% 13.4% 12.5% 20bps 110bps
PBT (Rs mn) 1,755 1,664 1,496 6% 17% Consequent growth in PBT and PAT
PAT (Rs mn) 1,260 1,167 1,097 8% 15%
Bajaj Electricals
Sales (Rs mn) 11,536 10,295 10,091 12% 14%
Led by: (a) 20% YoY increase in E&P revenues due to faster execution and higher opening order book (up 72% YoY); and (b) 15% YoY increase in lighting revenue due to supply of LED lights under government tender. Consumer durables is expected to report another weak quarter with 5% YoY revenue growth
EBITDA (Rs mn) 745 98 602 658% 24% Led by turnaround of the E&P business (expect EBIT profit of Rs223mn in E&P vs loss of Rs281mn in 2QFY15); and slight recovery in the profitability of lighting business (expect EBIT margin of 4.5% in consumer vs 2.8% in 2QFY15) EBITDA margin (%) 6.5% 1.0% 6.0% 550bps 50bps
PBT (Rs mn) 461 (203) 347 NA 33% Trickle-down impact of higher EBITDA
PAT (Rs mn) 270 (142) 203 NA 33%
V-Guard
Sales (Rs mn) 4,528 4,313 4,993 5% -9% Deceleration in revenue growth from 15% in FY15 to 5% in 2QFY16 is led by weak demand environment and 6-7% lower realisation in wires on a YoY basis
EBITDA (Rs mn) 373 356 435 5% -14% Decline in EBITDA margin led by unfavourable operating leverage
EBITDA margin (%) 8.2% 8.3% 8.7% -10bps -50bps
PBT (Rs mn) 310 276 372 12% -17% PBT and PAT growth is higher than EBITDA growth due to decline in interest expense (impact of reduction in working capital loan due to improvement in cash conversion cycle) from Rs53mn in 2QFY15 to Rs40mn in 2QFY16 PAT (Rs mn) 210 192 252 10% -17%
Crompton Greaves
Sales (Rs mn) 35,457 34,303 31,658 3% 12% Led by 15% YoY increase in consumer business' revenue as Crompton is gaining market share in fans
EBITDA (Rs mn) 1,666 1,684 791 -1% 111% Expect margin decline due to losses in subsidiaries
EBITDA margin (%) 4.7% 4.9% 2.5% -20bps 220bps
PBT (Rs mn) 1,206 1,252 287 -4% 321% Trickle-down impact of lower EBITDA
PAT (Rs mn) 640 696 (357) -8% NA
Finolex Cables
Sales (Rs mn) 6,591 6,368 5,883 3% 12% Lower single-digit revenue growth due to 6-7% YoY decline in the realisation of the electrical cables and wires. We expect 10% volume growth in electrical cables and wires.
EBITDA (Rs mn) 826 802 730 3% 13% Led by unfavourable operating leverage
EBITDA margin (%) 12.5% 12.6% 12.4% -10bps 10bps
PBT (Rs mn) 832 998 653 -17% 27% Led by 49% YoY decline in other income as dividend income from Finolex Industries has declined from Rs285mn to Rs100mn
PAT (Rs mn) 608 789 480 -23% 27% We expect tax rate to increase from 21% in 2QFY15 to 27% in 2QFY16
Source: Company, Ambit Capital research
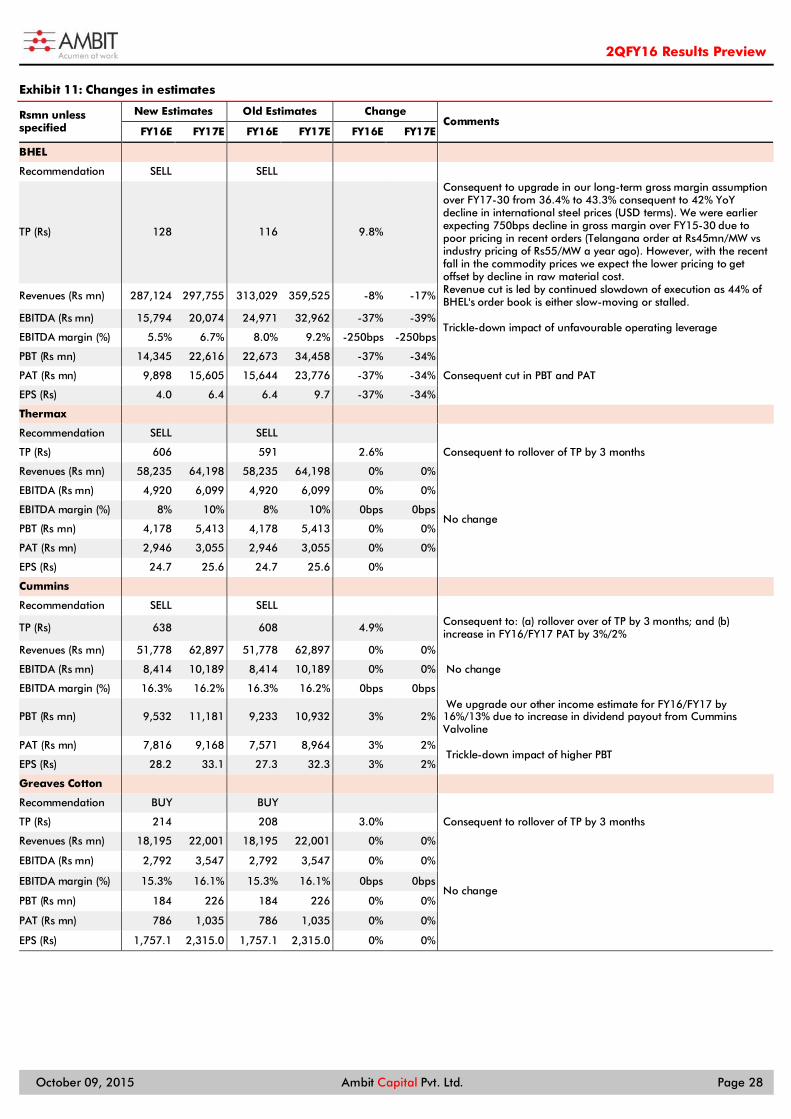
2QFY16 Results Preview
October 09, 2015 Ambit Capital Pvt. Ltd. Page 28
Exhibit 11: Changes in estimates
Rsmn unless specified
New Estimates Old Estimates Change Comments
FY16E FY17E FY16E FY17E FY16E FY17E
BHEL
Recommendation SELL SELL
TP (Rs) 128 116 9.8%
Consequent to upgrade in our long-term gross margin assumption over FY17-30 from 36.4% to 43.3% consequent to 42% YoY decline in international steel prices (USD terms). We were earlier expecting 750bps decline in gross margin over FY15-30 due to poor pricing in recent orders (Telangana order at Rs45mn/MW vs industry pricing of Rs55/MW a year ago). However, with the recent fall in the commodity prices we expect the lower pricing to get offset by decline in raw material cost.
Revenues (Rs mn) 287,124 297,755 313,029 359,525 -8% -17% Revenue cut is led by continued slowdown of execution as 44% of BHEL's order book is either slow-moving or stalled.
EBITDA (Rs mn) 15,794 20,074 24,971 32,962 -37% -39% Trickle-down impact of unfavourable operating leverage
EBITDA margin (%) 5.5% 6.7% 8.0% 9.2% -250bps -250bps
PBT (Rs mn) 14,345 22,616 22,673 34,458 -37% -34%
Consequent cut in PBT and PAT PAT (Rs mn) 9,898 15,605 15,644 23,776 -37% -34%
EPS (Rs) 4.0 6.4 6.4 9.7 -37% -34%
Thermax Recommendation SELL SELL TP (Rs) 606 591 2.6% Consequent to rollover of TP by 3 months
Revenues (Rs mn) 58,235 64,198 58,235 64,198 0% 0%
No change
EBITDA (Rs mn) 4,920 6,099 4,920 6,099 0% 0%
EBITDA margin (%) 8% 10% 8% 10% 0bps 0bps
PBT (Rs mn) 4,178 5,413 4,178 5,413 0% 0%
PAT (Rs mn) 2,946 3,055 2,946 3,055 0% 0%
EPS (Rs) 24.7 25.6 24.7 25.6 0% Cummins Recommendation SELL SELL TP (Rs) 638 608 4.9%
Consequent to: (a) rollover over of TP by 3 months; and (b) increase in FY16/FY17 PAT by 3%/2%
Revenues (Rs mn) 51,778 62,897 51,778 62,897 0% 0%
No change EBITDA (Rs mn) 8,414 10,189 8,414 10,189 0% 0%
EBITDA margin (%) 16.3% 16.2% 16.3% 16.2% 0bps 0bps
PBT (Rs mn) 9,532 11,181 9,233 10,932 3% 2% We upgrade our other income estimate for FY16/FY17 by 16%/13% due to increase in dividend payout from Cummins Valvoline
PAT (Rs mn) 7,816 9,168 7,571 8,964 3% 2% Trickle-down impact of higher PBT
EPS (Rs) 28.2 33.1 27.3 32.3 3% 2%
Greaves Cotton Recommendation BUY BUY TP (Rs) 214 208 3.0% Consequent to rollover of TP by 3 months
Revenues (Rs mn) 18,195 22,001 18,195 22,001 0% 0%
No change
EBITDA (Rs mn) 2,792 3,547 2,792 3,547 0% 0%
EBITDA margin (%) 15.3% 16.1% 15.3% 16.1% 0bps 0bps
PBT (Rs mn) 184 226 184 226 0% 0%
PAT (Rs mn) 786 1,035 786 1,035 0% 0%
EPS (Rs) 1,757.1 2,315.0 1,757.1 2,315.0 0% 0%
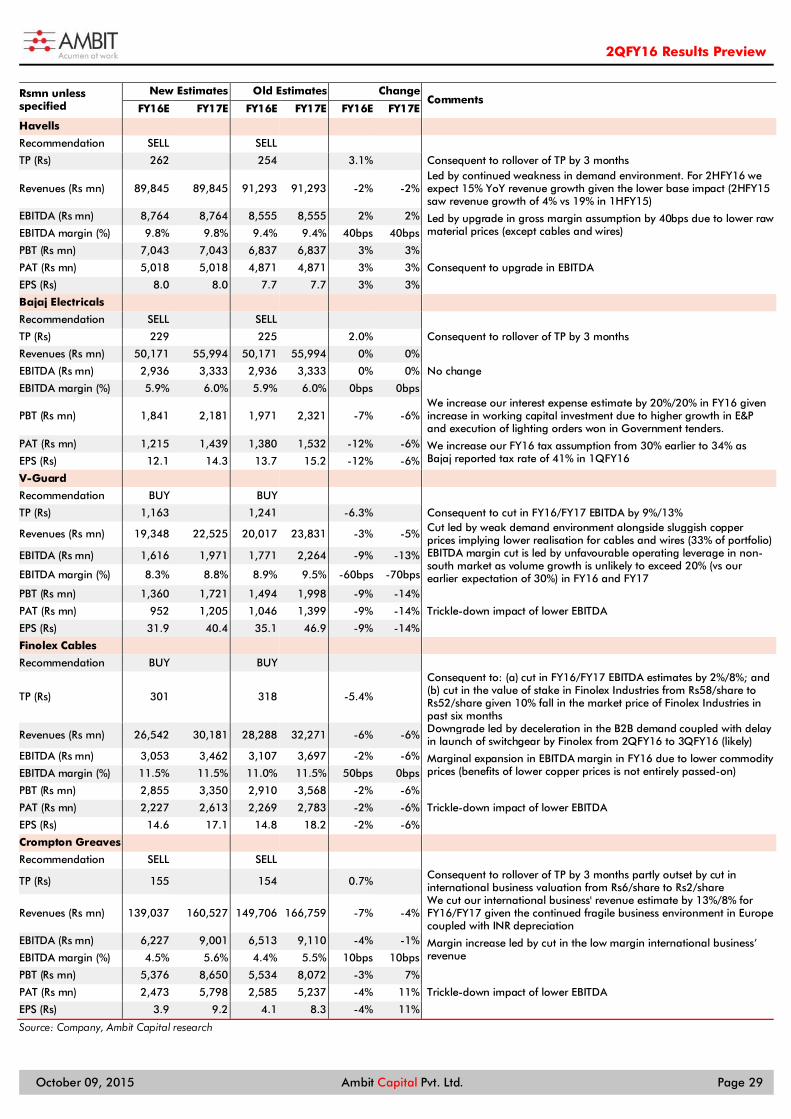
2QFY16 Results Preview
October 09, 2015 Ambit Capital Pvt. Ltd. Page 29
Rsmn unless specified
New Estimates Old Estimates Change Comments
FY16E FY17E FY16E FY17E FY16E FY17E
Havells Recommendation SELL SELL TP (Rs) 262 254 3.1% Consequent to rollover of TP by 3 months
Revenues (Rs mn) 89,845 89,845 91,293 91,293 -2% -2% Led by continued weakness in demand environment. For 2HFY16 we expect 15% YoY revenue growth given the lower base impact (2HFY15 saw revenue growth of 4% vs 19% in 1HFY15)
EBITDA (Rs mn) 8,764 8,764 8,555 8,555 2% 2% Led by upgrade in gross margin assumption by 40bps due to lower raw material prices (except cables and wires) EBITDA margin (%) 9.8% 9.8% 9.4% 9.4% 40bps 40bps
PBT (Rs mn) 7,043 7,043 6,837 6,837 3% 3%
Consequent to upgrade in EBITDA PAT (Rs mn) 5,018 5,018 4,871 4,871 3% 3%
EPS (Rs) 8.0 8.0 7.7 7.7 3% 3%
Bajaj Electricals Recommendation SELL SELL TP (Rs) 229 225 2.0% Consequent to rollover of TP by 3 months
Revenues (Rs mn) 50,171 55,994 50,171 55,994 0% 0%
No change EBITDA (Rs mn) 2,936 3,333 2,936 3,333 0% 0%
EBITDA margin (%) 5.9% 6.0% 5.9% 6.0% 0bps 0bps
PBT (Rs mn) 1,841 2,181 1,971 2,321 -7% -6% We increase our interest expense estimate by 20%/20% in FY16 given increase in working capital investment due to higher growth in E&P and execution of lighting orders won in Government tenders.
PAT (Rs mn) 1,215 1,439 1,380 1,532 -12% -6% We increase our FY16 tax assumption from 30% earlier to 34% as Bajaj reported tax rate of 41% in 1QFY16 EPS (Rs) 12.1 14.3 13.7 15.2 -12% -6%
V-Guard Recommendation BUY BUY TP (Rs) 1,163 1,241 -6.3% Consequent to cut in FY16/FY17 EBITDA by 9%/13%
Revenues (Rs mn) 19,348 22,525 20,017 23,831 -3% -5% Cut led by weak demand environment alongside sluggish copper prices implying lower realisation for cables and wires (33% of portfolio)
EBITDA (Rs mn) 1,616 1,971 1,771 2,264 -9% -13% EBITDA margin cut is led by unfavourable operating leverage in non-south market as volume growth is unlikely to exceed 20% (vs our earlier expectation of 30%) in FY16 and FY17 EBITDA margin (%) 8.3% 8.8% 8.9% 9.5% -60bps -70bps
PBT (Rs mn) 1,360 1,721 1,494 1,998 -9% -14%
Trickle-down impact of lower EBITDA PAT (Rs mn) 952 1,205 1,046 1,399 -9% -14%
EPS (Rs) 31.9 40.4 35.1 46.9 -9% -14%
Finolex Cables Recommendation BUY BUY
TP (Rs) 301 318 -5.4%
Consequent to: (a) cut in FY16/FY17 EBITDA estimates by 2%/8%; and (b) cut in the value of stake in Finolex Industries from Rs58/share to Rs52/share given 10% fall in the market price of Finolex Industries in past six months
Revenues (Rs mn) 26,542 30,181 28,288 32,271 -6% -6% Downgrade led by deceleration in the B2B demand coupled with delay in launch of switchgear by Finolex from 2QFY16 to 3QFY16 (likely)
EBITDA (Rs mn) 3,053 3,462 3,107 3,697 -2% -6% Marginal expansion in EBITDA margin in FY16 due to lower commodity prices (benefits of lower copper prices is not entirely passed-on) EBITDA margin (%) 11.5% 11.5% 11.0% 11.5% 50bps 0bps
PBT (Rs mn) 2,855 3,350 2,910 3,568 -2% -6%
Trickle-down impact of lower EBITDA PAT (Rs mn) 2,227 2,613 2,269 2,783 -2% -6%
EPS (Rs) 14.6 17.1 14.8 18.2 -2% -6%
Crompton Greaves Recommendation SELL SELL TP (Rs) 155 154 0.7%
Consequent to rollover of TP by 3 months partly outset by cut in international business valuation from Rs6/share to Rs2/share
Revenues (Rs mn) 139,037 160,527 149,706 166,759 -7% -4% We cut our international business' revenue estimate by 13%/8% for FY16/FY17 given the continued fragile business environment in Europe coupled with INR depreciation
EBITDA (Rs mn) 6,227 9,001 6,513 9,110 -4% -1% Margin increase led by cut in the low margin international business’ revenue EBITDA margin (%) 4.5% 5.6% 4.4% 5.5% 10bps 10bps
PBT (Rs mn) 5,376 8,650 5,534 8,072 -3% 7%
Trickle-down impact of lower EBITDA PAT (Rs mn) 2,473 5,798 2,585 5,237 -4% 11%
EPS (Rs) 3.9 9.2 4.1 8.3 -4% 11%
Source: Company, Ambit Capital research
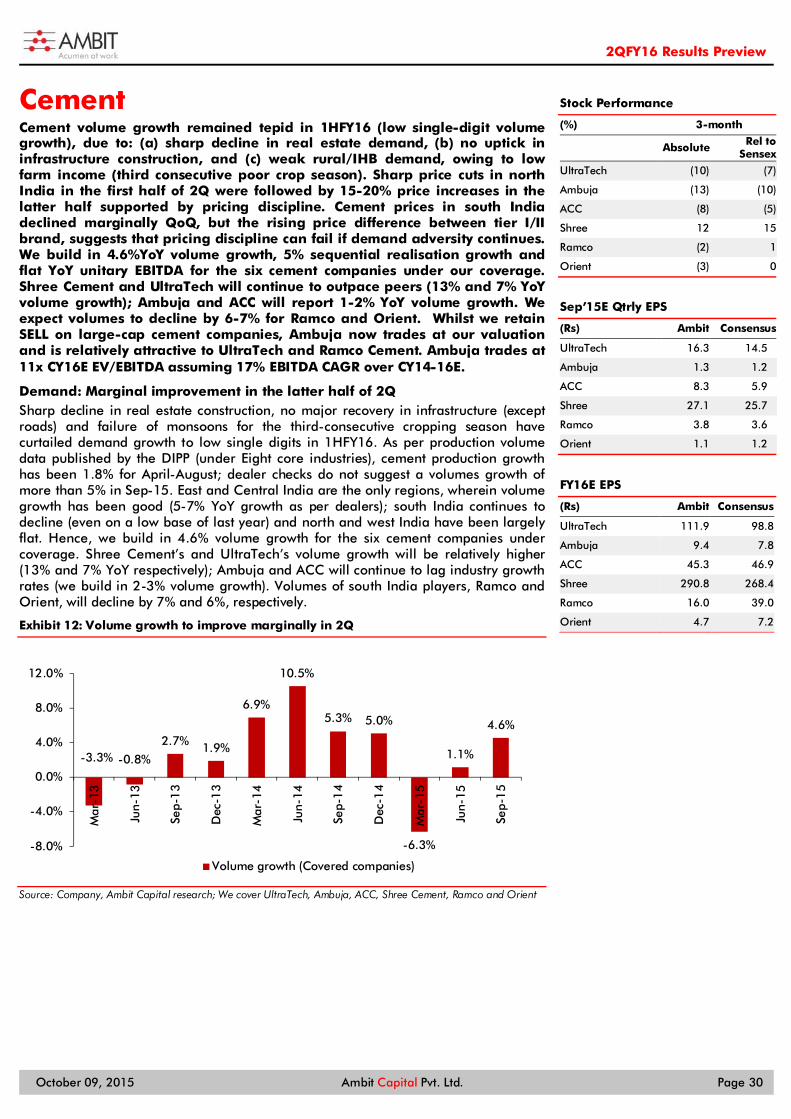
2QFY16 Results Preview
October 09, 2015 Ambit Capital Pvt. Ltd. Page 30
Cement Cement volume growth remained tepid in 1HFY16 (low single-digit volume growth), due to: (a) sharp decline in real estate demand, (b) no uptick in infrastructure construction, and (c) weak rural/IHB demand, owing to low farm income (third consecutive poor crop season). Sharp price cuts in north India in the first half of 2Q were followed by 15-20% price increases in the latter half supported by pricing discipline. Cement prices in south India declined marginally QoQ, but the rising price difference between tier I/II brand, suggests that pricing discipline can fail if demand adversity continues. We build in 4.6%YoY volume growth, 5% sequential realisation growth and flat YoY unitary EBITDA for the six cement companies under our coverage. Shree Cement and UltraTech will continue to outpace peers (13% and 7% YoY volume growth); Ambuja and ACC will report 1-2% YoY volume growth. We expect volumes to decline by 6-7% for Ramco and Orient. Whilst we retain SELL on large-cap cement companies, Ambuja now trades at our valuation and is relatively attractive to UltraTech and Ramco Cement. Ambuja trades at 11x CY16E EV/EBITDA assuming 17% EBITDA CAGR over CY14-16E.
Demand: Marginal improvement in the latter half of 2Q Sharp decline in real estate construction, no major recovery in infrastructure (except roads) and failure of monsoons for the third-consecutive cropping season have curtailed demand growth to low single digits in 1HFY16. As per production volume data published by the DIPP (under Eight core industries), cement production growth has been 1.8% for April-August; dealer checks do not suggest a volumes growth of more than 5% in Sep-15. East and Central India are the only regions, wherein volume growth has been good (5-7% YoY growth as per dealers); south India continues to decline (even on a low base of last year) and north and west India have been largely flat. Hence, we build in 4.6% volume growth for the six cement companies under coverage. Shree Cement’s and UltraTech’s volume growth will be relatively higher (13% and 7% YoY respectively); Ambuja and ACC will continue to lag industry growth rates (we build in 2-3% volume growth). Volumes of south India players, Ramco and Orient, will decline by 7% and 6%, respectively.
Exhibit 12: Volume growth to improve marginally in 2Q
Source: Company, Ambit Capital research; We cover UltraTech, Ambuja, ACC, Shree Cement, Ramco and Orient
-3.3% -0.8%
2.7% 1.9%
6.9%
10.5%
5.3% 5.0%
-6.3%
1.1%
4.6%
-8.0%
-4.0%
0.0%
4.0%
8.0%
12.0%
Mar
-13
Jun-
13
Sep-
13
Dec
-13
Mar
-14
Jun-
14
Sep-
14
Dec
-14
Mar
-15
Jun-
15
Sep-
15
Volume growth (Covered companies)
Stock Performance
(%) 3-month
Absolute Rel to Sensex
UltraTech (10) (7)
Ambuja (13) (10)
ACC (8) (5)
Shree 12 15
Ramco (2) 1
Orient (3) 0
Sep’15E Qtrly EPS
(Rs) Ambit Consensus
UltraTech 16.3 14.5
Ambuja 1.3 1.2
ACC 8.3 5.9
Shree 27.1 25.7
Ramco 3.8 3.6
Orient 1.1 1.2
FY16E EPS
(Rs) Ambit Consensus
UltraTech 111.9 98.8
Ambuja 9.4 7.8
ACC 45.3 46.9
Shree 290.8 268.4
Ramco 16.0 39.0
Orient 4.7 7.2

2QFY16 Results Preview
October 09, 2015 Ambit Capital Pvt. Ltd. Page 31
Sharp price hikes in north India led by pricing discipline In 1QFY16, realisation for the top-12 cement companies declined by 2.5% YoY but the decline was in double digits for north-based manufacturers (11-22% for Shree, JK Lakshmi and Mangalam). This meant that the cost-efficient players in north India just managed to break-even whilst the less-efficient players made losses at the EBITDA level. Taking cognizance of declining margins, cement companies hiked prices sharply (especially in North India) to offset the adverse impact of weak demand. Prices were increased by ~20% from the lows of 1QFY16, but the entire increase will not transpire in realisation given that price hikes were effected only in the latter half of the quarter. Prices remained flat in most other regions and dropped marginally in south India. We build in 5% QoQ realisation growth for the six companies under coverage and build in relatively higher growth for players with a higher volume skew in north India (Shree Cement and Ambuja).
Exhibit 13: Prices were hiked sharply in north India
Source: Primary Checks, Ambit Capital research
Fuel costs drop further: The lever to cost savings
Unitary power and fuel cost dropped by 9% YoY (combined for 12 cement companies), the lowest in the last 15 quarters. Fuel prices dropped further in 2QFY16 with a 30% drop in e-auction coal, 15% drop in international coal and 20% drop in petcoke. This means that power and fuel costs will remain benign and hence we build in a 1-2% QoQ reduction in power and fuel costs for the cement companies under coverage. We also expect marginal QoQ savings in freight costs given lean-season rail freight discounts. We expect a marginal 1-2% overall unitary cost increase for cement companies.
Exhibit 14: Increasing coal output leading to a sharp drop in e-auction coal prices…
Source: Coal market watch, Ambit Capital research
Exhibit 15: …Indonesian coal costs remain benign…
Source: Bloomberg, Ambit Capital research;
200 220 240 260 280 300 320 340 360
May
-11
Jul-
11
Sep-
11
Nov
-11
Jan-
12
Mar
-12
May
-12
Jul-
12
Sep-
12
Nov
-12
Jan-
13
Mar
-13
May
-13
Jul-
13
Sep-
13
Nov
-13
Jan-
14
Mar
-14
May
-14
Jul-
14
Sep-
14
Nov
-14
Jan-
15
Mar
-15
May
-15
Jul-
15
Sep-
15
(Rs/ 50kg bag)
South North West Central East
-
1,000
2,000
3,000
4,000
5,000
-
1
2
3
4
5
Aug
-14
Sep-
14
Oct
-14
Nov
-14
Dec
-14
Jan-
15
Feb-
15
Mar
-15
Apr
-15
May
-15
Jun-
15
Jul-
15
Aug
-15
Volumes offered (mt) Volumes sold (mt)
Average realisation - LHS
2,000 2,100 2,200 2,300 2,400 2,500 2,600 2,700 2,800 2,900 3,000
Mar
-12
Jun-
12
Sep-
12
Dec
-12
Mar
-13
Jun-
13
Sep-
13
Dec
-13
Mar
-14
Jun-
14
Sep-
14
Dec
-14
Mar
-15
Jun-
15
Sep-
15
Indonesian coal (Rs/tonne)

2QFY16 Results Preview
October 09, 2015 Ambit Capital Pvt. Ltd. Page 32
Exhibit 16: …and international petcoke prices drop further
Source: Coal market watch, Ambit Capital research
Exhibit 17: Diesel prices drop by 20% YoY
Source: Company, Ambit Capital research; Note: The above is a representation of freight cost of top-5 cement companies
Realisation decline led to an 8% YoY drop in EBITDA/tonne for the industry in 1QFY16, the drop was the steepest for the North based manufacturers (30-60% decline), whereas EBITDA/tonne grew materially for the South India based manufacturers. Given that prices improved in North India, alongside continued power and fuel cost savings, we expect 2% QoQ increase in EBITDA/tonne for the cement companies under coverage, but expect it to remain flat YoY.
Exhibit 18: EBITDA/tonne to remain flat YoY
Source: Company, Ambit Capital research. Unitary EBITDA growth of six cement companies under our coverage
Where do we go from here? Cement volumes grew by 1.8% in Apr-Aug-15, which means that to meet our 5% volume growth assumption in FY16, the industry will have to grow at ~7% over Sep-15 to Mar-16, which seems unlikely given the current demand environment and no clearly visible green shoots of an industrial capex recovery. Rural demand remains weak (40% of overall cement sales in India) owing to poor farm profitability and with the stagnation in MSP and wage growth. Moreover, demand from real estate clients has dropped sharply, especially in regions such as north India. Cement volumes could grow at 7-8% in FY17, if infrastructure execution ramps up significantly. We believe that the demand super-cycle (~10% volume growth) will have to wait until FY18, as retail demand will improve with a 2-3 quarter lag to infrastructure demand. Contrary to industry’s expectation, pricing has a ceiling and discipline cannot lead to continuous price increases, especially when capacity utilisation is extremely low. To counter the whimsical price increases in north India, NCR builders lobby (CREDAI) has stopped cement procurement from large manufacturers such as UltraTech and Lafarge and our checks in the eco system suggests that further price increases will be difficult given pressure from local political parties. Hence, we believe that scope of further price hikes are limited from hereon.
93 9083
75 73 71
0
20
40
60
80
100
Jan-14 Jun-14 Jan-15 Jun-15 Aug-15 Sep-15
Petcoke (US$/tonne)
42
47
52
57
62
67
Jun-
12
Sep-
12
Dec
-12
Mar
-13
Jun-
13
Sep-
13
Dec
-13
Mar
-14
Jun-
14
Sep-
14
Dec
-14
Mar
-15
Jun-
15
Sep-
15
Diesel price (Rs/litre)
-0.2
0
0.2
0.4
500
600
700
800
900
1,000
1,100
Jun-
13
Sep-
13
Dec
-13
Mar
-14
Jun-
14
Sep-
14
Dec
-14
Mar
-15
Jun-
15
Sep-
15
(Rs/tonne)
EBITDA/tonne YoY growth

2QFY16 Results Preview
October 09, 2015 Ambit Capital Pvt. Ltd. Page 33
Exhibit 19: Strong demand and high utilisation super cycle to start only in latter half of FY18
Source: CMA, Company, Ambit Capital research
Valuations – Value emerging in certain stocks
We have never questioned the fact that cement is a strong play on infrastructure recovery in India; however, given lack of credible infra companies and strong cash flow generation traits of cement companies, our concern was primarily on expensive valuations based on hope and no tangible on-ground demand improvement. The recent correction in the stock prices of cement companies has increased our valuation comfort on certain names, especially Ambuja Cement. Our SELL thesis on the stock is premised on the fact that demand and pricing had deteriorated significantly in its key markets–north and west India. Whilst demand remains weak, incipient pricing discipline will drive EBITDA/tonne improvement in the following quarters. At the current price, we believe valuations have little downside (11.0x one-year forward EBITDA) and are at just a 10% premium to Ramco Cement (which has significantly lower capacities, single-region exposure and a less-than-ideal capital allocation history and hence lower RoCEs). Over the last two years, whilst Ambuja’s volumes remained flat whereas Ramco Cement reported a 4% decline. Lastly, Ambuja’s unitary EBITDA declined by 1.2% over CY11-14, whereas Ramco’s unitary EBITDA declined by 6% over FY12-15.
Note that we have not made any changes to our FY16/FY17 earnings estimates or valuations.
Exhibit 20: Detailed Sep '15E quarterly estimates
Company name Sep-15 Sep-14 Jun-15 YoY QoQ Comments
UltraTech Cement Cement despatches (mn tonnes) 11.1 10.4 12.1 7.0 (8.8)
We expect 7% YoY volume growth for UltraTech led by market share gains and ramp up of utilisation of the Gujarat Plant Realisation (Rs/tonne) 5,073 5,200 4,974 (2.4) 2.0
Sales (Rs mn) 56,707 54,293 60,975 4.4 (7.0)
EBITDA (Rs mn) 10,272 8,770 11,519 17.1 (10.8) We expect a 10% YoY EBITDA/tonne given that price increases were back-ended EBITDA margin (%) 18.1 16.2 18.9 196 (78)
EBITDA (Rs/tonne) 927 847 949 9.5 (2.2)
PBT (Rs mn) 6,662 5,055 8,308 31.8 (19.8) PBT/PAT growth lower than EBITDA growth due to higher depreciation PAT (Rs mn) 4,663 4,101 5,908 13.7 (21.1)
EPS (Rs) 17.0 15.0 21.6 13.7 (21.1)
50%
60%
70%
80%
90%
100%
-10%
0%
10%
20%
30%
FY96
FY97
FY98
FY99
FY00
FY01
FY02
FY03
FY04
FY05
FY06
FY07
FY08
FY09
FY10
FY11
FY12
FY13
FY14
FY15
FY16
E
FY17
E
FY18
E
FY19
E
Rolling 3-year cement capacities CAGR Rolling 3-year cement despatches CAGR
Cement price growth Annual capacity utilisations (RHS)

2QFY16 Results Preview
October 09, 2015 Ambit Capital Pvt. Ltd. Page 34
Company name Sep-15 Sep-14 Jun-15 YoY QoQ Comments
Ambuja Cement Cement despatches (mn tonnes) 4.8 4.7 5.9 2.0 (19.0) We expect Ambuja will continue to lose market share in its key
markets of North and West India and build only a 2% YoY volume growth
Realisation (Rs/tonne) 4,494 4,684 4,239 (4.1) 6.0
Sales (Rs mn) 21,554 22,021 25,105 (2.1) (14.1)
EBITDA (Rs mn) 3,479 3,934 3,838 (11.6) (9.4) EBITDA/tonne will decline by 13% YoY given lower averrage prices than last year EBITDA margin (%) 16.1 17.9 15.3 (173) 85
EBITDA (Rs/tonne) 730 842 653 (13.3) 11.9
PBT (Rs mn) 2,917 3,339 3,094 (12.6) (5.7) PAT decline is higher than EBITDA due to lower EBITDA and higher tax rate PAT (Rs mn) 1,984 2,391 2,264 (17.0) (12.4)
EPS (Rs) 1.3 1.6 1.5 (17.0) (12.4)
ACC Cement despatches (mn tonnes) 5.7 5.6 6.2 2.0 (7.5)
We expect 2% volume growth for ACC given lack of capacity additions and market share loss to regional players Cement Realisation (Rs/tonne) 4,593 4,706 4,547 (2.4) 1.0
Sales (Rs mn) 28,556 28,145 30,153 1.5 (5.3)
EBITDA (Rs mn) 3,326 3,786 3,335 (12.1) (0.3) EBITDA/tonne will decline by 14% YoY given lower averrage prices than last year EBITDA margin (%) 11.6 13.5 11.1 (180) 59
EBITDA (Rs/tonne) 580 674 538 (13.9) 7.9
PBT (Rs mn) 2,019 2,723 1,771 (25.9) 14.1 PAT decline is sharper than PBT owing to tax write backs last year. PAT (Rs mn) 1,383 2,049 1,314 (32.5) 5.3
EPS (Rs) 7.4 10.9 7.0 (32.5) 5.3
Ramco Cement Cement despatches (mn tonnes) 1.8 1.9 1.8 (7.0) (0.5) Cement Realisation (Rs/tonne) 4,871 4,595 5,021 6.0 (3.0) We expect 7% YoY volume decline given weak demand in Tamil
Nadu. We expect 5% QoQ realisation growth led by pricing discipline Sales (Rs mn) 9,390 9,514 9,509 (1.3) (1.3)
EBITDA (Rs mn) 2,516 2,163 2,514 16.3 0.1 Sharp increase in unitary EBITDA driven by realisation growth supported by production discipline EBITDA margin (%) 26.8 22.7 26.4 406 36
EBITDA (Rs/tonne) 1,395 1,115 1,386 25.1 0.6 PBT (Rs mn) 1,368 1,084 1,377 26.3 (0.6) PAT to remain broadly flat despite 15% EBITDA growth since the tax rate was lower last year PAT (Rs mn) 917 897 975 2.2 (6.0)
EPS (Rs) 3.9 3.8 4.1 2.2 (6.0)
Shree Cement Cement despatches (mn tonnes) 4.3 3.9 4.1 11.9 5.1
We expect Shree to significantly grow ahead of the industry (due to market share gains) and rising despatches in East India . Cement Realisation (Rs/tonne) 3,692 3,656 3,543 1.0 4.2
Sales (Rs mn) 17,373 16,081 15,764 8.0 10.2
EBITDA (Rs mn) 3,672 3,404 3,406 7.9 7.8 EBITDA/tonne will improve only marginally YoY since price hikes in North India were effective only in the latter half of 2Q EBITDA margin (%) 21.1 21.2 21.6 (3) (47)
EBITDA (Rs/tonne) 754 726 696 3.9 8.3
PBT (Rs mn) 1,299 1,109 1,011 17.2 28.6 Decline in PAT is on account of high depreciation charge on commisioning of new capacities PAT (Rs mn) 1,039 1,156 1,237 (10.0) (16.0)
EPS (Rs) 29.8 33.2 35.5 (10.0) (16.0)
Orient Cement Cement despatches (mn tonnes) 0.9 1.0 1.0 (6) (4.3)
We expect 6% volume decline and 1% QoQ realisation decline given deterioration in demand in South/West India Cement Realisation (Rs/tonne) 3,559 3,898 3,595 (8.7) (1.0)
Sales (Rs mn) 3,312 3,859 3,494 (14.2) (5.2)
EBITDA (Rs mn) 477 791 597 (39.7) (20.1) Sharp YoY decline in unitary EBITDA (on a high base of last year) owing to realisation decline EBITDA margin (%) 14.4 20.5 17.1 (609) (268)
EBITDA (Rs/tonne) 512.5 798.8 613.9 (35.8) (16.5)
PBT (Rs mn) 342 657 465 (47.9) (26.5) Sharp decline in PAT owing to lower EBITDA and higher depreciation/interest
PAT (Rs mn) 233 433 279 (46.3) (16.7)
EPS (Rs) 1.1 2.1 1.4 (46.3) (16.7)

2QFY16 Results Preview
October 09, 2015 Ambit Capital Pvt. Ltd. Page 35
Consumer The YoY revenue growth of consumer companies in 2QFY16 is likely to be weaker than that in 1QFY16, owing to: (a) rise in liquidity issues at distributors (arising from weak consumer demand); (b) lower price realisation growth due to price cuts in FMCG & paints (softening input costs were passed on to customers); and (c) a delayed festive season, which affected demand for categories like FMCG, paints and kitchenware (shift of sales from Sep to Oct vs last year). With modest demand growth during the Onam festival, urban demand is unlikely to turn around meaningfully in 3QFY16 (the Diwali quarter). For the FMCG sector, we expect average volume growth of 4.7% YoY in 2QFY16 vs 5.0%/5.6% for 1QFY16/2QFY15 across our coverage universe. Margin benefits from softening input costs will support earnings growth for FMCG/paints companies until 3QFY16. Our tops BUYs are ITC, Page Industries and TTK Prestige.
Consumer demand remained weak during 2QFY16: The YoY revenue growth of consumer companies in 2QFY16 is likely to be weaker than that in 1QFY16, owing to: Rise in liquidity issues at distributors; Lower price realisation growth due to price cuts in FMCG & paints; and A delayed festive season, which affected demand for categories like FMCG, paints
and jewellery (shift of sales from Sep to Oct vs last year).
Competitive intensity increased further, particularly in the FMCG category. HUL and P&G re-launched their detergents portfolio. P&G took price corrections on its portfolio to match HUL’s pricing. In the shampoo category, P&G took a ~30% price cut, forcing HUL to also follow suit. Channel checks suggest that P&G has gained share in the shampoo category following the price cut. Colgate has also increased the level of consumer promotions particularly in the urban areas where it has been market share to GSK’s Sensodyne and Dabur.
A modest start to the festive season; weak hopes of urban demand revival in 3QFY16: Channel partners in event-oriented segments of consumption, like paints, kitchenware, and jewellery, are hoping that the festive season (more so due to a delayed Diwali and hence a longer festive period) will be a positive catalyst for urban demand in these categories. However, the festivities so far have NOT led to a meaningful increase in demand; for example: (a) the Ganapati festival in Maharashtra (September) appears to have seen no meaningful growth in demand YoY; and (b) Onam in Kerala and Tamil Nadu has seen only modest YoY growth in demand for most of the relevant product categories.
Rural India’s woes continue: The rural sector, we believe, is NOT likely to see a revival in consumption demand before 1QFY17 due to a combination of the following factors: Job creation in the construction sector following the expected execution of
public sector infrastructure projects will lag by at least six months after the initiation of plans for such execution by the corporate offices of the respective companies.
Asset value creation in smaller cities and rural India will take place only once the connectivity of smaller cities increases, following the execution of infrastructure projects.
The monsoon season so far has been below normal and hence we do NOT expect the agriculture crop harvest in 2HFY16 to bring cheer to rural disposable household income.
Stock Performance
(%) 3-month
Absolute Rel to Sensex
HUL (11) (5) Britannia 12 18 Colgate (6) (0) Dabur (2) 4 GCPL (1) 5 GSK Consumer (3) 3 Marico (10) (4) Nestle 0 6 ITC 4 10 Jubilant Food (13) (19) Asian Paints 9 4 Bata (5) (11) Berger Paints 7 2 Pidilite Industries (7) (13) Page Industries (11) (17) TTK Prestige (4) (10) Titan (7) (3) Trent 13 18
Sep’15E Qtrly EPS
Company Ambit Consensus HUL 4.9 4.9 Britannia 18.1 NA Colgate 9.6 5.5 Dabur 1.9 2.0 GCPL 8.5 8.2 GSK Consumer 43.0 NM Marico 2.1 2.4 Nestle 18.2 NM ITC 3.1 3.4 Pidilite Inds 3.5 3.4 Page Inds. 54.3 59.2 TTK Prestige 26.1 32.2 Asian Paints 4.8 4.7 Jubilant Foodworks 5.7 5.6 Berger Paints 1.2 1.6 BATA India 5.6 5.7 Titan 2 3.6 Trent 4 NA
FY17E EPS
Company Ambit Consensus HUL 23.7 24.0 Britannia 79.6 85.8 Colgate 25.7 26.6 Dabur 8.2 8.7 GCPL 37.2 40.7 GSK Consumer 175.7 195.3 Marico 14.0 13.3 Nestle 128.8 148.9 ITC 15.1 14.7 Pidilite Inds 14.2 16.0 Page Inds. 314.4 304.0 TTK Prestige 144.5 139.0 Asian Paints 21.1 23.6 Jubilant Foodworks 32.2 38.6 Berger Paints 5.9 6.6 BATA India 43.0 40.0 Titan 9 9.9 Trent 35 NA

2QFY16 Results Preview
October 09, 2015 Ambit Capital Pvt. Ltd. Page 36
Summary of our sector-specific channel checks FMCG/Staples: Volume growth fails to increase despite QoQ price deflation
Consumer demand for 2QFY16 has failed to increase despite price deflation and heightened promotional intensity in several categories. Our channel checks suggest that urban demand remained weak during the quarter whilst rural demand deteriorated incrementally QoQ due to deficient rainfall. Also, revenue growth during the quarter will be impacted by a delayed Diwali (in 3Q this year vs 2Q last year).
Personal care faced the highest competitive intensity, as P&G cut shampoo prices by 25-30% and gained market share from HUL and L’Oreal.
In oral care, Colgate continued to lose market share in urban areas.
In cigarettes, ITC is likely to end 2Q with a volume decline of 15% YoY.
As a result, for 2QFY16, we expect average volume growth of 4.7% YoY vs 5.0%/5.6% for 1QFY16/2QFY15 across our coverage.
We reiterate that any uptick in consumer demand will be gradual and is likely to happen, at the earliest, from 1QFY17 onwards.
Paints: Another weak quarter for revenue; margin expansion to continue until 3QFY16
Revenue growth in 2QFY16 for the paints sector is likely to have been affected by a combination of: (a) delayed Diwali (resulting in a shift in demand from 2QFY16 to 3QFY16); (b) weak overall demand for the home improvement segment and especially mid and premium paint products; and (c) YoY declines in price realisations given no price hikes and one price cut (of 2%) over the past 12 months.
Asian Paints continues to further improve its speed of delivery of products to dealers. Based on our previous discussions with the management of Asian Paints, speedy delivery is likely to be through automation of input/output warehousing in the supply chain, and better use of data analytics to forecast demand more accurately.
Berger also continues to gain share from peers like Kansai and Akzo.
We expect revenue growth of 9%/8% YoY for Asian Paints/ Berger Paints. Soft input costs, partially offset by the recent depreciation in INR against USD, will lead to gross margin expansion of 200-400bps in both 2QFY16 as well as 3QFY16, which is likely to be unsustainable from 4QFY16 onwards.
Kitchenware: Weak September after modest growth in Jul-Aug for TTK; Hawkins likely to report flat-to-declining revenues YoY
Whilst sales growth for the kitchenware segment improved in July and August, September has been exceptionally weak mainly due to a delayed Diwali. Liquidity constraints at the distributor level have increased significantly in north and south India (less so in the east and west regions). Demand during the festive season of Onam in south India was moderately positive. Most brands launched new products over the past 3-4 months, albeit with varying degrees of success.
TTK Prestige has seen strong demand for new launches like “Cute pressure cookers” in north India, “Multi-Kadhai” in south India, and “Clip-on cookers” in Karnataka.
Hawkins, on the other hand, has NOT seen any meaningful success with its ceramic-coated cookers, due to high product prices and increased complaints from several customers (around the coating coming off).
We expect TTK Prestige to report revenue growth of 6% in 2QFY16 driven by market share gains, new product launches and strong performance of franchisee stores. Hawkins, on the other hand, is likely to report flat YoY revenue growth at best.
FMCG - We expect average volume growth of 4.7% YoY vs 5.0%/5.6% for 1QFY16/2QFY15
Paints – delayed Diwali, weak home improvement sector demand, and price cuts YoY
Kitchenware – weak macro demand; several new product launches from TTK Prestige and Hawkins

2QFY16 Results Preview
October 09, 2015 Ambit Capital Pvt. Ltd. Page 37
Jewellery: 2Q an aberration; underlying changes favour Titan
Our discussions with various stores (including Tanishq), unlisted jewellers and trade participants indicate: (1) marginal increase in demand, (2) fall in footfalls and revenues due to discontinuation of the monthly gold deposit scheme. Out of these, the impact of the discontinuation of the gold deposit scheme would be the highest, as the scheme accounted for nearly 50% of Titan’s 2QFY15 jewellery revenues. The LTL growth for Tanishq will not be comparable for 2QFY15 due to early redemption of gold deposit scheme wherein deposits maturing in 2HFY15 were redeemed during that quarter. Therefore, whilst the 2QFY16 results will optically reflect a 25% fall in revenues and profits, the same are not comparable. However, the absence of the scheme has been partially offset by promotions. Also, we gather that there has been system-level reduction in inventory by most players due to working capital constraints. Consequently, their ability to retain market share through range and lower pricing will be severely constrained. We are BUYers of Titan, as it is best placed to gain market share from these organised players and as it continues asset-light expansion of stores.
Preparing for the upcoming results
In consumer staples, we had already revised our FY16/17 estimates downwards following the weak set of numbers reported during 1QFY16. Ahead of the 2QFY16 results, we haven’t made changes to our estimates but see downside risk to our estimates if the results disappoint our already benign growth estimates. For consumer discretionary companies, we downgrade our estimates to account for the prolonged slowdown in consumer weakness, translating into weaker revenue growth.
Ambit vs consensus
On most stocks in the coverage universe, our estimates are below consensus earnings estimates by up to 5-6%. The key reasons for this divergence include: (a) lower than consensus’ forecasts of EBITDA margin benefit from the softening in input costs, which we believe will be largely offset by price cuts/promotions/rise in advert spends; and (b) more bearish view vs consensus on the timing of macro demand revival (we expect revival earliest in 1QFY17).
Recommendations
We believe the 2QFY16 results are likely to act as a negative catalyst for firms like Nestle and Colgate and for paint stocks where consensus earnings estimates underestimate the drag from weak volume growth and weak realisation gains. Although tailwinds from lower input costs will lead to ~170bps EBITDA margin expansion YoY in 2QFY16 for FMCG, these gains will end in 4QFY16 (base effect). Our top BUYs are ITC, Page Industries and TTK Prestige.
Exhibit 21: Detailed Sep’15 quarterly estimates
Particulars Sep'15E Sep'14 Jun'15 YoY QoQ Comments
Staples HUL
Sales 80,088 76,393 81,051 5% -1% Assuming 5% volume growth and no growth from pricing/mix change
EBITDA 14,409 12,420 15,064 16% -4% Lower input costs to support gross margin expansion by ~300bps YoY; A&P spends as % of sales to be ~140bps higher YoY thus partially offsetting gross margin gains EBITDA margin (%) 18.00% 16.30% 18.60% 173 -60
PBT 15,658 13,571 15,400 15% 2% PAT growth to be ahead of revenues due to EBITDA margin expansion of 173bpsbps YoY PAT 10,669 9,395 10,494 14% 2%
Dabur
Sales 20,643 19,296 20,695 7% 0% Assuming volume growth of 5.5% YoY and 1.5% price/mix led growth
EBITDA 4,084 3,508 3,218 16% 27% Expect GM to be 280bps higher YoY due to lower input cost inflation; A&P spends are expected to be ~60bps higher YoY thus partially offsetting gross margin gains EBITDA margin (%) 19.80% 18.20% 15.50% 160 423
PBT 4,104 3,503 3,253 17% 26% PAT growth to be ahead of revenues due to EBITDA margin expansion of 160bps YoY PAT 3,293 2,875 2,611 15% 26%

2QFY16 Results Preview
October 09, 2015 Ambit Capital Pvt. Ltd. Page 38
Particulars Sep'15E Sep'14 Jun'15 YoY QoQ Comments
Marico
Sales 15,314 14,312 17,832 7% -14% Assuming 6% of volume growth and only 1% price/mix led growth
EBITDA 2,201 1,953 3,253 13% -32% Expect gross margin to expand by ~170bps YoY due to copra price correction. A&P spends are expected to be 80bps higher YoY. EBITDA margin (%) 14.40% 13.60% 18.20% 73 -387
PBT 2,071 1,813 3,223 14% -36% EBITDA margin expansion is expected to drive PAT growth of ~16% YoY
PAT 1,368 1,183 2,282 16% -40%
GCPL
Sales 22,855 20,601 20,977 11% 9% Assuming 11% YoY revenue growth driven by 7% volume growth and 4% price and mix led growth
EBITDA 4,205 3,383 3,168 24% 33% Assuming ~200bps YoY expansion in gross margin due to lower raw material costs. However, we expect these gains to be partially offset by higher promotional spends and higher provisioning for employee variable pay.
EBITDA margin (%) 18.40% 16.40% 15.10% 198 330
PBT 4,005 3,249 2,834 23% 41% PAT growth to be ahead of sales growth due to EBITDA margin significant expansion of ~200bps YoY PAT 3,084 2,531 2,272 22% 36%
GSK Consumer
Sales 12,074 11,136 10,450 8% 16% Assuming 2% volume and 6% price/mix led growth; despite weak base of 2% YoY volume growth we expect weak demand to lead to only 2% volume growth
EBITDA 2,330 1,957 1,989 19% 17% Expect significant gross margin expansion of ~450bps YoY due to lower milk and barley prices. Expect A&P spends to be stepped by ~100bps YoY as % of sales EBITDA margin (%) 19.30% 17.60% 19.00% 173 27
PBT 2,763 2,453 2,383 13% 16% Auxiliary income expected to grow 15% YoY helping PAT grow at 13% YoY, ahead of sales growth PAT 1,810 1,603 1,550 13% 17%
Nestle
Sales 20,271 25,704 19,570 -21% 4% This quarter will have no sales of Maggi Noodles and thus result in ~20% YoY overall sales drop
EBITDA 3,163 5,313 4,035 -40% -22% Margin will also be impacted due to fixed costs (~Rs1.2bn) related to the Maggi Noodles manufacturing facilities EBITDA margin (%) 15.60% 20.70% 20.60% -507 -502
PBT 2,613 4,621 3,616 -43% -28% Expect PAT to almost half YoY due to the loss of Maggi Noodles sales and higher fixed costs PAT 1,751 3,113 2,387 -44% -27%
Colgate
Sales 10,552 10,005 10,102 5% 4% Assuming 3% volume and 5% price/mix-led growth. Sales were impacted by the increase in excise duty as tax holidays expired for its Baddi plant
EBITDA 1,974 1,865 2,018 6% -2% Expect gross margin to expand only ~80bps YoY impacted by withdrawal of tax benefits at its Baddi plant EBITDA margin (%) 18.70% 18.60% 20.00% 7 -127
PBT 1,864 1,787 1,853 4% 1% PAT growth is expected to be flat YoY due to flat EBITDA margin YoY and weak topline growth PAT 1,305 1,296 1,331 1% -2%
Britannia
Sales 22,101 19,745 20,186 12% 9% Assuming 7-8% volume and 4% price & mix led growth YoY; Britannia's core brands (Good Day, Marie) have continued to do well following their re-launch during the quarter
EBITDA 3,315 2,201 2,884 51% 15% Gross margin is expected to have increased ~350bps YoY due to lower raw material prices. A&P spends are expected to have increased by ~50bps YoY to support new product launches. EBITDA margin (%) 15.00% 11.10% 14.30% 385 71
PBT 3,195 2,067 2,784 55% 15% PAT is expected to grow ahead of topline due to EBITDA margin expansion of ~400bps YoY PAT 2,172 1,460 1,897 49% 15%
ITC
Sales 94,757 90,237 85,877 5% 10% We factor in cigarette volume de-growth of ~15% YoY and avg. MRP increase of ~17% YoY
EBITDA 35,759 34,887 33,859 3% 6% We expect the moderation in growth of KSFT segment to result in EBITDA margin contraction of ~90bps YoY; we factor in Cigarette EBIT growth of ~3% YoY EBITDA margin (%) 37.70% 38.70% 39.40% -92 -169
PBT 37,354 35,833 34,322 4% 9% We expect PAT growth of ~2% to be almost in-line with EBIT growth.
PAT 24,654 24,252 22,654 2% 9%

2QFY16 Results Preview
October 09, 2015 Ambit Capital Pvt. Ltd. Page 39
Particulars Sep'15E Sep'14 Jun'15 YoY QoQ Comments
Discretionary
Asian Paints
Sales (Rs mn) 39,599 36,330 36,235 9% 9%
Negative product mix change along with the impact of price cuts taken and weakness in consumer sentiment would lead to lower revenue growth despite of ~10% YoY volume growth. Company is expected to maintain market share during the quarter.
EBITDA (Rs mn) 6,919 5,362 6,835 29% 1% We expect gross margin expansion of ~340 bps YoY due to benefits of lower input costs not completely passed on. EBITDA margin expansion restricted to 270 bps YoY due to negative operating leverage around employee costs and operating overheads
EBITDA margin (%) 17.50% 14.80% 18.90% 271 -139
PBT (Rs mn) 6,778 5,103 6,788 33% 0% Higher tax rate would only partially offset the EBITDA growth
PAT (Rs mn) 4,677 3,563 4,674 31% 0%
Berger Paints
Sales (Rs mn) 11,925 11,042 11,212 8% 6%
Increase in distribution efforts will lead to market share gains for Berger Paints in the quarter especially from Kansai and Akzo. However we expect revenue growth to be muted due to negative operating leverage, full impact of the price cuts taken and the slowdown in consumer sentiment
EBITDA (Rs mn) 1,482 1,259 1,494 18% -1% We expect gross margin expansion of ~160bps YoY due to benefits of lower input costs not completely passed on. EBITDA margin expansion restricted to 100 bps YoY due to negative operating leverage. EBITDA margin (%) 12.40% 11.40% 13.30% 103 -90
PBT (Rs mn) 1,197 987 1,225 21% -2% Lower depreciation and interest burden lead earnings growth to be ahead of the EBITDA growth. PAT (Rs mn) 826 670 773 23% 7%
Pidilite
Sales (Rs mn) 13,930 12,546 14,695 11% -5% Assuming volume growth of ~10%. Continued weakness in demand environment leads to lower revenue growth
EBITDA (Rs mn) 2,716 2,063 3,442 32% -21% We factor in ~400 bps of improvement in gross margins on account of lower input costs. EBITDA margin expansion is restricted to ~300 bps only primarily due to negative operating leverage. EBITDA margin (%) 19.50% 16.40% 23.40% 305 -393
PBT (Rs mn) 2,519 1,873 3,187 34% -21% Lower depreciation and interest burden lead earnings growth to be ahead of the EBITDA growth. PAT (Rs mn) 1,814 1,373 2,261 32% -20%
Jubilant Foodworks
Sales (Rs mn) 6,415 5,012 5,707 28% 12%
We expect the SSG to remain at ~6% YoY which is primarily due to a weak consumer environment and company specific factors including store splits and price hikes taken. Increase in competitive intensity coupled with low promotional offers by the company lead to a low volume growth for Jubilant.
EBITDA (Rs mn) 843 610 705 38% 20% Gross margins to expand by ~40 bps on lower input costs. Price hike led revenue growth will bring some operating leverage benefits which is likely to offset high rental expenses. EBITDA margin (%) 13.10% 12.20% 12.40% 97 79
PBT (Rs mn) 558 396 430 41% 30% Higher tax burden leads to earnings growth lagging EBITDA growth
PAT (Rs mn) 374 290 295 29% 27%
TTK Prestige
Sales (Rs mn) 4,054 3,820 3,486 6% 16% Fall in retail footfalls lead to ~3% YoY volume growth. TTK has maintained / gained market share. Channel disruption by e-tailers has been curbed.
EBITDA (Rs mn) 472 462 382 2% 23% We expect gross margins to be broadly unchanged. We expect EBITDA margin compression of ~45 bps primarily due to negative operating leverage EBITDA margin (%) 11.60% 12.10% 11.00% -46 67
PBT (Rs mn) 441 414 354 6% 25% Benefits accruing from lower interest charge and higher tax rates in the base quarter lead to PAT growth being marginally ahead of EBITDA growth. PAT (Rs mn) 304 280 245 9% 24%
Bata India
Sales (Rs mn) 5,918 5,480 6,805 8% -13% Whiles the supply chain disruption led revenue decline is behind us the slowdown in overall macro would continue to impact the revenue growth in 2QFY16
EBITDA (Rs mn) 670 636 864 5% -22% Gross margins have been stable YoY. While the negative operating leverage around operating expenses and Rent leads to EBITDA margin compression EBITDA margin (%) 11.30% 11.60% 12.70% -29 -138
PBT (Rs mn) 525 584 743 -10% -29% Higher depreciation burden on account of rapid store openings and lower other income leads to low PAT growth PAT (Rs mn) 357 390 584 -9% -39%

2QFY16 Results Preview
October 09, 2015 Ambit Capital Pvt. Ltd. Page 40
Particulars Sep'15E Sep'14 Jun'15 YoY QoQ Comments
Page Industries
Sales (Rs mn) 4,550 3,965 4,465 15% 2% Slowdown in consumer sentiment would lead to slowdown in revenue growth.
EBITDA (Rs mn) 902 746 1,014 21% -11% Lower cotton prices would lead to EBITDA margin expansion of ~100 bps YoY. EBITDA margin (%) 19.80% 18.80% 22.70% 102 -290
PBT (Rs mn) 897 745 962 20% -7% PAT growth in line with EBITDA growth
PAT (Rs mn) 606 499 632 21% -4%
Titan
Sales (Rs mn) 28,092 35,931 27,086 -22% 4% Absence of golden harvest will impact revenues; however, it will be partly mitigated by new customer acquisition Margins though will be cushioned by gains on hedging gold and higher gross margins in the absence of golden harvest scheme PAT growth will be aided by lower interest costs due to lower debt (as gold on lease is back)
EBITDA (Rs mn) 2,581 3,331 2,228 -23% 16%
EBITDA margin (%) 9% 9% 8% PBT (Rs mn) 2,396 3,201 2,036 -25% 18%
PAT (Rs mn) 1,797 2,400 1,511 -25% 19%
Trent
Sales (Rs mn) 3,850 3,652 3,497 5% 10% Quarters are not comparable as Landmark has been wound down (accounted for 8% of Revenues in 2QFY15; Westside’s topline growth of 12% led by LTL growth of 7.5%
EBITDA (Rs mn) 256 172 315 49% -19% EBITDA margins will improve due to lower share of Landmark
EBITDA margin (%) 7% 5% 9% PBT (Rs mn) 199 157 240 27% -17% PAT growth is lower due to lower other income from deployment of cash
balances PAT (Rs mn) 133 115 161 16% -17%
Source: Company, Ambit Capital research
Exhibit 22: Revisions ahead of earnings season
New Estimates Old Estimates Change
Comments FY16 FY17 FY16 FY17 FY15 FY16
Marico
Recommendation SELL SELL TP (Rs) 385 375 3% Revenues (Rs mn) 66,046 76,484 66,046 76,484 0% 0%
We have only rolled forward our TP. No changes to estimates.
EBITDA (Rs mn) 10,913 12,867 10,913 12,867 0% 0%
EBITDA margin (%) 16.5% 16.8% 16.5% 16.8% - -
PBT (Rs mn) 10,610 12,897 10,610 12,897 0% 0%
PAT (Rs mn) 7,419 9,042 7,419 9,042 0% 0%
EPS (Rs) 11.5 14.0 11.5 14.0 0% 0%
Colgate Recommendation SELL SELL TP (Rs) 735 735 0% Revenues (Rs mn) 42,023 47,582 42,023 47,582 0% 0%
No changes to estimates.
EBITDA (Rs mn) 9,010 10,583 9,010 10,583 0% 0%
EBITDA margin (%) 21.4% 22.2% 21.4% 22.2% - -
PBT (Rs mn) 8,582 10,288 8,582 10,288 0% 0%
PAT (Rs mn) 5,964 6,996 5,964 6,996 0% 0%
EPS (Rs) 21.9 25.7 21.9 25.7 0% 0%

2QFY16 Results Preview
October 09, 2015 Ambit Capital Pvt. Ltd. Page 41
New Estimates Old Estimates Change
Comments FY16 FY17 FY16 FY17 FY15 FY16
Dabur Recommendation SELL SELL TP (Rs) 217 211 3% Revenues (Rs mn) 87,117 99,390 87,117 99,390 0% 0%
We have only rolled forward our TP. No changes to estimates.
EBITDA (Rs mn) 15,431 17,754 15,431 17,754 0% 0%
EBITDA margin (%) 17.7% 17.9% 17.7% 17.9% - -
PBT (Rs mn) 15,407 18,090 15,407 18,090 0% 0%
PAT (Rs mn) 12,326 14,291 12,326 14,291 0% 0%
EPS (Rs) 7.1 8.2 7.1 8.2 0% 0%
Britannia Recommendation SELL SELL TP (Rs) 2,020 1,900 6% Revenues (Rs mn) 89,277 102,904 89,277 102,904 0% 0%
We have rolled forward our TP and increased our margin estimates
EBITDA (Rs mn) 12,075 14,021 12,075 14,021 0% 0%
EBITDA margin (%) 13.5% 13.6% 13.5% 13.6% - -
PBT (Rs mn) 11,496 13,830 11,496 13,830 0% 0%
PAT (Rs mn) 7,992 9,545 7,992 9,545 0% 0%
EPS (Rs) 66.6 79.6 66.6 79.6 0% 0%
GSK Consumer Recommendation SELL SELL TP (Rs) 5,150 5,000 3% Revenues (Rs mn) 45,742 51,886 45,742 51,886 0% 0%
We have only rolled forward our TP. No changes to estimates.
EBITDA (Rs mn) 6,780 7,917 6,780 7,917 0% 0%
EBITDA margin (%) 14.8% 15.3% 14.8% 15.3% - -
PBT (Rs mn) 10,035 11,281 10,035 11,281 0% 0%
PAT (Rs mn) 6,573 7,389 6,573 7,389 0% 0%
EPS (Rs) 156.3 175.7 156.3 175.7 0% 0%
Nestle Recommendation SELL SELL TP (Rs) 5,050 4,900 3% Revenues (Rs mn) 88,865 100,358 88,865 100,358 0% 0%
We have only rolled forward our TP. No changes to estimates.
EBITDA (Rs mn) 17,621 20,904 17,621 20,904 0% 0%
EBITDA margin (%) 19.8% 20.8% 19.8% 20.8% - -
PBT (Rs mn) 15,403 18,541 15,403 18,541 0% 0%
PAT (Rs mn) 10,320 12,423 10,320 12,423 0% 0%
EPS (Rs) 107.0 128.8 107.0 128.8 0% 0%
HUL Recommendation SELL SELL TP (Rs) 765 740 3% Revenues (Rs mn) 331,603 373,393 331,603 373,393 0% 0%
We have only rolled forward our TP. No changes to estimates.
EBITDA (Rs mn) 58,719 67,800 58,719 67,800 0% 0%
EBITDA margin (%) 17.7% 18.2% 17.7% 18.2% - -
PBT (Rs mn) 60,974 74,050 60,974 74,050 0% 0%
PAT (Rs mn) 42,316 51,265 42,316 51,265 0% 0%
EPS (Rs) 19.6 23.7 19.6 23.7 0% 0%

2QFY16 Results Preview
October 09, 2015 Ambit Capital Pvt. Ltd. Page 42
New Estimates Old Estimates Change
Comments FY16 FY17 FY16 FY17 FY15 FY16
GCPL Recommendation SELL SELL TP (Rs) 890 837 6% Revenues (Rs mn) 102,764 102,764 102,764 102,764 0% 0%
We have rolled forward our TP and increased our margin estimates
EBITDA (Rs mn) 18,262 18,262 18,262 18,262 0% 0%
EBITDA margin (%) 17.8% 17.8% 17.8% 17.8% - -
PBT (Rs mn) 17,732 17,732 17,732 17,732 0% 0%
PAT (Rs mn) 13,654 13,654 13,654 13,654 0% 0%
EPS (Rs) 37.2 37.2 37.2 37.2 0% 0%
ITC Recommendation BUY BUY TP (Rs) 406 384 6% Revenues (Rs mn) 402,713 460,316 402,913 460,553 0% 0%
We have only rolled forward our TP. No changes to estimates.
EBITDA (Rs mn) 143,040 162,671 143,055 162,690 0% 0%
EBITDA margin (%) 35.5% 35.3% 35.5% 35.3% - -
PBT (Rs mn) 152,453 174,526 152,468 174,545 0% 0%
PAT (Rs mn) 105,192 120,423 105,203 120,436 0% 0%
EPS (Rs) 13.1 15.0 13.1 15.0 0% 0%
Discretionary Berger Paints
Recommendation SELL SELL TP (Rs) 178 176 1.5% Revenues (Rs mn) 48,345 57,298 49,596 58,390 -2.5% -1.9%
We have rolled forward our TP; we cut the revenue forecasts on account of delayed revival in demand momentum (expected in 1HFY17). We believe Berger will gain market share from smaller players on the back of expansion in its distribution franchise. We believe that the near-term benefits from declining input costs will be offset by negative operating leverage.
EBITDA (Rs mn) 6,043 7,134 6,299 7,357 -4.1% -3.0%
EBITDA margin (%) 12.5% 12.5% 12.7% 12.6% (20) (15)
PBT (Rs mn) 4,934 6,055 5,189 6,279 -4.9% -3.6%
PAT (Rs mn) 3,345 4,117 3,518 4,269 -4.9% -3.6%
EPS (Rs) 5 6 5 6 -4.9% -3.6%
BATA Recommendation BUY BUY
TP (Rs) 1,359 1,351 1% Revenues (Rs mn) 24,850 29,840 25,068 30,102 -1% -1%
Our estimates remain broadly unchanged.
EBITDA (Rs mn) 3,014 4,262 3,077 4,259 -2% 0%
EBITDA margin (%) 12.1% 14.3% 12.3% 14.2% (14) 13
PBT (Rs mn) 2,752 4,068 2,802 4,067 -2% 0%
PAT (Rs mn) 1,927 2,766 1,905 2,765 1% 0%
EPS (Rs) 30 43 30 43 1% 0%
Pidilite Industries
Recommendation SELL SELL
TP (Rs) 428 410 4% Revenues (Rs mn) 55,070 64,678 55,836 65,573 -1% -1%
We have rolled forward our TP; We believe that most of the benefits from lower input costs will be offset by negative operating leverage.
EBITDA (Rs mn) 10,078 11,173 9,381 11,131 7% 0%
EBITDA margin (%) 18.3% 17.3% 16.8% 17.0% 150 30
PBT (Rs mn) 9,179 10,427 8,569 10,427 7% 0%
PAT (Rs mn) 6,649 7,339 6,295 7,339 6% 0%
EPS (Rs) 13 14 12 14 6% 0%

2QFY16 Results Preview
October 09, 2015 Ambit Capital Pvt. Ltd. Page 43
New Estimates Old Estimates Change
Comments FY16 FY17 FY16 FY17 FY15 FY16
Asian Paints
Recommendation SELL SELL TP (Rs) 731 717 1.9% Revenues (Rs mn) 158,340 187,589 162,279 192,301 -2.4% -2.5%
We have rolled forward our TP. We believe Asian Paints will, in the long term continue to gain market share from smaller players like Kansai and Akzo. We believe that the benefits from lower input costs will be more than offset by negative operating leverage. We increase our target price given the sustainability of the leadership position Asian paints enjoys in the Paint industry.
EBITDA (Rs mn) 26,812 31,229 26,659 32,151 0.6% -2.9%
EBITDA margin (%) 16.9% 16.6% 16.4% 16.7% 51 (7)
PBT (Rs mn) 25,627 30,388 25,511 31,247 0.5% -2.8%
PAT (Rs mn) 17,233 20,238 17,233 20,823 0.5% -2.8%
EPS (Rs) 18 21 18 22 0.5% -2.8%
Jubilant Foodworks
Recommendation SELL SELL TP (Rs) 1,320 1,285 2.7% Revenues (Rs mn) 26,564 33,771 26,915 34,182 -1.3% -1.2%
We have rolled forward our estimates; We factor expect SSGs to be 8%/12% for FY16 and FY17 respectively and hence we factor in operating leverage benefits from improving SSG FY17 onwards. We upgrade our target price as a sustained SSG improvement to 10-12% levels will lead to Jubilant delivering consistent revenue and EPS growth.
EBITDA (Rs mn) 3,462 4,726 3,729 5,016 -7.2% -5.8%
EBITDA margin (%) 13.0% 14.0% 13.9% 14.7% (82.4) (68.0)
PBT (Rs mn) 2,272 3,148 2,475 3,370 -8.2% -6.6%
PAT (Rs mn) 1,522 2,109 1,658 2,258 -8.2% -6.6%
EPS (Rs) 23 32 25 34 -8.2% -6.6%
Page Industries
Recommendation BUY BUY TP (Rs) 16,232 16,650 -2.5% Revenues (Rs mn) 18,700 24,762 19,632 26,004 -4.7% -4.8%
The slowdown in overall demand scenario has had an impact on the near term revenue growth rates of Page industries resulting in downgrades to our estimates by 4-5%.
EBITDA (Rs mn) 3,932 5,353 4,177 5,554 -5.9% -3.6%
EBITDA margin (%) 21.0% 21.6% 21.3% 21.4% (25.0) 25.9
PBT (Rs mn) 3,708 5,158 3,942 5,346 -5.9% -3.5%
PAT (Rs mn) 2,485 3,507 2,641 3,635 -5.9% -3.5%
EPS (Rs) 223 314 237 326 -5.9% -3.5%
TTK Prestige
Recommendation BUY BUY TP (Rs) 4398 4,437 -1% Revenues (Rs mn) 15,441 18,628 15,976 19,503 -3.4% -4.5%
We have rolled forward our TP; we cut the revenue forecasts on account of delayed revival in demand momentum (expected in 1HFY17). We believe that the slowdown has had a magnified effect on the other players in the home appliances segment and hence TTK has retained its market share. On account of negative operating leverage we build in EBITDA margin contraction in FY16/17.
EBITDA (Rs mn) 1,861 2,487 1,973 2,643 -5.7% -5.9%
EBITDA margin (%) 12.1% 13.4% 12.4% 13.6% (30) (20)
PBT (Rs mn) 1,742 2,437 1,855 2,593 -6.1% -6.0%
PAT (Rs mn) 1,202 1,682 1,270 1,776 -5.4% -5.3%
EPS (Rs) 103 144 109 153 -5.4% -5.3%
Source: Company, Ambit Capital research
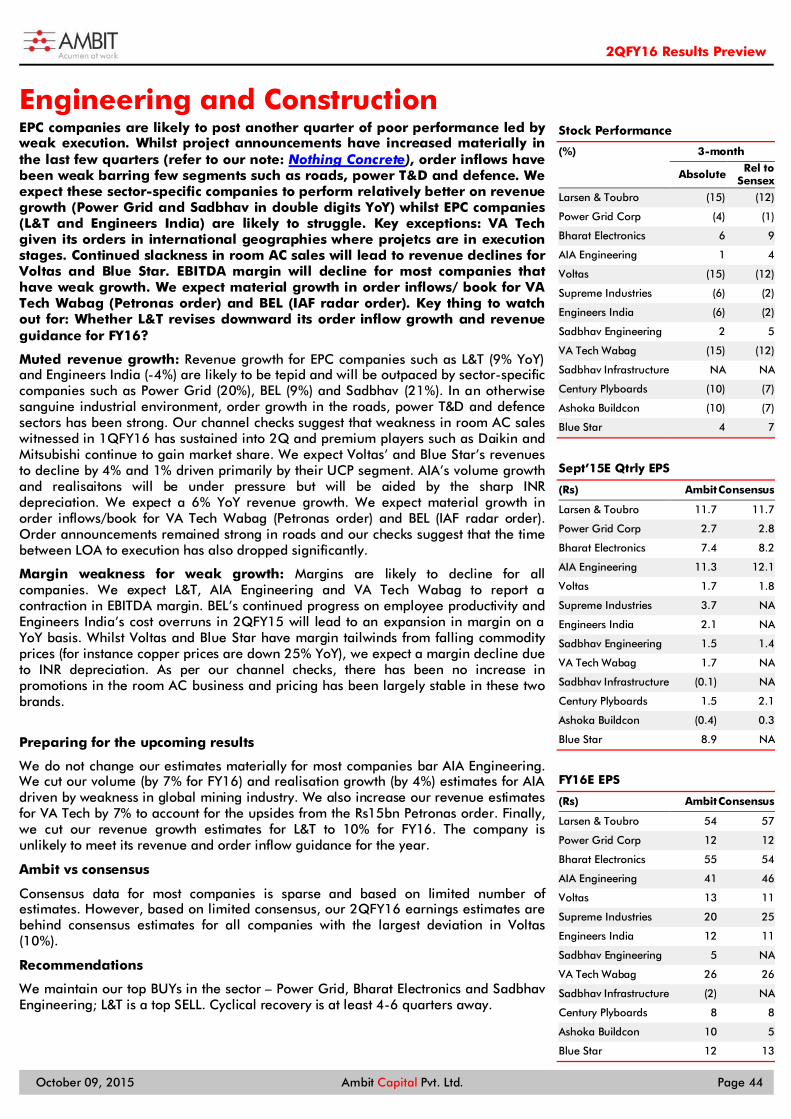
2QFY16 Results Preview
October 09, 2015 Ambit Capital Pvt. Ltd. Page 44
Engineering and Construction EPC companies are likely to post another quarter of poor performance led by weak execution. Whilst project announcements have increased materially in the last few quarters (refer to our note: Nothing Concrete), order inflows have been weak barring few segments such as roads, power T&D and defence. We expect these sector-specific companies to perform relatively better on revenue growth (Power Grid and Sadbhav in double digits YoY) whilst EPC companies (L&T and Engineers India) are likely to struggle. Key exceptions: VA Tech given its orders in international geographies where projetcs are in execution stages. Continued slackness in room AC sales will lead to revenue declines for Voltas and Blue Star. EBITDA margin will decline for most companies that have weak growth. We expect material growth in order inflows/ book for VA Tech Wabag (Petronas order) and BEL (IAF radar order). Key thing to watch out for: Whether L&T revises downward its order inflow growth and revenue guidance for FY16?
Muted revenue growth: Revenue growth for EPC companies such as L&T (9% YoY) and Engineers India (-4%) are likely to be tepid and will be outpaced by sector-specific companies such as Power Grid (20%), BEL (9%) and Sadbhav (21%). In an otherwise sanguine industrial environment, order growth in the roads, power T&D and defence sectors has been strong. Our channel checks suggest that weakness in room AC sales witnessed in 1QFY16 has sustained into 2Q and premium players such as Daikin and Mitsubishi continue to gain market share. We expect Voltas’ and Blue Star’s revenues to decline by 4% and 1% driven primarily by their UCP segment. AIA’s volume growth and realisaitons will be under pressure but will be aided by the sharp INR depreciation. We expect a 6% YoY revenue growth. We expect material growth in order inflows/book for VA Tech Wabag (Petronas order) and BEL (IAF radar order). Order announcements remained strong in roads and our checks suggest that the time between LOA to execution has also dropped significantly.
Margin weakness for weak growth: Margins are likely to decline for all companies. We expect L&T, AIA Engineering and VA Tech Wabag to report a contraction in EBITDA margin. BEL’s continued progress on employee productivity and Engineers India’s cost overruns in 2QFY15 will lead to an expansion in margin on a YoY basis. Whilst Voltas and Blue Star have margin tailwinds from falling commodity prices (for instance copper prices are down 25% YoY), we expect a margin decline due to INR depreciation. As per our channel checks, there has been no increase in promotions in the room AC business and pricing has been largely stable in these two brands.
Preparing for the upcoming results
We do not change our estimates materially for most companies bar AIA Engineering. We cut our volume (by 7% for FY16) and realisation growth (by 4%) estimates for AIA driven by weakness in global mining industry. We also increase our revenue estimates for VA Tech by 7% to account for the upsides from the Rs15bn Petronas order. Finally, we cut our revenue growth estimates for L&T to 10% for FY16. The company is unlikely to meet its revenue and order inflow guidance for the year.
Ambit vs consensus
Consensus data for most companies is sparse and based on limited number of estimates. However, based on limited consensus, our 2QFY16 earnings estimates are behind consensus estimates for all companies with the largest deviation in Voltas (10%).
Recommendations
We maintain our top BUYs in the sector – Power Grid, Bharat Electronics and Sadbhav Engineering; L&T is a top SELL. Cyclical recovery is at least 4-6 quarters away.
Stock Performance
(%) 3-month
Absolute Rel to Sensex
Larsen & Toubro (15) (12)
Power Grid Corp (4) (1)
Bharat Electronics 6 9
AIA Engineering 1 4
Voltas (15) (12)
Supreme Industries (6) (2)
Engineers India (6) (2)
Sadbhav Engineering 2 5
VA Tech Wabag (15) (12)
Sadbhav Infrastructure NA NA
Century Plyboards (10) (7)
Ashoka Buildcon (10) (7)
Blue Star 4 7
Sept’15E Qtrly EPS
(Rs) Ambit Consensus
Larsen & Toubro 11.7 11.7
Power Grid Corp 2.7 2.8
Bharat Electronics 7.4 8.2
AIA Engineering 11.3 12.1
Voltas 1.7 1.8
Supreme Industries 3.7 NA
Engineers India 2.1 NA
Sadbhav Engineering 1.5 1.4
VA Tech Wabag 1.7 NA
Sadbhav Infrastructure (0.1) NA
Century Plyboards 1.5 2.1
Ashoka Buildcon (0.4) 0.3
Blue Star 8.9 NA
FY16E EPS
(Rs) Ambit Consensus
Larsen & Toubro 54 57
Power Grid Corp 12 12
Bharat Electronics 55 54
AIA Engineering 41 46
Voltas 13 11
Supreme Industries 20 25
Engineers India 12 11
Sadbhav Engineering 5 NA
VA Tech Wabag 26 26
Sadbhav Infrastructure (2) NA
Century Plyboards 8 8
Ashoka Buildcon 10 5
Blue Star 12 13
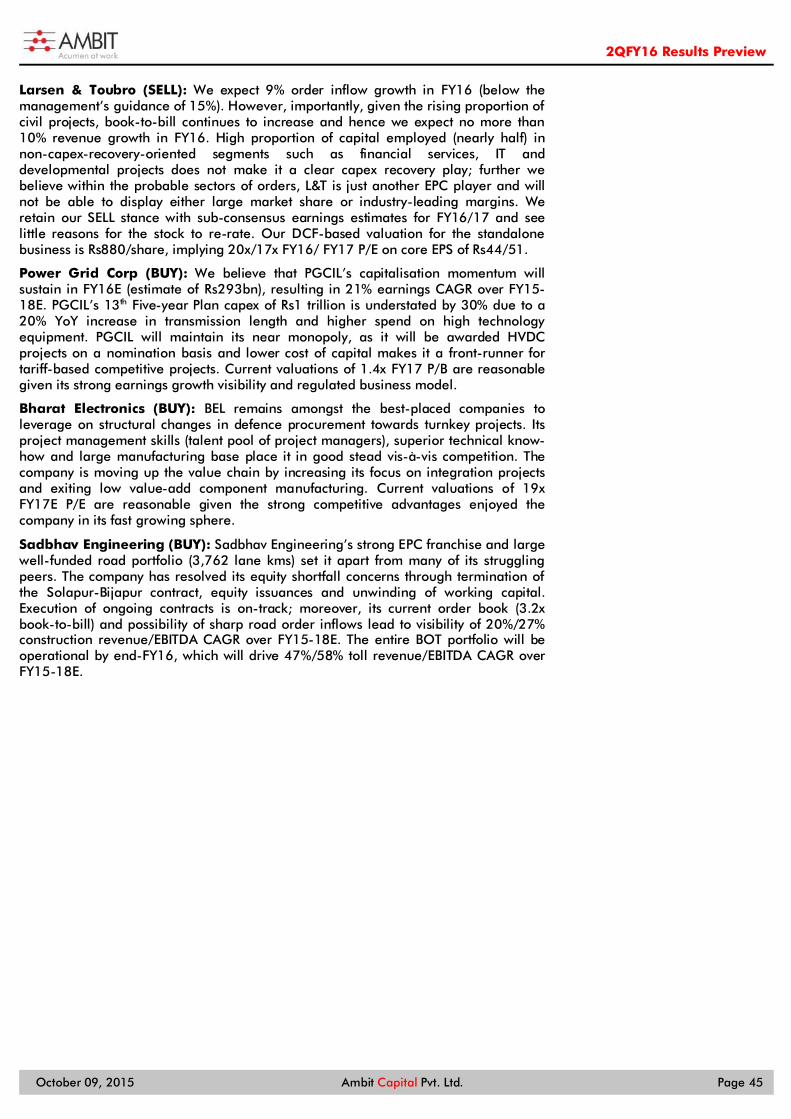
2QFY16 Results Preview
October 09, 2015 Ambit Capital Pvt. Ltd. Page 45
Larsen & Toubro (SELL): We expect 9% order inflow growth in FY16 (below the management’s guidance of 15%). However, importantly, given the rising proportion of civil projects, book-to-bill continues to increase and hence we expect no more than 10% revenue growth in FY16. High proportion of capital employed (nearly half) in non-capex-recovery-oriented segments such as financial services, IT and developmental projects does not make it a clear capex recovery play; further we believe within the probable sectors of orders, L&T is just another EPC player and will not be able to display either large market share or industry-leading margins. We retain our SELL stance with sub-consensus earnings estimates for FY16/17 and see little reasons for the stock to re-rate. Our DCF-based valuation for the standalone business is Rs880/share, implying 20x/17x FY16/ FY17 P/E on core EPS of Rs44/51.
Power Grid Corp (BUY): We believe that PGCIL’s capitalisation momentum will sustain in FY16E (estimate of Rs293bn), resulting in 21% earnings CAGR over FY15-18E. PGCIL’s 13th Five-year Plan capex of Rs1 trillion is understated by 30% due to a 20% YoY increase in transmission length and higher spend on high technology equipment. PGCIL will maintain its near monopoly, as it will be awarded HVDC projects on a nomination basis and lower cost of capital makes it a front-runner for tariff-based competitive projects. Current valuations of 1.4x FY17 P/B are reasonable given its strong earnings growth visibility and regulated business model.
Bharat Electronics (BUY): BEL remains amongst the best-placed companies to leverage on structural changes in defence procurement towards turnkey projects. Its project management skills (talent pool of project managers), superior technical know-how and large manufacturing base place it in good stead vis-à-vis competition. The company is moving up the value chain by increasing its focus on integration projects and exiting low value-add component manufacturing. Current valuations of 19x FY17E P/E are reasonable given the strong competitive advantages enjoyed the company in its fast growing sphere.
Sadbhav Engineering (BUY): Sadbhav Engineering’s strong EPC franchise and large well-funded road portfolio (3,762 lane kms) set it apart from many of its struggling peers. The company has resolved its equity shortfall concerns through termination of the Solapur-Bijapur contract, equity issuances and unwinding of working capital. Execution of ongoing contracts is on-track; moreover, its current order book (3.2x book-to-bill) and possibility of sharp road order inflows lead to visibility of 20%/27% construction revenue/EBITDA CAGR over FY15-18E. The entire BOT portfolio will be operational by end-FY16, which will drive 47%/58% toll revenue/EBITDA CAGR over FY15-18E.

2QFY16 Results Preview
October 09, 2015 Ambit Capital Pvt. Ltd. Page 46
AIA Engineering (AIAE IN, mcap: US$1.5bn, SELL, TP: Rs1,050, 5% upside)
Whilst AIA’s strong competitive positioning in the high-chrome grinding media segment remains intact and the company should potentially benefit from INR depreciation, the weakness in the global mining industry should impact volume growth in FY16. In its recent earnings call, the company said it will pursue aggressive pricing as it looks to enter new markets. Hence, we downgrade our FY16 volume growth (to 3% from 10% earlier) and realisation estimates (to -1% YoY from 3%). Global copper and iron ore mining production growth has decelerated over the past two years driven by lower demand/declining prices and should impact the pace of conversion to high-chrome media. During the previous meltdown in global commodity prices, AIA found it difficult to break into mining clients.
We downgrade our revenue/ EBITDA/ EPS estimates by 10-20% for FY16/ FY17 driven by lower volumes and realisations. Aggressive pricing should result in margin contraction. However, there are no downgrades to our TP driven by quarterly roll-over and increase in long term estimates to account for the delay in conversion process.
Exhibit 23: Change in estimates
Old New Changes
Rs mn FY16E FY17E FY16E FY17E FY16E FY17E
Volume (ton) 206,212 240,308 192,504 201,684 -6.6% -16.1%
YoY growth 10.0% 16.5% 2.7% 4.8% Of which: Mining volumes (tons) 121,800 151,890 108,276 113,315 -11.1% -25.4%
YoY growth 15% 25% 2% 5% Cement volumes (tons) 69,712 72,836 69,388 72,490 -0.5% -0.5%
YoY growth 4% 4% 3% 4% Utility volumes 14,700 15,582 14,840 15,879 1.0% 1.9%
YoY growth 5% 6% 6% 7% Realization (Rs/kg) 120 126 116 122 -3.3% -3.0%
YoY growth 2.6% 5.0% -0.7% 5.3% Mining realization 113.7 121.1 107.8 114.8 -5.2% -5.2%
YoY growth 6.5% 6.5% 1.0% 6.5% Non-mining realization 128.1 133.2 125.6 130.6 -1.9% -1.9%
YoY growth 3.0% 4.0% 1.0% 4.0% Net Sales 25,469 31,080 22,940 25,227 -9.9% -18.8%
YoY growth 12.7% 22.0% 1.6% 10.0% Total Expenses 18,429 22,555 16,510 18,298 -10.4% -18.9%
Adjusted EBITDA 6,242 7,639 5,592 6,002 -10.4% -21.4%
Adjusted EBITDA margin 25.3% 25.3% 25.3% 24.7% 0 bps -60 bps
Depreciation 609 753 654 777 7.4% 3.1%
EBIT 6,153 7,443 5,556 6,031 -9.7% -19.0%
Interest 33 20 35 26 8.3% 32.4%
PAT 4,284 5,196 3,864 4,203 -9.8% -19.1%
EPS 45.4 55.1 41.0 44.6 -9.8% -19.1%
Source: Company, Ambit Capital research

2QFY16 Results Preview
October 09, 2015 Ambit Capital Pvt. Ltd. Page 47
Exhibit 24: Detailed Sept’15 quarterly estimates
Company name Sept'15 Sept'14 YoY Jun'15 QoQ Comments Larsen & Toubro (standalone)
Sales (Rs mn) 138,614 127,168 9% 107,102 29%
We expect revenue growth to be tepid due to poor execution. L&T has announced orders worth Rs133bn during the quarter, significantly lower than Rs312bn announced in 2QFY15. Hence, expect management to revise its FY16 order inflow guidance (+15% YoY)
EBITDA (Rs mn) 14,139 13,412 5% 9,746 45% EBITDA margin to decline marginally due to lower utilisation of assets.
EBITDA margin (%) 10.2% 10.5% -30 bps 9.1% 110 bps
PBT (Rs mn) 14,589 13,943 5% 9,945 47% Adj. PAT growth of 5% YoY. Reported PAT to be further aided by Rs5.1bn of exceptional income from stake sale in L&T finance. Profit on sale of Chandigarh realty unlikely to impact standalone financials. PAT (Rs mn) 10,941 10,422 5% 7,009 56%
Power Grid Corp (standalone)
Sales (Rs mn) 50,142 41,785 20% 47,176 6% We expect revenue growth to sustain at 20% YoY. We expect a capitalisation of Rs110bn on the back of commissioning of the Agra-Assam project in late September
EBITDA (Rs mn) 43,875 35,903 22% 41,375 6% EBITDA margin to remain steady on a sequential basis - up 160bps YoY EBITDA margin (%) 87.5% 85.9% 160 bps 87.7% -20 bps
PBT (Rs mn) 17,853 15,203 17% 17,293 3% Higher EBITDA flows through to the PBT and PAT
PAT (Rs mn) 14,104 12,077 17% 13,665 3% Bharat Electronics (standalone)
Sales (Rs mn) 14,079 12,940 9% 10,953 29% Supply constraints for Akash Missle project was resolved in 3QFY15; Order inflows to increase materially driven by large IAF order of Rs80bn
EBITDA (Rs mn) 1,549 1,189 30% (54) NA Continued progress on the employee productivity front should yield to margin benefits EBITDA margin (%) 11.0% 9.2% 180 bps -0.5% NA
PBT (Rs mn) 2,323 1,917 21% 798 191% Higher EBITDA to flow through to PBT andPAT
PAT (Rs mn) 1,781 1,470 21% 607 193%
AIA Engineering
Sales (Rs mn) 6,079 5,724 6% 5,271 15% A tepid volume growth and marginal decline in realisations on a constant currency basis will lead to a weak topline growth on a YoY basis
EBITDA (Rs mn) 1,550 1,478 5% 1,459 6% The management had indicated pricing aggression to enter new markets. We expect margins to decline due to this. EBITDA margin (%) 25.5% 25.8% -30 bps 27.7% -220 bps
PBT (Rs mn) 1,483 1,450 2% 1,487 0% We expect other income to be lower on a YoY basis due to the impact of forex gains/ (losses) PAT (Rs mn) 1,068 1,081 -1% 1,028 4%
Voltas
Sales (Rs mn) 9,407 9,847 -4% 15,983 -41%
Recent channel checks suggest continued decline in the room AC industry with growing market share for premium brands. We expect UCP business to decline by 10% YoY. Expect order inflow growth to be storng led by the Doha Festival City project
EBITDA (Rs mn) 674 778 -13% 1,310 -49% Margins to decline led by the UCP segment led by INR depreciation. We estimate stable margins for the UMP business EBITDA margin (%) 7.2% 7.9% -70 bps 8.2% -100 bps
PBT (Rs mn) 759 853 -11% 1,436 -47% 2QFY16 tax rate was high at 41%. Hence, we expect a PAT growth of 9% despite a PBT decline PAT (Rs mn) 547 499 9% 1,029 -47%
Supreme Industries
Sales (Rs mn) 8,070 7,596 6% 12,780 -37%
Volumes grew in double digits in pipes, led by market share gains and better reach. However, marginal reduction in realisation due to lower PVC prices dragged revenue growth . Hence revenue growth will remain in single digits
EBITDA (Rs mn) 1,157 814 42% 2,579 -55% EBITDA margin growth is on a low base of last year, wherein inventory adjustments had led a sharp decline in EBITDA margins EBITDA margin (%) 14.3% 10.7% 360 bps 20.2% -580 bps
PBT (Rs mn) 706 331 113% 2,124 -67% PAT growthh is a function of significant improvement in EBITDA margin
PAT (Rs mn) 504 251 101% 1,598 -68%
Source: Company, Ambit Capital research
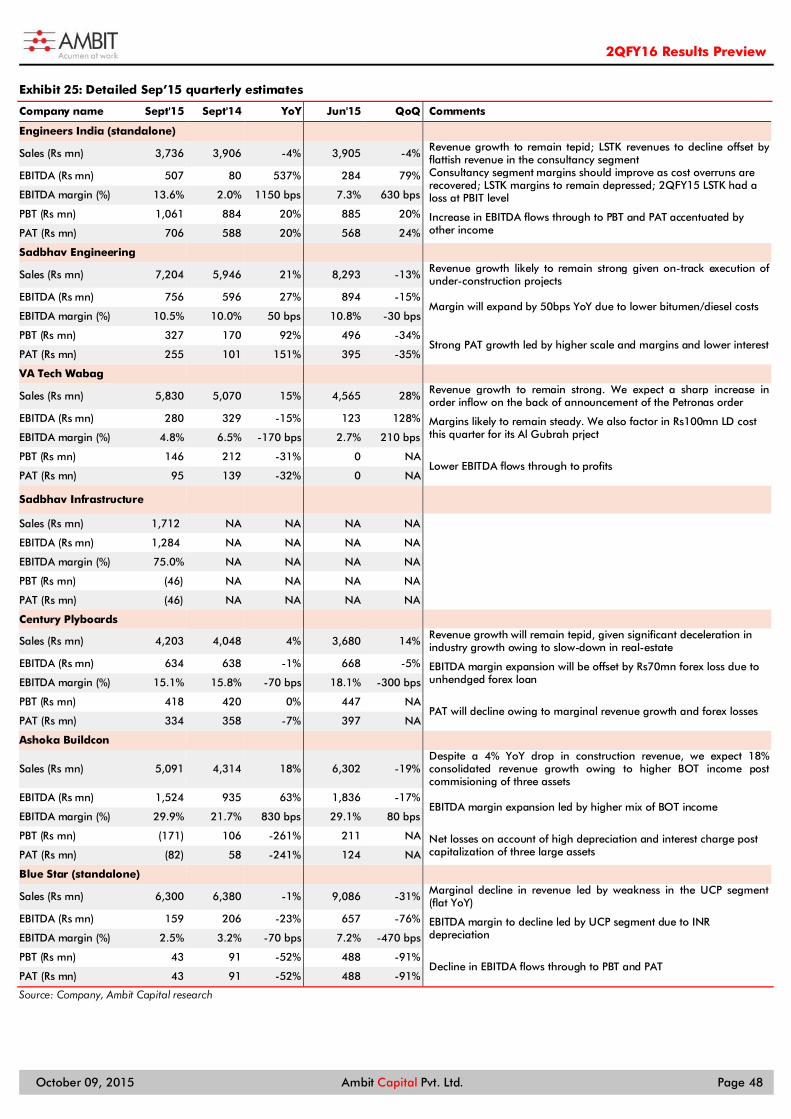
2QFY16 Results Preview
October 09, 2015 Ambit Capital Pvt. Ltd. Page 48
Exhibit 25: Detailed Sep’15 quarterly estimates
Company name Sept'15 Sept'14 YoY Jun'15 QoQ Comments
Engineers India (standalone)
Sales (Rs mn) 3,736 3,906 -4% 3,905 -4% Revenue growth to remain tepid; LSTK revenues to decline offset by flattish revenue in the consultancy segment
EBITDA (Rs mn) 507 80 537% 284 79% Consultancy segment margins should improve as cost overruns are recovered; LSTK margins to remain depressed; 2QFY15 LSTK had a loss at PBIT level EBITDA margin (%) 13.6% 2.0% 1150 bps 7.3% 630 bps
PBT (Rs mn) 1,061 884 20% 885 20% Increase in EBITDA flows through to PBT and PAT accentuated by other income PAT (Rs mn) 706 588 20% 568 24%
Sadbhav Engineering
Sales (Rs mn) 7,204 5,946 21% 8,293 -13% Revenue growth likely to remain strong given on-track execution of under-construction projects
EBITDA (Rs mn) 756 596 27% 894 -15% Margin will expand by 50bps YoY due to lower bitumen/diesel costs
EBITDA margin (%) 10.5% 10.0% 50 bps 10.8% -30 bps
PBT (Rs mn) 327 170 92% 496 -34% Strong PAT growth led by higher scale and margins and lower interest
PAT (Rs mn) 255 101 151% 395 -35%
VA Tech Wabag
Sales (Rs mn) 5,830 5,070 15% 4,565 28% Revenue growth to remain strong. We expect a sharp increase in order inflow on the back of announcement of the Petronas order
EBITDA (Rs mn) 280 329 -15% 123 128% Margins likely to remain steady. We also factor in Rs100mn LD cost this quarter for its Al Gubrah prject EBITDA margin (%) 4.8% 6.5% -170 bps 2.7% 210 bps
PBT (Rs mn) 146 212 -31% 0 NA Lower EBITDA flows through to profits
PAT (Rs mn) 95 139 -32% 0 NA
Sadbhav Infrastructure
Sales (Rs mn) 1,712 NA NA NA NA
EBITDA (Rs mn) 1,284 NA NA NA NA
EBITDA margin (%) 75.0% NA NA NA NA
PBT (Rs mn) (46) NA NA NA NA
PAT (Rs mn) (46) NA NA NA NA
Century Plyboards
Sales (Rs mn) 4,203 4,048 4% 3,680 14% Revenue growth will remain tepid, given significant deceleration in industry growth owing to slow-down in real-estate
EBITDA (Rs mn) 634 638 -1% 668 -5% EBITDA margin expansion will be offset by Rs70mn forex loss due to unhendged forex loan EBITDA margin (%) 15.1% 15.8% -70 bps 18.1% -300 bps
PBT (Rs mn) 418 420 0% 447 NA PAT will decline owing to marginal revenue growth and forex losses
PAT (Rs mn) 334 358 -7% 397 NA
Ashoka Buildcon
Sales (Rs mn) 5,091 4,314 18% 6,302 -19% Despite a 4% YoY drop in construction revenue, we expect 18% consolidated revenue growth owing to higher BOT income post commisioning of three assets
EBITDA (Rs mn) 1,524 935 63% 1,836 -17% EBITDA margin expansion led by higher mix of BOT income
EBITDA margin (%) 29.9% 21.7% 830 bps 29.1% 80 bps
PBT (Rs mn) (171) 106 -261% 211 NA Net losses on account of high depreciation and interest charge post capitalization of three large assets PAT (Rs mn) (82) 58 -241% 124 NA
Blue Star (standalone)
Sales (Rs mn) 6,300 6,380 -1% 9,086 -31% Marginal decline in revenue led by weakness in the UCP segment (flat YoY)
EBITDA (Rs mn) 159 206 -23% 657 -76% EBITDA margin to decline led by UCP segment due to INR depreciation EBITDA margin (%) 2.5% 3.2% -70 bps 7.2% -470 bps
PBT (Rs mn) 43 91 -52% 488 -91% Decline in EBITDA flows through to PBT and PAT
PAT (Rs mn) 43 91 -52% 488 -91%
Source: Company, Ambit Capital research

2QFY16 Results Preview
October 09, 2015 Ambit Capital Pvt. Ltd. Page 49
Exhibit 26: Change in estimates
New Estimates Old Estimates Change Comments
FY16E FY17E FY16E FY17E FY16E FY17E
Larsen & Toubro
Recommendation SELL SELL
TP (Rs) 1,420 1,420 0% We maintain our TP
Revenues (Rs mn) 624,265 711,560 646,379 764,058 -3% -7% We cut our revenue estimates by 3-7%; the company will at best achieve a double digit growth in FY16
EBITDA (Rs mn) 70,339 79,023 75,280 89,150 -7% -11% We cut margins to reflect the poor growth. We do not expect margins to improve over FY15 levels EBITDA margin (%) 11.3% 11.1% 11.6% 11.7% -40 bps -60 bps
PBT (Rs mn) 67,607 77,544 74,287 86,795 -9% -11%
PAT (Rs mn) 50,541 57,194 49,772 58,153 2% -2% Lower EBITDA is mitigated by other income and tax rate EPS (Rs) 54.0 61.1 53.4 62.4 1% -2%
Power Grid Corp
Recommendation BUY BUY
TP (Rs) 175 171 2% We marginally upgrade our T on the back of a roll-over
Revenues (Rs mn) 215,414 255,276 213,348 253,484 1% 1% Our revenue estimates are increased slightly
EBITDA (Rs mn) 187,348 222,865 184,562 220,152 2% 1% Improving efficiencies drives EBITDA margin upgrades EBITDA margin (%) 87.0% 87.3% 86.5% 86.9% 50 bps 50 bps
PBT (Rs mn) 79,694 98,386 77,759 96,538 2% 2%
Superior margins flows through to profits PAT (Rs mn) 65,101 80,125 63,525 78,625 2% 2%
EPS (Rs) 12.44 15.32 12.14 15.03 2% 2%
Bharat Electronics
Recommendation BUY BUY
TP (Rs) 1,390 1,347 3% We marginally upgrade our TP
Revenues (Rs mn) 79,626 92,090 79,626 92,090 0% 0%
We increase order inflow estimate for FY16 from Rs120bn earlier to Rs140bn but lower our expectations for growth in FY17. We maintain our revenue growth estimates for FY16-17
EBITDA (Rs mn) 13,643 15,973 13,643 15,973 0% 0%
EBITDA margin (%) 17.1% 17.3% 17.1% 17.3% 00 bps 00 bps
PBT (Rs mn) 16,729 19,599 16,729 19,599 0% 0%
PAT (Rs mn) 13,218 15,485 13,218 15,485 0% 0%
EPS (Rs) 55.1 64.5 55.07 64.52 0% 0%
AIA Engineering
Recommendation SELL SELL
TP (Rs) 1,050 1,038 1%
We largely maintain our TP for AIA as roll-over benefits are offset by cut in earnings. We also increase our long term estimates
Revenues (Rs mn) 22,102 24,300 24,670 30,194 -10% -20%
We cut our revenue estimates by 10-20% due to (1) cut in volume growth estimates for FY16 from 10% to 3% and (2) cut in realisation estimates from 3% to -1% driven by weakness in global mining industry
EBITDA (Rs mn) 5,592 6,002 6,242 7,639 -10% -21% We marginally reduce our FY16 margin estimates to reflect the lower volumes EBITDA margin (%) 25.3% 24.7% 25.3% 25.3% 00 bps -60 bps
PBT (Rs mn) 5,521 6,005 6,120 7,423 -10% -19%
Lower EBITDA flows through to PBT and PAT PAT (Rs mn) 3,864 4,203 4,284 5,196 -10% -19%
EPS (Rs) 40.98 44.57 45.43 55.10 -10% -19%
Source: Company, Ambit Capital research

2QFY16 Results Preview
October 09, 2015 Ambit Capital Pvt. Ltd. Page 50
Exhibit 27: Change in estimates
New Estimates Old Estimates Change Comments
FY16E FY17E FY16E FY17E FY16E FY17E
Engineers India
Recommendation SELL SELL
TP (Rs) 220 220 0% We maintain our TP for EIL
Revenues (Rs mn) 18,389 21,932 18,389 21,932 0% 0%
EBITDA (Rs mn) 2,835 3,875 2,832 3,884 0% 0%
EBITDA margin (%) 15.4% 17.7% 15.4% 17.7% 00 bps 00 bps
PBT (Rs mn) 5,758 6,823 6,057 7,144 -5% -4% We lower our earnings estimates marginally due to lower other income estimates PAT (Rs mn) 3,915 4,640 4,089 4,822 -4% -4%
EPS (Rs) 11.6 13.8 12.13 14.31 -4% -4%
VA Tech Wabag
Recommendation SELL SELL
TP (Rs) 720 690 4% We increase TP by 4% to reflect the higher earnings in FY17
Revenues (Rs mn) 28,491 36,995 28,507 34,718 0% 7% We increase FY17 revenue estimates on the back of the Rs15bn Patroneas order win.
EBITDA (Rs mn) 2,488 3,370 2,490 3,205 0% 5% We largely maintain our revenue estimates
EBITDA margin (%) 8.7% 9.1% 8.7% 9.2% 00 bps -10 bps
PBT (Rs mn) 2,058 2,865 2,056 2,732 0% 5%
Higher EBITDA flows through to PBT and PAT PAT (Rs mn) 1,416 1,966 1,415 1,875 0% 5%
EPS (Rs) 25.96 36.04 25.94 34.38 0% 5%
Source: Company, Ambit Capital research

2QFY16 Results Preview
October 09, 2015 Ambit Capital Pvt. Ltd. Page 51
Healthcare Pharmaceutical companies under our coverage would likely report a revenue growth of 28% YoY in 2QFY16 driven by the India business and one-off product revenue from the US business. On the flipside, increased competition could erode the US base business revenues and adverse currency movements in EMs could hurt revenue and margins. Therefore, EBITDA margins are likely to compress by 47bps YoY for our coverage universe. We believe Torrent and Cipla could positively surprise the market led by higher-than-expected sales and margins in gAbilify and Pulmicort sales respectively. On the other hand, Sun and IPCA could surprise us negatively due to continued remediation efforts at Halol for Sun and partial booking of institutional sales for IPCA. Key events to watch out for: Dr. Reddy – Status of Srikakulum facility and update on transfer of key product filings; IPCA – Clearance from WHO for institutional sales; Sun – Guidance for FY16E and status of remediation efforts at Halol and Ranbaxy; Cipla – Expectation of gSeritide launch in UK. Revenue growth momentum to continue: We expect our coverage universe to report revenue growth of 28% YoY. Whilst India business would drive a substantial portion of revenue growth in 2QFY16, for select few companies (Torrent, Cipla and Cadila), one-off products are likely to provide growth in US generics business. For other companies, due to incremental competition in base business partially offset by new product launches, we expect muted revenue growth. Specifically for IPCA we expect revenue growth of 5% YoY due to halt in US sales (except profit from HCQS sales) and partial resumption of sales in Africa institution business. In US, New product launches to offset base business erosion; adverse currency movement to result pressure in EM business: We expect margins for our coverage universe to compress by 487bps YoY. The margin compression is largely due to a decline in gross margins (Lupin is facing incremental competition in Suprax, Cymbalta and Niaspan, and Dr. Reddy’s is facing competition in Dacogen and Aurobindo in Cymbalta). Also, adverse EM currency movement will impact revenue and margins (specifically for Dr. Reddy, IPCA, Cadila and Torrent Pharma). However, the adverse impact of incremental competition and pressure in EM business would be offset by new product launches and a ramp up in India businesses which would provide operating leverage. The USD/INR rate realisation in 2QFY16 is likely to be higher than 1QFY15 at Rs65/USD. Higher R&D spend across the board is also likely to be a material headwind to profitability.
Preparing for the upcoming results We have not changed our recommendations. We had recently updated our target prices for Lupin, Cadila, Torrent Pharma, Dr. Reddy and IPCA. We have recently initiated coverage on Cipla. Ambit vs consensus Based on the limited consensus data for 2QFY16, our earnings estimates are 2-20% ahead of consensus estimates for Aurobindo and Cipla. For Torrent Pharma, we are 70% ahead of consensus estimates as we expect one off sales from gAbilify to continue in 2QFY16 and estimate annual tax rate of 25% (as compared to 48% tax rate in 1QFY16). Our earnings estimates are 8-35% below consensus on Sun, IPCA, Dr. Reddy’s, Cadila and Lupin. We believe IPCA’s consensus estimates are not meaningful due to the low number of estimates. Recommendations – IPCA is our top BUY idea; material upside in Torrent Pharma vs consensus estimates We highlight IPCA as our top pick in the healthcare sector. We believe the stock is experiencing lollapalooza effect (decline in earnings as well as multiple de-rating). With normalised earnings expected from 3QFY16 led by profits from HCQS sales and resumption of institutional business, we expect the lollapalooza effect to reverse (increase in earnings followed by multiple re-rating). Our DCF analysis suggests a fair value of Rs952, implying 19x FY17E EPS. IPCA’s strong positioning in the DNA and 5’R’ frameworks comforts us on the sustainability of earnings and quality of growth that the company has reported.
Stock Performance
(%) 3-month
Absolute Rel to Sensex
Sun Pharmaceuticals 3.5 8.1
IPCA 4.7 9.2
Dr. Reddy 14.3 18.8
Lupin 8.1 12.6
Cadila 16.3 20.8
Aurobindo 4.3 8.8
Torrent Pharma 18.9 23.4
Cipla 1.6 6.1
Sep ’16E Qtrly EPS
Company Ambit Consensus
Sun Pharma 4.3 6.7
IPCA 6.0 6.6
Dr. Reddy 35.3 38.1
Lupin 13.3 14.6
Cadila 3.3 3.6
Aurobindo 8.0 7.8
Torrent Pharma 35.3 20.6
Cipla 7.3 6.2
FY16E EPS
Company Ambit Consensus
Sun Pharma 35.2 23.5
IPCA 31.5 25.5
Dr. Reddy 113.5 155.9
Lupin 63.0 56.4
Cadila 14.6 14.9
Aurobindo 33.8 34.6
Torrent Pharma 110.1 78.6

2QFY16 Results Preview
October 09, 2015 Ambit Capital Pvt. Ltd. Page 52
For 2QFY16, we expect Torrent Pharma to report earnings materially higher than consensus estimates (our EPS estimate is 71% ahead of consensus). We expect Torrent Pharma to report yet another quarter of one-off revenue of US$100mn from sale of gAbilify. Despite one more generic player (Apotex) entering the market during Q2FY16, our channel checks suggest that there has be no material decline in prices. Further, Torrent Pharma has maintained market share throughout 2QFY16 (~15%), with Apotex eating away the market share of Alembic.
Exhibit 28: Detailed Sep '15E quarterly estimates
Company name Sep'15 Sep'14 Jun'15 YoY QoQ Comments
Sun Pharma
Sales (Rs mn) 69,850 47,695 62,478 46% 12% Marginal recovery in US business as remediation efforts at the Halol facility comes to a close. Ranbaxy consolidation drives YoY increase.
EBITDA (Rs mn) 21,388 21,801 11,871 -2% 80% We pencil in EBITDA margin expansion of 325bps QoQ as some one-off integration costs that were booked during 1Q are unlikely to continue. EBITDA margin (%) 30.6% 45.7% 19.0% -1509bps 1162bps
PBT (Rs mn) 17,988 20,412 8,671 -12% 107% Sun is likely to report PAT of Rs13.2bn in 2QFY16 (+175% QoQ, -16% YoY) assuming no one offs below EBITDA which are unpredictable. PAT (Rs mn) 13,189 15,725 4,804 -16% 175%
IPCA
Sales (Rs mn) 8,162 7,749 7,510 5% 9%
We expect sale in the institutional business to recover as the company resumed sending products to WHO designated geographies. Also, HCQS profit share is likely to trickle in from 2Q. However, domestic business and branded exports are likely to disappoint due to weak malaria season in India and currency fluctuations respectively.
EBITDA (Rs mn) 1,483 1,348 822 10% 80% We expect EBITDA margins to expand by 723bps QoQ largely led by HCQS and institutional sales. EBITDA margin (%) 18.2% 17.4% 10.9% 78bps 723bps
PBT (Rs mn) 1,030 888 271 16% 280% IPCA is likely to report PAT of Rs752mn in 2QFY16.
PAT (Rs mn) 752 613 189 23% 298%
Dr. Reddy
Sales (Rs mn) 40,504 35,878 38,102 13% 6% We expect 8% QoQ growth in sales for DRRD in 2QFY16 largely led by US sales (+33% YoY). India business is expected to report 15% YoY growth.
EBITDA (Rs mn) * 10,459 8,422 8,499 24% 23% Expect EBITDA margins to decline 265bps sequentially due to Russian Ruble and Vietnam Bolivar impact. EBITDA margin (%) 25.8% 23.5% 22.3% 235bps 352bps
PBT (Rs mn) 7,721 6,937 5,671 11% 36% DRRD is likely to report PAT of Rs6bn in 2QFY16
PAT (Rs mn) 6,022 5,741 4,423 5% 36%
Lupin
Sales (Rs mn) 33,659 31,168 32,966 8% 2%
We expect Lupin's sales to increase 9% QoQ largely led by growth in India business, partially offset by lower US branded sales due to Suprax going off patent . We estimate US generic sales of Rs13.5bn (+13% QoQ) due to a few launches during 2QFY16.
EBITDA (Rs mn) 8,652 7,760 8,797 11% -2% We expect EBITDA margins to expand 161bps QoQ to 25.7% led by normalisation in margins and better performance by high margin India business. EBITDA margin (%) 25.7% 24.9% 26.7% 81bps -98bps
PBT (Rs mn) 8,577 8,320 8,048 3% 7% We expect Lupin to report PAT of Rs6bn (+14% QoQ).
PAT (Rs mn) 6,004 6,300 5,584 -5% 8%
Cadila
Sales (Rs mn) 24,763 21,080 25,007 17% -1% We pencil US sales growth of +1% QoQ. Also, with normalized base for the domestic market from this quarter onwards, we expect domestic sales growth to be 10% YoY.
EBITDA (Rs mn) 5,684 4,210 6,015 35% -6% As abnormal profits from HCQS were booked in 1QFY16, expect margins to decline by 110bps partially offset by better India business margin EBITDA margin (%) 23.0% 20.0% 24.1% 298bps -110bps
PBT (Rs mn) 4,943 3,453 5,332 43% -7% Cadila is likely to report PAT of Rs3.4bn in 2QFY16
PAT (Rs mn) 3,380 2,781 3,534 22% -4%
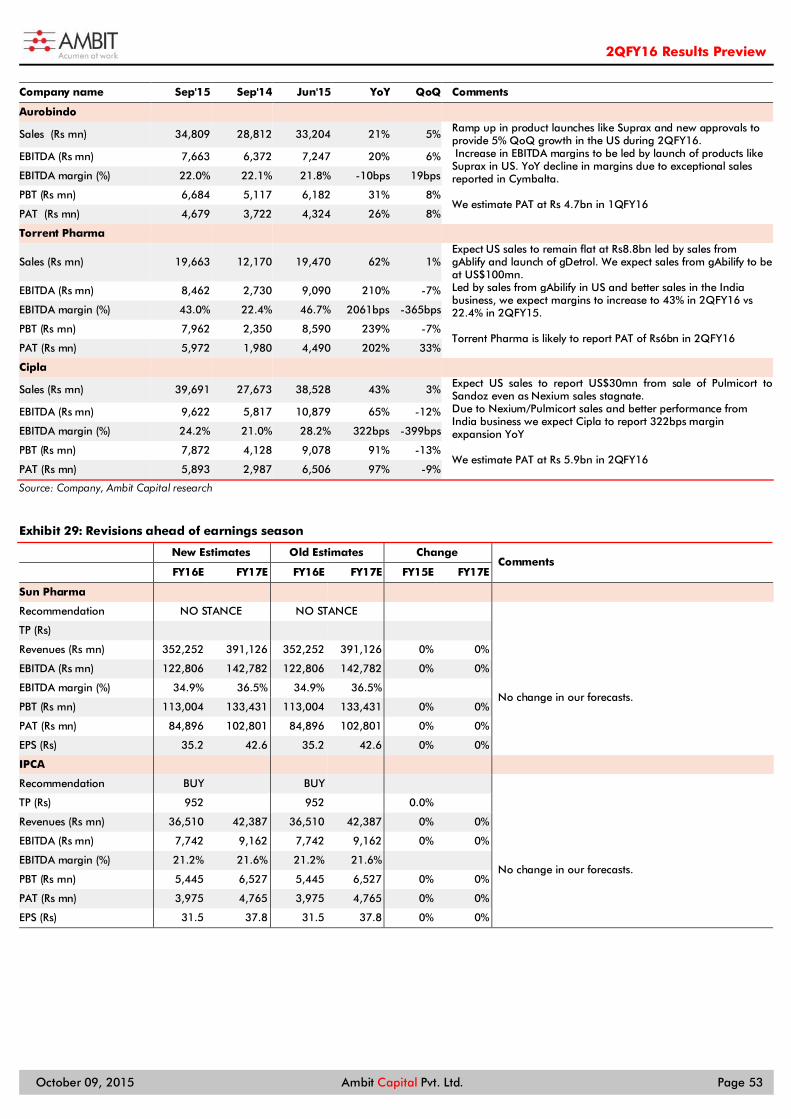
2QFY16 Results Preview
October 09, 2015 Ambit Capital Pvt. Ltd. Page 53
Company name Sep'15 Sep'14 Jun'15 YoY QoQ Comments
Aurobindo
Sales (Rs mn) 34,809 28,812 33,204 21% 5% Ramp up in product launches like Suprax and new approvals to provide 5% QoQ growth in the US during 2QFY16.
EBITDA (Rs mn) 7,663 6,372 7,247 20% 6% Increase in EBITDA margins to be led by launch of products like Suprax in US. YoY decline in margins due to exceptional sales reported in Cymbalta. EBITDA margin (%) 22.0% 22.1% 21.8% -10bps 19bps
PBT (Rs mn) 6,684 5,117 6,182 31% 8% We estimate PAT at Rs 4.7bn in 1QFY16
PAT (Rs mn) 4,679 3,722 4,324 26% 8%
Torrent Pharma
Sales (Rs mn) 19,663 12,170 19,470 62% 1% Expect US sales to remain flat at Rs8.8bn led by sales from gAblify and launch of gDetrol. We expect sales from gAbilify to be at US$100mn.
EBITDA (Rs mn) 8,462 2,730 9,090 210% -7% Led by sales from gAbilify in US and better sales in the India business, we expect margins to increase to 43% in 2QFY16 vs 22.4% in 2QFY15. EBITDA margin (%) 43.0% 22.4% 46.7% 2061bps -365bps
PBT (Rs mn) 7,962 2,350 8,590 239% -7% Torrent Pharma is likely to report PAT of Rs6bn in 2QFY16
PAT (Rs mn) 5,972 1,980 4,490 202% 33%
Cipla
Sales (Rs mn) 39,691 27,673 38,528 43% 3% Expect US sales to report US$30mn from sale of Pulmicort to Sandoz even as Nexium sales stagnate.
EBITDA (Rs mn) 9,622 5,817 10,879 65% -12% Due to Nexium/Pulmicort sales and better performance from India business we expect Cipla to report 322bps margin expansion YoY EBITDA margin (%) 24.2% 21.0% 28.2% 322bps -399bps
PBT (Rs mn) 7,872 4,128 9,078 91% -13% We estimate PAT at Rs 5.9bn in 2QFY16
PAT (Rs mn) 5,893 2,987 6,506 97% -9%
Source: Company, Ambit Capital research
Exhibit 29: Revisions ahead of earnings season
New Estimates Old Estimates Change Comments
FY16E FY17E FY16E FY17E FY15E FY17E
Sun Pharma Recommendation NO STANCE NO STANCE TP (Rs) Revenues (Rs mn) 352,252 391,126 352,252 391,126 0% 0%
No change in our forecasts.
EBITDA (Rs mn) 122,806 142,782 122,806 142,782 0% 0%
EBITDA margin (%) 34.9% 36.5% 34.9% 36.5% PBT (Rs mn) 113,004 133,431 113,004 133,431 0% 0%
PAT (Rs mn) 84,896 102,801 84,896 102,801 0% 0%
EPS (Rs) 35.2 42.6 35.2 42.6 0% 0%
IPCA Recommendation BUY BUY TP (Rs) 952 952 0.0% Revenues (Rs mn) 36,510 42,387 36,510 42,387 0% 0%
No change in our forecasts.
EBITDA (Rs mn) 7,742 9,162 7,742 9,162 0% 0%
EBITDA margin (%) 21.2% 21.6% 21.2% 21.6% PBT (Rs mn) 5,445 6,527 5,445 6,527 0% 0%
PAT (Rs mn) 3,975 4,765 3,975 4,765 0% 0%
EPS (Rs) 31.5 37.8 31.5 37.8 0% 0%

2QFY16 Results Preview
October 09, 2015 Ambit Capital Pvt. Ltd. Page 54
New Estimates Old Estimates Change Comments
FY16E FY17E FY16E FY17E FY15E FY17E
Dr. Reddy Recommendation SELL SELL TP (Rs) 3,300 3,300 Revenues (Rs mn) 160,363 194,009 160,363 194,009 0% 0%
No change in our forecasts.
EBITDA (Rs mn) 33,742 45,563 33,742 45,563 0% 0%
EBITDA margin (%) 21.0% 23.5% 21.0% 23.5% PBT (Rs mn) 24,841 35,938 24,841 35,938 0% 0%
PAT (Rs mn) 19,376 28,031 19,376 28,031 0% 0%
EPS (Rs) 113.5 164.2 113.5 164.2 0% 0%
Lupin Recommendation BUY BUY TP (Rs) 2,186 2,186 Revenues (Rs mn) 153,819 203,146 153,819 203,146 0% 0%
No change in our forecasts.
EBITDA (Rs mn) 45,141 65,084 45,141 65,084 0% 0%
EBITDA margin (%) 29.3% 32.0% 29.3% 32.0% PBT (Rs mn) 40,002 57,843 40,002 57,843 0% 0%
PAT (Rs mn) 28,402 41,069 28,402 41,069 0% 0%
EPS (Rs) 63.0 91.1 63.0 91.1 0% 0%
Cadila Recommendation BUY BUY TP (Rs) 479 479 Revenues (Rs mn) 106,657 132,959 106,657 132,959 0% 0%
No change in our forecasts.
EBITDA (Rs mn) 22,340 29,077 22,340 29,077 0% 0%
EBITDA margin (%) 20.9% 21.9% 20.9% 21.9% PBT (Rs mn) 18,686 25,448 18,686 25,448 0% 0%
PAT (Rs mn) 14,977 20,527 14,977 20,527 0% 0%
EPS (Rs) 14.6 20.1 14.6 20.1 0% 0%
Aurobindo Recommendation SELL SELL TP (Rs) 414 414 Revenues (Rs mn) 136,808 161,507 136,808 161,507 0% 0%
No change in our forecasts.
EBITDA (Rs mn) 30,499 40,098 30,499 40,098 0% 0%
EBITDA margin (%) 22.3% 24.8% 22.3% 24.8% PBT (Rs mn) 25,627 35,413 25,627 35,413 0% 0%
PAT (Rs mn) 19,733 27,268 19,733 27,268 0% 0%
EPS (Rs) 33.8 46.8 33.8 46.8 0% 0%
Torrent Pharma Recommendation BUY BUY TP (Rs) 1,682 1,682 Revenues (Rs mn) 71,743 72,742 71,743 72,742 0% 0%
No change in our forecasts.
EBITDA (Rs mn) 26,272 17,669 26,272 17,669 0% 0%
EBITDA margin (%) 36.6% 24.3% 36.6% 24.3% PBT (Rs mn) 23,317 14,164 23,317 14,164 0% 0%
PAT (Rs mn) 18,632 11,318 18,632 11,318 0% 0%
EPS (Rs) 110.1 66.9 110.1 66.9 0% 0%
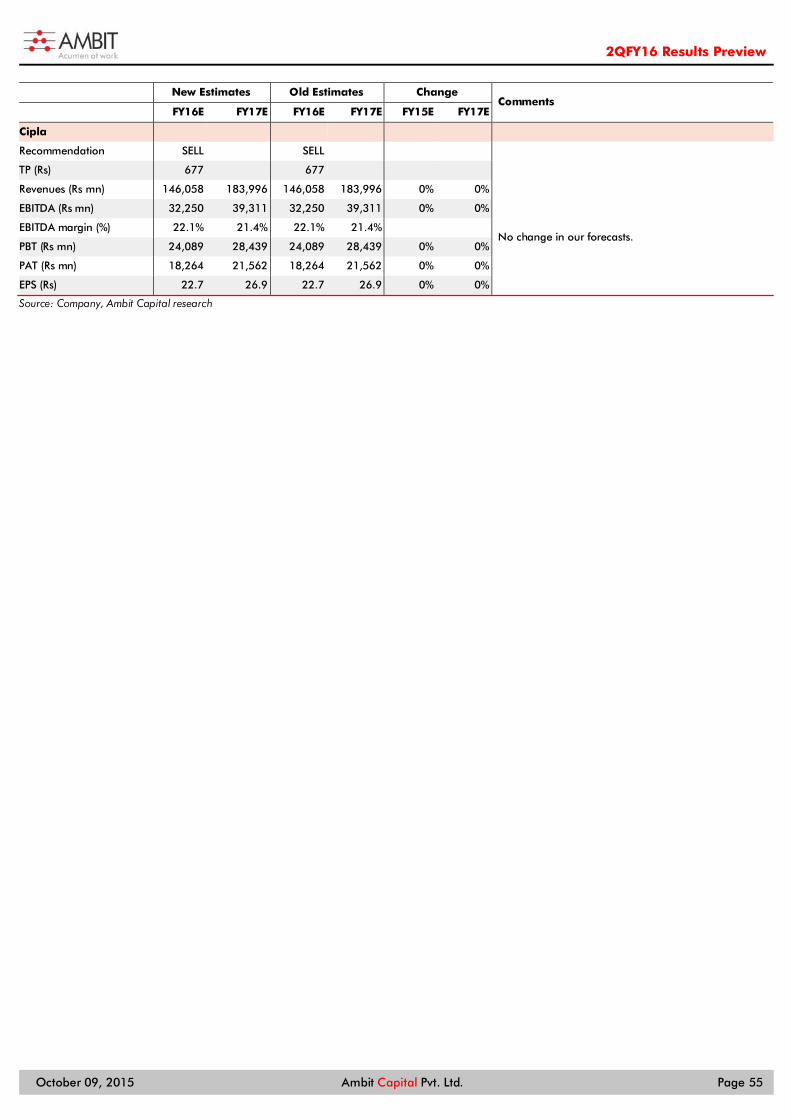
2QFY16 Results Preview
October 09, 2015 Ambit Capital Pvt. Ltd. Page 55
New Estimates Old Estimates Change Comments
FY16E FY17E FY16E FY17E FY15E FY17E
Cipla Recommendation SELL SELL TP (Rs) 677 677 Revenues (Rs mn) 146,058 183,996 146,058 183,996 0% 0%
No change in our forecasts.
EBITDA (Rs mn) 32,250 39,311 32,250 39,311 0% 0%
EBITDA margin (%) 22.1% 21.4% 22.1% 21.4% PBT (Rs mn) 24,089 28,439 24,089 28,439 0% 0%
PAT (Rs mn) 18,264 21,562 18,264 21,562 0% 0%
EPS (Rs) 22.7 26.9 22.7 26.9 0% 0%
Source: Company, Ambit Capital research
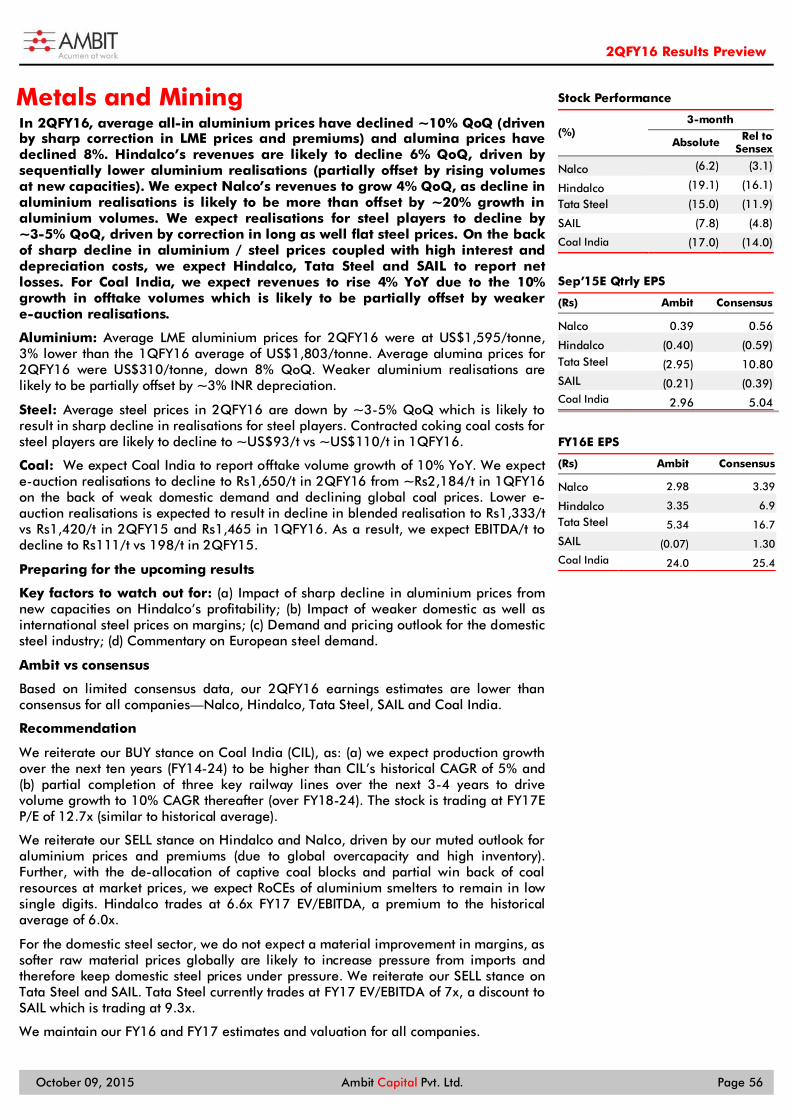
2QFY16 Results Preview
October 09, 2015 Ambit Capital Pvt. Ltd. Page 56
Metals and Mining In 2QFY16, average all-in aluminium prices have declined ~10% QoQ (driven by sharp correction in LME prices and premiums) and alumina prices have declined 8%. Hindalco’s revenues are likely to decline 6% QoQ, driven by sequentially lower aluminium realisations (partially offset by rising volumes at new capacities). We expect Nalco’s revenues to grow 4% QoQ, as decline in aluminium realisations is likely to be more than offset by ~20% growth in aluminium volumes. We expect realisations for steel players to decline by ~3-5% QoQ, driven by correction in long as well flat steel prices. On the back of sharp decline in aluminium / steel prices coupled with high interest and depreciation costs, we expect Hindalco, Tata Steel and SAIL to report net losses. For Coal India, we expect revenues to rise 4% YoY due to the 10% growth in offtake volumes which is likely to be partially offset by weaker e-auction realisations.
Aluminium: Average LME aluminium prices for 2QFY16 were at US$1,595/tonne, 3% lower than the 1QFY16 average of US$1,803/tonne. Average alumina prices for 2QFY16 were US$310/tonne, down 8% QoQ. Weaker aluminium realisations are likely to be partially offset by ~3% INR depreciation.
Steel: Average steel prices in 2QFY16 are down by ~3-5% QoQ which is likely to result in sharp decline in realisations for steel players. Contracted coking coal costs for steel players are likely to decline to ~US$93/t vs ~US$110/t in 1QFY16.
Coal: We expect Coal India to report offtake volume growth of 10% YoY. We expect e-auction realisations to decline to Rs1,650/t in 2QFY16 from ~Rs2,184/t in 1QFY16 on the back of weak domestic demand and declining global coal prices. Lower e-auction realisations is expected to result in decline in blended realisation to Rs1,333/t vs Rs1,420/t in 2QFY15 and Rs1,465 in 1QFY16. As a result, we expect EBITDA/t to decline to Rs111/t vs 198/t in 2QFY15.
Preparing for the upcoming results
Key factors to watch out for: (a) Impact of sharp decline in aluminium prices from new capacities on Hindalco’s profitability; (b) Impact of weaker domestic as well as international steel prices on margins; (c) Demand and pricing outlook for the domestic steel industry; (d) Commentary on European steel demand.
Ambit vs consensus
Based on limited consensus data, our 2QFY16 earnings estimates are lower than consensus for all companies—Nalco, Hindalco, Tata Steel, SAIL and Coal India.
Recommendation
We reiterate our BUY stance on Coal India (CIL), as: (a) we expect production growth over the next ten years (FY14-24) to be higher than CIL’s historical CAGR of 5% and (b) partial completion of three key railway lines over the next 3-4 years to drive volume growth to 10% CAGR thereafter (over FY18-24). The stock is trading at FY17E P/E of 12.7x (similar to historical average).
We reiterate our SELL stance on Hindalco and Nalco, driven by our muted outlook for aluminium prices and premiums (due to global overcapacity and high inventory). Further, with the de-allocation of captive coal blocks and partial win back of coal resources at market prices, we expect RoCEs of aluminium smelters to remain in low single digits. Hindalco trades at 6.6x FY17 EV/EBITDA, a premium to the historical average of 6.0x.
For the domestic steel sector, we do not expect a material improvement in margins, as softer raw material prices globally are likely to increase pressure from imports and therefore keep domestic steel prices under pressure. We reiterate our SELL stance on Tata Steel and SAIL. Tata Steel currently trades at FY17 EV/EBITDA of 7x, a discount to SAIL which is trading at 9.3x.
We maintain our FY16 and FY17 estimates and valuation for all companies.
Stock Performance
(%) 3-month
Absolute Rel to Sensex
Nalco (6.2) (3.1)
Hindalco (19.1) (16.1)
Tata Steel (15.0) (11.9)
SAIL (7.8) (4.8)
Coal India (17.0) (14.0)
Sep’15E Qtrly EPS
(Rs) Ambit Consensus
Nalco 0.39 0.56
Hindalco (0.40) (0.59) Tata Steel (2.95) 10.80 SAIL (0.21) (0.39) Coal India 2.96 5.04
FY16E EPS
(Rs) Ambit Consensus
Nalco 2.98 3.39
Hindalco 3.35 6.9
Tata Steel 5.34 16.7
SAIL (0.07) 1.30 Coal India 24.0 25.4

2QFY16 Results Preview
October 09, 2015 Ambit Capital Pvt. Ltd. Page 57
Exhibit 30: Detailed Sep'15E quarterly estimates
Company Sep'15E Sep'14 Jun'15 YoY QoQ Comments
Nalco Sales (Rs mn) 15,490 19,955 14,913 (22) 4 We expect revenues to decline 22% YoY driven by lower
aluminium as well as alumina realisations. Sequentially, aluminium realisations are likely to decline ~10% QoQ driven by ~10% decline in LME aluminium prices. We expect alumina sales of 200kt vs 220kt in 1QFY16 (down 9% QoQ), which would be offset by higher aluminium sales (~95kt vs 78kt in 1QFY16). We expect EBITDA of Rs1.1bn, down 50% QoQ, mainly due to lower aluminium realisations.
EBITDA (Rs mn) 1,114 4,733 2,237 (76) (50)
EBITDA margin (%) 7.2% 23.7% 15.0% -1653 bps -781 bps
PBT (Rs mn) 1,515 5,382 2,555 (72) (41)
PAT (Rs mn) 1,015 3,405 1,647 (70) (38)
Hindalco
Sales (Rs mn) 80,348 85,543 85,753 (6) (6) Revenues to decline ~6% QoQ as decline in aluminium realisations is partially offset by rising volumes from the Mahan and Aditya smelters. We build in aluminium production of 276kt in 2QFY16 (vs 264kt in 1QFY16) and copper production of 102kt (down 2% QoQ). We expect EBITDA of Rs6.4bn, down 27% QoQ, mainly due to sequentially lower aluminium prices. We expect Hindalco to report loss on a PBT and PAT basis on the back of declining EBITDA and rising interest and depreciation costs for the Mahan and Aditya smelters.
EBITDA (Rs mn) 6,368 8,970 8,773 (29) (27)
EBITDA margin (%) 7.9% 10.5% 10.2% -256 bps -231 bps
PBT (Rs mn) (1,043) 5,386 1,381 (119) (176)
PAT (Rs mn) (827) 5,100 1,072 (116) (177)
Tata Steel
Sales (Rs mn) 307,859 357,771 303,003 (14) 2 We expect India business sales volumes of 2.26mt, up 5% QoQ. We expect Europe business sales volumes of 3.3mt in 2QFY16, down 2% YoY. We expect Indian EBITDA/tonne to decline further to ~Rs7,030/t vs Rs7,891 in 1QFY16 on the back of decline in steel realisations. We factor in EBITDA of US$40/t in 2QFY16 vs US$27/t in 1QFY16.
EBITDA (Rs mn) 25,117 36,428 27,742 (31) (9)
EBITDA margin (%) 8.2% 10.2% 9.2% -202 bps -100 bps
PBT (Rs mn) (663) 13,021 3,951 (105) (117)
PAT (Rs mn) (2,864) 1,093 (923) (362) 210
SAIL
Sales (Rs mn) 105,705 116,787 95,028 (9) 11 We expect sales volumes of 3mt, up 4% YoY as SAIL’s new capacities are gradually ramped up. We expect blended steel realisation for SAIL to decline 9% YoY in 2QFY16 on the back of sharp decline in steel realisations. We expect EBITDA of Rs1,456/tonne, lower than Rs4,553/tonne reported in 2QFY15 but higher than EBITDA loss of Rs304/tonne in 1QFY16.
EBITDA (Rs mn) 4,420 13,364 (817) (67) (641)
EBITDA margin (%) 4.2% 11.4% -0.9% -726 bps 504 bps
PBT (Rs mn) (2,062) 7,509 (7,766) (127) (73)
PAT (Rs mn) (854) 6,495 (3,217) (113) (73)
Coal India
Sales (Rs mn) 162,484 156,780 189,558 4 (14) Coal India has reported offtake of ~121.9mt in 2QFY16, up 10% YoY. Of this we expect ~10% volumes to be sold in e-auction and hence, we build in e-auction volumes of 13mt in 2QFY16 vs 10mt in 2QFY15 (as e-auction volumes were low in 2QFY15). However, we expect e-auction realisations to decline to Rs1,650/t in 2QFY16 vs Rs2,496/tonne in 2QFY15 on the back of weak domestic demand and declining global coal prices. Lower e-auction realisations are likely to result in a decline in blended realisation to Rs1,333/t vs Rs1,420/t in 2QFY15. Stronger volumes partially offset by lower e-auction realisations is likely to result in 4% revenue growth but 15% decline in PAT.
EBITDA (Rs mn) 13,564 21,910 46,580 (38) (71)
EBITDA margin (%) 8.3% 14.0% 24.6% -563 bps -1623 bps
PBT (Rs mn) 27,918 35,591 58,072 (22) (52)
PAT (Rs mn) 18,705 21,924 37,643 (15) (50)
Source: Company, Ambit Capital research; Note: * Quarterly estimates for Nalco, Hindalco and SAIL are for parent operations
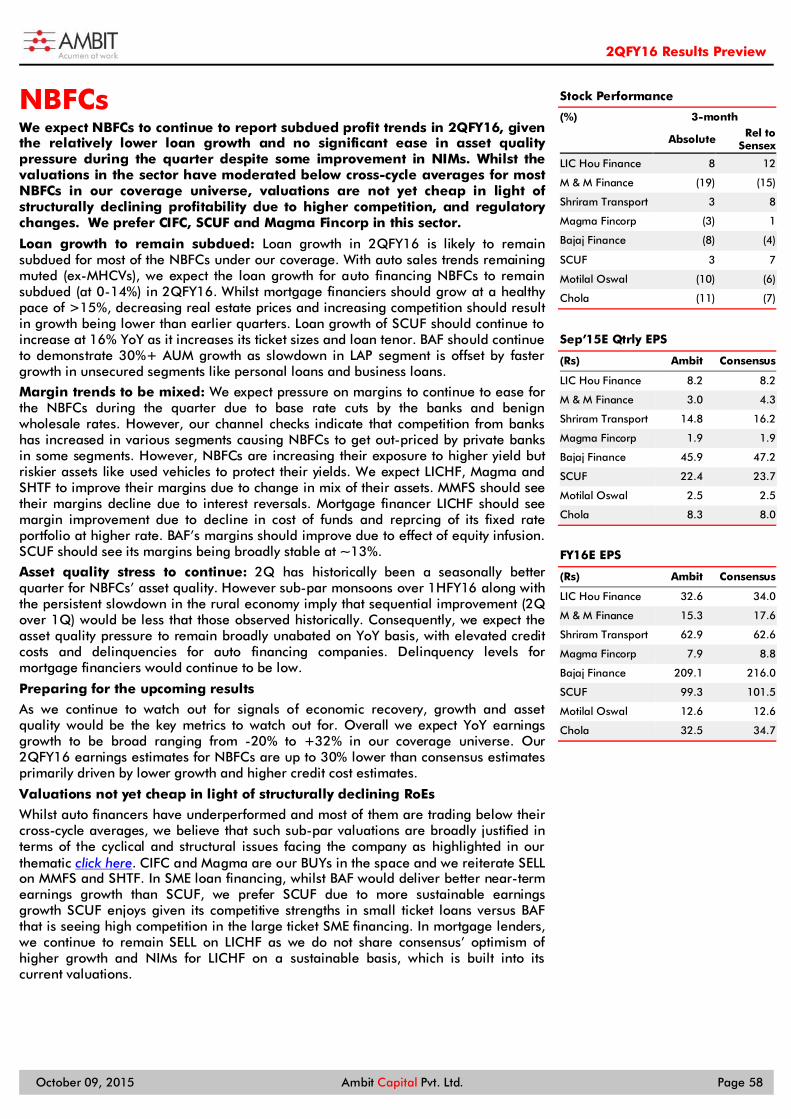
2QFY16 Results Preview
October 09, 2015 Ambit Capital Pvt. Ltd. Page 58
NBFCs We expect NBFCs to continue to report subdued profit trends in 2QFY16, given the relatively lower loan growth and no significant ease in asset quality pressure during the quarter despite some improvement in NIMs. Whilst the valuations in the sector have moderated below cross-cycle averages for most NBFCs in our coverage universe, valuations are not yet cheap in light of structurally declining profitability due to higher competition, and regulatory changes. We prefer CIFC, SCUF and Magma Fincorp in this sector.
Loan growth to remain subdued: Loan growth in 2QFY16 is likely to remain subdued for most of the NBFCs under our coverage. With auto sales trends remaining muted (ex-MHCVs), we expect the loan growth for auto financing NBFCs to remain subdued (at 0-14%) in 2QFY16. Whilst mortgage financiers should grow at a healthy pace of >15%, decreasing real estate prices and increasing competition should result in growth being lower than earlier quarters. Loan growth of SCUF should continue to increase at 16% YoY as it increases its ticket sizes and loan tenor. BAF should continue to demonstrate 30%+ AUM growth as slowdown in LAP segment is offset by faster growth in unsecured segments like personal loans and business loans.
Margin trends to be mixed: We expect pressure on margins to continue to ease for the NBFCs during the quarter due to base rate cuts by the banks and benign wholesale rates. However, our channel checks indicate that competition from banks has increased in various segments causing NBFCs to get out-priced by private banks in some segments. However, NBFCs are increasing their exposure to higher yield but riskier assets like used vehicles to protect their yields. We expect LICHF, Magma and SHTF to improve their margins due to change in mix of their assets. MMFS should see their margins decline due to interest reversals. Mortgage financer LICHF should see margin improvement due to decline in cost of funds and reprcing of its fixed rate portfolio at higher rate. BAF’s margins should improve due to effect of equity infusion. SCUF should see its margins being broadly stable at ~13%.
Asset quality stress to continue: 2Q has historically been a seasonally better quarter for NBFCs’ asset quality. However sub-par monsoons over 1HFY16 along with the persistent slowdown in the rural economy imply that sequential improvement (2Q over 1Q) would be less that those observed historically. Consequently, we expect the asset quality pressure to remain broadly unabated on YoY basis, with elevated credit costs and delinquencies for auto financing companies. Delinquency levels for mortgage financiers would continue to be low.
Preparing for the upcoming results
As we continue to watch out for signals of economic recovery, growth and asset quality would be the key metrics to watch out for. Overall we expect YoY earnings growth to be broad ranging from -20% to +32% in our coverage universe. Our 2QFY16 earnings estimates for NBFCs are up to 30% lower than consensus estimates primarily driven by lower growth and higher credit cost estimates.
Valuations not yet cheap in light of structurally declining RoEs
Whilst auto financers have underperformed and most of them are trading below their cross-cycle averages, we believe that such sub-par valuations are broadly justified in terms of the cyclical and structural issues facing the company as highlighted in our thematic click here. CIFC and Magma are our BUYs in the space and we reiterate SELL on MMFS and SHTF. In SME loan financing, whilst BAF would deliver better near-term earnings growth than SCUF, we prefer SCUF due to more sustainable earnings growth SCUF enjoys given its competitive strengths in small ticket loans versus BAF that is seeing high competition in the large ticket SME financing. In mortgage lenders, we continue to remain SELL on LICHF as we do not share consensus’ optimism of higher growth and NIMs for LICHF on a sustainable basis, which is built into its current valuations.
Stock Performance
(%) 3-month
Absolute Rel to Sensex
LIC Hou Finance 8 12
M & M Finance (19) (15)
Shriram Transport 3 8
Magma Fincorp (3) 1
Bajaj Finance (8) (4)
SCUF 3 7
Motilal Oswal (10) (6)
Chola (11) (7)
Sep’15E Qtrly EPS
(Rs) Ambit Consensus
LIC Hou Finance 8.2 8.2
M & M Finance 3.0 4.3
Shriram Transport 14.8 16.2
Magma Fincorp 1.9 1.9
Bajaj Finance 45.9 47.2
SCUF 22.4 23.7
Motilal Oswal 2.5 2.5
Chola 8.3 8.0
FY16E EPS
(Rs) Ambit Consensus
LIC Hou Finance 32.6 34.0
M & M Finance 15.3 17.6
Shriram Transport 62.9 62.6
Magma Fincorp 7.9 8.8
Bajaj Finance 209.1 216.0
SCUF 99.3 101.5
Motilal Oswal 12.6 12.6
Chola 32.5 34.7
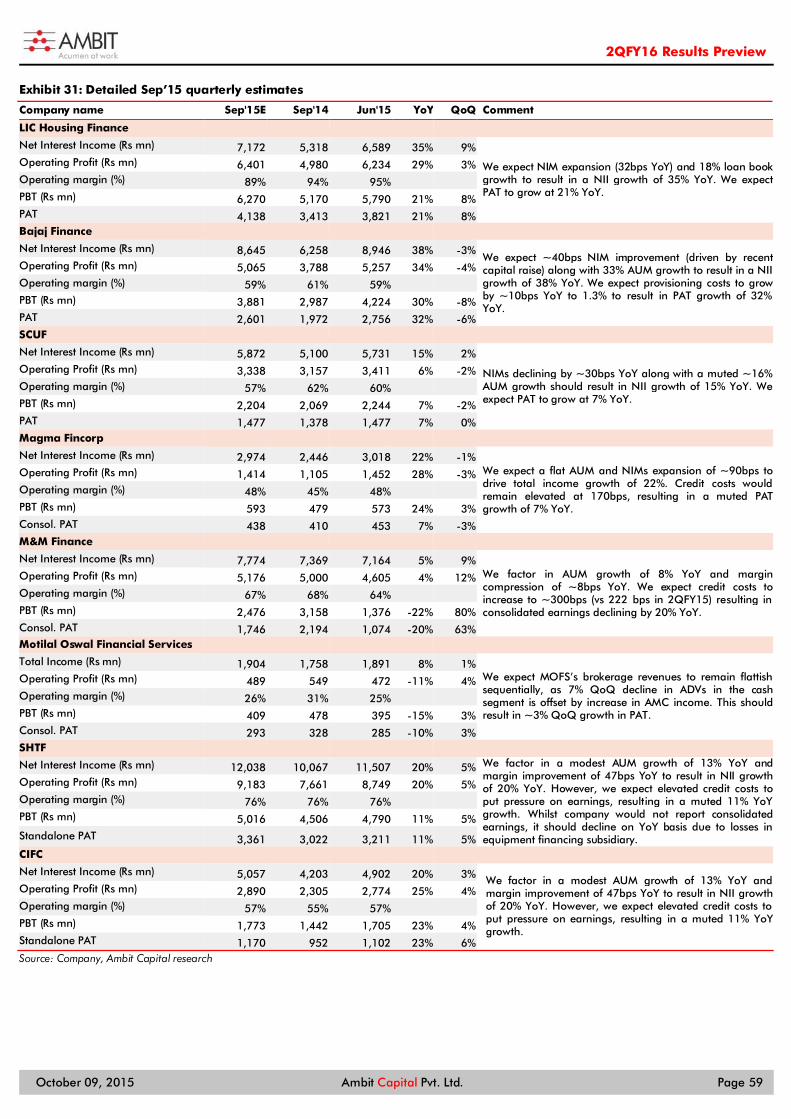
2QFY16 Results Preview
October 09, 2015 Ambit Capital Pvt. Ltd. Page 59
Exhibit 31: Detailed Sep’15 quarterly estimates
Company name Sep'15E Sep'14 Jun'15 YoY QoQ Comment
LIC Housing Finance
Net Interest Income (Rs mn) 7,172 5,318 6,589 35% 9%
We expect NIM expansion (32bps YoY) and 18% loan book growth to result in a NII growth of 35% YoY. We expect PAT to grow at 21% YoY.
Operating Profit (Rs mn) 6,401 4,980 6,234 29% 3% Operating margin (%) 89% 94% 95%
PBT (Rs mn) 6,270 5,170 5,790 21% 8% PAT 4,138 3,413 3,821 21% 8% Bajaj Finance
Net Interest Income (Rs mn) 8,645 6,258 8,946 38% -3% We expect ~40bps NIM improvement (driven by recent capital raise) along with 33% AUM growth to result in a NII growth of 38% YoY. We expect provisioning costs to grow by ~10bps YoY to 1.3% to result in PAT growth of 32% YoY.
Operating Profit (Rs mn) 5,065 3,788 5,257 34% -4% Operating margin (%) 59% 61% 59%
PBT (Rs mn) 3,881 2,987 4,224 30% -8% PAT 2,601 1,972 2,756 32% -6% SCUF
Net Interest Income (Rs mn) 5,872 5,100 5,731 15% 2%
NIMs declining by ~30bps YoY along with a muted ~16% AUM growth should result in NII growth of 15% YoY. We expect PAT to grow at 7% YoY.
Operating Profit (Rs mn) 3,338 3,157 3,411 6% -2% Operating margin (%) 57% 62% 60%
PBT (Rs mn) 2,204 2,069 2,244 7% -2% PAT 1,477 1,378 1,477 7% 0% Magma Fincorp
Net Interest Income (Rs mn) 2,974 2,446 3,018 22% -1% We expect a flat AUM and NIMs expansion of ~90bps to drive total income growth of 22%. Credit costs would remain elevated at 170bps, resulting in a muted PAT growth of 7% YoY.
Operating Profit (Rs mn) 1,414 1,105 1,452 28% -3% Operating margin (%) 48% 45% 48%
PBT (Rs mn) 593 479 573 24% 3% Consol. PAT 438 410 453 7% -3% M&M Finance
Net Interest Income (Rs mn) 7,774 7,369 7,164 5% 9% We factor in AUM growth of 8% YoY and margin compression of ~8bps YoY. We expect credit costs to increase to ~300bps (vs 222 bps in 2QFY15) resulting in consolidated earnings declining by 20% YoY.
Operating Profit (Rs mn) 5,176 5,000 4,605 4% 12% Operating margin (%) 67% 68% 64%
PBT (Rs mn) 2,476 3,158 1,376 -22% 80% Consol. PAT 1,746 2,194 1,074 -20% 63% Motilal Oswal Financial Services
Total Income (Rs mn) 1,904 1,758 1,891 8% 1% We expect MOFS’s brokerage revenues to remain flattish sequentially, as 7% QoQ decline in ADVs in the cash segment is offset by increase in AMC income. This should result in ~3% QoQ growth in PAT.
Operating Profit (Rs mn) 489 549 472 -11% 4% Operating margin (%) 26% 31% 25%
PBT (Rs mn) 409 478 395 -15% 3% Consol. PAT 293 328 285 -10% 3% SHTF
Net Interest Income (Rs mn) 12,038 10,067 11,507 20% 5% We factor in a modest AUM growth of 13% YoY and margin improvement of 47bps YoY to result in NII growth of 20% YoY. However, we expect elevated credit costs to put pressure on earnings, resulting in a muted 11% YoY growth. Whilst company would not report consolidated earnings, it should decline on YoY basis due to losses in equipment financing subsidiary.
Operating Profit (Rs mn) 9,183 7,661 8,749 20% 5% Operating margin (%) 76% 76% 76%
PBT (Rs mn) 5,016 4,506 4,790 11% 5%
Standalone PAT 3,361 3,022 3,211 11% 5% CIFC
Net Interest Income (Rs mn) 5,057 4,203 4,902 20% 3% We factor in a modest AUM growth of 13% YoY and margin improvement of 47bps YoY to result in NII growth of 20% YoY. However, we expect elevated credit costs to put pressure on earnings, resulting in a muted 11% YoY growth.
Operating Profit (Rs mn) 2,890 2,305 2,774 25% 4% Operating margin (%) 57% 55% 57% PBT (Rs mn) 1,773 1,442 1,705 23% 4% Standalone PAT 1,170 952 1,102 23% 6% Source: Company, Ambit Capital research
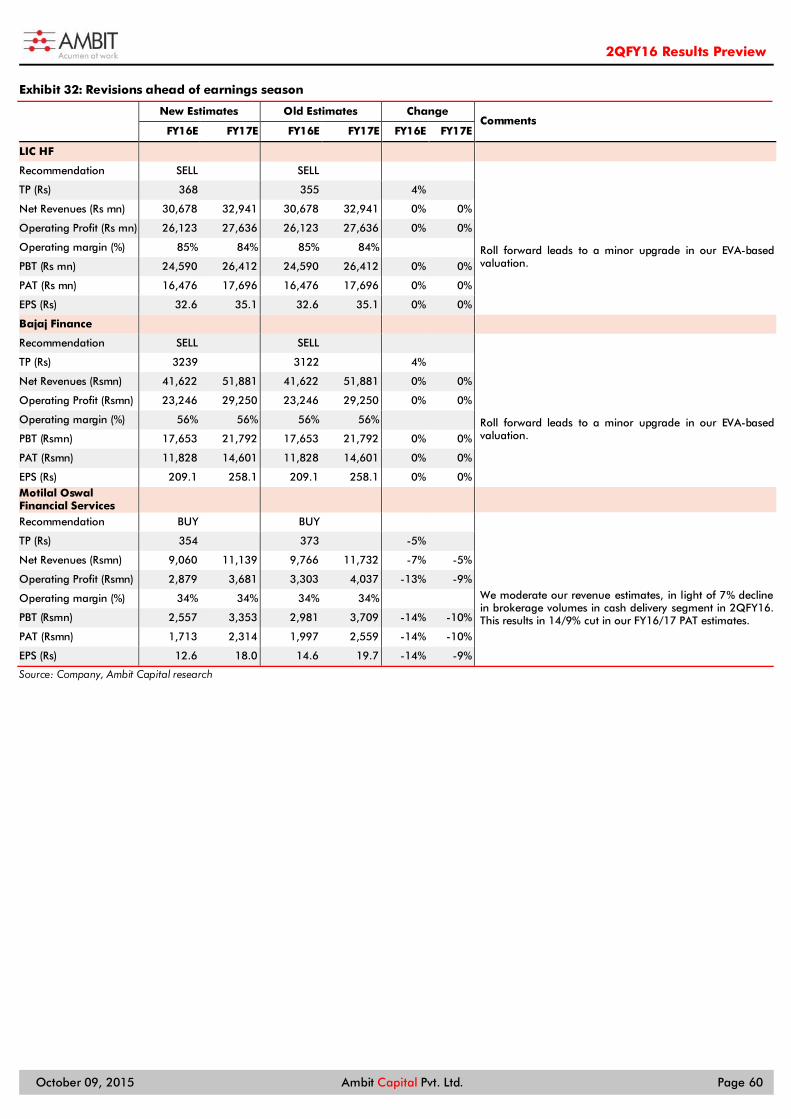
2QFY16 Results Preview
October 09, 2015 Ambit Capital Pvt. Ltd. Page 60
Exhibit 32: Revisions ahead of earnings season
New Estimates Old Estimates Change Comments
FY16E FY17E FY16E FY17E FY16E FY17E
LIC HF Recommendation SELL SELL TP (Rs) 368 355 4% Net Revenues (Rs mn) 30,678 32,941 30,678 32,941 0% 0%
Roll forward leads to a minor upgrade in our EVA-based valuation.
Operating Profit (Rs mn) 26,123 27,636 26,123 27,636 0% 0%
Operating margin (%) 85% 84% 85% 84% PBT (Rs mn) 24,590 26,412 24,590 26,412 0% 0%
PAT (Rs mn) 16,476 17,696 16,476 17,696 0% 0%
EPS (Rs) 32.6 35.1 32.6 35.1 0% 0%
Bajaj Finance Recommendation SELL SELL TP (Rs) 3239 3122 4% Net Revenues (Rsmn) 41,622 51,881 41,622 51,881 0% 0%
Roll forward leads to a minor upgrade in our EVA-based valuation.
Operating Profit (Rsmn) 23,246 29,250 23,246 29,250 0% 0%
Operating margin (%) 56% 56% 56% 56% PBT (Rsmn) 17,653 21,792 17,653 21,792 0% 0%
PAT (Rsmn) 11,828 14,601 11,828 14,601 0% 0%
EPS (Rs) 209.1 258.1 209.1 258.1 0% 0% Motilal Oswal Financial Services
Recommendation BUY BUY TP (Rs) 354 373 -5% Net Revenues (Rsmn) 9,060 11,139 9,766 11,732 -7% -5%
We moderate our revenue estimates, in light of 7% decline in brokerage volumes in cash delivery segment in 2QFY16. This results in 14/9% cut in our FY16/17 PAT estimates.
Operating Profit (Rsmn) 2,879 3,681 3,303 4,037 -13% -9%
Operating margin (%) 34% 34% 34% 34% PBT (Rsmn) 2,557 3,353 2,981 3,709 -14% -10%
PAT (Rsmn) 1,713 2,314 1,997 2,559 -14% -10%
EPS (Rs) 12.6 18.0 14.6 19.7 -14% -9%
Source: Company, Ambit Capital research

2QFY16 Results Preview
October 09, 2015 Ambit Capital Pvt. Ltd. Page 61
Technology We expect Indian IT companies to report robust revenue growth in the Sep-15 quarter (3.5-4.0% QoQ, in constant currency terms for TCS/Infosys) driven by seasonal strength and tailwinds from INR depreciation (2% QoQ). However, given the rising macro risks highlighted by Accenture during its recent management commentary, the management outlook will need to be watched even more closely. We believe that the demand environment remains stable vis-à-vis last year. We upgrade our target prices for large-sized IT companies by 0-8% to account for the INR depreciation and roll-forward of earnings. We retain our BUY stance on HCLT, Infosys, TechM and TCS and our SELL stance on Wipro, Mindtree, Persistent and eClerx. Seasonally strong quarter for revenue growth: We expect a strong quarter for TCS and Infosys and weak quarter for HCLT (following its profit warning). TCS is likely to lead the pack (with 4.0% QoQ growth in organic, constant-currency terms) followed by Infosys (3.5% QoQ). Wipro (2.5% QoQ) and TechM (2.2% QoQ) are likely to grow at a slower rate whilst HCLT (0.7% QoQ) has already indicated that it expects a weak quarter. Cross-currency headwinds are likely to be the highest for TechM and HCLT at 70-80bps. Amongst mid-sized companies, it is a seasonally strong quarter for Mindtree, for which we are building in a revenue growth of 5.5% QoQ (organic, cc). Including the contribution from the Bluefin and Relational Solutions acquisitions, we expect MindTree to report revenue growth of 13.5% QoQ in USD terms. Margins likely to expand due to INR depreciation: We expect EBIT margins for most of the companies in our coverage to expand, aided by: (1) INR depreciation vs the USD (2.4% average QoQ) and (2) absence of visa-related costs in 2QFY15. TechM is likely to report the largest EBIT margin expansion (140bps QoQ) followed by Infosys (100bps QoQ). Amongst mid-sized companies, we build in a 70bps QoQ recovery for Mindtree’s margins following a weak 1Q, when margins were impacted by high visa costs. For Persistent Systems, we are building in a 30bps margin contraction primarily due to wage hikes and costs related to the acquisitions of RGen and Aeopona. Preparing for the upcoming results We increase our forward USD/ INR estimates to Rs65/ USD (vs Rs64/ USD earlier), which is the primary driver for the upgrades to our EPS estimates (0-4%) and target prices (0-8%) for the companies in our coverage universe.
Ambit vs consensus Our EPS estimates for the Sep-15 quarter are in line with consensus estimates (within 1%) for TCS, Wipro, HCLT, TechM and eClerx. The highest variation is for Persistent and Infosys (our estimates are 5% lower).
Recommendations
We retain HCLT as our top pick. We retain our BUY stance on HCLT, Infosys, TechM and TCS and our SELL stance on Wipro, Mindtree, Persistent and eClerx.
TCS (BUY, 16% upside): We like TCS’s track record of identifying trends earlier than its peers and investing in them. TCS has used JVs/partnerships/acquisitions effectively to enter and eventually dominate new segments; examples include the Nordic market (SITAR), platform BPO (Diligenta) and more recently Japan (JV with Mitsubishi). We retain our BUY stance on TCS despite its punchy valuations (20x one-year forward P/E) because of its excellent portfolio mix and superior execution capabilities.
Cognizant (NOT RATED): Cognizant combines TCS's rigour in execution with more aggressive sales and investments reflected in lower margins (GAAP margins of 18% in 12 months ended June 2015 vs 27% for TCS adjusted for one-time employee bonuses) but also faster growth (18% vs 14% for TCS over the last 3 fiscals). Cognizant’s investments in the digital space also position it well for the future.
Stock Performance
(%) 3-month
Absolute Rel to Sensex
TCS 1% 5%
Infosys 18% 21%
Wipro 7% 10%
HCLT -11% -8%
TechM 20% 23%
Mindtree 19% 22%
Persistent 4% 7%
eClerx 15% 18%
Ambit vs consensus (Sep-15) EPS (Rs) Ambit Consensus
TCS 29.9 30.2
Infosys 13.7 14.3
Wipro 9.0 9.0
HCLT 12.6 12.7
TechM 7.6 7.7
Mindtree 16.7 na
Persistent 8.5 8.9
eClerx 26.6 26.4
Source: Bloomberg, Ambit Capital research
Ambit vs consensus (FY16E) EPS (Rs) Ambit Consensus
TCS 122.0 123.2
Infosys 56.7 57.9
Wipro 37.3 37.5
HCLT 56.2 54.8
TechM 32.0 31.8
Mindtree 71.6 70.8
Persistent 35.6 38.4
eClerx 103.7 99.0 Source: Bloomberg, Ambit Capital research

2QFY16 Results Preview
October 09, 2015 Ambit Capital Pvt. Ltd. Page 62
Infosys (BUY, 19% upside): Infosys has improved its execution in sales (hunting and mining) and delivery (employee engagement and pyramid). Aggressive investments in IP, design thinking by way of acquisitions and employee training should help accelerate growth even further over the next few quarters. Expected convergence in revenue growth with TCS should lead to convergence in implied multiples. Our new target price of Rs1,350 implies 19x Sep-17E earnings vs TCS’s 20x.
Wipro (SELL, 2% upside): We have a SELL stance on the stock despite cheap valuations (15x one-year forward P/E) because of its poor and deteriorating portfolio mix, weak organisation structure and high senior management churn.
HCL Tech (BUY, 39% upside):): We have a BUY stance on the stock due to its better portfolio mix (higher exposure to cost-focused service-lines such as infrastructure management services), stable senior management team, its efficient use of capital (RoE of 33% in FY15) and our expectation that recent investments in its business should accelerate organic growth. HCLT issued a profit warning highlighting that its Sep-15 results will be impacted by: (1) slower revenue recognition due to high complexity, especially in large IMS deals, (2) revenue write-back due to problems likely with a government client, and (3) cross-currency headwinds (80bps). Given the positive feedback we have been hearing from our primary data checks, we are inclined to believe that the company will shortly overcome the challenges relating to high work complexity. We remain positive on the stock.
Tech Mahindra (BUY, 15% upside): We have a BUY stance on the stock because it is well-positioned to benefit from: (1) upcoming tailwinds in telecom (three of its top-5 clients are doing M&As which should drive integration spend; it is well-positioned to win deals in digital and network management services) and (2) margin improvement (similar to HCLT over FY10-14, its margins should improve as large deals mature). We expect these drivers to be back-ended and to likely materialise in FY17.

2QFY16 Results Preview
October 09, 2015 Ambit Capital Pvt. Ltd. Page 63
Exhibit 33: Detailed Sep-15 quarterly estimates
Sep-15 Jun-15 QoQ Sep-14 YoY Comment
TCS
Sales (US$ mn) 4,185 4,036 3.7% 3,929 6.5% 4.0% QoQ revenue growth in constant currency; 30bps cross-currency headwinds
Sales (Rs bn) 273 257 6% 238 14%
Adj EBIT (Rs bn) 72 67 7% 64 13%
Adj EBIT margin (%) 26.5% 26.3% 20 bps 26.8% -30 bps Wage hikes and visa costs are primary headwinds. Key tailwind: INR depreciation, no wage hikes
Adj PBT (Rs bn) 77 75 2% 70 10%
Adj PAT (Rs bn) 59 57 3% 53 11% We have not factored in any forex gains/ losses. Forex gain in Jun-15 quarter was Rs1.9bn
Infosys
Sales (US$ mn) 2,321 2,256 2.9% 2,201 5.4% 3.5% QoQ revenue growth in organic, constant currency; 60bps cross-currency headwind
Sales (Rs bn) 151 144 5% 133 13%
EBIT (Rs bn) 38 34 9% 35 8%
EBIT margin (%) 25.0% 24.0% 100 bps 26.1% -110 bps Margins to remain within management's guided range of 24-26%, helped by INR depreciation and lower visa costs
PBT (Rs bn) 44 42 5% 44 1%
PAT (Rs bn) 31 30 4% 31 1% We have not factored in any forex gains/ losses
Wipro
IT Services
Sales (US$ mn) 1,832 1,794 2.1% 1,772 3.4% 2.5% QoQ revenue growth in constant currency; 40bps cross-currency headwind
EBIT (Rs bn) 25 24 2% 24 3%
EBIT margin (%) 20.8% 21.0% -20 bps 22.0% -120 bps Full quarter of wage hikes effective 1st June
Consolidated
Sales (Rs bn) 128 124 4% 118 8%
EBIT (Rs bn) 24 24 0% 23 4%
EBIT margin (%) 18.8% 19.4% -60 bps 19.5% -70 bps
PBT (Rs bn) 29 28 2% 27 5%
PAT (Rs bn) 22 22 1% 21 6%
HCLT
Sales (US$ mn) 1,538 1,538 0.0% 1,434 7.3%
0.7% QoQ revenue growth in constant currency due to high complexity in IMS, revenue write-back due to problems with a government client (130bps) and 70bps cross-currency headwind
Sales (Rs bn) 100 98 2% 87 15%
EBIT (Rs bn) 18 20 -6% 21 -11%
EBIT margin (%) 18.5% 20.1% -160 bps 23.9% -540 bps Margins impacted by lower revenues; however, we expect this to be a one-off
PBT (Rs bn) 23 22 5% 24 -5%
PAT (Rs bn) 18 18 1% 19 -5% We have not factored in any forex gains or losses; Jun-15 quarter had a forex loss of Rs53mn
Source: Company, Ambit Capital research

2QFY16 Results Preview
October 09, 2015 Ambit Capital Pvt. Ltd. Page 64
Exhibit 34: Detailed Sep-15 quarterly estimates
Sep-15 Jun-15 QoQ Sep-14 YoY Comment
TechM
Sales (US$ mn) 1,003 989 1.4% 900 11.4% Constant-currency growth of 2.2% QoQ. Non-telecom: 3.5% and Telecom: 1%
Sales (Rs bn) 66 63 4% 55 20%
EBIT (Rs bn) 8.9 7.6 16% 9.5 -7%
EBIT margin (%) 13.5% 12.1% 140 bps 17.4% -390 bps Margins likely to expand on INR depreciation, seasonality
PBT (Rs bn) 10.0 8.9 13% 10.1 -1%
PAT (Rs bn) 7.2 6.8 7% 7.2 1% We have not factored in any forex gains or losses; Jun-15 quarter had a forex loss of Rs0.9bn
Mindtree
Sales (US$ mn) 176 155 13.5% 147 19.6% Organic constant-currency growth of 5.5% QoQ in a seasonally strong quarter; 20bps cross-currency tailwind
Sales (Rs mn) 11,366 9,816 16% 8,886 28% EBIT (Rs mn) 1,705 1,407 21% 1,520 12% EBIT margin (%) 15.0% 14.3% 70 bps 17.1% -210 bps Lack of visa expenses and weaker INR should aid margins PBT (Rs mn) 1,804 1,781 1% 1,761 2%
PAT (Rs mn) 1,407 1,382 2% 1,374 2% We have not factored in any forex gains or losses; Jun-15 quarter had a forex gain of Rs202mn
Persistent
Sales (US$ mn) 83 79 5.9% 76 9.1%
Constant-currency revenue growth of 5.9% QoQ which includes 1.9% contribution from acquisitions; growth in enterprise segment (+10% QoQ) is likely to bounce back from the previous quarter
Sales (Rs mn) 5,413 5,004 8% 4,642 17% EBIT (Rs mn) 785 742 6% 720 9%
EBIT margin (%) 14.5% 14.8% -30 bps 15.5% -100 bps
Headwinds: Wage hikes (250bps), costs related to acquisitions of RGen and Aeopona (50-100bps) Tailwinds: No visa fees which was there in 1Q (100bps), currency benefits (100bps)
PBT (Rs mn) 929 940 -1% 994 -7% PAT (Rs mn) 678 672 1% 713 -5% eClerx
Sales (US$ mn) 49 46 5.2% 38 28.1% Constant-currency organic revenue growth of 3.9% QoQ and 125bps impact from acquisitions
Sales (Rs mn) 3,225 2,983 8% 2,318 39% EBIT (Rs mn) 1,004 891 13% 694 45% EBIT margin (%) 31.1% 29.9% 130 bps 29.9% 120 bps PBT (Rs mn) 1,068 1,050 2% 798 34% PAT (Rs mn) 822 732 12% 623 32% Source: Company, Ambit Capital research

2QFY16 Results Preview
October 09, 2015 Ambit Capital Pvt. Ltd. Page 65
Exhibit 35: Revisions ahead of earnings season
New Estimates Old Estimates Change Comments
In Rs bn FY16E FY17E FY18E FY16E FY17E FY18E FY16E FY17E FY18E
TCS
Target Price (Rs) 3,050 2,900 5%
We increase our TP by 5%, as we roll forward a quarter and adjust the long term USD/ INR rate to reflect current figures.
USD/ INR 64.7 65.0 65.0 63.9 64.0 64.0 1% 2% 2%
Revenue (US$mn) 16,887 19,107 21,631 16,924 19,162 21,693 0% 0% 0%
EBIT (Rs bn) 292 335 380 289 331 375 1% 1% 1%
EBIT margin 26.7% 27.0% 27.0% 26.7% 27.0% 27.0% 00bps 00bps 00bps
PAT (Rs bn) 239 273 310 237 270 307 1% 1% 1%
EPS (Rs) 122 140 159 121 138 157 1% 1% 1%
Infosys
Target Price (Rs) 1,350 1,300 4% We retain our margin estimates but we update our currency estimates. TP increases by 4% due to change in currency estimates and quarterly roll-over.
USD/ INR 64.7 65.0 65.0 63.9 64.0 64.0 1% 2% 2%
Revenue (US$mn) 9,408 10,662 12,114 9,450 10,730 12,192 0% -1% -1%
EBIT (Rs bn) 155 180 205 154 178 203 1% 1% 1%
EBIT margin 25.4% 26.0% 26.0% 25.4% 26.0% 26.0% 00bps 00bps 00bps
PAT (Rs bn) 130 151 172 129 150 171 1% 1% 1%
EPS (Rs) 57 66 75 56 66 75 1% 1% 1%
Wipro
Target Price (Rs) 600 600 0%
TP increases by 3% due to change in currency estimates and quarterly roll-over. We maintain our revenue and margin estimates for the IT services business. Change in currency estimates is the primary driver of EPS upgrades.
USD/ INR 64.9 65.0 65.0 64.1 64.0 64.0 1% 2% 2%
IT Services
Revenue (US$mn) 7,447 8,182 9,074 7,469 8,214 9,110 0% 0% 0%
EBIT 102 112 121 101 110 120 1% 1% 1%
EBIT margin 21.2% 21.0% 20.5% 21.2% 21.0% 20.5% 00bps 00bps 00bps
Consolidated
Revenue 517 566 624 513 560 617 1% 1% 1%
EBIT (Rs bn) 100 110 119 99 108 117 1% 1% 1%
EBIT margin 19.4% 19.4% 19.0% 19.4% 19.3% 19.0% 00bps 00bps 00bps
PAT (Rs bn) 92 99 108 91 98 107 1% 1% 1%
EPS (Rs) 37 40 44 37 40 43 1% 1% 1%
HCL Tech
Target Price (Rs) 1,150 1,150 0% We retain our TP. We have reduced our USD revenue and EBIT estimates. Margins have been lowered for FY16 to reflect a weak 2Q. We adjust the USD/ INR rate to reflect current figures.
USD/ INR 65.0 65.0 65.0 64.0 64.0 64.0 2% 2% 2%
Revenue (US$mn) 6,550 7,582 8,738 6,785 7,842 9,037 -3% -3% -3%
EBIT (Rs bn) 90 106 122 93 108 124 -3% -2% -2%
EBIT margin 21.2% 21.5% 21.5% 21.5% 21.5% 21.4% -30bps 10bps 10bps
PAT (Rs bn) 79 92 105 82 93 106 -3% -1% -1%
EPS (Rs) 56 65 74 58 66 75 -3% -1% -1%
Tech Mahindra
Target Price (Rs) 650 600 8%
We retain our margin estimates but we update our currency estimates. TP increases by 8% due to change in currency estimates and quarterly roll-over.
USD/ INR 64.8 65.0 65.0 63.9 64.0 64.0 1% 2% 2%
Revenue (US$mn) 4,084 4,580 5,141 4,094 4,597 5,157 0% 0% 0%
EBIT (Rs bn) 36 45 53 35 44 53 2% 1% 1%
EBIT margin 13.6% 15.0% 16.0% 13.4% 15.0% 16.0% 10bps 00bps 00bps
PAT (Rs bn) 28 34 41 27 33 40 4% 2% 2%
EPS (Rs) 32 38 46 31 38 45 4% 2% 2%

2QFY16 Results Preview
October 09, 2015 Ambit Capital Pvt. Ltd. Page 66
New Estimates Old Estimates Change Comments
In Rs bn FY16E FY17E FY18E FY16E FY17E FY18E FY16E FY17E FY18E
Mindtree
Target Price (Rs) 1,400 1,300 8% We increase our FY16 margins by 20bps. We maintain our margin estimates for FY17/18 but we update our currency estimates. TP increases by 8% due to change in currency estimates and quarterly roll-over.
USD/ INR 64.5 65.0 65.0 63.9 64.0 64.0 1% 2% 2%
Revenue (US$mn) 698 829 968 698 827 967 0% 0% 0%
EBIT (Rs mn) 6,996 8,612 10,385 6,832 8,479 10,203 2% 2% 2%
EBIT margin 15.5% 16.0% 16.5% 15.3% 16.0% 16.5% 20bps 00bps 00bps
PAT (Rs mn) 6,017 7,188 8,642 5,888 7,083 8,498 2% 1% 2%
EPS (Rs) 72 86 103 70 84 101 2% 1% 2%
Persistent
Target Price (Rs) 650 600 8%
We retain our margin estimate but we update our currency estimates. TP increases by 8% due to change in our currency estimates and quarterly roll-over.
USD/ INR 64.7 65.0 65.0 63.9 64.0 64.0 1% 2% 2%
Revenue (US$mn) 337 390 451 331 381 442 2% 2% 2%
EBIT (Rs mn) 3,296 4,052 4,687 3,199 3,905 4,530 3% 4% 3%
EBIT margin 15.1% 16.0% 16.0% 15.1% 16.0% 16.0% 00bps 00bps 00bps
PAT (Rs mn) 2,853 3,394 3,922 2,814 3,287 3,809 1% 3% 3%
EPS (Rs) 36 42 49 35 41 48 1% 3% 3%
eClerx (Rs mn)
Target Price (Rs) 1,500 1,450 3% We align our currency estimates to the current exchange rates. We retain our revenue estimates and we increase TP by 3%. Margin estimates reduce marginally to reflect lower hedging gains.
USD/ INR 64.8 65.0 65.0 64.1 64.0 64.0 1% 2% 2%
Revenue (US$mn) 196 220 249 196 220 249 0% 0% 0%
EBIT (Rs mn) 3,931 4,344 4,557 3,936 4,318 4,489 0% 1% 2%
EBIT margin 30.7% 30.0% 28.1% 31.0% 30.2% 28.1% -30bps -20bps 00bps
PAT (Rs mn) 3,202 3,436 3,614 3,214 3,416 3,562 0% 1% 1%
EPS (Rs) 104 111 117 104 111 115 0% 1% 1%
Source: Company, Ambit Capital research

2QFY16 Results Preview
October 09, 2015 Ambit Capital Pvt. Ltd. Page 67
Utilities Whilst SEB demand for power has been weak across India (average PLF likely to decline by 400bps YoY in 2QFY16), we expect utilities under our coverage to report moderate revenue and EBITDA growth. We expect revenue growth of 11% for NTPC (higher volumes), 8% for Tata Power (TPL; higher volumes in Mumbai circle), 2% for JSW Energy (JSWE; acquisition of Baspa-II and Karcham Wangtoo w.e.f Sept’15) and 9% for Torrent (Dahej and Unosugen reporting average PLF of 45% vs NIL in 2QFY15). We expect a YoY improvement in EBITDA margin of 320bps for NTPC (higher volumes), 350bps for JSWE (acquisition and lower imported coal prices) and 980bps for Torrent (recovery of fixed cost on Dahej and Unosugen). For TPL, we expect 20bps YoY decline in margin due to lower profitability at Bumi. JSWE (22% downside) is our top SELL and Torrent (25% upside) is our top BUY in the sector. We retain BUY on TPL and SELL on NTPC.
Mixed PLFs: India’s average PLF is likely to decline from 63% in 2QFY15 to 59% in 2QFY16 due to further deterioration in the financial health of SEBs which has led to lower offtake. However, utilities under over coverage are likely to report mixed PLFs. Whilst NTPC is likely to report improvement in PLF from 73% in 2QFY15 to 78% in 2QFY16, JSWE is likely to report decline in PLF (on its coal/lignite based business) from 83% in 2QFY15 to 70% in 2QFY16. TPL is likely to report flat PLF at 61%. Winning of imported RLNG under the gas auction has led to Torrent’s Dahej (1200MW) and Unosugen (382.5MW) getting operationalised. These plants are expected to report average PLF of 45% in 2QFY16 (vs NIL in 2QFY15).
Improvement in margin: We expect improvement in EBITDA margin for all the companies under coverage except TPL. We expect YoY improvement in EBITDA margin for NTPC (320bps), JSWE (350bps) and Torrent (980bps) due to higher volumes, 10% fall in Indonesian coal prices and recovery of entire fixed cost on Dahej and Unosugen respectively. For TPL, we expect 20bps YoY decline in EBITDA margin due to decline in Bumi’s profitability.
Where do we go from here? Further deterioration in the financial health of SEBs (Rajasthan SEB applied for debt restructuring in 1QFY16) has meant lower offtake and consequent increase in back-downs (India’s average PLF declined from 60% over Apr-Aug’14 to 67% over Apr- Aug’15; Sept’15 data is not available). However, the near-term outlook for utilities seems to be improving with pan-India merchant tariff in September increasing by 30% sequentially to Rs3.7/unit (highest in past 10 months; though down 12% YoY). Moreover, our discussions with bankers and consultants suggest that the government is working on resolving the SEB debt issue over the next 4-5 months. If this happens in a desired manner, then it would be positive for utilities, as it would result in improvement in power demand and a consequent increase in PLFs. Moreover, a stronger balance sheet of SEBs would open the door for new PPA tenders.
Ambit vs consensus: Currently there no credible consensus estimates available for NTPC, TPL, JSWE, APL and Torrent.
Recommendations
Tata Power (BUY, TP Rs106/share, 50% upside): Tata Power is one of the few utilities which have good execution skills, minimal exposure to merchant power and 100% assured fuel supply. Also, it has the least exposure to the weakest SEBs (only 15% exposure) which is critical given the risk to PLFs. Whilst there has been a lot of disappointment on the receipt of Mundra’s compensatory tariff hike (regulatory issue) and stake sale in Arutmin mine, there have been positives in the form of reduction in losses of Mundra (to Rs0.8bn in 1QFY16 from Rs3.1bn in 1QFY15 and Rs9bn in FY15) and improving profitability for Maithon (PAT improved to Rs370mn in 1QFY16 from Rs190mn in 1QFY15). Lastly, we believe valuation at 1.1x FY17E P/B is attractive given FY17E RoE of 13% and EPS improvement from Rs0.4/share in FY15 to Rs7.7/unit in FY17E.
Stock Performance
(%) 3-month
Absolute Rel to Sensex
NTPC (5) (2) Tata Power (3) (0) Tata Power (9) (6) Torrent Power 24 27
September ’15E Qtrly EPS
(Rs) Ambit Consensus
NTPC 2.5 NA
Tata Power 0.8 NA
JSW Energy 1.7 NA
Torrent Power 3.9 NA
FY16E EPS
(Rs) Ambit Consensus
Adani Power 10.5 11.2 JSW Energy 5.2 4.3 NTPC 6.7 8.2 Tata Power 20.1 16.4 Torrent Power 10.5 11.2

2QFY16 Results Preview
October 09, 2015 Ambit Capital Pvt. Ltd. Page 68
JSW Energy (SELL, TP Rs71/share, 22% downside): We expect average realisation for JSWE on non-hydro assets to decline from Rs4.23/unit to Rs4.03/unit in FY17. We expect south’s merchant tariff (accounts for 25% of JSWE’s portfolio post the acquisition of Baspa-II and Karcham Wangtoo) to converge to the national tariff (currently 23% lower than southern tariff) by end- FY17. Our expectation of a decline in southern region’s merchant realisation is based on: (a) additional supply of 4.3GW (vs peak demand deficit of 2GW in FY15) being pumped into the southern region post the completion of grid integration over FY15-17; and (b) more than doubling of coal-based installed capacity in the southern region over FY15-19 (from 28.5GW in FY15 to 61.5GW in FY19). At CMP, the stock trades at 1.6x FY17E P/B which we believe is expensive given FY16E RoE of 15% and EPS decline of 4% over FY15-17. Our target price of Rs71/share implies FY17 P/B of 1.3x.
Exhibit 36: Detailed Sept'15E quarterly estimates
Company name Sept'15E Sept'14 Jun'15 YoY QoQ Comment
NTPC
Sales (Rs mn) 185,992 167,366 170,846 11% 9% Led by: (a) our expectation of higher PLF at 78% in 2QFY16 vs 74% in 2QFY15; and (b) 5% YoY increase in regulated equity
EBITDA (Rs mn) 42,117 32,423 34,377 30% 23% Trickle-down impact of higher volumes and weak e-auction coal prices EBITDA margin (%) 22.6% 19.4% 20.1% 320bps 250bps
PBT (Rs mn) 27,220 19,540 17,076 39% 59% Trickle-down impact of higher EBITDA
PAT (Rs mn) 20,415 20,716 21,354 -1% -4% PAT decline is led by higher tax rate of 25% in 2QFY16 vs -6% in 2QFY15
Tata Power
Sales (Rs mn) 90,658 83,943 92,346 8% -2% Revenue growth led by improvement in volumes in Mumbai circle
EBITDA (Rs mn) 18,132 16,920 19,551 7% -7% Margin decline led by weak realisation at Bumi
EBITDA margin (%) 20.0% 20.2% 21.2% -20bps -120bps
APBT (Rs mn) 4,340 1,415 5,794 207% -25% Trickle-down impact of higher EBITDA
APAT (Rs mn) 2,170 431 2,413 404% -10%
JSW Energy
Sales (Rs mn) 23,022 22,513 20,805 2% 11%
Revenue growth is due to acquisition of Baspa-II and Karcham Wangtoo w.e.f. 1st September. On traditional coal/lignite based plant, we expect average PLF to decline from 83% in 2QFY15 to 75% in 2QFY16.
EBITDA (Rs mn) 9,493 8,479 7,908 12% 20% Consequent to: (a) acquisition of Baspa-II and Karcham Wangtoo; (b) 10% YoY decline in per unit fuel cost for coal/lignite based capacities EBITDA margin (%) 41.2% 37.7% 38.0% 350bps 320bps
APBT (Rs mn) 4,058 4,785 3,807 -15% 7% Decline in PBT and PAT is due to 71% YoY decline in other income as 2QFY15’s other income includes one-time settlement claim receipts APAT (Rs mn) 2,821 3,489 2,342 -19% 20%
Torrent Power
Sales (Rs mn) 29,500 27,121 28,995 9% 2% Revenue growth led by Dahej and Unosugen reporting average PLF of ~45% in 2QFY16 vs NIL in 2QFY15 due to receipt of RLNG under gas auction
EBITDA (Rs mn) 7,296 4,038 6,594 81% 11% We expect Dahej and Unosugen to recover entire their fixed cost (Interest + Depreciation) due to receipt of subsidy under the RLNG auction scheme EBITDA margin (%) 24.7% 14.9% 22.7% 980bps 200bps
PBT (Rs mn) 2,867 1,103 2,178 160% 32% Consequent increase in PBT and PAT
PAT (Rs mn) 1,854 535 1,042 247% 78%
Source: Company, Ambit Capital research

2QFY16 Results Preview
October 09, 2015 Ambit Capital Pvt. Ltd. Page 69
Exhibit 37: Change in estimates
Rsmn unless specified
New Estimates Old Estimates Change Comments
FY16E FY17E FY16E FY17E FY16E FY17E
NTPC Recommendation SELL SELL TP (Rs) 119 115 3.0% Consequent to rollover of DCF by 3 months
Revenues (Rs mn) 760,979 864,048 808,721 881,297 -6% -2% Led by cut in our fuel cost assumption by 5%. We now assume flat per unit fuel cost in FY16 given our mining analyst's expectation of no price hikes in FY16 by Coal India EBITDA (Rs mn) 171,953 205,398 163,374 190,787 5% 8%
EBITDA margin (%) 22.6% 23.8% 20.2% 21.6% 240bps 220bps PBT (Rs mn) 115,239 123,965 113,219 121,461 2% 2%
No change. We keep our regulated equity and incentive income assumption unchanged PAT (Rs mn) 86,429 92,974 84,914 91,096 2% 2%
EPS (Rs) 10.5 11.3 10.3 11.0 2% 2%
Tata Power Recommendation BUY BUY TP (Rs) 106 103 2.7% Consequent to rollover of TP by 3 months
Revenues (Rs mn) 395,020 411,697 395,020 411,697 0% 0%
No change
EBITDA (Rs mn) 83,487 86,945 83,487 86,945 0% 0%
EBITDA margin (%) 21.1% 21.1% 21.1% 21.1% 0bps 0bps
PBT (Rs mn) 32,930 41,329 32,930 41,329 0% 0%
PAT (Rs mn) 13,965 20,771 13,965 20,771 0% 0%
EPS (Rs) 5.2 7.7 5.2 7.7 0% 0%
JSW Energy Recommendation SELL SELL
TP (Rs) 71 69 2.3%
Consequent to rollover of TP by 3 months which is partly offset by increase in interest cost assumption on acquisition of Baspa-II and Karcham Wangtoo
Revenues (Rs mn) 97,663 103,292 97,524 103,074 0% 0% Marginal change consequent to increase in interest cost for Baspa-II and Karcham Wangtoo. Note these assets are on regulated equity model
EBITDA (Rs mn) 42,660 47,783 42,521 47,565 0% 0% Consequent to increase in rate of interest on the acquisition debt of Baspa-II and Karcham Wangtoo from 9.7% earlier to 10.3% as management in our recent meetings clarified that rate of interest on acquisition debt is SBI lending rate + 100bps (currently 10.3%) vs 9.7% mentioned in the media articles.
EBITDA margin (%) 43.7% 46.3% 43.6% 46.1% 10bps 20bps
PBT (Rs mn) 16,864 19,770 17,132 20,040 -2% -1%
PAT (Rs mn) 10,915 12,563 11,094 12,751 -2% -1%
EPS (Rs) 6.7 7.7 6.8 7.8 -2% -1%
Source: Ambit Capital research

October 09, 2015 Ambit Capital Pvt. Ltd.
2QFY16 Results Preview
Ambit Coverage Valuation Summary Name Reco Mcap ADVT - 6m CMP TP Upside EPS (Rs) P/E (x) P/B (x) EV/EBITDA (x) ROE (%)
($ mn) ($ mn) (Rs) (Rs) (%) FY15E FY16E FY17E FY16E FY17E FY16E FY17E FY16E FY17E FY16E FY17E
Automobiles
Maruti Suzuki BUY 20,205 28.5 4,354 4,750 9 123 182 228 24 19 4.7 4.0 13 11 20 21 Tata Motors BUY 17,118 54.2 343 455 33 44 43 52 8 7 1.5 1.2 4 3 19 19 Bajaj Auto SELL 10,807 14.3 2,431 2,410 (1) 97 131 148 19 16 5.7 5.0 12 11 33 32 Hero Motocorp SELL 7,797 23.0 2,542 2,500 (2) 125 150 167 17 15 7.5 7.5 12 10 45 49 Eicher Motors* SELL 7,784 33.8 18,666 16,500 (12) 226 545 613 34 30 13.6 9.9 17 17 44 44 Ashok Leyland BUY 4,007 19.5 92 105 15 1 4 5 23 17 4.3 3.6 14 11 19 21 Exide Industries SELL 2,035 4.9 156 145 (7) 6 8 9 21 18 3.0 2.7 11 10 15 15 TVS SELL 1,755 7.3 240 245 2 8 11 16 23 15 5.8 4.6 15 11 28 33 Mahindra CIE BUY 1,335 1.2 269 340 26 7 10 15 27 18 4.5 3.6 14 11 16 20 Balkrishna Inds SELL 987 0.9 665 690 4 51 49 55 14 12 2.3 2.0 9 8 19 18 BFSI
HDFC Bank SELL 41,902 26.5 1,083 1,045 (3) 41 48 58 22 19 3.8 3.3 NA NA 18 19 SBI SELL 28,281 67.3 243 235 (3) 18 18 22 14 11 1.3 1.2 NA NA 10 11 ICICI Bank SELL 24,844 65.4 278 290 4 19 21 23 14 12 1.8 1.6 NA NA 14 14 Kotak Mahindra Bank SELL 18,357 18.4 654 498 (24) 20 22 27 30 24 3.6 3.1 NA NA 12 13 Axis Bank BUY 17,955 65.3 492 690 40 31 34 42 14 12 2.3 2.0 NA NA 17 18 IndusInd Bank BUY 8,590 16.7 945 1,075 14 34 39 51 24 19 3.2 2.8 NA NA 17 16 Bank of Baroda BUY 6,581 22.1 186 215 15 15 21 25 9 7 0.9 0.9 NA NA 11 12 Bajaj Finance SELL 4,154 5.0 5,041 3,239 (36) 171 209 258 24 20 3.7 3.2 NA NA 19 18 Punjab National Bank SELL 3,962 13.1 139 140 1 17 20 25 7 5 0.6 0.6 NA NA 10 11 LIC HFC SELL 3,684 17.2 475 368 (22) 27 33 35 15 14 2.6 2.3 NA NA 19 18 SHTF SELL 3,307 11.2 949 745 (21) 56 63 76 15 13 2.1 1.8 NA NA 14 15 MMFS SELL 2,056 5.6 235 225 (4) 15 14 18 17 13 2.1 1.9 NA NA 13 15 Union Bank of India SELL 1,808 13.7 185 150 (19) 30 34 43 5 4 0.6 0.5 NA NA 11 13 SCUF BUY 1,803 0.9 1,781 2,456 38 86 99 123 18 14 2.5 2.2 NA NA 15 16 Federal Bank SELL 1,701 5.7 65 70 9 6 6 7 12 9 1.3 1.2 NA NA 12 13 CIFC BUY 1,505 0.5 628 740 18 30 33 43 19 15 2.6 2.3 NA NA 16 17 Bank of India SELL 1,486 9.6 146 150 3 29 17 31 9 5 0.3 0.3 NA NA 4 7 Karur Vysya Bank SELL 840 0.9 452 430 (5) 38 42 48 11 9 1.2 1.1 NA NA 12 12 City Union Bank BUY 826 1.0 90 115 28 7 7 9 12 10 1.8 1.5 NA NA 15 16 Motilal Oswal BUY 610 0.2 280 354 26 10 13 18 22 16 2.8 2.4 NA NA 13 17 South Indian Bank SELL 467 1.3 23 23 2 2 3 4 7 6 0.8 0.7 NA NA 12 14 Magma BUY 333 0.3 91 133 45 9 8 14 12 7 0.9 0.8 NA NA 9 13 Source: Bloomberg, Ambit Capital research, Note: * Indicates December ending companies, # Indicates June ending companies, NA indicates Field Not Applicable; UR indicates Under Review
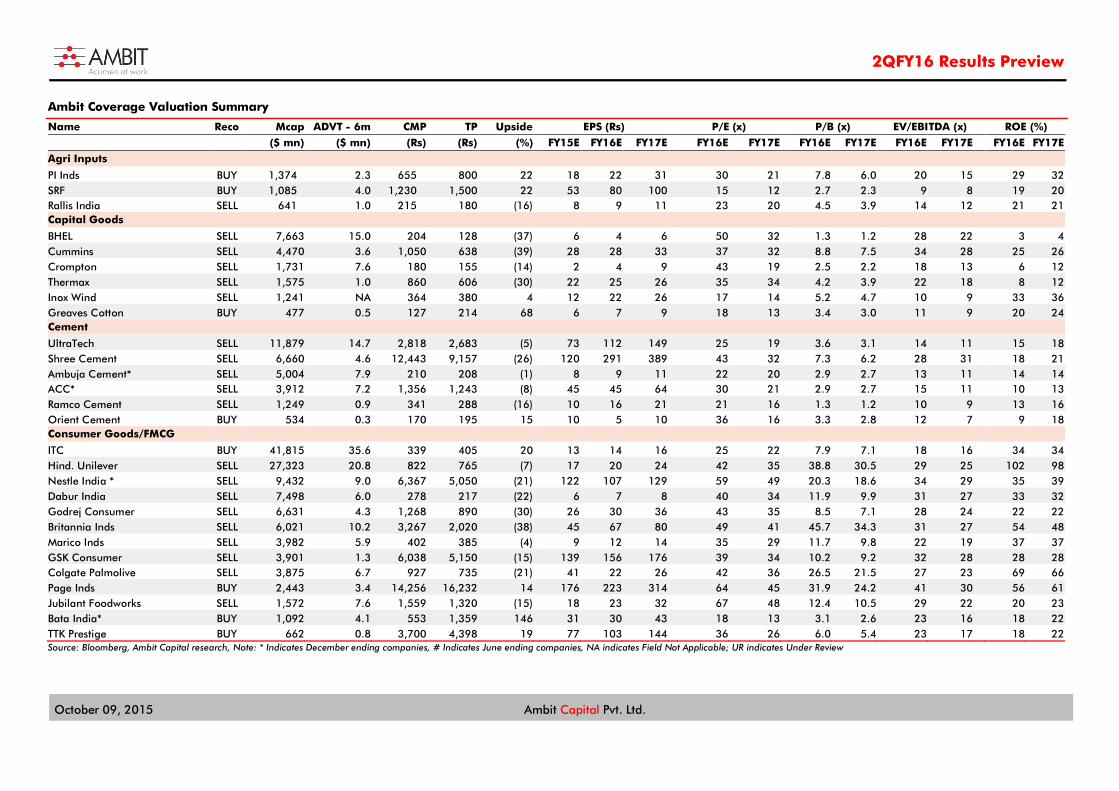
October 09, 2015 Ambit Capital Pvt. Ltd.
2QFY16 Results Preview
Ambit Coverage Valuation Summary
Name Reco Mcap ADVT - 6m CMP TP Upside EPS (Rs) P/E (x) P/B (x) EV/EBITDA (x) ROE (%)
($ mn) ($ mn) (Rs) (Rs) (%) FY15E FY16E FY17E FY16E FY17E FY16E FY17E FY16E FY17E FY16E FY17E
Agri Inputs
PI Inds BUY 1,374 2.3 655 800 22 18 22 31 30 21 7.8 6.0 20 15 29 32 SRF BUY 1,085 4.0 1,230 1,500 22 53 80 100 15 12 2.7 2.3 9 8 19 20 Rallis India SELL 641 1.0 215 180 (16) 8 9 11 23 20 4.5 3.9 14 12 21 21 Capital Goods
BHEL SELL 7,663 15.0 204 128 (37) 6 4 6 50 32 1.3 1.2 28 22 3 4 Cummins SELL 4,470 3.6 1,050 638 (39) 28 28 33 37 32 8.8 7.5 34 28 25 26 Crompton SELL 1,731 7.6 180 155 (14) 2 4 9 43 19 2.5 2.2 18 13 6 12 Thermax SELL 1,575 1.0 860 606 (30) 22 25 26 35 34 4.2 3.9 22 18 8 12 Inox Wind SELL 1,241 NA 364 380 4 12 22 26 17 14 5.2 4.7 10 9 33 36 Greaves Cotton BUY 477 0.5 127 214 68 6 7 9 18 13 3.4 3.0 11 9 20 24 Cement
UltraTech SELL 11,879 14.7 2,818 2,683 (5) 73 112 149 25 19 3.6 3.1 14 11 15 18 Shree Cement SELL 6,660 4.6 12,443 9,157 (26) 120 291 389 43 32 7.3 6.2 28 31 18 21 Ambuja Cement* SELL 5,004 7.9 210 208 (1) 8 9 11 22 20 2.9 2.7 13 11 14 14 ACC* SELL 3,912 7.2 1,356 1,243 (8) 45 45 64 30 21 2.9 2.7 15 11 10 13 Ramco Cement SELL 1,249 0.9 341 288 (16) 10 16 21 21 16 1.3 1.2 10 9 13 16 Orient Cement BUY 534 0.3 170 195 15 10 5 10 36 16 3.3 2.8 12 7 9 18 Consumer Goods/FMCG
ITC BUY 41,815 35.6 339 405 20 13 14 16 25 22 7.9 7.1 18 16 34 34 Hind. Unilever SELL 27,323 20.8 822 765 (7) 17 20 24 42 35 38.8 30.5 29 25 102 98 Nestle India * SELL 9,432 9.0 6,367 5,050 (21) 122 107 129 59 49 20.3 18.6 34 29 35 39 Dabur India SELL 7,498 6.0 278 217 (22) 6 7 8 40 34 11.9 9.9 31 27 33 32 Godrej Consumer SELL 6,631 4.3 1,268 890 (30) 26 30 36 43 35 8.5 7.1 28 24 22 22 Britannia Inds SELL 6,021 10.2 3,267 2,020 (38) 45 67 80 49 41 45.7 34.3 31 27 54 48 Marico Inds SELL 3,982 5.9 402 385 (4) 9 12 14 35 29 11.7 9.8 22 19 37 37 GSK Consumer SELL 3,901 1.3 6,038 5,150 (15) 139 156 176 39 34 10.2 9.2 32 28 28 28 Colgate Palmolive SELL 3,875 6.7 927 735 (21) 41 22 26 42 36 26.5 21.5 27 23 69 66 Page Inds BUY 2,443 3.4 14,256 16,232 14 176 223 314 64 45 31.9 24.2 41 30 56 61 Jubilant Foodworks SELL 1,572 7.6 1,559 1,320 (15) 18 23 32 67 48 12.4 10.5 29 22 20 23 Bata India* BUY 1,092 4.1 553 1,359 146 31 30 43 18 13 3.1 2.6 23 16 18 22 TTK Prestige BUY 662 0.8 3,700 4,398 19 77 103 144 36 26 6.0 5.4 23 17 18 22 Source: Bloomberg, Ambit Capital research, Note: * Indicates December ending companies, # Indicates June ending companies, NA indicates Field Not Applicable; UR indicates Under Review

October 09, 2015 Ambit Capital Pvt. Ltd.
2QFY16 Results Preview
Ambit Coverage Valuation Summary
Name Reco Mcap ADVT - 6m CMP TP Upside EPS (Rs) P/E (x) P/B (x) EV/EBITDA (x) ROE (%)
($ mn) ($ mn) (Rs) (Rs) (%) FY15E FY16E FY17E FY16E FY17E FY16E FY17E FY16E FY17E FY16E FY17E
E&C and Infrastructure
L&T SELL 21,929 51.2 1,534 1,420 (7) 51 54 61 28 25 3.5 3.2 22 19 13 14
Bharat Electronics BUY 4,437 9.8 1,203 1,390 16 50 55 65 22 19 3.1 2.8 17 14 15 16
AIA Engineering SELL 1,448 1.5 999 1,050 5 46 41 45 24 22 2.0 1.7 17 16 17 16
Voltas SELL 1,383 11.6 272 157 (42) 10 12 13 23 21 3.8 3.4 19 17 18 17
Engineers India SELL 1,018 2.0 197 220 12 10 12 14 17 14 2.4 2.2 15 11 14 16
Sadbhav BUY 788 1.3 299 375 25 (10) 5 5 60 56 2.5 2.3 12 9 5 4
Sadbhav Infra BUY 561 NA 104 135 30 (11) (2) (2) NA NA 2.9 2.9 35 35 (7) (6)
VA Tech SELL 547 1.3 654 720 10 20 26 36 25 18 3.5 3.0 14 10 15 18
Blue Star SELL 476 0.4 344 267 (22) 10 12 16 29 21 6.3 5.7 17 14 22 28
Ashoka Buildcon BUY 472 0.7 164 225 37 5 11 6 14 28 2.1 1.7 11 9 3 (2) Healthcare
Sun Pharmaceuticals NS 33,852 95.3 916 NA NA 28 35 43 26 22 6.8 5.4 17 15 31 28
Lupin BUY 14,136 46.8 2,044 2,186 7 53 63 91 32 22 8.1 6.2 20 14 28 31
Dr. Reddy's Labs SELL 11,069 21.6 4,225 3,300 (22) 141 114 164 37 26 5.7 4.8 22 17 16 20
Cipla SELL 8,393 21.5 680 687 1 15 23 27 30 25 4.4 3.8 18 14 16 16
Aurobindo Pharma SELL 6,734 28.3 751 414 (45) 27 34 47 22 16 6.2 4.6 15 12 32 33
Cadila Healthcare BUY 6,437 4.4 409 479 17 58 15 20 27 20 7.7 5.8 20 15 32 33
Torrent Pharma BUY 3,924 3.9 1,509 1,682 11 29 106 67 14 23 6.7 5.6 11 16 57 27
IPCA Labs BUY 1,397 2.4 721 952 32 22 31 38 23 19 3.6 3.1 13 11 17 18 Metals & Mining
Coal India BUY 33,595 27.8 346 425 23 22 24 27 14 13 4.4 3.6 12 11 34 31
Tata Steel SELL 3,593 29.5 241 215 (11) (3) 5 14 45 17 5.7 14.7 8 7 1 4
SAIL SELL 3,474 3.2 55 43 (21) 5 (0) 3 NA 17 0.5 0.5 17 9 (0) 3
Hindalco Inds SELL 2,613 11.4 82 78 (5) 14 3 9 25 9 0.4 0.4 8 7 2 5
NALCO SELL 1,443 0.9 36 37 0 5 3 3 12 11 0.7 0.7 4 4 6 6 Source: Bloomberg, Ambit Capital research, Note: * Indicates December ending companies, # Indicates June ending companies, NA indicates Field Not Applicable; UR indicates Under Review
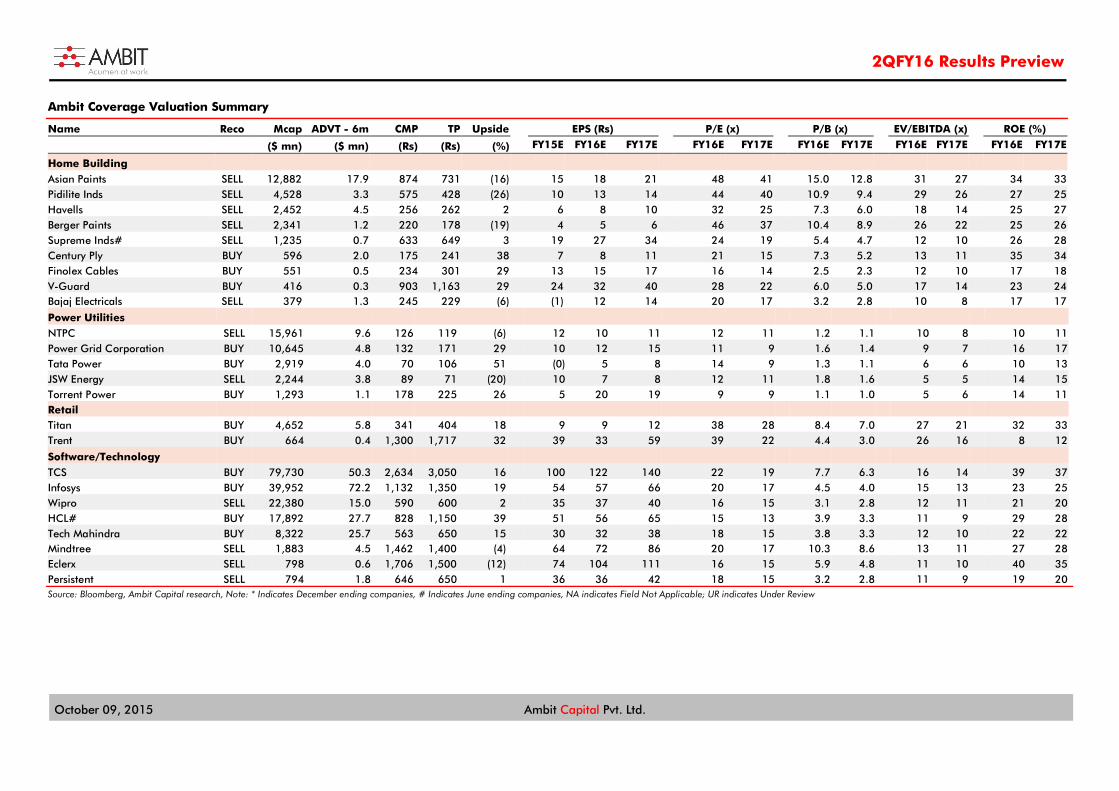
October 09, 2015 Ambit Capital Pvt. Ltd.
2QFY16 Results Preview
Ambit Coverage Valuation Summary
Name Reco Mcap ADVT - 6m CMP TP Upside
EPS (Rs)
P/E (x)
P/B (x) EV/EBITDA (x)
ROE (%)
($ mn) ($ mn) (Rs) (Rs) (%)
FY15E FY16E FY17E
FY16E FY17E
FY16E FY17E
FY16E FY17E
FY16E FY17E
Home Building Asian Paints SELL 12,882 17.9 874 731 (16) 15 18 21 48 41 15.0 12.8 31 27 34 33 Pidilite Inds SELL 4,528 3.3 575 428 (26) 10 13 14 44 40 10.9 9.4 29 26 27 25 Havells SELL 2,452 4.5 256 262 2 6 8 10 32 25 7.3 6.0 18 14 25 27 Berger Paints SELL 2,341 1.2 220 178 (19) 4 5 6 46 37 10.4 8.9 26 22 25 26 Supreme Inds# SELL 1,235 0.7 633 649 3 19 27 34 24 19 5.4 4.7 12 10 26 28 Century Ply BUY 596 2.0 175 241 38 7 8 11 21 15 7.3 5.2 13 11 35 34 Finolex Cables BUY 551 0.5 234 301 29 13 15 17 16 14 2.5 2.3 12 10 17 18 V-Guard BUY 416 0.3 903 1,163 29 24 32 40 28 22 6.0 5.0 17 14 23 24 Bajaj Electricals SELL 379 1.3 245 229 (6) (1) 12 14 20 17 3.2 2.8 10 8 17 17
Power Utilities
NTPC SELL 15,961 9.6 126 119 (6) 12 10 11 12 11 1.2 1.1 10 8 10 11 Power Grid Corporation BUY 10,645 4.8 132 171 29 10 12 15 11 9 1.6 1.4 9 7 16 17 Tata Power BUY 2,919 4.0 70 106 51 (0) 5 8 14 9 1.3 1.1 6 6 10 13 JSW Energy SELL 2,244 3.8 89 71 (20) 10 7 8 12 11 1.8 1.6 5 5 14 15 Torrent Power BUY 1,293 1.1 178 225 26 5 20 19 9 9 1.1 1.0 5 6 14 11 Retail Titan BUY 4,652 5.8 341 404 18 9 9 12 38 28 8.4 7.0 27 21 32 33 Trent BUY 664 0.4 1,300 1,717 32 39 33 59 39 22 4.4 3.0 26 16 8 12
Software/Technology TCS BUY 79,730 50.3 2,634 3,050 16 100 122 140 22 19 7.7 6.3 16 14 39 37 Infosys BUY 39,952 72.2 1,132 1,350 19 54 57 66 20 17 4.5 4.0 15 13 23 25 Wipro SELL 22,380 15.0 590 600 2 35 37 40 16 15 3.1 2.8 12 11 21 20 HCL# BUY 17,892 27.7 828 1,150 39 51 56 65 15 13 3.9 3.3 11 9 29 28 Tech Mahindra BUY 8,322 25.7 563 650 15 30 32 38 18 15 3.8 3.3 12 10 22 22 Mindtree SELL 1,883 4.5 1,462 1,400 (4) 64 72 86 20 17 10.3 8.6 13 11 27 28 Eclerx SELL 798 0.6 1,706 1,500 (12) 74 104 111 16 15 5.9 4.8 11 10 40 35 Persistent SELL 794 1.8 646 650 1 36 36 42 18 15 3.2 2.8 11 9 19 20 Source: Bloomberg, Ambit Capital research, Note: * Indicates December ending companies, # Indicates June ending companies, NA indicates Field Not Applicable; UR indicates Under Review
2QFY16 Results Preview
October 09, 2015 Ambit Capital Pvt. Ltd. Page 74
Institutional Equities Team Saurabh Mukherjea, CFA CEO, Institutional Equities (022) 30433174 [email protected]
Research
Analysts Industry Sectors Desk-Phone E-mail
Nitin Bhasin - Head of Research E&C / Infra / Cement / Industrials (022) 30433241 [email protected]
Aadesh Mehta, CFA Banking / Financial Services (022) 30433239 [email protected]
Abhishek Ranganathan, CFA Retail / Mid-caps (022) 30433085 [email protected]
Achint Bhagat, CFA Cement / Roads / Home Building (022) 30433178 [email protected]
Aditya Bagul Consumer (022) 30433264 [email protected]
Aditya Khemka Healthcare (022) 30433272 [email protected]
Ashvin Shetty, CFA Automobile (022) 30433285 [email protected]
Bhargav Buddhadev Power Utilities / Capital Goods (022) 30433252 [email protected]
Deepesh Agarwal Power Utilities / Capital Goods (022) 30433275 [email protected] Gaurav Mehta, CFA Strategy / Derivatives Research (022) 30433255 [email protected]
Girisha Saraf Mid-caps / Small-caps (022) 30433211 [email protected]
Karan Khanna Strategy (022) 30433251 [email protected]
Kushank Poddar Technology (022) 30433203 [email protected] Pankaj Agarwal, CFA Banking / Financial Services (022) 30433206 [email protected]
Paresh Dave, CFA Healthcare (022) 30433212 [email protected]
Parita Ashar, CFA Metals & Mining (022) 30433223 [email protected]
Prashant Mittal, CFA Derivatives (022) 30433218 [email protected]
Rakshit Ranjan, CFA Consumer (022) 30433201 [email protected]
Ravi Singh Banking / Financial Services (022) 30433181 [email protected]
Ritesh Gupta, CFA Oil & Gas / Chemicals (022) 30433242 [email protected]
Ritesh Vaidya, CFA Consumer (022) 30433246 [email protected] Ritika Mankar Mukherjee, CFA Economy / Strategy (022) 30433175 [email protected]
Ritu Modi Automobile (022) 30433292 [email protected]
Sagar Rastogi Technology (022) 30433291 [email protected]
Sumit Shekhar Economy / Strategy (022) 30433229 [email protected]
Utsav Mehta, CFA E&C / Industrials (022) 30433209 [email protected]
Sales
Name Regions Desk-Phone E-mail
Sarojini Ramachandran - Head of Sales UK +44 (0) 20 7614 8374 [email protected]
Dharmen Shah India / Asia (022) 30433289 [email protected]
Dipti Mehta India / USA (022) 30433053 [email protected]
Hitakshi Mehra India (022) 30433204 [email protected]
Krishnan V India / Asia (022) 30433295 [email protected]
Nityam Shah, CFA USA / Europe (022) 30433259 [email protected]
Parees Purohit, CFA UK / USA (022) 30433169 [email protected]
Praveena Pattabiraman India / Asia (022) 30433268 [email protected]
Shaleen Silori India (022) 30433256 [email protected]
Singapore
Pramod Gubbi, CFA – Director Singapore +65 8606 6476 [email protected]
Shashank Abhisheik Singapore +65 6536 1935 [email protected]
USA / Canada
Ravilochan Pola - CEO Americas +1(646) 361 3107 [email protected]
Production
Sajid Merchant Production (022) 30433247 [email protected]
Sharoz G Hussain Production (022) 30433183 [email protected]
Joel Pereira Editor (022) 30433284 [email protected]
Nikhil Pillai Database (022) 30433265 [email protected]
E&C = Engineering & Construction

2QFY16 Results Preview
October 09, 2015 Ambit Capital Pvt. Ltd. Page 75
Explanation of Investment Rating
Investment Rating Expected return (over 12-month)
BUY >10%
SELL <10%
NO STANCE We have forward looking estimates for the stock but we refrain from assigning valuation and recommendation
UNDER REVIEW We will revisit our recommendation, valuation and estimates on the stock following recent events
NOT RATED We do not have any forward looking estimates, valuation or recommendation for the stock
Disclaimer This report or any portion hereof may not be reprinted, sold or redistributed without the written consent of Ambit Capital. AMBIT Capital Research is disseminated and available primarily electronically, and, in some cases, in printed form.
Additional information on recommended securities is available on request.
Disclaimer
1. AMBIT Capital Private Limited (“AMBIT Capital”) and its affiliates are a full service, integrated investment banking, investment advisory and brokerage group. AMBIT Capital is a Stock Broker, Portfolio Manager and Depository Participant registered with Securities and Exchange Board of India Limited (SEBI) and is regulated by SEBI
2. AMBIT Capital makes best endeavours to ensure that the research analyst(s) use current, reliable, comprehensive information and obtain such information from sources which the analyst(s) believes to be reliable. However, such information has not been independently verified by AMBIT Capital and/or the analyst(s) and no representation or warranty, express or implied, is made as to the accuracy or completeness of any information obtained from third parties. The information, opinions, views expressed in this Research Report are those of the research analyst as at the date of this Research Report which are subject to change and do not represent to be an authority on the subject. AMBIT Capital may or may not subscribe to any and/ or all the views expressed herein.
3. This Research Report should be read and relied upon at the sole discretion and risk of the recipient. If you are dissatisfied with the contents of this complimentary Research Report or with the terms of this Disclaimer, your sole and exclusive remedy is to stop using this Research Report and AMBIT Capital or its affiliates shall not be responsible and/ or liable for any direct/consequential loss howsoever directly or indirectly, from any use of this Research Report.
4. If this Research Report is received by any client of AMBIT Capital or its affiliate, the relationship of AMBIT Capital/its affiliate with such client will continue to be governed by the terms and conditions in place between AMBIT Capital/ such affiliate and the client.
5. This Research Report is issued for information only and the 'Buy', 'Sell', or ‘Other Recommendation’ made in this Research Report such should not be construed as an investment advice to any recipient to acquire, subscribe, purchase, sell, dispose of, retain any securities and should not be intended or treated as a substitute for necessary review or validation or any professional advice. Recipients should consider this Research Report as only a single factor in making any investment decisions. This Research Report is not an offer to sell or the solicitation of an offer to purchase or subscribe for any investment or as an official endorsement of any investment.
6. This Research Report is being supplied to you solely for your information and may not be reproduced, redistributed or passed on, directly or indirectly, to any other person or published, copied in whole or in part, for any purpose. Neither this Research Report nor any copy of it may be taken or transmitted or distributed, directly or indirectly within India or into any other country including United States (to US Persons), Canada or Japan or to any resident thereof. The distribution of this Research Report in other jurisdictions may be strictly restricted and/ or prohibited by law or contract, and persons into whose possession this Research Report comes should inform themselves about such restriction and/ or prohibition, and observe any such restrictions and/ or prohibition.
7. Ambit Capital Private Limited is registered as a Research Entity under the SEBI (Research Analysts) Regulations, 2014.
Conflict of Interests
8. In the normal course of AMBIT Capital’s business circumstances may arise that could result in the interests of AMBIT Capital conflicting with the interests of clients or one client’s interests conflicting with the interest of another client. AMBIT Capital makes best efforts to ensure that conflicts are identified and managed and that clients’ interests are protected. AMBIT Capital has policies and procedures in place to control the flow and use of non-public, price sensitive information and employees’ personal account trading. Where appropriate and reasonably achievable, AMBIT Capital segregates the activities of staff working in areas where conflicts of interest may arise. However, clients/potential clients of AMBIT Capital should be aware of these possible conflicts of interests and should make informed decisions in relation to AMBIT Capital’s services.
9. AMBIT Capital and/or its affiliates may from time to time have or solicit investment banking, investment advisory and other business relationships with companies covered in this Research Report and may receive compensation for the same.
Additional Disclaimer for U.S. Persons
10. The research report is solely a product of AMBIT Capital 11. AMBIT Capital is the employer of the research analyst(s) who has prepared the research report 12. Any subsequent transactions in securities discussed in the research reports should be effected through Enclave Capital LLC. (“Enclave”). 13. Enclave does not accept or receive any compensation of any kind for the dissemination of the AMBIT Capital research reports. 14. The research analyst(s) preparing the email / Research Report/ attachment is resident outside the United States and is/are not associated persons of any U.S. regulated broker-dealer and that
therefore the analyst(s) is/are not subject to supervision by a U.S. broker-dealer, and is/are not required to satisfy the regulatory licensing requirements of FINRA or required to otherwise comply with U.S. rules or regulations regarding, among other things, communications with a subject company, public appearances and trading securities held by a research analyst account.
15. This report is prepared, approved, published and distributed by the Ambit Capital located outside of the United States (a non-US Group Company”). This report is distributed in the U.S.by Enclave Capital LLC, a U.S. registered broker dealer, on behalf of Ambit Capital only to major U.S. institutional investors (as defined in Rule 15a-6 under the U.S. Securities Exchange Act of 1934 (the “Exchange Act”)) pursuant to the exemption in Rule 15a-6 and any transaction effected by a U.S. customer in the securities described in this report must be effected through Enclave Capital LLC (19 West 44th Street, suite 1700, New York, NY 10036).
16. As of the publication of this report Enclave Capital LLC, does not make a market in the subject securities. 17. This document does not constitute an offer of, or an invitation by or on behalf of Ambit Capital or its affiliates or any other company to any person, to buy or sell any security. The information
contained herein has been obtained from published information and other sources, which Ambit Capital or its Affiliates consider to be reliable. None of Ambit Capital accepts any liability or responsibility whatsoever for the accuracy or completeness of any such information. All estimates, expressions of opinion and other subjective judgments contained herein are made as of the date of this document. Emerging securities markets may be subject to risks significantly higher than more established markets. In particular, the political and economic environment, company practices and market prices and volumes may be subject to significant variations. The ability to assess such risks may also be limited due to significantly lower information quantity and quality. By accepting this document, you agree to be bound by all the foregoing provisions.
Additional Disclaimer for Canadian Persons
18. AMBIT Capital is not registered in the Province of Ontario and /or Province of Québec to trade in securities and/or to provide advice with respect to securities. 19. AMBIT Capital's head office or principal place of business is located in India. 20. All or substantially all of AMBIT Capital's assets may be situated outside of Canada. 21. It may be difficult for enforcing legal rights against AMBIT Capital because of the above. 22. Name and address of AMBIT Capital's agent for service of process in the Province of Ontario is: Torys LLP, 79 Wellington St. W., 30th Floor, Box 270, TD South Tower, Toronto, Ontario M5K 1N2
Canada. 23. Name and address of AMBIT Capital's agent for service of process in the Province of Montréal is Torys Law Firm LLP, 1 Place Ville Marie, Suite 1919 Montréal, Québec H3B 2C3 Canada.
Additional Disclaimer for Singapore Persons 24. This Report is prepared and distributed by Ambit Capital Private Limited and distributed as per the approved arrangement under Paragraph 9 of Third Schedule of Securities and Futures Act (CAP 289)
and Paragraph 11 of the First Schedule to the Financial Advisors Act (CAP 110) provided to Ambit Singapore Pte. Limited by Monetary Authority of Singapore. 25. This Report is only available to persons in Singapore who are institutional investors (as defined in section 4A of the Securities and Futures Act (Cap. 289) of Singapore (the “SFA”).” Accordingly, if a
Singapore Person is not or ceases to be such an institutional investor, such Singapore Person must immediately discontinue any use of this Report and inform Ambit Singapore Pte. Limited.
Disclosure 26. Ambit and/or its associates have financial interest in Ashok Leyland, Ashoka Buildcon, Asian Paints, Axis Bank, Bajaj Auto, Bajaj Finance, Bank of Baroda, Cipla, City Union Bank, Coal India, Colgate
Palmolive, HCL Technologies, HDFC Bank, Hero Motocorp, HUL, ICICI Bank, IndusInd Bank, Infosys, ITC, JSW Energy, Kotak Mahindra Bank, L&T, Lupin, M&MFS, Magma, Maruti, NTPC, Power Grid, PNB, Shriram Transport Finance, SBI, Sun Pharma, TCS, Tata Steel, Thermax, Torrent Power, Ultratech Cement, VA Tech and Wipro.
27. Ambit and/or it associates have received compensation for investment banking/merchant banking/brokering services from Ashok Leyland, City Union Bank and Magma in the past 12 months.
Analyst Certification Each of the analysts identified in this report certifies, with respect to the companies or securities that the individual analyses, that (1) the views expressed in this report reflect his or her personal views about all of the subject companies and securities and (2) no part of his or her compensation was, is or will be directly or indirectly dependent on the specific recommendations or views expressed in this report. © Copyright 2015 AMBIT Capital Private Limited. All rights reserved.
Ambit Capital Pvt. Ltd. Ambit House, 3rd Floor. 449, Senapati Bapat Marg, Lower Parel, Mumbai 400 013, India. Phone: +91-22-3043 3000 | Fax: +91-22-3043 3100 CIN: U74140MH1997PTC107598 www.ambitcapital.com