Results Presentation. - MyBucks › docs › MyBucks-Results... · 2016 2017 2018 s Revenue Revenue...
20
www.mybucks.com Results Presentation. Full Year Results 2018
Transcript of Results Presentation. - MyBucks › docs › MyBucks-Results... · 2016 2017 2018 s Revenue Revenue...

1
www.mybucks.com
Results Presentation.
Full Year Results 2018

2
www.mybucks.com
Salient features.
▪ Operating profit improved by 26% year-on-year.
▪ Loss after tax improved as a result of increased revenues, improved impairment to revenue, reduced cost of
funding, and a stable cost to revenue ratio.
▪ Revenue increased by EUR 5.5m to EUR 61.3m predominantly driven by South Africa, Mozambique and
Uganda.
▪ The impairment to revenue has improved from 22% to 19% notwithstanding a significant increase in South
Africa’s impairment charge due to external factors.
▪ The cost of funding improved by five percentage points on the back of a capital raise of EUR 11.5m in
February 2018.
▪ Cost to revenue ratio remained stable, operating costs will be a key focus area of the business going forward.
▪ The business has continued to improve it’s Artificial Intelligence capabilities, the full impact which is expected
to be seen in future periods particularly around customer experience.

3
www.mybucks.com
Executive Chairman’s comments.
The group withstood challenging economic conditions as our investments in technology, human
capital and sound business fundamentals have paid off. I am pleased with the growth in our loan
book and disbursements in the past 12 months and happy to report that the business is stable. The
past year has been a period of consolidation, we have turned the lens inwards to heighten our
competitiveness and efficiency and standardise business systems, as well as the banking platforms,
throughout the group. Having proven that the group can generate economies of scale and
significantly improve impairment charges through technology, I believe MyBucks is on the right track
to both loan book growth and profitability in the near term.
MyBucks has managed to build on the foundation of a scalable group platform positioning it to
become Africa’s leading digital bank. We continue to follow our strategy to grow the business through
organic growth in existing and new markets, acquisitions, franchising models, joint venture models
and global business-to-business tech offerings.
“
”– Dave Van Niekerk, Executive Chairman

4
www.mybucks.com
MyBucks overview

5
www.mybucks.com
Agents
Operations:Employees1,188
Branches107
MFI operations
Supporting operations
Banking operations
MyBucks is a leading FinTech group listed in Frankfurt
that provides financial services and products through
technology in 13 countries across Africa, Europe and
Australia.
“Our vision is to enhance financial inclusion through our technology”
– Dave Van Niekerk, Executive Chairman
Company overview.
1,815

6
www.mybucks.com
MyBucks highlights.
Frankfurt-listed FinTech group
Focused on Africa
Operating 4 banks and 9 lending
operations
Providing banking, credit and insurance
products
We provide these products through a hybrid
of digital and traditional channels
We use our own internal developed
loan management system
Our gross loan book has grown at c.38%
per year, to c.EUR 100 million
We have disbursed c.EUR 500 million in
loans since inception
Our default rate has been stable at 7.1%
We have developed our own Artificial
Intelligence (A.I) algorithms for fraud
prevention, credit scoring and collections
Awards

7
www.mybucks.com
Evolution of the group.
€ 0
€ 20
€ 40
€ 60
€ 80
€ 100
€ 120
2011 2012 2013 2014 2015 2016 2017 2018
Millio
ns
Loan book < EUR 4m in 2013
Str
ate
gic
Init
iati
ves The move from a
traditional MFI to a
digital MFI with the
launch of GetBucks
online and GetBucks
mobile App.
Transition from a
digital MFI to
provide digital
financial services,
with the launch of
additional Apps as
well as insurance
products.
The MyBucks group
expands our Banking
license presence to 5
Countries as part of an
effort to access cheaper
forms of funding
(customer deposits, inter-
bank rates, etc.)
MyBucks continues to expand operations globally, assessing new opportunities
in both new and existing territories.
Key to this growth is laying a solid foundation in existing territories – fundamental
to this is a stable and long term capital structure. MyBucks will continue to raise
capital in local markets, and IPO our existing operations in their primary
markets to ensure our interests are aligned with the local investors and
stakeholders.
The MyBucks group is launched in 2011 as a traditional MFI providing
credit to unbanked consumers across Southern Africa.
#1 #2 #3 #4 #5
Tech
no
log
y
Develo
pm
en
t
Data warehouse
FinCloud SQL2008
Jessie Dexter Tess Donte Charlie Maica
Continuous development
MyBucks has grown to
13 countries, obtained
4 banking licenses,
developed 5 apps and
6 A.I. personalities,
and provided more
than 2 million loans in
less than 7 years.
* Includes the NFB (Malawi) loan book
*
Credit scoring Fraud prevention Chatbot CollectionsLoan uptake Client churn

8
www.mybucks.com
MyBucks business model.Leveraging technology across the lending process
Technology Results
• Credit cover
• Funeral cover
• Legal cover
• Medical cover
A.I.Jessie - Credit scoring
Dexter - Fraud prevention
Tess - WhatsApp chatbot
Maica - Collections algorithm
Donte - Loan uptake predictor
Charlie - Client churn prevention model
Digital financial
services offering to
the unbanked and
the underbanked.
Distribution
Apps
107 branches
1,815 agents
Websites
Business units Products
• Payroll
• SMME
• Agriculture
• Education
• Online consumer
Cre
dit
Insu
ran
ce
Ban
kin
g • Savings accounts
• Mobile transactions
• Transactional card
FinCloud - loan management platform
GetSure - insurance platform
MyBucks dashboards - real-time analytics
Portfolio management
www.getbucks.co.za
www.mbc.finance
www.nfb.mw
www.opportunitybank.co.ug
www.getsure.co.za

9
www.mybucks.com
Loan book analysis.
Gross loan book
€96.24mActive loans
265 054
Total disbursed
€495.17mTotal loans issued
2,380,438 0
50
100
150
200
250
FY '14 FY '15 FY '16 FY '17 FY '18
Annual Disbursements
(EUR m)
66%
34%
Average loan tenure
26 monthsValue Weighted3,24
29,22
33,99
23,99
9,55
0
10
20
30
40
18 - 25 26 - 35 36 - 45 46 - 55 55+
Age split (%)
Average age
38
Average Euro balance
€363Value Weighted
0,21%
25,04% 24,53%
16,36%
21,59%
0,00%
10,00%
20,00%
30,00%
Agricultural Educational Consumption Emergency SME
Customer use of loan proceeds (%)
0,1 0
8,06
46,4 45,5
00
10
20
30
40
50
1 to 3 4 to 6 7 to 12 13 to 36 37 to 60 61+
Term months (%)
0
20
40
60
80
100
FY '14 FY '15 FY '16 FY '17 FY '18
Net Loan Book
(EUR m)
0
200
400
600
Jan-18 Feb-18 Mar-18 Apr-18 May-18 Jun-18
Average Loan Balance (€)
As at 30 June 2018 Since inception

10
www.mybucks.com
Financial results

11
www.mybucks.com
❸
Commentary:
1. Revenue increased 10% during 2018.
2. The provisions to gross loan book ratio reduced from 20.2% to
10.9% on the back of improved loan book quality.
Group loan impairment charges remained flat while the
impairment to revenue has improved from 22% to 19%. This is
notwithstanding a 114% increase in South Africa’s impairment
charges, which contributed 63% of the group’s total impairment
charges. The latter was predominantly driven by a change in
the debit order dispute mechanism of banks in South Africa.
Counter measures are being discussed by various South African
regulators.
3. The operational model of MyBucks is now established, the cost
to revenue ratio has remained constant and there is capacity to
grow the business significantly through economies of scale with
minimal incremental operating costs (small variable cost
component).
4. Operating profit increased by 26% to EUR 14.4m
5. Cost of funding reduced substantially from 24.2% to 19.1% at
the respective year end.
6. Loss after tax improved as a result of increased revenues,
reduced impairment costs, a relatively stable operating expense
base and reduced cost of funding.
7. Capital (borrowings, deposits and equity) increased by
EUR 26m of which EUR 17m was deployed in new loan book,
EUR 5m was utilised for the acquisition of NFB (Malawi), EUR
3m for the acquisition of new PPE, EUR 3m was deployed in
new working capital, and resulted in a EUR 2m decrease in cash.
Summarised statement of profit or loss EUR 2016 2017 2018
Revenue 36,249,874 55,791,344 61,307,099
Impairments (6,749,063) (12,194,440) (11,834,181)
Other income 1 629,168 6,511,606 7,322,655
Operating expenses (19,050,881) (38,698,428) (42,355,870)
Operating profit 11,079,098 11,410,082 14,439,703
Investment revenue 1,499,738 2,683,535 3,671,478
Finance costs (11,692,667) (21,326,389) (22,723,688)
Tax (1,887,039) (3,428,701) (2,586,658)
Loss after taxation - continued operations (1,000,870) (10,661,473) (7,199,165)
Summarised statement of financial position EUR 2016 2017 2018
Loan book 38,798,603 68,526,928 85,722,930
Other assets 27,619,010 73,117,254 76,819,828
Cash and cash equivalents 18,904,369 15,050,536 13,036,969
Total assets 85,321,982 156,694,718 175,579,727
Borrowings 53,716,921 105,342,816 118,727,702
Deposits 388,816 11,493,563 20,668,749
Other liabilities 14,111,951 19,624,712 12,214,367
Total liabilities 68,217,688 136,461,091 151,610,818
Shareholders equity 17,104,294 20,233,627 23,968,909
Key ratios 2016 2017 2018
Revenue / net loan book (A) 93.4% 81.4% 71.5%
Cost of funding (B) 27.1% 24.2% 19.1%
Net interest margin (A-B) 66.3% 57.2% 52.4%
Provisions to gross loans 22.9% 20.2% 10.9%
Cost to revenue 52.6% 69.4% 69.1%
Return on equity (5.9%) (52.7%) (30.0%)
Equity to assets 20.0% 12.9% 13.7%
MyBucks financial results.MyBucks has created an optimal operational base
❶❷
❸❹
❺
❶
❷
Notes:
1. Other income includes share of profit in joint venture (NFB) of EUR 530,173 in 2018.
❼
❺
❼
❼
❻

12
www.mybucks.com
Commentary:
▪ Revenue increased 10% on the back of a larger loan book.
▪ However, revenue yield decreased as a result of the increase
in the proportion of the contribution of interest earning
assets by the banking operations to the group, which
generate lower interest yields compared to the lending
operations.
MyBucks financial results.Revenue & provisions
93%
81%
72%
0%
10%
20%
30%
40%
50%
60%
70%
80%
90%
100%
-
10
20
30
40
50
60
70
2016 2017 2018
Reven
ue y
ield
Reven
ue | E
UR
millio
ns
Revenue Revenue yield
22,9%
20,2%
10,9%
0,0%
5,0%
10,0%
15,0%
20,0%
25,0%
-
20
40
60
80
100
120
2016 2017 2018
Pro
vis
ion
s to
gro
ss lo
an
s
Gro
ss lo
an
bo
ok | E
UR
millio
ns
Gross loan book Provisions to gross loans
Gross loan book vs provision to gross loans
Revenue vs revenue yield
Commentary:
• The provisions to loan book ratio reduced from 20.2% to
10.9%.
• The reduction in the provisions to loan book ratio was
achieved owing to the increased loan book quality and the
implementation of MyBucks A.I.
• The provisions to loan book ratio, was further reduced as a
result of the banking operations contributing a larger
proportion of the group loan book. The banking operations
have better quality loan books than the lending operations.
13
www.mybucks.com
27,1%
24,2%
19,1%
0,0%
5,0%
10,0%
15,0%
20,0%
25,0%
30,0%
-
20
40
60
80
100
120
140
160
2016 2017 2018
Tota
l b
orr
ow
ing
s | EU
R m
illio
ns
Borrowings Deposits Cost of funding
53%
69% 69%
52%
62% 62%
0%
10%
20%
30%
40%
50%
60%
70%
80%
-
5
10
15
20
25
30
35
40
45
2016 2017 2018
Co
st t
o r
even
ue /
to
tal in
com
e
Op
era
tin
g e
xpen
ses
| EU
R m
illio
ns
Operating expenses Cost to revenue Cost to total income (revenue + other income)
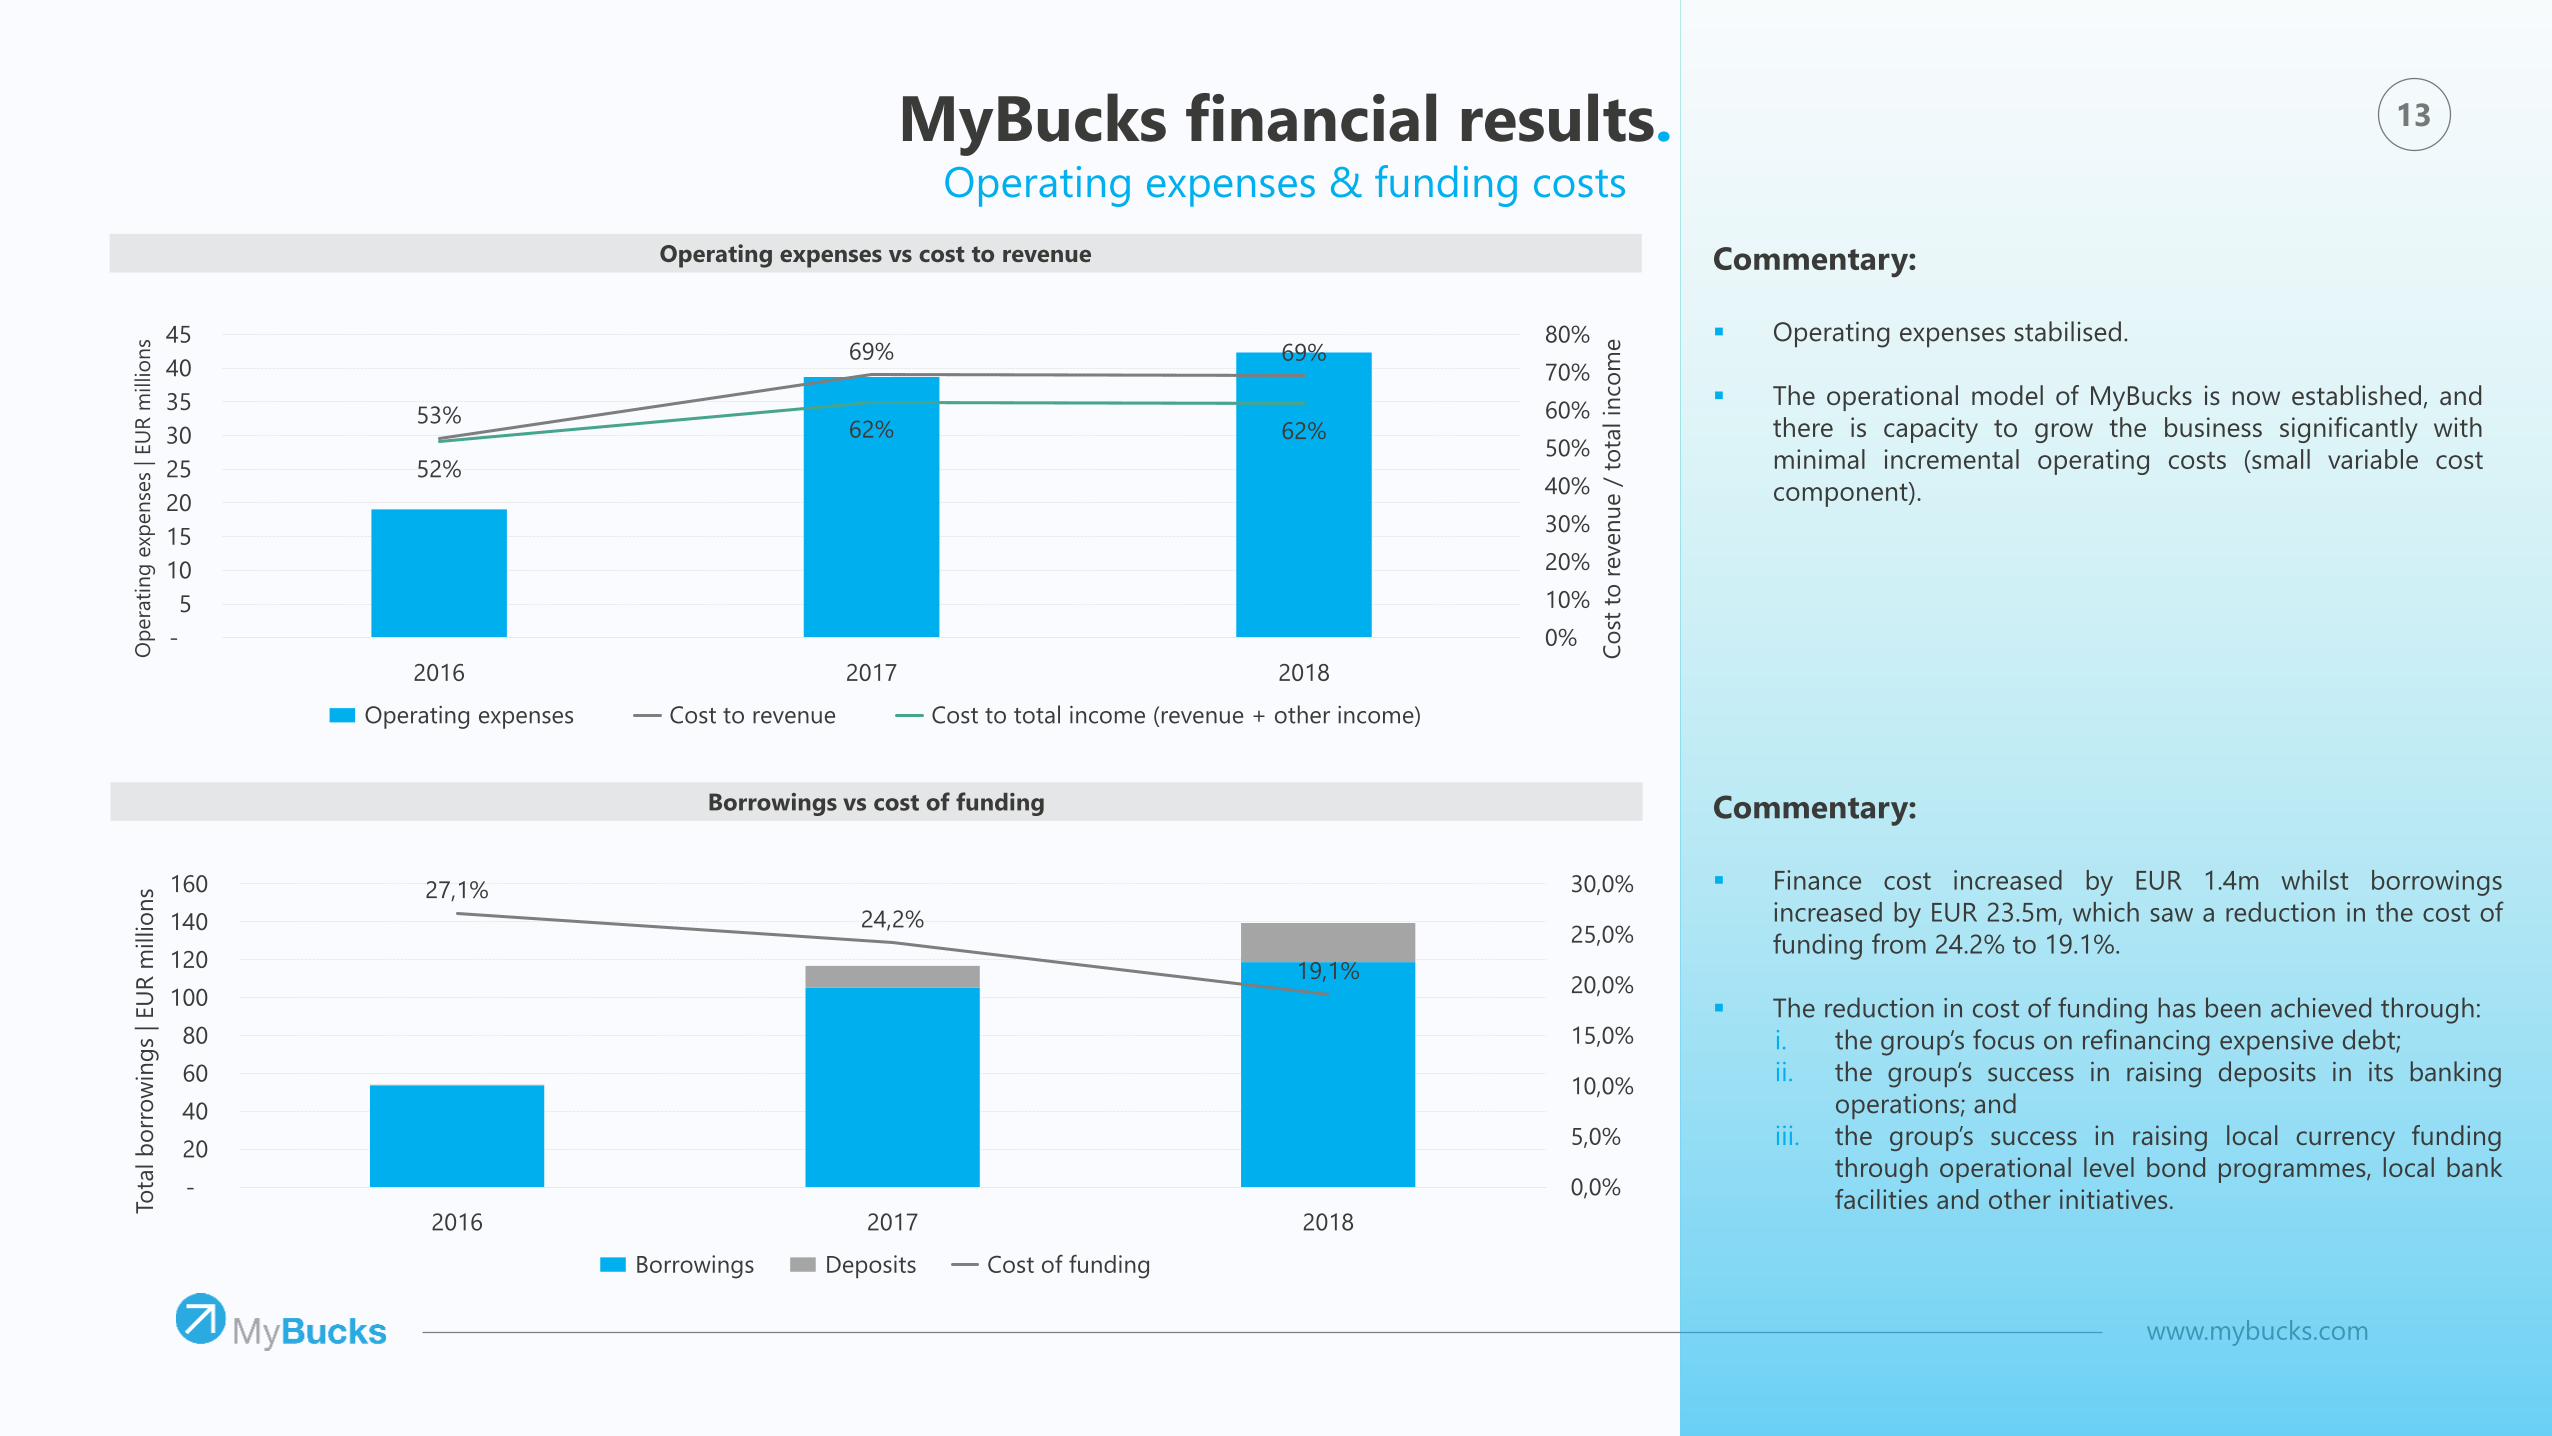
MyBucks financial results.Operating expenses & funding costs
Borrowings vs cost of funding
Operating expenses vs cost to revenue Commentary:
▪ Operating expenses stabilised.
▪ The operational model of MyBucks is now established, and
there is capacity to grow the business significantly with
minimal incremental operating costs (small variable cost
component).
Commentary:
▪ Finance cost increased by EUR 1.4m whilst borrowings
increased by EUR 23.5m, which saw a reduction in the cost of
funding from 24.2% to 19.1%.
▪ The reduction in cost of funding has been achieved through:
i. the group’s focus on refinancing expensive debt;
ii. the group’s success in raising deposits in its banking
operations; and
iii. the group’s success in raising local currency funding
through operational level bond programmes, local bank
facilities and other initiatives.

14
www.mybucks.com
Segmental Analysis - Overview Banking Lending Tech & HQ Eliminations Continued Operations
EUR
Summarised statement of profit and loss
Revenue 20,995,577 40,473,188 - (161,666) 61,307,099
Impairments (874,217) (10,959,962) - (2) (11,834,181)
Other income 1 2,378,101 6,585,482 819,390 (2,460,319) 7,322,655
Operating expenses (13,408,519) (18,359,629) (13,407,412) 2,819,690 (42,355,870)
Operating income 9,090,942 17,739,079 (12,588,022) 197,703 14,439,703
Investment revenue 1,108,728 1,694,022 841,625 27,103 3,671,478
Finance costs (1,965,611) (11,694,866) (9,178,639) 115,428 (22,723,688)
Inter-company charges (734,171) (502,283) 4,337,902 (3,101,448) -
Tax (1,290,093) (1,687,035) (54,908) 445,378 (2,586,658)
Profit/(loss) after tax 6,209,795 5,548,917 (16,642,041) (2,315,836) (7,199,165)
Summarised statement of financial position
Loan book 47,191,316 38,531,699 - - 85,723,015
Other assets 18,548,528 34,753,732 52,641,606 (29,124,123) 76,819,743
Cash and cash equivalents 6,988,264 5,120,205 899,594 28,906 13,036,969
Total assets 72,728,108 78,405,636 53,541,200 (29,095,217) 175,579,727
Total liabilities 45,554,885 62,957,762 70,990,983 (27,892,812) 151,610,817
Shareholders equity 27,173,223 15,447,874 (17,449,783) (1,202,405) 23,968,909
Key Performance Indicators 2
Revenue / net loan book (A) 44.5% 105.0% 71.5%
Cost of funding (B) 13.7% 23.4% 19.1%
Net interest margin (A-B) 30.8% 81.6% 52.4%
Provisions to gross loans 3.9% 18.3% 10.9%
Cost to revenue 63.9% 45.4% 69.1%
Return on equity 22.9% 35.9% (30.0%)
Equity to assets 37.4% 19.7% 13.7%
MyBucks financial results.Segmental results
Segmental results for 2018 Commentary:
1. The majority of the group’s revenue (65.8%) is generated by
the lending segment, primarily as a resulting of having a
portfolio of higher yielding products.
2. The higher yield is accompanied by a higher level of risk -
the lending segment contributed 92.6% of MyBucks
impairments in 2018 at an impairment to gross loan rate of
23.2% against a similar measure of 1.8% for the banking
segment.
3. It should be noted that most of the impairments were
isolated primarily South Africa (EUR 7.4m).
4. With relatively lower branch infrastructure and less
regulatory requirements, the cost to revenue of the lending
operations is much lower than the banking operations at
45.4% against 63.3%.
5. The banking segment raises funding at much lower rates
than the lending segment (13.7% vs 23.4% funding cost) as
a result of their ability to raise low cost deposits, and being
regulated institutions, perceived risk is priced lower on
borrowing.
6. Notwithstanding the banking segments’ lower cost of
funding, a combination of greater cost efficiencies and lower
costs of compliance (capital requirements, liquidity
requirements, etc.), at the current scale of the business, the
lending operations provide a higher ROE at 35.9% than the
banking institutions of 22.9%.
❶❷ ❸
❹
❺
Notes:
1. Other income includes share of profit in joint venture (NFB) of EUR 530,173 under Tech and HQ.
2. Ratios in the Segmental Analysis section calculated using end of period balances.
❻

15
www.mybucks.com
30,6%
20,5%
23,6%
0%
5%
10%
15%
20%
25%
30%
35%
-
2
4
6
8
10
12
14
16
2016 2017 2018
Op
era
tin
g p
ofi
t m
arg
in
Op
era
tin
g p
rofi
t | EU
R m
illio
ns
Operating profit Operating pofit margin
Commentary:
▪ Operating profit increase by EUR 3m, an increase of 27%
from the previous period.
▪ The increase in operating profit was achieved through
increased revenues, reduced impairment costs and relatively
stable operating expense base.
▪ Operating profit margin increases to 23.6%.
MyBucks financial results.Operating profit
Operating profit vs operating profit margin
Key components of operating profit
-
10
20
30
40
50
60
70
Revenue Impairments Operating expenses Operating profit
EU
R m
illio
ns
2017 2018
Commentary:
▪ With the stabilisation of operating expenses and
improvement in the provision to loan book ratio, MyBucks is
well positioned to benefit from operational efficiencies to
grow the business and increase profitability.

16
www.mybucks.com
(10.7)
5.5
0.4 0.8
1.0
0.8
(3.7)
(1.4)
(7.2)
(12)
(10)
(8)
(6)
(4)
(2)
-
Loss after tax
2017
Revenue Impairments Other income Operating
expenses
Investment
revenue
Finance costs Tax Loss after tax
2018
EU
R m
illio
ns
Earnings waterfall.2018 vs 2017 analysis
Commentary:
1. Loss after tax from continuing operations improved by
EUR 3.5m to a loss of EUR 7.2m in 2018.
2. MyBucks increased revenue by EUR 5.5m whilst also
reducing the impairment charges by EUR 0.4m.
3. Operating expense increased by EUR 3.7m but remained
stable at 69% of revenue.
4. Finance cost increased by EUR 1.4m, whilst total borrowing
increased by EUR 20m, resulting in a reduction of finance
cost by c. 5%.
❶ ❶
❷❷
❸
Operating profit increased by EUR 3m
❹

17
www.mybucks.com
Overview & strategic objectives. 17
Grow market share in the markets in which we operate.
Retain and improve on current provision and bad debt ratios.
Retain current fixed cost operating cost structure and limit further
variable costs.
Continuing to reduce finance costs.
Net interest margin of c.52%.
Cost of funding reduced by 5% in the last financial year.
Further efficiencies expected.
Restructuring of acquired entities finalised and all continuing
operations expected to be profitable in future periods.
Future strategic objectives:Situation as of end of June 2018:
Expand to new high growth geographic regions under new
strategic models.
Increase product diversification and revenue streams.
Reduction of provisions by implementing A.I.
Focus on reducing cost levels.
Explore new sources of capital.
Optimising the group’s tax structure.

18
www.mybucks.com
Shareholder information

19
www.mybucks.com
Shareholders information.
Shareholding as at 30 June 2018
20%
20%
12%9%
1%
38%
Sunblaze Investment Holdings
Tailored Investments
Ecsponent
Infinitum
Opportunity International
Free float
Date Shareholder calendar events
1 November 2018 Annual results 2018
TBC Annual general meeting
TBC Interim results 2019
TBC Annual results 2019
Date Other calendar events
1 November 2018 Investor roadshow, New York
1 November 2018 Finnovation Africa, Ethiopia
3 November 2018 Investor roadshow, San Francisco
5 November 2018 Investor roadshow, Silicon Valley
6 November 2018 Seamless West Africa, Ghana
8 November 2018 Investor roadshow, Geneva
8 November 2018 Africa FinTech Summit, Nigeria
12 November 2018 Investor roadshow, China
15 November 2018 Blockchain Startups Summit, Germany
21 November 2018 Investor roadshow, India
26 November 2018 Equity Forum, Germany
27 November 2018 Finnovate Africa, South Africa
29 November 2018 Investor roadshow, London
3 December 2018 Investor roadshow, UK & Europe

RCS Luxembourg: B199543
9, Rue de Laboratoire
L-1911 Luxembourg
Phone: +352 2088 2123
Email: [email protected]


![Modeling the Background for Incremental Learning in ... · State of the art methods are based on Fully Convolutional Neural Networks [20,2] and use different strategies to con-dition](https://static.fdocuments.us/doc/165x107/5fbb9887d1fe057d816e00ec/modeling-the-background-for-incremental-learning-in-state-of-the-art-methods.jpg)


![$ EDUCATIONAL FACILITIES REVENUE [AND REVENUE REFUNDING… · EDUCATIONAL FACILITIES REVENUE [AND REVENUE REFUNDING] ... Educational Facilities Revenue [and Revenue ... Aeronautical](https://static.fdocuments.us/doc/165x107/5b16e1207f8b9a686d8e7aa7/-educational-facilities-revenue-and-revenue-refunding-educational-facilities.jpg)


