Estonia-Latvia-Russia CBC Programme, 8th Newsletter, December 2013

Q1 results presentationCEO PEKKA TENNILÄ
CFO NIKLAS NYLANDER
8 MAY 2019
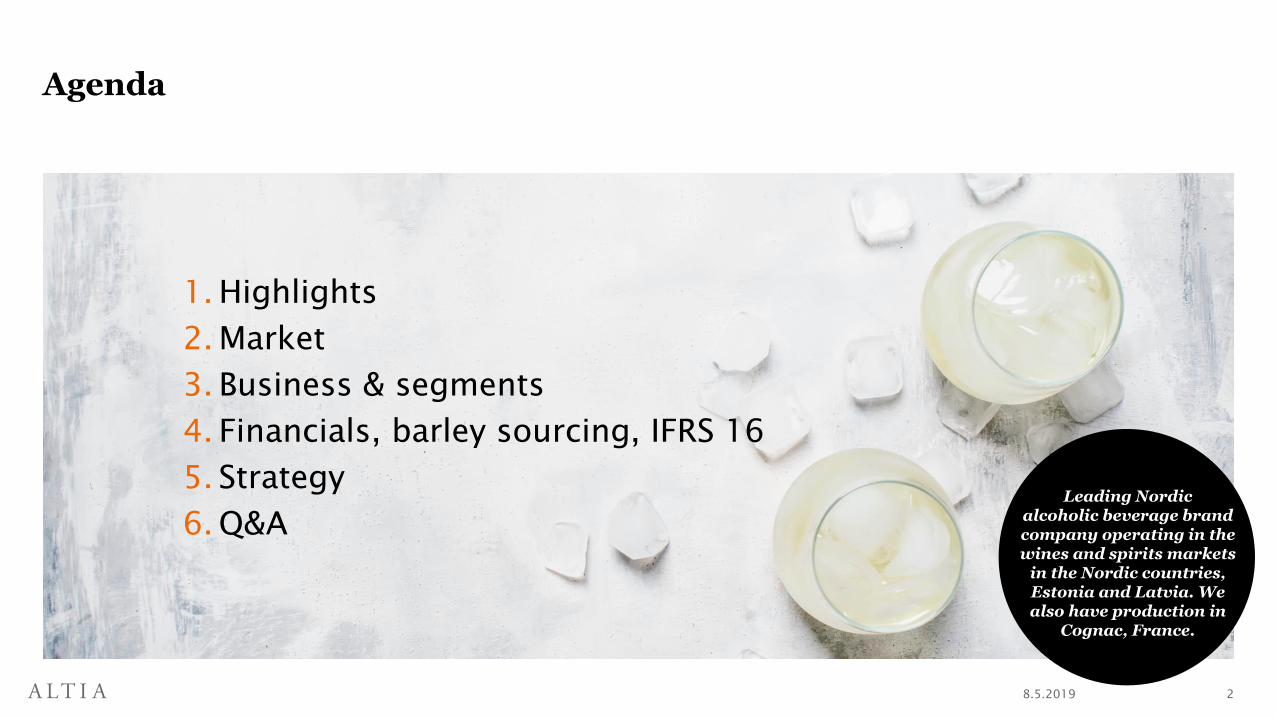
Agenda
8.5.2019 2
1. Highlights
2. Market
3. Business & segments
4. Financials, barley sourcing, IFRS 16
5. Strategy
6. Q&A
Leading Nordic alcoholic beverage brandcompany operating in thewines and spirits markets
in the Nordic countries, Estonia and Latvia. Wealso have production in
Cognac, France.

Leading Nordic alcoholic beverage brand house
8.5.2019 3
WE OPERATE ON THE STABLE AND PROFITABLE NORDIC MARKETS
Exports to
approx. 30
countries
Production
Distillery
Sales office
Head office
Warehouse

Stable net sales development, timing of Easter and high raw material costs impacted profitability
8.5.2019 4
HIGHLIGHTS FROM Q1 19
4.3 (5.2)73.8 (73.5) 5.8% (7.0%)EUR million
Comparable EBITDAReported net sales Comparable EBITDA margin
EUR million
Net salesgrew by 1.3% in constant currencies 3.2
Comparable EBITDA
without IFRS 16 impact
EUR million

Market development
• Nordic spirits and wine market in total – volumes in the three retail
monopolies down by -5.8%
– Spirits volumes -5.1%
– Wine volumes -5.9%
• The timing of Easter this year in April impacts the overall sales of wine and
spirits – volumes are not comparable
• Finland
– Changes in excise duties in January 2019
– Growing spirits categories were gin and whiskies; vodka and cognac declined
– Sparkling, white and rosé wines grew, red wine declined
• Sweden
– Growing spirits categories were gin and rums; aquavit, whisky, vodka, grape
spirits and liqueurs declined
– Sparkling and rosé wines grew, red and white wines declined
• Norway
– All spirits categories declinded
– Red wines continued to decline
8.5.2019 5
APPROXIMATELY TWO THIRDS OF CONSUMER PRODUCT SALES COME FROM STATE RETAIL MONOPOLIES
Combined spirits and wine sales volume development in the state retail monopolies
Change compared to
previous year, %Q1 19 Q1 18 Q1 17 2018
Finland, total sales -8.0 1.7 -3.0 -3.3
Spirits -5.3 0.4 -2.1 -3.6
Wine -9.1 2.2 -3.4 -3.2
Sweden, total sales -4.2 5.3 -3.4 +2.1
Spirits -3.6 8.8 -4.6 +2.7
Wine -4.3 5.0 -3.3 +2.0
Norway, total sales -7.9 9.2 -7.1 +1.5
Spirits -7.6 8.6 -6.1 +0.1
Wine -8.0 9.3 -7.3 +1.7
Easter in 2019 in Q2 (April), Easter in 2018 in Q1 (March)
Source: Based on sales volumes by litre published by the state retail
monopolies (Alko, Systembolaget, and Vinmonopolet).

Net sales highlights
• In constant currencies 1.3% above last year’s level
• Reported net sales were EUR 73.8 (73.5) million
• Altia Industrial’s growth driven by price increases and good
volumes in industrial products, and phasing in contract
manufacturing
• Due to Easter, Finland & Exports is down from last year and
Scandinavia in constant currencies is at last year’s level
• In January-April, the Group net sales were above last year’s
level, beverage sales were on last year’s level
• Net sales of beverages in constant currencies declined
by -4.4%
• Timing of Easter impacts sales volumes and sales mix of
consumer beverage products
• Spirits impacted negatively mainly by Easter timing
• New wine partner in mid last year has offset negative Easter
impact
• Other beverages impacted by partner portfolio changes in
2018
8.5.2019 6
TIMING OF EASTER IMPACTS Q1 AND COMPARABILITY
EUR million Q1 19 Q1 18
Reported
growth, %
Adjusted
growth, %* 2018
Altia Group 73.8 73.5 0.4 1.3 357.3
Finland & Exports 25.0 27.1 -7.7 -7.7 133.8
Scandinavia 21.7 22.5 -3.4 -0.5 117.7
Altia Industrial 27.1 24.0 13.1 13.1 105.8
EUR million Q1 19 Q1 18 Change, % 2018
Spirits 24.8 26.3 -5.9 124.0
Wine 21.3 21.4 -0.4 122.2
Other beverages 0.6 1.9 -68.3 5.3
*) Growth in constant currencies

0
2
4
6
8
10
12
14
0
5
10
15
20
25
Q1 18 Q1 19
Net sales, MEUR
Comparable EBITDA, margin %
Highlights
• Net sales were 25.0 (27.1) million
• Exports sales at last year’s level –
seasonality of consumption
• In grocery trade preparations for
summer season
• Price increases in monopoly in January
• Comparable EBITDA was 3.0 (3.4)
million – Easter impact reflected in
lower volumes and sales mix
• Comparable EBITDA without IFRS 16
impact EUR 2.9 million
Key financials
8.5.2019 7
Finland & Exports
Product launches & events
The Finland & Exports segment comprises the import, sale and marketing of wine and spirits, and other beverages in Finland and the Baltics, as well as exports and travel retail.
27 25
11.8%
-7.7%
MEUR %
12.7%

-5
-4,5
-4
-3,5
-3
-2,5
-2
-1,5
-1
-0,5
0
0
5
10
15
20
25
Q1 18 Q1 19
Net sales, MEUR
Comparable EBITDA, margin %
Highlights
• Reported net sales were EUR 21.7 (22.5)
million – in constant currencies, net sales at
last year’s level
• New wine partner in Sweden last year
offsets the timing of Easter and partner
portfolio changes in Sweden last year
• In Norway good development of market
share in spirits
• Price increases in Sweden in March and
Noway in January – not full impact in Q1
• Comparable EBITDA was EUR -0.3 (-0.1)
million - Easter impact reflected in lower
volumes and sales mix
• Comparable EBITDA without IFRS 16 impact
EUR -0.5 million
Key financials
8.5.2019 8
Scandinavia
Product launches & events
The Scandinavia segment comprises the import, sale and marketing of wine and spirits, and other beverages in Sweden, Norway and Denmark.
-3.4%23 22
-0.5%
-1.6%
MEUR %
• New partnership with Conaxess Trade
Beverages in Denmark

0
1
2
3
4
5
6
7
8
9
10
0
5
10
15
20
25
Q1 18 Q1 19
Net sales, MEUR
Comparable EBITDA, margin %
Highlights
• Net sales were 27.1 (24.0) million
• The growth in net sales is driven
mainly by price increases following
the high barley price, slightly higher
volumes in industrial products
compared to last year and phasing of
contract manufacturing volumes in
the first quarter
• Comparable EBITDA was 1.0 (1.4)
million
• Profitability negatively impacted by
high barley cost and Group internal
organisational transfers
• Comparable EBITDA without IFRS 16
impact EUR 0.5 million
Key financials
8.5.2019 9
Altia Industrial
Production
• The Koskenkorva plant has been
running at full capacity during the
first quarter and the plant’s volumes
were at last year’s level
The Altia Industrial segment comprises Koskenkorva plantoperations, starch, feed component and technical ethanolbusinesses, as well as contract manufacturing services at Rajamäki. It also includes supply chain operations, i.e. production operations in different countries, customerservice and logistics.
24 27
5.9%
13.1%
MEUR %
3.6%

FinancialsCFO NIKLAS NYLANDER

Barley cost and Easter impacted profitability in Q1
8.5.2019 11
SEASONALITY AFFECTS NET SALES AND PROFITABILITY
Quarterly net sales and comparable EBITDA, EUR million Quarterly and cumulative comparable EBITDA, EUR million
• Comparable EBITDA was EUR 4.3 (5.2) million, and without IFRS 16 impact EUR 3.2 million
• Comparable EBITDA margin was 5.8% (7.0%)
• Items affecting comparability amounted to EUR 0.0 (-4.1)
0
2
4
6
8
10
12
14
16
18
20
0
20
40
60
80
100
120
Q1 16 Q2 16 Q3 16 Q4 16 Q1 17 Q2 17 Q3 17 Q4 17 Q1 18 Q2 18 Q3 18 Q4 18 Q1 19
Net sales, MEUR Comparable EBITDA, MEUR
0
5
10
15
20
25
30
35
40
45
Q1 17 Q2 17 Q3 17 Q4 17 Q1 18 Q2 18 Q3 18 Q4 18 Q1 19
Comparable EBITDA, MEUR Comparable EBITDA YTD, MEUR
4.3
9.2
13.5
10.4
23.9
18.5
42.4
5.2
8.7
14.0
10.3
24.3
15.9
40.0
4.3*
*) includes IFRS 16 impact

0
5 000
10 000
15 000
20 000
25 000
30 000
0
50
100
150
200
250
January
May
Septem
ber
January
May
Septem
ber
January
May
Septem
ber
January
May
Septem
ber
January
May
Septem
ber
January
May
Septem
ber
January
May
Septem
ber
January
May
Septem
ber
January
May
Septem
ber
January
May
Septem
ber
January
May
Septem
ber
January
May
Septem
ber
January
Altia's grain purchases to Koskenkorva tn Average feed barley market price without premiums (Luke)
Barley sourcing
8.5.2019 12
Key principles for barley sourcing:
• Purchased at spot prices; No hedging tools available for barley
• About 1 month inventory; Volumes and purchase prices are fixed
a couple of months ahead
• New harvest in August-September
Barley price development and Altia’s monthly volumes 2007-2019 (Jan-Mar)
tnEUR/tn
Altia’s use of barleyin 2018 reached 211.7 (206.0) million kilos -Equals about 30% of
the total market volume
2007 2009 2011 2013 2015 2017
• Average monthly sourcing
volume 17000-18000 tn

Cash flow and balance sheet
8.5.2019 13
AS AT 31 MARCH
Net cash flow from operating activities EUR -28.7 (-27.0) million
Receivables sold EUR 39.0 (52.9) million
Net debt EUR 86.8 (75.9) million
Gearing 58.1% (56.9%)
Equity ratio 39.4% (34.9%)
Reported net debt to comparable EBITDA ratio,
rolling 12m
2.2 (1.8)
In use from revolving credit facility EUR 0.0 (20.0) million million
Nominal value of commercial papers issued EUR 10.0 (0.0) million

New accounting standards: IFRS 16 Leases
• The reporting period 1 January to 31 March 2019 includes the
adoption of the IFRS 16 standard as of 1 January 2019.
• Altia applies the simplified approach, according to which the
comparison information is not adjusted.
• The IFRS 16 standard had a positive effect of EUR 1.0 million on the
comparable EBITDA, a negative effect of EUR 1.0 million on
depreciation, and a negative effect of EUR 0.0 million on financial
expenses.
• On the consolidated balance sheet on 31 March 2019, the amount of
asset items based on rights of use is EUR 9.7 million, the amount of
long-term lease liabilities is EUR 6.6 million and the amount of short-
term lease liabilities is EUR 3.2 million.
• In the cash flow statement, cash payments for the capital portion of
the lease liability are presented under financing activities, and the
interest portion of the lease liability is presented in cash flows from
operating activities. Previously, all operating lease payments were
presented in cash flows from operating activities. This had a positive
effect of EUR 1.0 million on the Group’s cash flows from
operating activities and a negative effect of EUR 1.0 million on its
cash flows from financing activities in the first quarter of 2019.
8.5.2019 14
NOT SIGNIFICANT IMPACT ON ALTIA
Q1 19
Comparable EBITDA, EUR million 4.3
Net debt, EUR million 86.8
Equity ratio, % 39.4
Gearing, % 58.1
Comparable EBITDA without IFRS 16 impact, EUR million 3.2
Net debt without IFRS 16 impact, EUR million 77.0
Equity ratio without IFRS 16 impact, % 40.5
Gearing without IFRS 16 impact, % 51.6

StrategyCEO PEKKA TENNILÄ

Our financial targets aim towards stable shareholder returns
8.5.2019 16
+2 %CAGR
15 %
<2.5x
≥60 %of the result for the period
Net sales growth
Comparable EBITDA margin
Net debt / comparable EBITDA
Dividend policy
• Altia’s target is to achieve an annual net sales growth of 2 per cent over
time (CAGR)
• Comparable EBITDA margin target to reach 15 per cent in the long-term
• Altia’s target is to keep reported net debt in relation to comparable
EBITDA below 2.5x in the long-term
• Altia aims to pursue an active dividend policy, and the result for the
period not considered necessary to grow and develop the company will be
distributed to the shareholders

The core of our strategy is to deliver profitable growth
8.5.2019 17
• Grow wine segment with innovations and
higher level of co-operation with partners
• Focus on Sweden and Finland – monopoly
channel
• Expand and develop new business and co-
operation models
• Growth through innovations and co-
operation models
• Retail
• E-commerce and other digital platforms
Growth and profitabilitythrough the fivestrategic streams
1 Grow Nordic Core Brands
Execute a step change in wines2
Strengthen strategic partnerships
Channel expansion and development4
3
Fund and enable growth – continuous improvement of overall efficiency
• Efficiencies and new capabilities in the supply chain
• Organisational ways of working through simplification and digitalisation
• Product portfolio optimisation
• Continuous development of co-operation and industrial products offering
5
Commercial battles
• Expand into new geographical markets
• Innovate into new occasions and
consumer segmentsActive brand
portfolio
management
Altia continues to focus
on active brand
portfolio management,
potential selective
acquisitions and/or
divestments

Strengthening the strategy execution
Based on our strategy to create profitable growth, we have identified further specific initiatives to reach the earlier communicated long-term net sales and profitability targets.
8.5.2019 18
FURTHER INITIATIVES IDENTIFIED TO REACH LONG-TERM NET SALES AND PROFITABILITY TARGETS
Growth
Efficiencies
Initiatives within:
• Revenue management
• Expansion in growing categories in Sweden and Norway
• Exports of Nordic core brands
• Grocery trade and RTD category
Initiatives within:
• Procurement savings
• Supply chain efficiencies
• Product portfolio management
• Overall organisational efficiencies

Guidance 2019
• The comparable EBITDA is expected to improve from
the 2018 level.
– The positive trend of Altia’s Nordic core brand
portfolio is expected to continue.
– Market development in Finland is expected to flatten
out in comparison to 2018 and the markets in Sweden
and Norway are expected to grow.
– The negative impact of the increased barley cost will
be reflected in high raw material costs, especially in
the first quarters of the year.
– The guidance assumes a normal harvest in 2019.
• In addition, the impact from the implementation of the
new IFRS 16 standard is expected to improve
comparable EBITDA by EUR 3-4 million.
8.5.2019 19
8.5.2019 20
Timing of Easter has
a negative impact on
net sales and
profitability through
lower sales volumes
and sales mix
High raw material
costs in Q1 and
until new harvest
Guidance remains
unchanged
assuming normal
harvest
Net sales grew
by 1.3% in
constant currencies
Next events
Annual General Meeting 2019 on 15 May
Half-year Report on 15 August
Q&A AND SUMMARY

Thank youwww.altiagroup.com

8.5.2019 22
Appendices

Key ratios
8.5.2019 23
EUR million Q1 19 Q1 19 2018 2017
Net sales, EUR million 73.8 73.5 357.3 359.0
Comparable EBITDA, EUR million 4.3 5.2 40.0 42.4
% of net sales 5.8 7.0 11.2 11.8
Comparable EBITDA without IFRS 16 impact, EUR million 3.2
EBITDA, EUR million 4.3 1.1 34.0 40.3
Comparable operating result, EUR million -0.3 1.6 25.6 28.2
% of net sales -0.4 2.2 7.2 7.8
Operating result, EUR million -0.3 -2.5 19.7 26.1
Result for the period, EUR million 0.3 -1.8 15.1 18.3
Earnings per share, EUR 0.01 -0.05 0.42 0.51
Net debt / comparable EBITDA, rolling 12 months 2.2 1.8 1.2 1.1
Net debt/comparable EBITDA, rolling 12 months without IFRS 16 impact 2.0
Average number of personnel 698 705 718 762

Quarterly net sales and comparable EBITDA by segment
8.5.2019 24
EUR million Q1 19 Q4 18 Q3 18 Q2 18 Q1 18 Q4 17 Q3 17 Q2 17 Q1 17 Q4 16 Q3 16 Q2 16 Q1 16
Finland & Exports 25.0 39.5 31.8 35.4 27.1 40.7 31.4 35.7 26.0 41.1 31.6 33.9 27.3
Scandinavia 21.7 42.8 25.0 27.4 22.5 44.4 26.5 29.7 23.2 45.9 26.7 30.0 25.0
Altia Industrial 27.1 28.6 28.9 24.2 24.0 24.7 26.5 25.9 24.2 24.0 25.6 22.7 22.9
Total 73.8 110.9 85.7 87.1 73.5 109.8 84.5 91.3 73.4 111.0 83.9 86.6 75.1
EUR million Q1 19 Q4 18 Q3 18 Q2 18 Q1 18 Q4 17 Q3 17 Q2 17 Q1 17 Q4 16 Q3 16 Q2 16 Q1 16
Finland & Exports 3.0 6.2 4.9 4.6 3.4 7.2 4.0 5.2 3.1 7.7 4.5 4.3 3.6
Scandinavia -0.3 8.0 0.8 1.5 -0.1 8.9 1.0 2.1 -0.5 9.0 1.0 0.7 -0.3
Altia Industrial 1.0 2.2 4.8 2.5 1.4 3.7 4.5 2.6 1.6 2.6 3.4 2.6 -0.2
Other 0.6 -0.6 -0.3 0.2 0.4 -1.3 0.9 -0.8 0.1 -0.5 1.6 0.2 0.6
TOTAL comparable EBITDA 4.3 15.9 10.3 8.7 5.2 18.5 10.4 9.2 4.3 18.9 10.5 7.8 3.6
Items affecting comparability 0.0 0.0 0.0 -0.4 -4.1 -2.2 0.7 -0.2 -0.5 15.7 1.6 2.8 -0.1
EBITDA 4.3 15.9 10.3 8.3 1.1 16.3 11.1 9.0 3.8 34.6 12.1 10.6 3.6
Depreciation, amortisation and impairment -4.5 -3.6 -3.6 -3.5 -3.5 -3.6 -3.6 -3.5 -3.5 -3.7 -3.6 -3.6 -3.6
Operating result -0.3 12.3 6.6 4.8 -2.5 12.7 7.6 5.4 0.3 30.9 8.5 7.0 -0.0
Net sales by segment
Comparable EBITDA by segment

Reconciliation of alternative performance measures (APM) and items affecting comparability (IAC)
8.5.2019 25
EUR million Q1 18 Q1 17 2018 2017
Items affecting comparability
Net gains or losses from business and assets disposals - - 0.4 1.3
Cost for closure of business operations and restructurings - -0.2 -1.1 -1.1
Major corporate projects
Costs related to the closed voluntary pension scheme -0.7 -
Costs related to stock exchange listing - -3.9 -4.6 -2.4
Total items affecting comparability - -4.1 -6.0 -2.1
Comparable EBITDA
Operating result -0.3 -2.5 19.7 26.1
Less:
Depreciation, amortisation and impairment 4.5 3.5 14.4 14.2
Total items affecting comparability - 4.1 6.0 2.1
Comparable EBITDA 4.3 5.2 40.0 42.4
% of net sales 5.8 7.0 11.2 11.8
Comparable EBITDA without IFRS 16 impact
Comparable EBITDA 4.3 - - -
Less
IFRS 16 impact to EBITDA 1.0 - - -
Comparable EBITDA without IFRS 16 impact 3.2 - - -
Comparable EBIT
Operating result -0.3 -2.5 19.7 26.1
Less:
Total items affecting comparability - 4.1 6.0 2.1
Comparable EBIT -0.3 1.6 25.6 28.2
% of net sales -0.4 2.2 7.2 7.8

Consolidated income statement
8.5.2019 26
EUR million 2018 2017
NET SALES 357.3 359.0
Other operating income 7.4 8.3
Materials and services -206.8 -202.0
Employee benefit expenses -49.9 -52.0
Other operating expenses -73.9 -72.9
Depreciation, amortisation and impairment -14.4 -14.2
OPERATING RESULT 19.7 26.1
Finance income 3.5 4.5
Finance expenses -5.8 -6.4
Share of profit in associates and income from interests in joint operations 1.2 0.9
RESULT BEFORE TAXES 18.6 25.0
Income tax expense -3.6 -6.7
RESULT FOR THE PERIOD 15.1 18.3
Result for the period attributable to:
Owners of the parent 15.1 18.3
Earnings per share for the result attributable to owners of the parent, EUR
Basic and diluted 0.42 0.51

Cash flow from operations
8.5.2019 27
EUR million 2018 2017
CASH FLOW FROM OPERATING ACTIVITIES
Result before taxes 18.6 25.0
Adjustments
Depreciation, amortisation and impairment 14.4 14.2
Share of profit in associates and income from investments in joint operations -1.2 -0.9
Net gain on sale of non-current assets -0.5 -1.6
Finance income and costs 2.3 1.9
Other adjustments 0.8 0.5
15.7 14.1
Change in working capital
Change in inventories, increase (-) / decrease (+) -5.5 1.2
Change in contract assets, trade and other receivables, increase (-) / decrease (+) -7.4 9.4
Change in contract liabilities, trade and other payables, increase (+) / decrease (-) -4.3 -2.6
Change in provisions, increase (+) / decrease (-) - -1.3
Change in working capital -17.2 6.7
Interest paid -1.4 -1.7
Interest received 0.1 0.3
Other finance income and expenses paid -1.4 -2.2
Income taxes paid -8.0 -4.6
Financial items and taxes -10.6 -8.2
NET CASH FLOW FROM OPERATING ACTIVITIES 6.5 37.6
Working capital level driven bybarley and theexport and grocery tradeexpansion.
Items affectingcomparability(MEUR 6) and barleyimpacts negativelycash generation.
Too high taxestimate for theyear.

Consolidated balance sheet
EUR million 2018 2017
ASSETS
Non-current assets
Goodwill 80.7 82.1
Other intangible assets 29.6 34.4
Property, plant and equipment 64.6 67.4
Investments in associates and interests in joint operations 7.9 7.6
Available-for-sale financial assets 1.4 1.4
Other receivables - 1.0
Deferred tax assets - 1.0
Total non-current assets 0.8 194.8
Current assets
Inventories 99.6 94.5
Contract assets 0.2 -
Trade and other receivables 60.9 53.9
Current tax assets 2.5 2.8
Cash and cash equivalents 42.0 52.4
Total current assets 205.3 203.6
TOTAL ASSETS 390.4 398.4
8.1.2019 28
EUR million 2018 2017
EQUITY AND LIABILITIES
Equity attributable to owners of the parent
Share capital 60.5 60.5
Invested unrestricted equity fund 1.2 -
Fair value reserve 0.6 0.6
Hedge reserve 0.0 -0.3
Translation differences -19.6 -16.0
Retained earnings 107.3 92.0
Total equity 150.1 136.8
Non-current liabilities
Deferred tax liabilities 16.8 17.7
Borrowings 82.7 89.1
Employee benefit obligations 1.3 1.3
Total non-current liabilities 100.8 108.2
Current liabilities
Borrowings 6.7 11.0
Provisions 0.5 -
Trade and other payables131.4
137.4
Contract liabilities 0.6
Current tax liabilities 0.4 5.0
Total current liabilities 139.5 153.4
Total liabilities 240.3 261.6
TOTAL EQUITY AND LIABILITIES 398.4

Public sector
Financial and
insurance corporations
Households
Non-financial
corporations
Non-profit institutions
Rest of the world
Shareholder structure
8.5.2019 29
AS AT 31 MARCH 2019
44.3
30.7
18.4
4.21.4 0.8
44.3
30.7
18.4
4.2
1.4
0.8
ShareholdersNumber of
shares% of shares
1 Valtion Kehitysyhtiö Vake Oy 13 097 481 36.2
2 Varma Mutual Pension Insurance Company 1 550 000 4.3
3 Ilmarinen Mutual Pension Insurance Company 973 300 2.7
4 OP-Finland Small Firms Fund 559 516 1.5
5 Veritas Pension Insurance Company Ltd. 420 000 1.2
6 Säästöpankki Pienyhtiöt 235 617 0.7
7 Mandatum Life Insurance Company Limited 179 028 0.5
8 Säästöpankki Kotimaa 150 000 0.4
9 FIM Fenno Sijoitusrahasto 130 931 0.4
10 Takanen Jorma 122 617 0.3
Top 10 total 17 418 490 48.2
Nominee-registered shares 10 087 392 27.9

Retail offering
8.5.2019 308.5.2019 30
Koskenkorva
Vichy
sugarfree