Results Presentation 3Q15
14
TIM Brasil Investor Relations 1 Results Presentation 3 rd QTR 2015
Transcript of Results Presentation 3Q15
TIM BrasilInvestor Relations
1
Results
Presentation3rd QTR 2015

TIM BrasilInvestor Relations
2
A Tough Year
TIM Current Position
Short term Revenue challenges, but focus on Infrastructure,
Data and Efficiency continuesConsumer confidence
Inflation
FX Rate
Unemployment
Reducing but Still Significant Exposure to MTR
Offer based on community
Main Messages
9.8%
R$3.86/US$
8.7%
Bytes of Use
+30% YoY
Minutes of Use
-13% YoY
Prepaid81%
Postpaid19%
16%
8%
3Q13 3Q15
Industry Reshaping
Data Revenues
+41% YoYEfficiency / Opex
-20% YoY
EBITDA Margin
31.5%
Leadership in 4G cities covered
Service Revenues
-6.5% YoYEBITDA
-2.7% YoY
Costumer Mix Improving
75.7 pts(-25% YoY)
Source: ICC – FGV Oct; Central Bank of Brasil; Bloomberg; IBGE; Anatel and Company
+
-
TIM’s Results
3Q14 to 3Q15Building Infrastructure
+22% YoY CAPEX
Infrastructure Quality
Offer Innovation & Customer Experience
New Positioning for a New Reality
Completely New Portfolio
1
3Q14 3Q15
+13%
3Q14 3Q15
-6%

TIM BrasilInvestor Relations
3
3Q14 3Q15
~44%~63%
3Q14 3Q15
Smartphone Penetration
Strong and Resilient Data Performance
Innovative Data Net Revenues(R$mln; % YoY)
Bytes of Use(MB; % YoY)
4G Users(mln users)
Data ARPU*(R$; %YoY)
3Q13 3Q14 3Q15
Data connectivity
Content & Others
602
1,214
+18%
+41%
+34%
+2x
340
443
3Q14 3Q15
1,363
5,050
3Q14 3Q15
*Innovative Services

TIM BrasilInvestor Relations
4
36%
48%
58%
79%81% 82%
4Q14 3Q15 4Q15e
45
140
100
TIM
Player1
Player3
3,583
5,556
9,920
11,814
4Q14 3Q15
Infrastructure as a Stepping Stone to Growth
¹ Measures connection speed at any given time above Anatel’s target. Minimum required of 95% of measurements above target.² Average connection speed registered within the month. Required to provide at least 80% of the contracted speed.
Both indicators refers to country average weighted by customer base.
Coverage: Fast Expanding 3G/4G
+19%
+55%
Urban Pop. Covered (%) # of Sites
Instant Speed(SMP10)¹
Average Speed(SMP11)²
Mobile Broadband Project EvolutionImproving Mobile Broadband to
Support New Strategy
4G
3G
4G
3G
94% 96%
jul/14 jul/15
87%94%
jul/14 jul/15
# of Cities with 4G Coverage:
+2pp+300 cities
+12pp
Dec/14 Oct/15
+233 cities
173
83
3Q152Q151Q154Q143Q14
# of Cities with MBB
~70% of Total Data Traffic
278TIM
Player 1
Player 3
1
100+ mlnpeople
TIM BrasilInvestor Relations
5 9M14 9M15
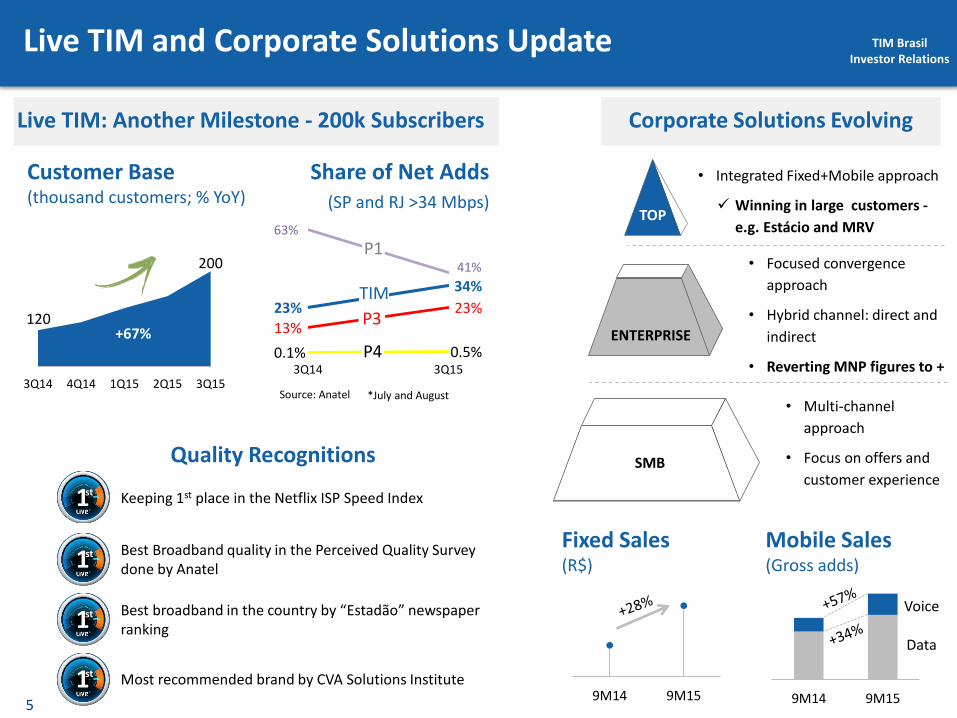
23%
34%
63%
41%
13%
23%
0.1% 0.5%3Q14 3Q15
Live TIM and Corporate Solutions Update
Keeping 1st place in the Netflix ISP Speed Index1st
Quality Recognitions
120
200
3Q14 4Q14 1Q15 2Q15 3Q15
+67%
Customer Base (thousand customers; % YoY)
Share of Net Adds(SP and RJ >34 Mbps)
TIM
P1
P3
P4
1st
1st
1st
Source: Anatel *July and August
TOP
• Focused convergence
approach
• Hybrid channel: direct and
indirect
• Reverting MNP figures to +
• Multi-channel
approach
• Focus on offers and
customer experience
• Integrated Fixed+Mobile approach
Winning in large customers -
e.g. Estácio and MRV
Live TIM: Another Milestone - 200k Subscribers Corporate Solutions Evolving
Best Broadband quality in the Perceived Quality Survey done by Anatel
Best broadband in the country by “Estadão” newspaper ranking
Most recommended brand by CVA Solutions Institute
PMESMB
ENTERPRISE
9M14 9M15
Fixed Sales(R$)
Mobile Sales (Gross adds)
Data
Voice

TIM BrasilInvestor Relations
6
4,045 3,784
+34% -15% -39%+11%
4,8534,117
-59%-6.5%
Tho
usa
nd
s
Total Net Revenues(R$ mln; %YoY)
Service Net Revenues(R$ mln; %YoY)
Revenue Dynamics: Data Progress Continues
3Q14 3Q15HandsetsService Net Revenues
-15%
Innovative Revenues Growing Relevance(Mobile Service Net Revenues mix)
23%34%
8%5%
69% 61%
3Q14 3Q15
Change in business model FX depreciation Less purchase power Move to higher value
channels
-6.5%
3Q14 3Q15Innovative FixedTraditional Incoming
Outgoing
Traditional + Incoming
Innovative
SMS

TIM BrasilInvestor Relations
7
Accelerating Short Term Savings, While Working on Structural Efficiency
Opex Performance (ex towers sale)(% YoY)
Efficiency Initiatives in All Fronts in Q3(% YoY; Δ R$mln YoY)
Efficiency Plan Update
Jan/15 Dec/17
R$ 1 bln
Selling & Marketing
Bad Debt
G&A
ITX & Network
COGS
Personnel Expenses
8.8%
-8.1%
-19.9%
3Q13
3Q14 3Q15
-10%
-15%
-52%
-10%
+1%
+9%
Sep/15
+3.3% -8.8% -9.7%Ex-COGS
~ 1% on Revenues

TIM BrasilInvestor Relations
8
1,332 1,296
267
27%31%
3Q14 3Q15
1,086776
820
9M14 9M15
Defending EBITDA with focus on Margin
Net Income(R$ mln; %YoY)
Net Debt(R$ mln)
7,331
2,502
4,829
Debt Cash &Securities
Net Debt
Towers Sale Impact
EBITDA & Margin (R$ mln; %YoY)
Service EBITDA & Margin (R$ mln; %YoY)
-2.7% -0.3%
Recent cash outs (R$):4G in 4Q14: 1.68bln4G in 2Q15: 0.37blnCapex > 0.66 bln YoY
0.46xNet Debt/LTM EBITDA
-28.6%
Towers Sale
Towers Sale
Towers Sale
Margin ex-towers
sale
Margin ex-towers
sale
1,378 1,374
267
34%36%
3Q14 3Q15
R$ mln 1st closing 2nd closing
#Towers sold 4,176 1,125
EBITDA +918 +267
Net Income +636 +184
Cash +1,897 +517
Debt -977 -230
NFP +921 +286

TIM BrasilInvestor Relations
9
TIM Mobile Portfolio Change:A Fast response to new market
reality and opportunities

TIM BrasilInvestor Relations
10
24.5
58.8
07 08 09 10 11 12 13 14 15e 16e 17e 18e
R$0.40
R$0.02
07 08 09 10 11 12 13 14 15e 16e 17e 18e 19e 64
602
14 15e 16e 17e 18e 19e
Community Era
MTR
Stabilization
Reality Check
Market
conditions
require a new
STRATEGY
Industry Evolution Path
Multiple SIM cycle
Prepaid segment to follow SIM card cycle
Data traffic booming
Data overcoming voice revenues by 2016
ExpansionConsolidation
07 08 09 10 11 12 13 14 15 16 e 17e 18e 11 12 13 14 15e 16e 17e
Brazil Mobile Traffic (PB)
Mln customers
82 min
07 08 09 10 11 12 13 14 15e16e
Voice slowdownAvg MarketMOU(min)
Source: Internal estimates and BofA ML Global Matrix
< 128 min
Data EraTransition

TIM BrasilInvestor Relations
11
Commercial Strategy Evolution
o Volume Driven (market share)
o Base of Pyramid
o Offer Based on Community
o Handset leadership (focus on volume)
o Mass Channels
o Mobile + B2C
o Value Driven (value share)
o Big Middle of Pyramid + Value Clients
o Bundle of Voice + Data + Off-net
o Handset Support (focus on value)
o Value Channels
o Mobile + B2C + B2B + selective convergence
15 16 17 18 19
OLDgo2market
NEW go2market
NEW PORTFOLIO
MODEL
Voice + data bundles
On-net + off-net voice
Recurring billing
Customer spending concentration
Protection of data value
TIM BrasilInvestor Relations
12
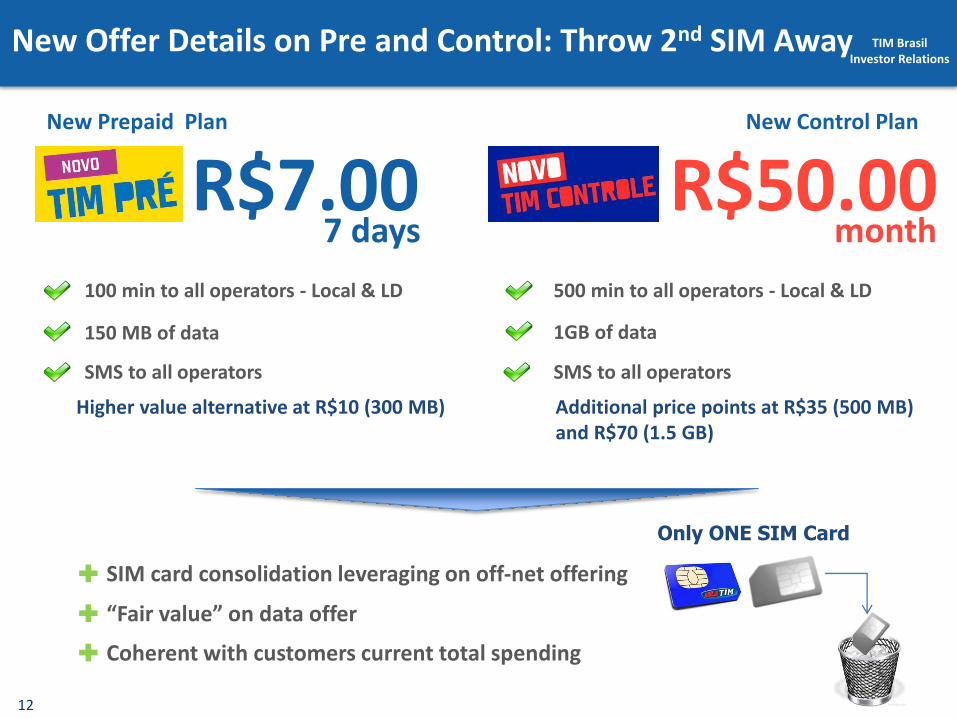
New Offer Details on Pre and Control: Throw 2nd SIM Away
SIM card consolidation leveraging on off-net offering
“Fair value” on data offer
Coherent with customers current total spending
Only ONE SIM Card
100 min to all operators - Local & LD
150 MB of data
SMS to all operators
R$7.007 days
500 min to all operators - Local & LD
SMS to all operators
1GB of data
New Control PlanNew Prepaid Plan
R$50.00month
Higher value alternative at R$10 (300 MB) Additional price points at R$35 (500 MB) and R$70 (1.5 GB)
TIM BrasilInvestor Relations
13
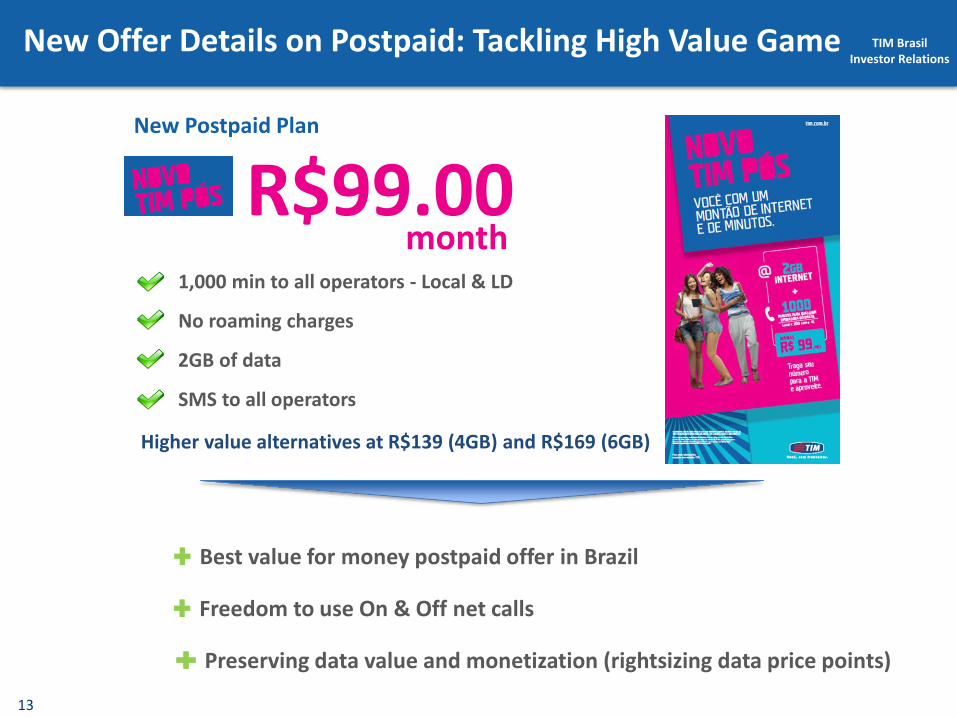
New Offer Details on Postpaid: Tackling High Value Game
Freedom to use On & Off net calls
Best value for money postpaid offer in Brazil
1,000 min to all operators - Local & LD
SMS to all operators
R$99.00month
New Postpaid Plan
Preserving data value and monetization (rightsizing data price points)
Higher value alternatives at R$139 (4GB) and R$169 (6GB)
No roaming charges
2GB of data
TIM BrasilInvestor Relations
14
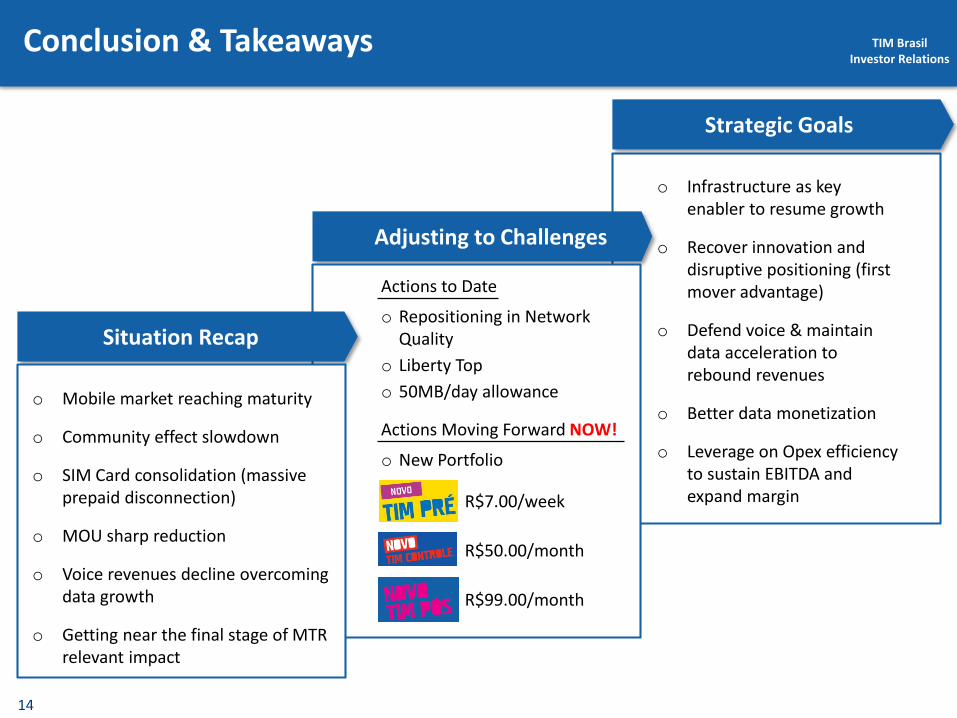
Conclusion & Takeaways
Strategic Goals
Adjusting to Challenges
o Infrastructure as key enabler to resume growth
o Recover innovation and disruptive positioning (first mover advantage)
o Defend voice & maintain data acceleration to rebound revenues
o Better data monetization
o Leverage on Opex efficiency to sustain EBITDA and expand margin
Situation Recap
o Mobile market reaching maturity
o Community effect slowdown
o SIM Card consolidation (massive prepaid disconnection)
o MOU sharp reduction
o Voice revenues decline overcoming data growth
o Getting near the final stage of MTR relevant impact
Actions to Date
o Repositioning in Network Quality
o Liberty Top
o 50MB/day allowance
Actions Moving Forward NOW!
o New Portfolio
R$7.00/week
R$50.00/month
R$99.00/month