Results Presentation 1H 2018 - prosegur.com · In millions of Euros FY 2017 1H 2018 Non-current...
21
1 Results Presentation 1H 2018
Transcript of Results Presentation 1H 2018 - prosegur.com · In millions of Euros FY 2017 1H 2018 Non-current...
1
Results Presentation
1H 2018
2
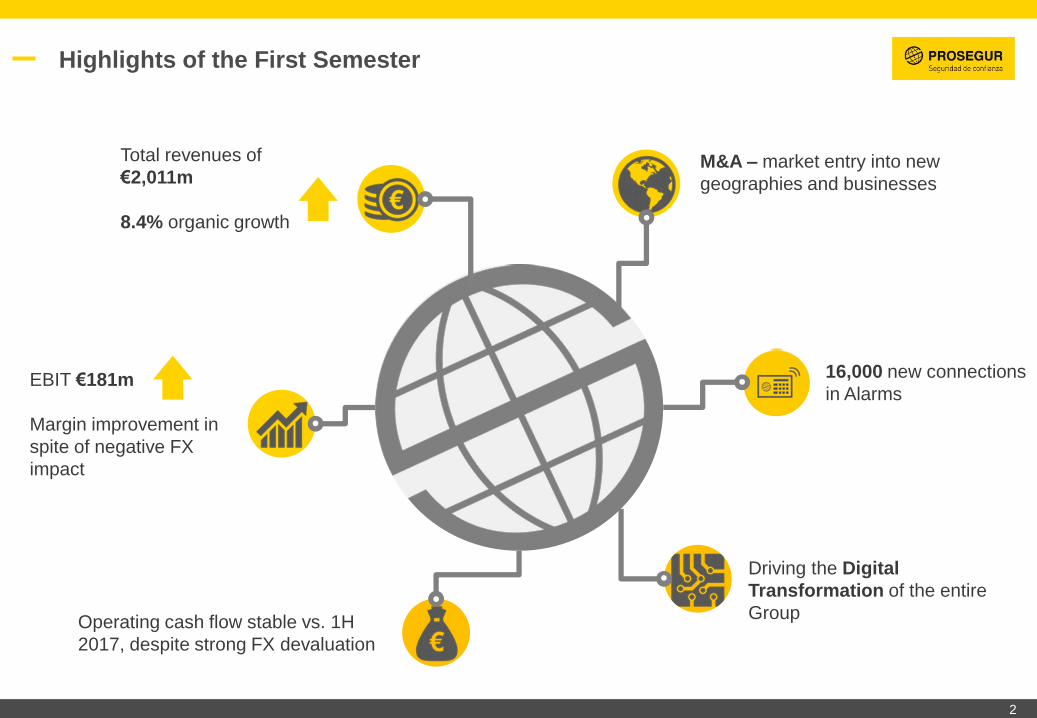
Highlights of the First Semester
Total revenues of
€2,011m
8.4% organic growth
EBIT €181m
Margin improvement in
spite of negative FX
impact
M&A – market entry into new
geographies and businesses
16,000 new connections
in Alarms
Driving the Digital
Transformation of the entire
GroupOperating cash flow stable vs. 1H
2017, despite strong FX devaluation

3
Consolidating our leadership position
across the whole continent
Expansion into new Geographies – CENTRAL AMERICA
Honduras
Costa Rica
Guatemala
El Salvador
Nicaragua
Adding 5 new countries to the region
Leading competitive positions in countries
where the industry is highly consolidated
Profitable operations across all countries, yet
still with high synergy potential
Main operating figures:
Close to 2,000 employees (90%
operational staff)
More than 240 armored trucks
Close to 1.5m stops per year
13 cash handling centers
4
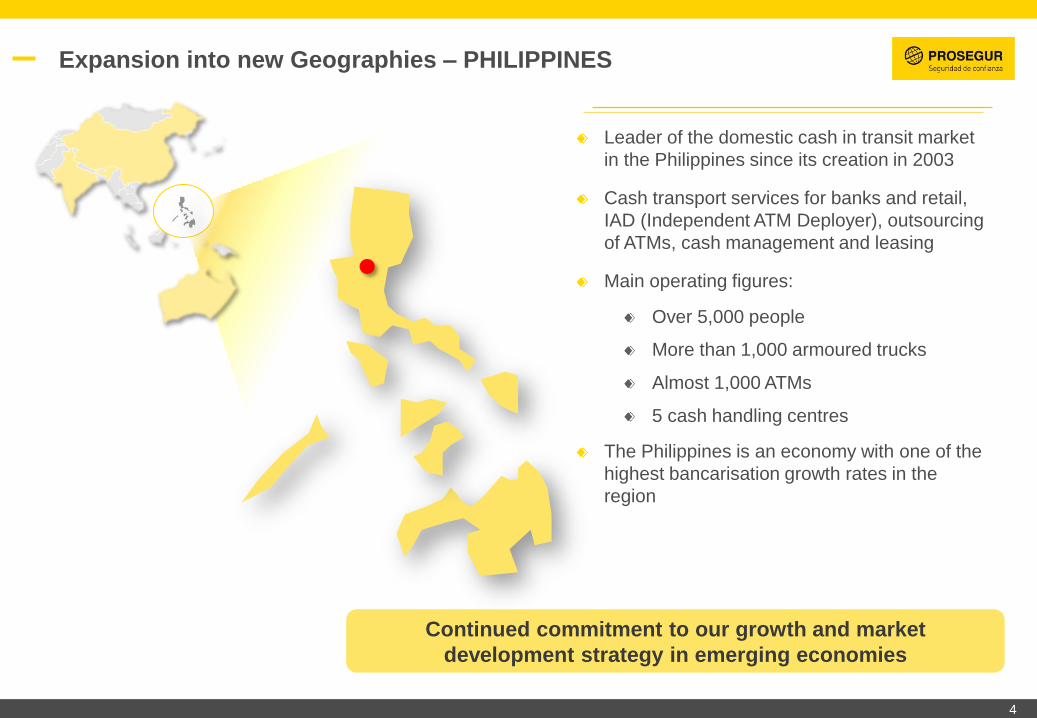
Leader of the domestic cash in transit market
in the Philippines since its creation in 2003
Cash transport services for banks and retail,
IAD (Independent ATM Deployer), outsourcing
of ATMs, cash management and leasing
Main operating figures:
Over 5,000 people
More than 1,000 armoured trucks
Almost 1,000 ATMs
5 cash handling centres
The Philippines is an economy with one of the
highest bancarisation growth rates in the
region
Expansion into new Geographies – PHILIPPINES
Continued commitment to our growth and market
development strategy in emerging economies
5
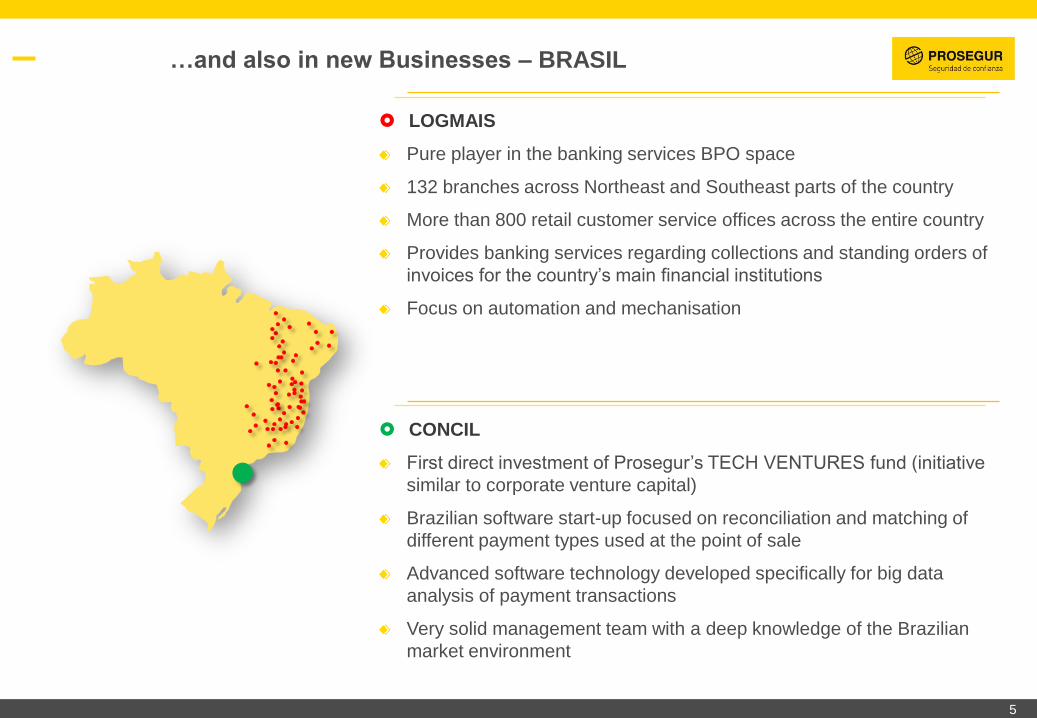
…and also in new Businesses – BRASIL
LOGMAIS
Pure player in the banking services BPO space
132 branches across Northeast and Southeast parts of the country
More than 800 retail customer service offices across the entire country
Provides banking services regarding collections and standing orders of
invoices for the country’s main financial institutions
Focus on automation and mechanisation
CONCIL
First direct investment of Prosegur’s TECH VENTURES fund (initiative
similar to corporate venture capital)
Brazilian software start-up focused on reconciliation and matching of
different payment types used at the point of sale
Advanced software technology developed specifically for big data
analysis of payment transactions
Very solid management team with a deep knowledge of the Brazilian
market environment

6
P&L
Consolidated Results 1H 2017(*) 1H 2018 % Change
In millions of Euros
Sales 2,129 2,011 (5.5)%
EBITDA 247 251 1.4%
Margin 11.6% 12.5%
Depreciation (51) (59)
EBITA 196 192 (2.0)%
Margin 9.2% 9.5%
Amortization of intangibles and others (12) (11)
EBIT 183 181 (1.5)%
Margin 8.6% 9.0%
Financial result (19) (5)
Profit before Taxes 164 176 +7.1%
Margin 7.7% 8.8%
Taxes (59) (64)
Tax Rate 35.6% 36.6%
Net Profit 106 112 +5.4%
Minority interests 19 31
Net consolidated Profit 86 81 (6.6)%
Earnings Per Share
(Euros per share)0.1 0.1
(*) Figures exclude extraordinary non-recurring costs and taxes related to the CASH IPO.
Sustained improvement of Net
Profit, with margin above 5%
EBIT margin improves by 40 basis
points, despite the FX impact
Revenues affected by currency
devaluation
More than 8% Growth in organic
terms
7
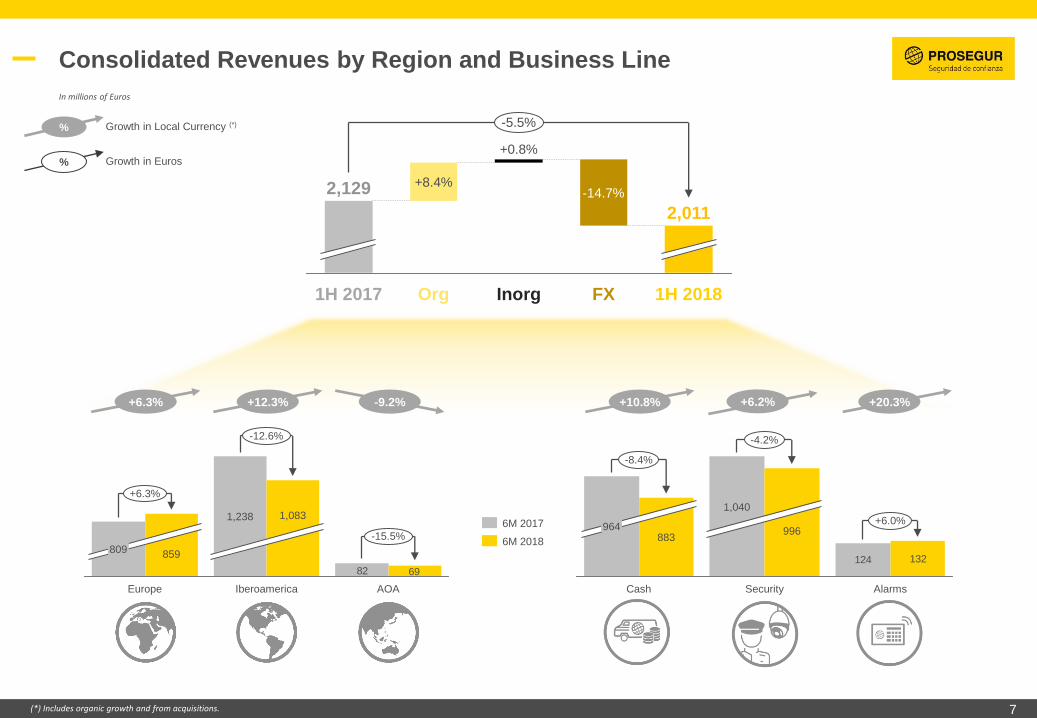
Consolidated Revenues by Region and Business Line
82 69
-15.5%
-12.6%
+6.3%
AOAIberoamerica
1,0831,238
Europe
859809124 132
+6.0%
-4.2%
-8.4%
AlarmsSecurity
996
1,040
Cash
8839646M 2017
6M 2018
% Growth in Local Currency (*)
% Growth in Euros
+6.3% -9.2%+12.3%
1H 2018
-5.5%
Org
+8.4%
1H 2017
2,129
2,011
FX
-14.7%
Inorg
+0.8%
(*) Includes organic growth and from acquisitions.
In millions of Euros
+10.8% +6.2% +20.3%
8
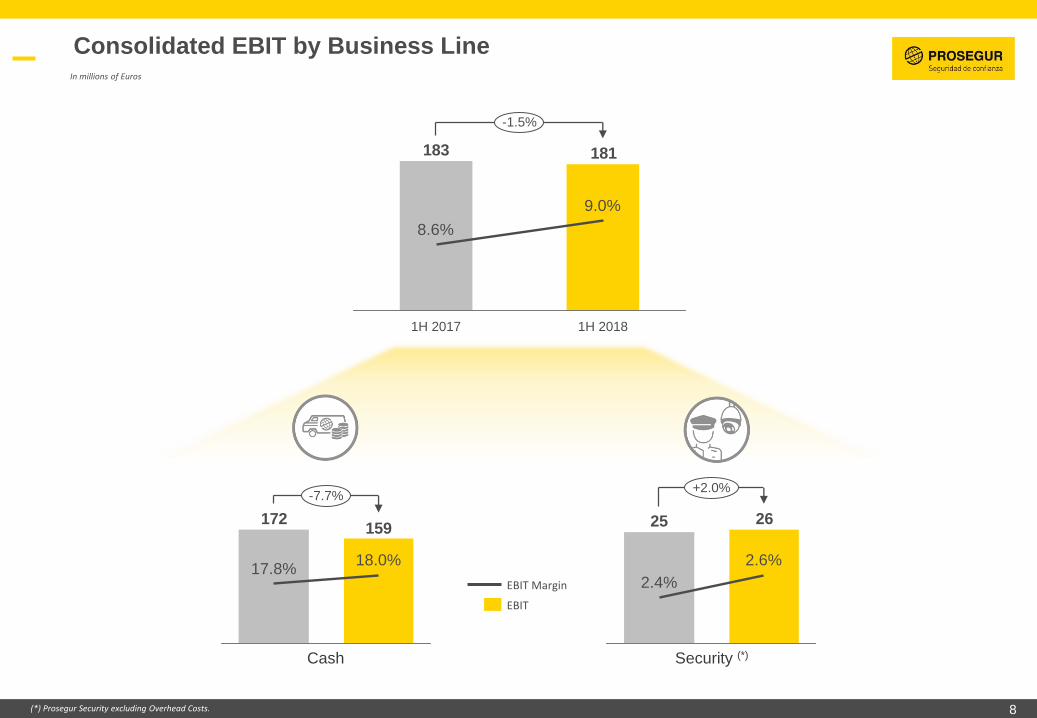
Consolidated EBIT by Business Line
(*) Prosegur Security excluding Overhead Costs.
181183
-1.5%
1H 2018
9.0%
1H 2017
8.6%
EBIT
EBIT Margin
2625
+2.0%
2.6%
2.4%
Cash Security (*)
159172
-7.7%
18.0%17.8%
In millions of Euros

9
Profitability keeps improving, regardless of Currency Fluctuations
10%
Q2Q1Q4Q3Q2Q1Q4Q3Q2Q1Q4Q3Q2Q1Q4Q3Q2Q1
2014 2015 2016 2017 2018 YTD
Δ Organic Revenues 10.2% 7.6% 12.2% 11.4% 8.4%
FX-Effect (11.4)% (3.0)% (13.9)% (1.9)% (14.7)%
EBIT Margin (full year) 8.1% 8.2% 8.8% 9.1% 9.0%
EBIT Margin (yearly accumulated)
EBIT (by quarter)

10
Results by Business Line

11
964
-8.4%
1H 2018
883
FX
-19.2%
Inorg
+1.7%
Org
+9.1%
1H 2017
159172
1H 2018
-7.7%
1H 2017
18.0%
17.8%
EBITEBIT Margin
PROSEGUR CASH
In millions of Euros.
Revenues
EBIT &
MarginMargin improvement evidencing the resilience of
our business model to macro-economic headwinds
Revenue grow in organic terms more than 9%
Strong negative FX effect
12
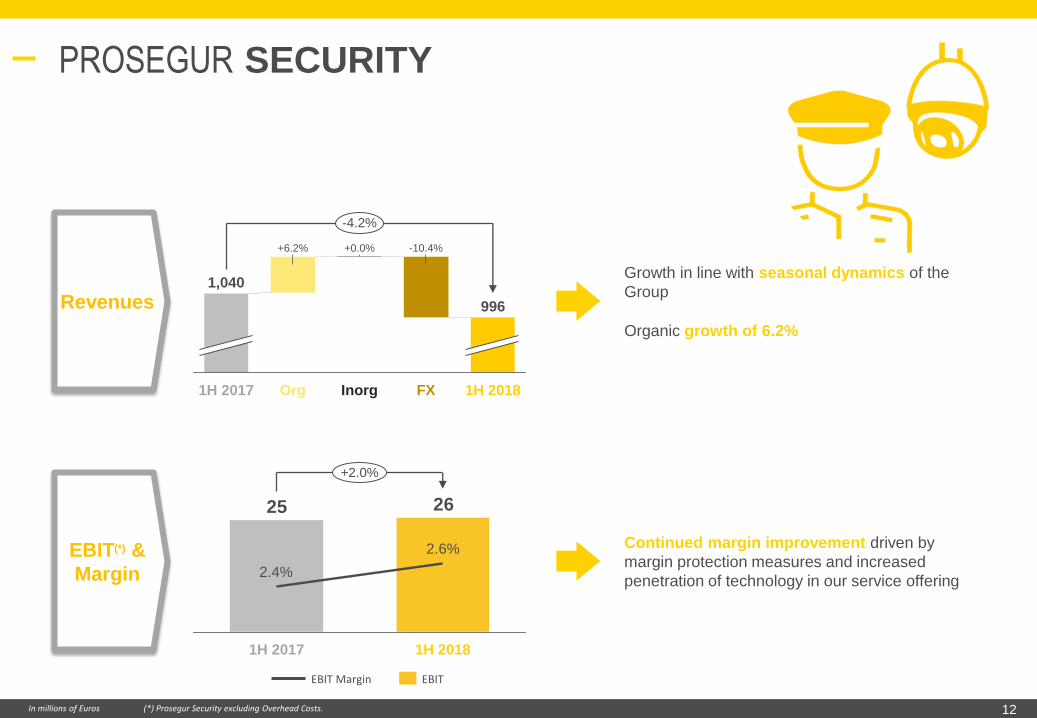
PROSEGUR SECURITY
In millions of Euros (*) Prosegur Security excluding Overhead Costs.
-4.2%
1H 2018
996
FX
-10.4%
Inorg
+0.0%
Org
+6.2%
1H 2017
1,040
2625
+2.0%
1H 2018
2.6%
1H 2017
2.4%
EBITEBIT Margin
Revenues
EBIT(*) &
Margin
Continued margin improvement driven by
margin protection measures and increased
penetration of technology in our service offering
Growth in line with seasonal dynamics of the
Group
Organic growth of 6.2%

13
PROSEGUR ALARMS
528499
424389
355
1H 20182017201620152014
FX
-14.3%
Inorg
+2.0%
Org
+18.3%
1H 2017
124
+6.0%
1H 2018
132
Revenues in millions of Euros – ARPU in Euros – BTC in thousands of connections.
Revenues
BTC Growth in net connections of 15.5% vs. 1H 2017
Maintaining growth rates of previous quarters
Revenue growth of over 18% in organic terms, well
above market average in each country
3638363835 Ø 36.7
1H 20182017201620152014
ARPUIn line with previous years. Improving in local
currency terms, but negatively affected by the FX
effect in Iberoamerica

14
Financial Information

15
Consolidated Cash Flow
In millions of Euros 1H 2017(*) 1H 2018
EBITDA 247 251Provisions and other non-cash items (3) (12)
Tax on profit (ordinary) (89) (76)
Changes in working capital (48) (59)
Interests payments (27) (22)
Operating cash flow 81 82
Acquisition of property, plant & equipment (86) (94)
Payments for acquisitions of subsidiaries (33) (14)
Divident payments (38) (69)
Other flows 790 (1)
Cash flow from investing / financing 633 (178)
Total net cash flow 713 (96)
Initial net financial position (712) (252)
Net increase / (decrease) in cash 713 (96)
Exchange rate (14) (43)
Final net financial position (13) (391)
(*) Figures exclude extraordinary non-recurring costs and taxes related to the CASH IPO.

16
Total Net Debt
-108 -120 -124 -118 -106
252350 391
29
33
3322
Jun. 2018
37
Mar. 2018Dec. 2017Sep. 2017
51
Jun. 2017
13
Treasury Stock (*)Net Financial Debt Deferred Payments
Amounts in millions of Euros – (*) Treasury stock of PROSEGUR and Prosegur CASH at closing market price of the period.
Net Financial Debt
Increase of 139 million Euros vs. year-end 2017, maintaining
low leverage level
Average cost of debt decreases by 40 basis points
vs. the same period in 2017 (1.8% vs. 2.2%)
Ratios
Net Financial Debt / EBITDA 0.7x
Net Financial Debt / Equity 0.4x
17
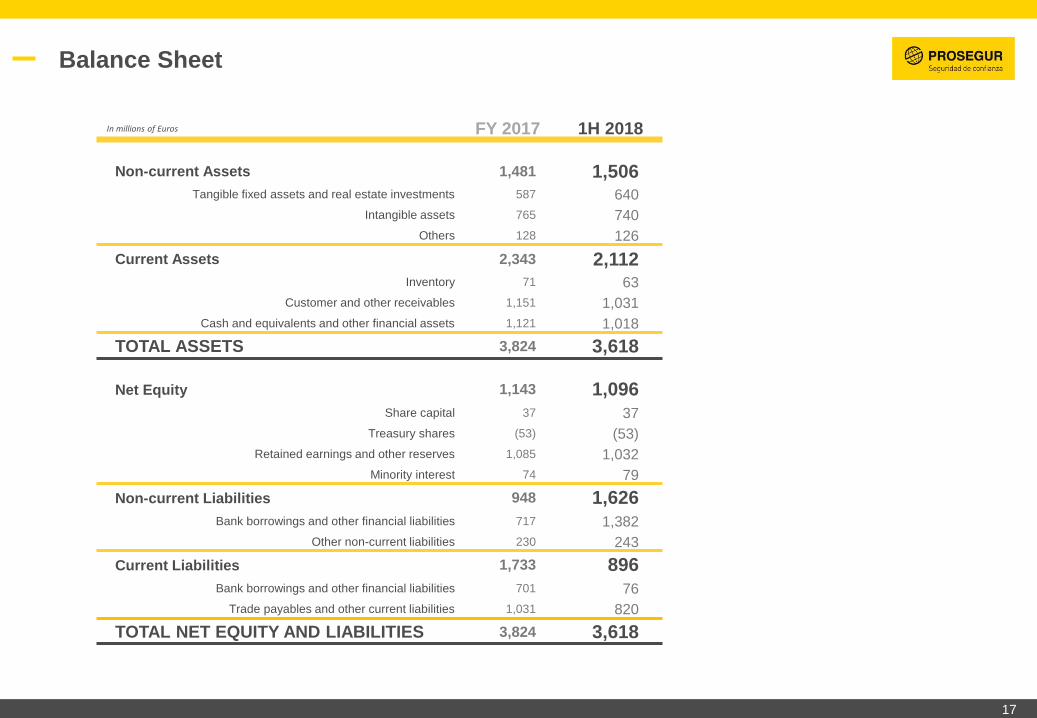
Balance Sheet
In millions of Euros FY 2017 1H 2018
Non-current Assets 1,481 1,506Tangible fixed assets and real estate investments 587 640
Intangible assets 765 740
Others 128 126
Current Assets 2,343 2,112Inventory 71 63
Customer and other receivables 1,151 1,031
Cash and equivalents and other financial assets 1,121 1,018
TOTAL ASSETS 3,824 3,618
Net Equity 1,143 1,096Share capital 37 37
Treasury shares (53) (53)
Retained earnings and other reserves 1,085 1,032
Minority interest 74 79
Non-current Liabilities 948 1,626Bank borrowings and other financial liabilities 717 1,382
Other non-current liabilities 230 243
Current Liabilities 1,733 896Bank borrowings and other financial liabilities 701 76
Trade payables and other current liabilities 1,031 820
TOTAL NET EQUITY AND LIABILITIES 3,824 3,618

18
Driving Digital Transformation
Standardization, digitalization and automation of all business processes
• Reduction of operating costs• Improved efficiency of back-office processes
Upgrading of IT platform and systems to “next generation technologies”
• Improvement of speed and operational scalability • Faster integration of M&A transactions
“Augmented” Services
• Embedding “data” and “intelligence” in our processes in order to incorporate “real time” information as well as predictive models in our client service offering
Promoting an open and innovative approach
• Through our Prosegur Tech-Ventures fund• Alliances with different international stakeholders and institutions • Guaranteeing direct access to the latest, most relevant innovations
for our different business lines
1001100
010010011
00110011
00110011
011011
1001001
01001001100110011
00110011
1001001
011
011011
1001
010010011
19
Conclusions and Final Remarks
Strong resilience of the business, despite negative FX impact
All business lines continue to show positive performance, and are
all within their stable growth parameters
Expansion to new geographies and entry into new activity lines
Profitability keeps improving, with margins very close to our
historical maximum
The Group’s financial discipline continues to contribute
efficiencies

20
Legal disclaimer
This document has been prepared
exclusively by Prosegur for use as
part of this presentation.
The information contained in this
document is provided by Prosegur
solely for information purposes, in
order to assist parties that may be
interested in undertaking a
preliminary analysis of it; the
information it contains is limited and
may be subject to additions or
amendments without prior notice.
This document may contain
projections or estimates concerning
the future performance and results of
Prosegur’s business.
These estimates derive from
expectations and opinions of
Prosegur and, therefore, are subject
to and qualified by risks,
uncertainties, changes in
circumstances and other factors that
may result in actual results differing
significantly from forecasts or
estimates.
Prosegur assumes no liability nor
obligation to update or review its
estimates, forecasts, opinions or
expectations.
The distribution of this document in
other jurisdictions may be prohibited;
therefore, the recipients of this
document or anybody accessing a
copy of it must be warned of said
restrictions and comply with them.
This document has been provided
for informative purposes only and
does not constitute, nor should it be
interpreted as an offer to sell,
exchange or acquire or a request for
proposal to purchase any shares in
Prosegur.
Any decision to purchase or invest in
shares must be taken based on the
information contained in the
brochures filled out by Prosegur from
time to time.
21
Antonio de Cárcer
Head of Investor Relations
Tel: +34 91 589 83 29
Cristina Casado
Investor Relations
Tel: +34 91 589 83 47