Results of Vapor Recovery System Performance Testing ...
34
Monitoring and Laboratory Division Vapor Recovery and Fuel Transfer Branch Vapor Recovery Regulatory Development Section Project Number: VR-11-11 Report No. VR-OP-A1 OVERPRESSURE STUDY: Technical Support Document Results of Vapor Recovery System Performance Testing Conducted at Gasoline Dispensing Facilities Equipped with the Assist Phase II Enhanced Vapor Recovery System which Experience Pressure Increase While Dispensing December 6, 2017 This report has been reviewed by the staff of the California Air Resources Board and approved for publication. Approval does not signify that the contents necessarily reflect the views and policies of the Air Resources Board, nor does mention of trade names or commercial products constitute endorsement or recommendation for use.
Transcript of Results of Vapor Recovery System Performance Testing ...

Monitoring and Laboratory Division Vapor Recovery and Fuel Transfer Branch
Vapor Recovery Regulatory Development Section
Project Number: VR-11-11
Report No. VR-OP-A1
OVERPRESSURE STUDY:
Technical Support Document Results of Vapor Recovery System Performance Testing
Conducted at Gasoline Dispensing Facilities Equipped with the Assist Phase II Enhanced Vapor Recovery System which Experience Pressure
Increase While Dispensing
December 6, 2017
This report has been reviewed by the staff of the California Air Resources Board and approved for publication. Approval does not signify that the contents necessarily reflect the views and policies of the Air Resources Board, nor does mention of trade names or commercial products constitute endorsement or recommendation for use.

INTENTIONALLY LEFT BLANK
.

TABLE OF CONTENTS
EXECUTIVE SUMMARY................................................................................................ 1
I. BACKGROUND........................................................................................................ 2
II. OBJECTIVE.............................................................................................................. 3
III. METHODOLOGY ..................................................................................................... 4 A. Identification of Vapor Recovery System Performance Testing............................ 4 B. Geographic Distribution of GDF Selected for Testing........................................... 5 C. Selection Criteria within Each Region................................................................... 6
IV. RESULTS................................................................................................................. 7 A. UST Pressure and Ullage Volume Profile Immediately Prior to Testing ............... 7 B. Accuracy of ISD Components............................................................................. 13
• ISD Vapor Pressure Sensor............................................................................. 13 • ISD Vapor Flow Meter...................................................................................... 14
C. Vapor-to-Liquid Ratios and Fuel Dispensing Rates............................................ 15 D. Dispenser Integrity.............................................................................................. 15 E. Clean Air Separator Operability .......................................................................... 16 F. Distribution of Vapor to Liquid Ratios from ISD Fueling Transaction Records.... 17
V. DISCUSSION ......................................................................................................... 26
VI. CONCLUSION........................................................................................................ 27
VII. APPENDICES ........................................................................................................ 28

LIST OF TABLES Table I-1: Distribution of 400 GDFs for ISD Data Collection.......................................... 2
Table III-1: Description of Vapor Recovery System Performance Testing for GDFs Equipped with Assist Phase II EVR System .............................................. 4
Table III-2: Description of ISD Reports to Download from Each GDF ........................... 5
Table III-3: Distribution of GDFs for VRS Performance Testing..................................... 5
Table III-4: GDFs Targeted for VRS Performance Testing ............................................ 6
Table IV-1: GDF Average UST Pressure and PWD Status ........................................... 7
Table IV-2: Performance Summary of ISD Pressure Sensor....................................... 13
Table IV-3: Performance Summary of ISD Flow Meter................................................. 14
Table IV-4: Summary of Dispensing (Flow Rate & V/L Ratio) Performance ................ 15
Table IV-5: Summary of Dispenser Integrity Test ........................................................ 16
Table IV-6: Summary of Clean Air Separator (CAS) Integrity ...................................... 17
Table IV-7: Summary of ISD Fueling Transaction ....................................................... 18
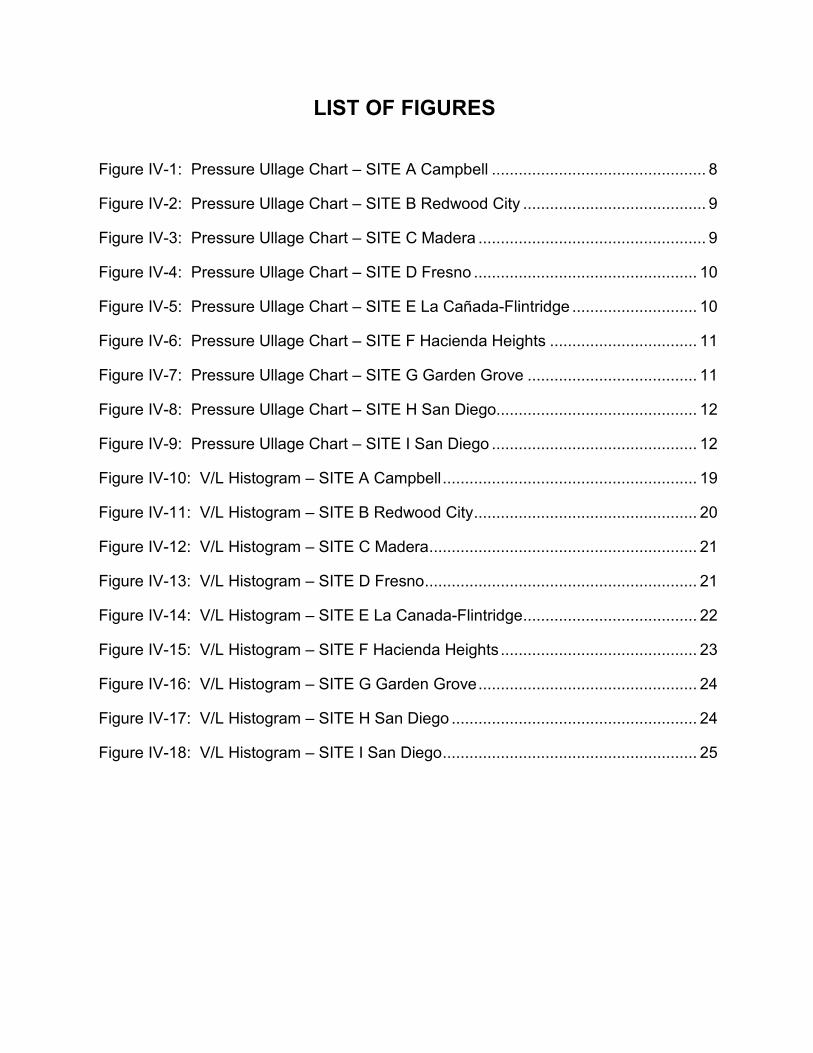
LIST OF FIGURES
Figure IV-1: Pressure Ullage Chart – SITE A Campbell ................................................ 8
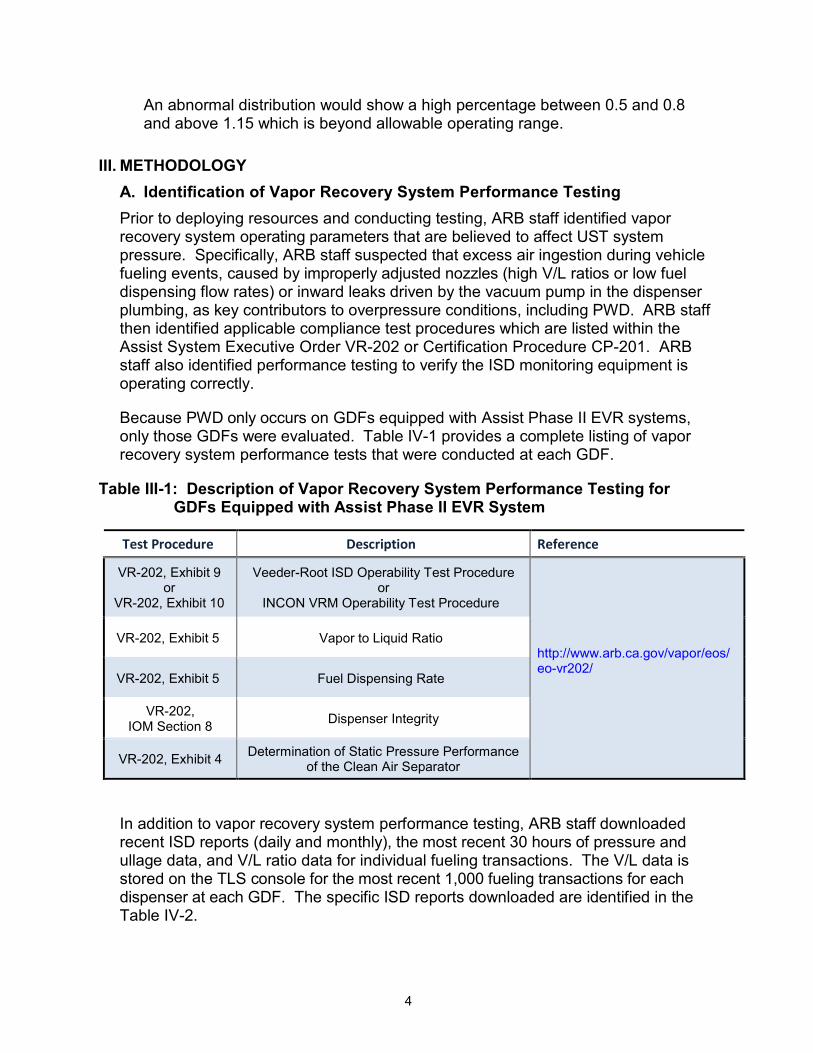
Figure IV-2: Pressure Ullage Chart – SITE B Redwood City ......................................... 9
Figure IV-3: Pressure Ullage Chart – SITE C Madera ................................................... 9
Figure IV-4: Pressure Ullage Chart – SITE D Fresno .................................................. 10
Figure IV-5: Pressure Ullage Chart – SITE E La Cañada-Flintridge ............................ 10
Figure IV-6: Pressure Ullage Chart – SITE F Hacienda Heights ................................. 11
Figure IV-7: Pressure Ullage Chart – SITE G Garden Grove ...................................... 11
Figure IV-8: Pressure Ullage Chart – SITE H San Diego............................................. 12
Figure IV-9: Pressure Ullage Chart – SITE I San Diego .............................................. 12
Figure IV-10: V/L Histogram – SITE A Campbell......................................................... 19
Figure IV-11: V/L Histogram – SITE B Redwood City.................................................. 20
Figure IV-12: V/L Histogram – SITE C Madera............................................................ 21
Figure IV-13: V/L Histogram – SITE D Fresno............................................................. 21
Figure IV-14: V/L Histogram – SITE E La Canada-Flintridge....................................... 22
Figure IV-15: V/L Histogram – SITE F Hacienda Heights ............................................ 23
Figure IV-16: V/L Histogram – SITE G Garden Grove................................................. 24
Figure IV-17: V/L Histogram – SITE H San Diego ....................................................... 24
Figure IV-18: V/L Histogram – SITE I San Diego......................................................... 25

INTENTIONALLY LEFT BLANK
.

EXECUTIVE SUMMARY Throughout the winter of 2014, California Air Resources Board (ARB) staff conducted a series of vapor recovery system compliance tests at nine (9) retail gasoline dispensing facilities (GDFs) located in four densely populated regions of California: Los Angeles, San Diego, San Francisco Bay Area, and Fresno. Each of the nine GDFs were equipped with the Assist Phase II Enhanced Vapor Recovery System including In-Station Diagnostics (ISD) per ARB Executive Order VR-202 and had recently exhibited a severe form of underground storage tank overpressure known as “pressure increase while dispensing” or PWD. The objective of this evaluation was to determine if overpressure and PWD conditions can occur at GDFs that are in compliance with existing regulatory performance standards.
Upon review and analysis of the test results and the ISD data collected from seven of nine GDFs, ARB staff concluded that overpressure and PWD is not caused by a readily identifiable vapor recovery equipment failure and that existing compliance test procedures and troubleshooting techniques are unable to identify a common characteristic or “smoking gun” which can explain the occurrence of PWD at some GDF and the absence at others. Two GDFs had excessive leak and were excluded from the analysis.
The results of this evaluation suggest that additional field studies and investigations should be conducted to identify key contributors of PWD other than those which exist in current ARB test procedures troubleshooting guides.
1
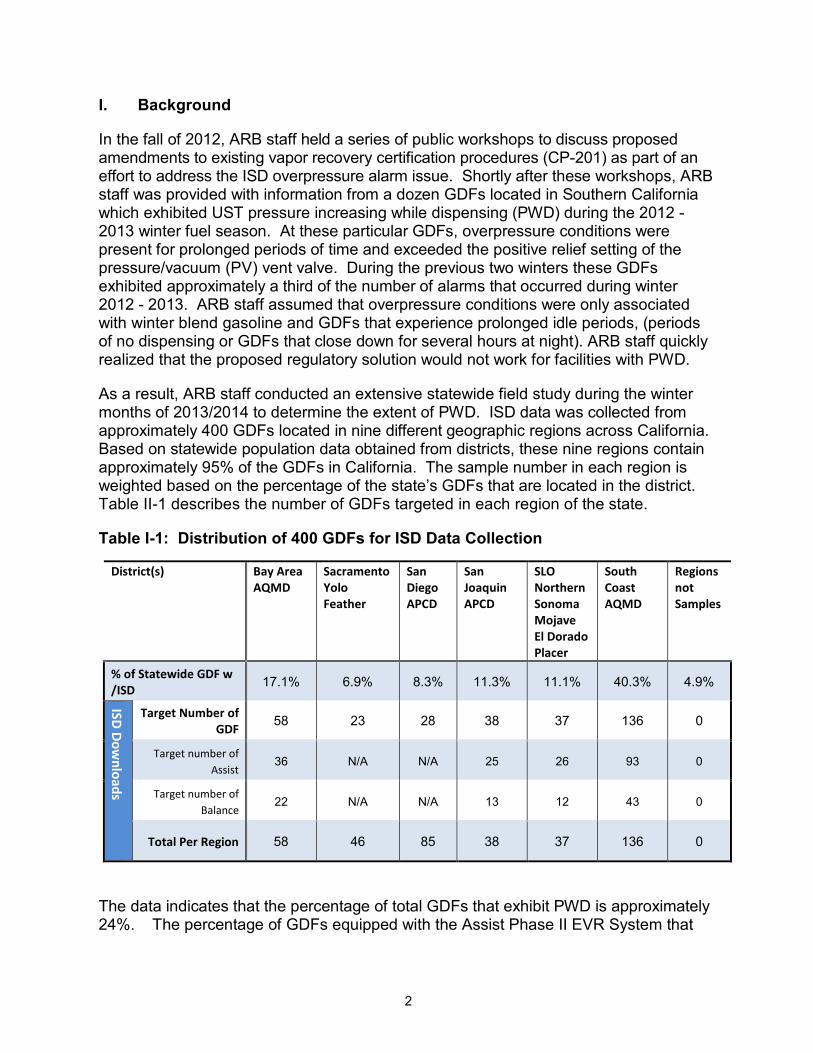
I. Background
In the fall of 2012, ARB staff held a series of public workshops to discuss proposed amendments to existing vapor recovery certification procedures (CP-201) as part of an effort to address the ISD overpressure alarm issue. Shortly after these workshops, ARB staff was provided with information from a dozen GDFs located in Southern California which exhibited UST pressure increasing while dispensing (PWD) during the 2012 -2013 winter fuel season. At these particular GDFs, overpressure conditions were present for prolonged periods of time and exceeded the positive relief setting of the pressure/vacuum (PV) vent valve. During the previous two winters these GDFs exhibited approximately a third of the number of alarms that occurred during winter 2012 - 2013. ARB staff assumed that overpressure conditions were only associated with winter blend gasoline and GDFs that experience prolonged idle periods, (periods of no dispensing or GDFs that close down for several hours at night). ARB staff quickly realized that the proposed regulatory solution would not work for facilities with PWD.
As a result, ARB staff conducted an extensive statewide field study during the winter months of 2013/2014 to determine the extent of PWD. ISD data was collected from approximately 400 GDFs located in nine different geographic regions across California. Based on statewide population data obtained from districts, these nine regions contain approximately 95% of the GDFs in California. The sample number in each region is weighted based on the percentage of the state’s GDFs that are located in the district. Table II-1 describes the number of GDFs targeted in each region of the state.
Table I-1: Distribution of 400 GDFs for ISD Data Collection
District(s) Bay Area AQMD
Sacramento Yolo Feather
San Diego APCD
San Joaquin APCD
SLO Northern Sonoma Mojave El Dorado Placer
South Coast AQMD
Regions not Samples
% of Statewide GDF w /ISD 17.1% 6.9% 8.3% 11.3% 11.1% 40.3% 4.9%
ISD Downloads
Target Number of GDF 58 23 28 38 37 136 0
Target number of Assist
36 N/A N/A 25 26 93 0
Target number of Balance
22 N/A N/A 13 12 43 0
Total Per Region 58 46 85 38 37 136 0
The data indicates that the percentage of total GDFs that exhibit PWD is approximately 24%. The percentage of GDFs equipped with the Assist Phase II EVR System that
2

exhibit PWD is approximately 34%. Balance Phase II system did not exhibit PWD, but did have overpressure issues. (See report titled Emissions from Balance System.)
II. OBJECTIVE The objective of this evaluation was to determine if readily identifiable vapor recovery component failures or related GDF equipment failures can be attributed to the occurrence of a severe form of overpressure known as PWD at GDFs equipped with the Assist Phase II EVR System. A series of vapor recovery system performance tests (also referred to as compliance tests) were conducted on nine GDFs located throughout the state in a geographically representative manner. Since overpressure conditions are most prevalent from November to March, the testing was conducted during the months when winter blend gasoline is sold. ARB staff is aware that volatility of winter fuel is the primary cause of the overpressure; however, RVP alone does not explain why PWD occurs at only a fraction of California’s assist equipped GDF population. Specific questions this evaluation seeks to answer are listed as follows:
1. Is PWD a function of low gasoline dispensing rate? Low-fuel dispensing rates (less than 6 gallons per minute per Exhibit 2 of Executive OrderVR-202), are known to cause the assist nozzle to generate excessively high V/L ratio values which leads to excess ingestion of air when refueling Onboard Refueling Vapor Recovery (ORVR) equipped vehicles.
2. Is PWD found on GDFs that have high V/L ratios? The proper V/L ratio range of the assist nozzle is 0.95 to 1.15. If the nozzle is adjusted beyond this range, excess air ingestion will occur during refueling events, leading to overpressure.
3. Is PWD found within malfunctioning, or out of compliance, ISD components which leads to false alarms? If out of calibration or malfunctioning, the values captured by the ISD vapor pressure sensors and ISD vapor flow meters could lead to false alarms.
4. Is PWD found at GDFs plagued with leaks within the vapor return piping of the dispenser? Leaks within vapor return piping are suspected to contribute to overpressure because they can lead to excess air ingestion during vehicle refueling events.
5. Is PWD attributed to identifiable vapor recovery equipment failures? Is there a common, yet easily identifiable equipment malfunction which would explain why PWD is present at some GDF but not others?
6. Do GDFs which routinely exhibit PWD also exhibit an irregular distribution of V/L ratios for individual fueling transactions? Under normal operating conditions, when the distribution of V/L ratios are plotted on a graph using a histogram, there should be a high percentage of fueling events with V/L less than 0.5 and a high percentage of events with V/L at 1.0.
3
An abnormal distribution would show a high percentage between 0.5 and 0.8 and above 1.15 which is beyond allowable operating range.
III. METHODOLOGY A. Identification of Vapor Recovery System Performance Testing Prior to deploying resources and conducting testing, ARB staff identified vapor recovery system operating parameters that are believed to affect UST system pressure. Specifically, ARB staff suspected that excess air ingestion during vehicle fueling events, caused by improperly adjusted nozzles (high V/L ratios or low fuel dispensing flow rates) or inward leaks driven by the vacuum pump in the dispenser plumbing, as key contributors to overpressure conditions, including PWD. ARB staff then identified applicable compliance test procedures which are listed within the Assist System Executive Order VR-202 or Certification Procedure CP-201. ARB staff also identified performance testing to verify the ISD monitoring equipment is operating correctly.
Because PWD only occurs on GDFs equipped with Assist Phase II EVR systems, only those GDFs were evaluated. Table IV-1 provides a complete listing of vapor recovery system performance tests that were conducted at each GDF.
Table III-1: Description of Vapor Recovery System Performance Testing for GDFs Equipped with Assist Phase II EVR System
Test Procedure Description Reference
VR-202, Exhibit 9 or
VR-202, Exhibit 10
VR-202, Exhibit 5
Veeder-Root ISD Operability Test Procedure or
INCON VRM Operability Test Procedure
Vapor to Liquid Ratio http://www.arb.ca.gov/vapor/eos/ eo-vr202/
VR-202, Exhibit 5
VR-202, IOM Section 8
Fuel Dispensing Rate
Dispenser Integrity
VR-202, Exhibit 4 Determination of Static Pressure Performance of the Clean Air Separator
In addition to vapor recovery system performance testing, ARB staff downloaded recent ISD reports (daily and monthly), the most recent 30 hours of pressure and ullage data, and V/L ratio data for individual fueling transactions. The V/L data is stored on the TLS console for the most recent 1,000 fueling transactions for each dispenser at each GDF. The specific ISD reports downloaded are identified in the Table IV-2.
4

Table III-2: Description of ISD Reports to Download from Each GDF
ISD Report Description
Individual FuelingTransaction
Veeder Root ISD System INCON ISD System
Fueling Transaction (last 1000 records for each Dispenser)
Fueling Transaction (last 1000 records for each Fueling Point)
UST Pressure and Ullage Data Most recent 30 hours of UST pressure and ullage data
Most recent 2 weeks of UST pressure and ullage data
Monthly Report Monthly ISD Report (available for last 12 months)
Daily Reports Daily ISD Report (available for last 365 days)
B. Geographic Distribution of GDF Selected for Testing Upon analysis of ISD data collected from approximately 400 GDF in October and December. 2013, ARB staff identified a total of 93 GDFs which exhibited PWD. This list was further subdivided by region.
Based on time constraints and available ARB resources, a total of nine GDFs located in four different regions were selected for vapor recovery system performance testing. As shown in Table IV-3, three GDF were located in South Coast Air Quality Management District (SCAQMD), two GDF located in San Diego County Air Pollution Control District (SDCAPCD), two GDF in San Joaquin Valley Air Pollution Control District (SJVAPCD), and two GDFs in the Bay Area Air Quality Management District (BAAQMD). GDFs in the Sacramento region were not chosen due to lower occurrence of PWD. Due to the transition from winter blend gasoline to summer blend gasoline, testing in Southern California and in Northern California were conducted in February and March, respectively. This testing sequence was chosen because the change from winter blend to summer blend gasoline occurs one month early.
Table III-3: Distribution of GDFs for VRS Performance Testing
Region Bay Area
Sacra mento
San Joaquin
San Diego
South Coast Other Total
% of Statewide PopulationGDF with ISD 17.1% 7.0% 11.3% 8.3% 40.3% 15.9% 100%
Number of GDF Targeted Per Region 2 0 2 2 3 0 9
5

C. Selection Criteria within Each Region In terms of GDF selection process within each region, ARB staff used the following criteria to identify GDF from the larger population of 400 GDFs visited in 2013:
• Equipped with Assist Phase II EVR with Veeder-Root ISD or INCON ISD;
• Exhibited UST PWD in December 2013 and February of 2014 with high RVP fuel (severe form of overpressure condition);
• Exhibited UST pressure in deep vacuum in October with low RVP fuel (normal baseline condition); and
• ISD alarm history free of leak and collection alarms for the last six to twelve months.
Upon review of the ISD data collected from various GDF for the five regions listed in Table IV-4 along with review of the ISD alarm history for the past six to twelve months, the following nine GDFs were identified as optimal for vapor recovery compliance testing in February and March (four GDFs in northern California and five GDFs in southern California).
Table III-4: GDFs Targeted for VRS Performance Testing
GDF Description Region (Air District) ISD Type
NOR
Calif
SITE A Campbell BAAQMD Veeder Root
THERN ornia SITE B
Redwood City BAAQMD Veeder Root
SITE C1
Madera SJVAPCD Veeder Root
SITE D2
Fresno SJVAPCD Veeder Root
SOU
Cali
SITE E La Cañada-Flintridge SCAQMD Veeder Root
THERN fornia
SITE F Hacienda Heights SCAQMD Veeder Root
SITE G Garden Grove SCAQMD Veeder Root
SITE H San Diego SDCAPCD INCON
SITE I San Diego SDCAPCD Veeder Root
1 This site was removed from the individual tables in the result section except for Section F. Compliance testing of this site was not completed due to multiple dispenser leaks and irregular location of ISD components. Additionally, this site did not exhibit PWD as shown in Table V-1
See Note 1
6
2

IV. RESULTS A. UST Pressure and Ullage Volume Profile Immediately Prior to Testing Immediately prior to conducting vapor recovery system performance testing, ARB staff downloaded the most recent 30 hours of UST pressure and ullage data from the ISD system installed at each GDF. This data was necessary to determine whether each GDF was continuing to exhibit PWD. Prior GDF visits conducted in December of 2013 and February of 2014 had indicated PWD conditions were present based on downloaded ISD data. The downloaded ISD data was populated into an Excel spreadsheet, which calculated the average UST pressure, and indicated if the GDF was exhibiting PWD, as shown in Table V-1. Note, each of the nine sites had exhibited PWD during prior sites visits in February of 2014.
Table IV-1: GDF Average UST Pressure and PWD3 Status
GDF Info Average UST Pressure * (Inches WC)
PWD Status (Yes / No)
Date of VRS Testing
SITE A Campbell
SITE B Redwood City
SITE C Madera
SITE D Fresno
SITE E La Cañada-Flintridge
SITE F Hacienda Heights
SITE G Garden Grove
SITE H San Diego
SITE I San Diego
0.193
3.412
-2.919
-2.842
-5.173
1.932
1.989
-6.689
-5.953
Yes
Yes
No
No
No
Yes
Yes
No
No
3/11/2014
3/12/2014
3/18/2014
3/19/2014
2/11/2014
2/12/2014
2/13/2014
2/19/2014
2/20/2014
*(Recent 30 Hours of Data from ISD)
3To identify PWD, ARB staff created an Excel macro to identify sites that demonstrated specific data traits (flags). To be deemed PWD, at least 20% of the daily ullage data must exceed 1.3“WC at least 75% of the daily ullage pressure data are less than 0.2“WC, deemed invalid data (flat lines, indicative of a leak); and at least three consecutive hours of positive pressure slope and positive ullage volume based on daily ullage pressure data.
7

As indicated in the Table V-1, four of the nine GDFs selected for this experiment were still actively exhibiting PWD. Although the remaining five did not exhibit PWD at the time of testing, the decision was made to continue with testing as staff resources had already been committed, arrangements had been made with each district, and the winter fuel season was beginning to be phased-out in southern California. In another study, ARB staff found that RVP begins to decline rapidly in mid-February for Southern California. Figures V-1 to V-9 displays the 30 hour pressure profile of all nine GDFs downloaded immediately prior to conducting vapor recovery system (VRS) performance testing.
Figure IV-1: Pressure Ullage Chart – SITE A Campbell4
SITE A Campbell
4 This pressure ullage chart dictates that there has been a change in RVP. Once the fuel was dropped the site went from overpressure / PWD status to a non-overpressure / non-PWD status. This site’s hours of operations are from 11:00 PM to 6:00 AM, which is shown on the chart. The pressure is increasing during the non-operational hours. Also it can be said based on the chart that from 6:00 AM to 9:00 AM the as the ullage increased (fueling is occurring), the pressure is also increasing, behavior of PWD station.
8
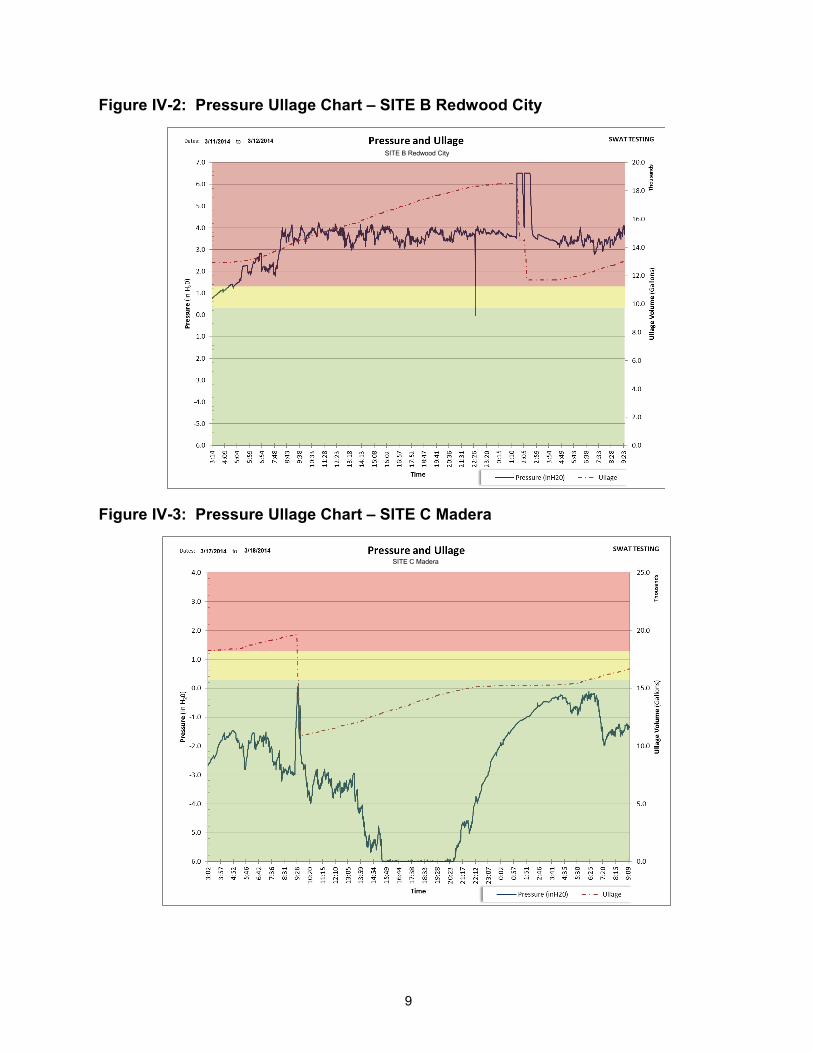
Figure IV-2: Pressure Ullage Chart – SITE B Redwood City
SITE B Redwood City
Figure IV-3: Pressure Ullage Chart – SITE C Madera
SITE C Madera
9

Figure IV-4: Pressure Ullage Chart – SITE D Fresno
SITE D Fresno
Figure IV-5: Pressure Ullage Chart – SITE E La Cañada-Flintridge
SITE E La Cañada-Flintridge
10

Figure IV-6: Pressure Ullage Chart – SITE F Hacienda Heights
SITE F Hacienda Heights
Figure IV-7: Pressure Ullage Chart – SITE G Garden Grove
SITE G Orange Grove
11
Figure IV-8: Pressure Ullage Chart – SITE H San Diego
SITE H San Diego
Figure IV-9: Pressure Ullage Chart – SITE I San Diego
SITE I San Diego
12

B. Accuracy of ISD Components5
i. ISD Vapor Pressure Sensor
According to ARB Executive Order VR-202, accuracy of the ISD vapor pressure sensor must be validated once per year per Exhibit 9 or Exhibit 10 (depending upon which ISD system is installed), which is called the ISD operability test procedure. Under normal compliance testing situations, Exhibit 9 and 10 require a “two-point” field accuracy check of the vapor pressure sensor. This is accomplished by subjecting the sensor to atmospheric pressure via use of a ball valve and at “as found” conditions within the headspace of the UST. At the nine GDFs selected for this experiment, ARB staff conducted a more rigorous “ten-point” field accuracy check of the vapor pressure by connecting a portable device called a variator. This was necessary because ARB staff wanted high degree of confidence that the vapor pressure sensor was reading accurately throughout the full scale range. A vapor pressure sensor out of compliance at a GDF will invalidate any data collected.
In terms of acceptance criteria, the ISD vapor pressure sensor must be within plus or minus 0.2 inches water column (WC) from ARB’s hand held digital manometer reading. If difference is not within plus or minus 0.2 inches WC, the ISD vapor pressure sensor is not in compliance with the requirements of Exhibit 2. As indicated in Table V-2, the ISD vapor pressure sensors at seven of the nine GDFs were found to be in compliance.
Table IV-2: Performance Summary of ISD Pressure Sensor
GDF Info Percent Difference
Between ISD UST Pressure Sensor and ARB Digital Manometer
Allowable Difference per Exhibit 9/10 of VR-202
Pass or
Fail SITE A Campbell SITE B Redwood City SITE E La Cañada-Flintridge SITE F Hacienda Heights SITE G Garden Grove SITE H San Diego SITE I San Diego
5%
4%
6%
4%
2%
5%
2%
±0.2 Inches WC 20%
±0.2 Inches WC 20%
±0.2 Inches WC 20%
±0.2 Inches WC 20%
±0.2 Inches WC 20%
±0.2 Inches WC 20%
±0.2 Inches WC 20%
PASS
PASS
PASS
PASS
PASS
PASS
PASS
5 Two of the sites (Site C in Madera and Site D in Fresno) had excessive leaks and were excluded from the analysis.
13

ii. ISD Vapor Flow Meter
According to ARB Executive Order VR 202, the accuracy of the ISD vapor flow meter must validated once per year per Exhibit 9 or Exhibit 10 (depending upon which ISD system is installed), which is called the ISD operability test procedure. This test was deemed necessary because ARB staff wanted a high degree of confidence that the ISD vapor flow meter was reading accurately. If the vapor flow meter was found out of compliance at any of the GDF’s, it will invalidate any data collected.
In terms of acceptance criteria, the ISD vapor flow meter V/L must read within plus or minus 0.15 of the reference meter specified in Exhibit 5 of VR-202. If difference is not within plus or minus 0.15, the ISD vapor flow meter is not in compliance and any data collected will be deemed invalid. As indicated in the Table V-3, ISD vapor flow meters were found fully operational and accurate at all seven GDFs. Please note, two of the nine GDFs were not tested due to the presence of dispenser leaks.
Table IV-3: Performance Summary of ISD Flow Meter
GDF Info Percent Difference
Between ISD Flow Meter and ARB Reference Meter
Allowable Difference per Exhibit 9/10
of VR-202
Pass or
Fail
SITE A Campbell
SITE B Redwood City
SITE E La Cañada-Flintridge
SITE F Hacienda Heights
SITE G Garden Grove
SITE H San Diego
SITE I San Diego
6%
3%
3%
2%
6%
4%
4%
±0.15 15% ±0.15 15% ±0.15 15% ±0.15 15% ±0.15 15% ±0.15 15% ±0.15 15%
PASS
PASS
PASS
PASS
PASS
PASS
PASS
The ISD components (vapor pressure sensor and vapor flow meter) at all seven the GDFs were observed between 2% and 6% difference when compared to the ARB reference instrument which is within the specified allowable difference per Exhibit 9/10 of VR-202. The ISD component failure rate of all seven GDFs was zero.
14

C. Vapor-to-Liquid Ratios and Fuel Dispensing Rates 6
According to Exhibit 2 of ARB Executive Order VR-202, the proper vapor to liquid ratio of range the assist nozzle is between 0.95 to 1.15. In addition, the fuel dispensing rate must be between six to ten gallons per minute. Exhibit 5 of Executive Order VR-202 is the test procedure used to for compliance determination. Table V-4 below summarizes the results of the test.
Table IV-4: Summary of Dispensing (Flow Rate & V/L Ratio) Performance
GDF Info
Fuel Dispensing Rate
(Gallons Per Minute)
GDF Average V/L Ratio Based on ARB Test
Method Exhibit 5
Allowable V/L Range Specified in Exhibit 2 of
VR-202
Pass or
Fail
SITE A Campbell
SITE B Redwood City
SITE E La Cañada-Flintridge
SITE F Hacienda Heights
SITE G Garden Grove
SITE H San Diego
SITE I San Diego
7.9
7.8
8.8
8.5
7.9
8.7
8.3
0.95
0.95
0.89
1.01
0.94
1.03
0.99
0.95 – 1.15
0.95 – 1.15
0.95 – 1.15
0.95 – 1.15
0.95 – 1.15
0.95 – 1.15
0.95 – 1.15
PASS
PASS
FAIL
PASS
FAIL
PASS
PASS
The average V/L for all seven GDFs was 0.97. The average V/L for the four GDFs that continued to exhibit PWD was 0.96. The average V/L for the three GDFs that no longer exhibited PWD was 0.97. The fuel dispensing rate for all GDFs was between six and ten gallons per minute.
D. Dispenser Integrity According to ARB approved Installation, Operation and Maintenance Manual (IOM), Section 18 of Executive Order VR-202, dispenser integrity testing is conducted upon startup of newly constructed facilities, and as a troubleshooting tool to check vapor tightness of the plumbing from vapor pump to the nozzle.
ARB staff sought to minimize disturbance to the GDF owner and customers as much as possible. Rather than complete Test Procedure (TP) 201.3, Determination
6 Two of the sites (Site C in Madera and Site D in Fresno) had excessive leaks and were excluded from the analysis.
15

of 2-Inch WC Static Pressure Performance of Vapor Recovery Systems, ARB staff decided to analyze the 30-hour pressure profile (Figure V-1 to V-9) and the results of the dispenser integrity test to determine the leak integrity of the GDFs. The pressure profile would show if the any possible leaks are present at the GDF; and the dispenser integrity test would provide us information on the leak integrity of each dispenser. Table V-5 summarizes the results of the dispenser integrity test.
Table IV-5: Summary of Dispenser Integrity Test
GDF Info Number of
Dispensers Per GDF
Allowable Vacuum Drop in 60Sec Pass Rate
SITE A Campbell
SITE B Redwood City
SITE E La Cañada-Flintridge
SITE F Hacienda Heights
SITE G Garden Grove
SITE H San Diego
SITE I San Diego
4
4
4
4
4
4
4
4 inches WC
4 inches WC
4 inches WC
4 inches WC
4 inches WC
4 inches WC
4 inches WC
75%
100%
50%
75%
50%
100%
100%
Total of 28 dispensers were tested at the seven GDFs at which, 22 experienced vacuum-drop less than 4 inches in period of 60 seconds. The average passing rate of all seven GDFs was about 78.6%. The four GDFs which continued to exhibit PWD had a passing rate of 75% (12 out of 16 dispensers passed); the three GDFs which no longer exhibited PWD had a passing rate of 83% (10 out of 12 dispensers passed).
E. Clean Air Separator Operability7
According to ARB Executive Order VR-202, Exhibit 4 determines the vapor tightness of the Clean Air Separator (CAS) pressure management system. The CAS prevents excess emissions and product loss by controlling UST pressure by expanding an internal bladder when the UST is pressurized, and collapsing the internal bladder when the UST is in a state of vacuum. ARB staff determined that it was necessary to conduct this test to verify the integrity of the internal bladder. If
7 Two of the sites (Site C in Madera and Site D in Fresno) had excessive leaks so there test results were removed from the analysis.
16

the CAS did not pass the test, then there may be a possibility of air ingestion causing premature vapor expansion, leading towards UST pressurization.
The CAS, while isolated from the vapor recovery system, is evaluated for vapor integrity by using (1) a vacuum decay procedure, or (2) a positive pressure decay procedure. The vacuum decay after five minutes is compared with an allowable value. The allowable value is based upon the initial vacuum level when conducting the test using the table provided in the test procedure. A positive decay procedure is included, and it conducts the same evaluation as the vacuum decay but with positive pressure. This test is conducted if there is insufficient vacuum (not greater than negative 2.00 inches WC) to conduct the vacuum decay. Table V-6 below summarizes the results of the test.
Table IV-6: Summary of Clean Air Separator (CAS) Integrity
Integrity Status GDF Info (Pass / Fail)
SITE A PASS Campbell
SITE B PASS Redwood City
SITE E La Cañada-Flintridge PASS
SITE F Hacienda Heights PASS
SITE G Garden Grove PASS
SITE H San Diego PASS
SITE I San Diego PASS
The CAS passing rate for all seven GDFs was 100%.
F. Distribution of Vapor to Liquid Ratios from ISD Fueling Transaction Records
For each fueling transaction, a V/L ratio is recorded by the ISD system at each dispenser installed at each GDF. There are two types of ISD system: (1) Veeder Root ISD system, which records the last 1,000 transactions per dispenser; and (2) INCON ISD system, which records the last 1,000 transactions per fueling point. Each GDF evaluated was equipped with four dispensers, therefore a total of 4,000 fueling transaction records per GDF were available for eight GDFs with a Veeder
17

Root ISD system, and 8,000 for the single GDF with an INCON ISD system. This data was downloaded from the ISD system and populated into an Excel spreadsheet for staff analysis. Key metrics can be calculated from this data include GDF average V/L, percentage of fueling events within a specific range, and average volume of fuel dispensed per fueling transaction. The percentage of fueling events were calculated simply by sorting the data and filtering commands and categorized into two types: (1) ORVR vehicles (0.1≤ V/L ≤0.5), and (2) Conventional (non-ORVR) vehicles (0.95≤ V/L ≤1.15), which are shown as shaded regions in Figure V-10 to V-18. Table V-7 displays the results of analysis specific to distribution of V/L ratios for each GDF.
Table IV-7: Summary of ISD Fueling Transactions
Number of Vapor over Liquid (V/L) Normal GDF Info Records8
In Data Set Distribution
Yes / No 0.1≤ and ≤0.5
0.5< and <0.95
0.95≤ and ≤1.15
>1.15
SITE A Campbell 3126 46.0% 23.2% 18.1% 12.7% Yes
SITE B Redwood City 3197 55.9% 18.5% 19.4% 6.1% Yes
SITE C Madera 2797 50.9% 17.9% 16.9% 14.4% Yes
SITE D Fresno 3058 58.8% 16.5% 14.4% 10.3% Yes
SITE E La Cañada-Flintridge 2891 56.1% 19.0% 19.8% 3.4% Yes
SITE F Hacienda Heights 2852 47.6% 15.7% 23.0% 13.7% Yes
SITE G Garden Grove 2722 48.4% 29.2% 17.0% 5.3% Yes
SITE H San Diego 6818 50.2% 19.1% 18.3% 12.2% Yes
SITE I San Diego 2903 60.4% 15.6% 12.5% 11.4% Yes
As indicated in the Table V-7, all nine GDFs had a relatively normal distribution of V/L ratios. Of the fueling transactions, 52.3% were in the ORVR category, and 17.7% was in the non-ORVR category. The detailed percentages of fueling transaction are displayed in Figures V-10 to V-18. It is important to note that staff observed that six GDFs have a percentage of greater than 10 of V/L above 1.15, which could have led to possible air ingestion. Only 2 of those GDFs displayed PWD.
8 All fueling transactions are included in the original set of 4,000. However for data analysis simultaneous fueling transactions and fueling events with less than three gallons were filtered out to the date set.
18

SHELL | 570 East Hamilton Ave |
Figure IV-10: V/L Histogram – SITE A Campbell Fr
eque
ncy
V/L Histogram Campbell Data Collected:3/11/2014
14%
12%
10%
8%
6%
4%
2%
0% <0.1 0.15 0.2 0.25 0.3 0.35 0.4 0.45 0.5 0.55 0.6 0.65 0.7 0.75 0.8 0.85 0.9 0.95 1 1.05 1.1 1.15 1.15>
0.00%0.06%
1.50%
7.17%
10.88%
8.67% 7.68%
5.79%
4.29%
2.78% 1.79%2.08%1.76%
1.18%1.15%1.54%
5.05%
7.01%
5.02% 4.06%3.74%4.09%
12.70%
V/L
19

Figure IV-11: V/L Histogram – SITE B Redwood City
V/L Histogram Total Fueling Events: 3197 Data Collected:3/12/2014
18%
16%
14%
12%
Freq
uenc
y 10%
8%
6%
4%
2%
0% 0.06% 0.03%
3.60%
12.26%
15.48%
11.45%
6.44%
3.97%
2.69%
1.09% 1.00% 0.56% 0.47% 0.78% 1.00%
2.28%
5.47%
7.01% 6.19%
4.00% 3.72% 4.32%
6.10%
<0.1 0.15 0.2 0.25 0.3 0.35 0.4 0.45 0.5 0.55 0.6 0.65 0.7 0.75 0.8 0.85 0.9 0.95 1 1.05 1.1 1.15 1.15>
V/L
20

0.00% 0.04%
0.93%
9.12%
11.94%
10.15%
7.01% 6.79%
4.90%
4.00%
2.47% 2.04% 1.79% 1.54% 1.47%
1.11% 1.61%
2.36%
3.93% 4.50% 4.43%
3.50%
14.37%
0%
2%
4%
6%
8%
10%
12%
14%
16%
Freq
uenc
y
Figure IV-12: V/L Histogram – SITE C Madera
Total Fueling Events: 2797
16%
14%
12%
10%
8%
6%
4%
2%
0% 21 0.00% 0.03%
0.52%
4.81%
8.24%
12.16%
16.09%
9.94%
7.00%
4.19%
3.07%
2.06% 1.50%
0.98% 1.01% 1.05% 1.11%
1.99%
3.53%
4.41%
2.88% 3.14%
10.27%
18%
<0.1 0.15 0.2 0.25 0.3 0.35 0.4 0.45 0.5 0.55 0.6
Total Fueling Events: 3058
Figure IV-13: V/L Histogram – SITE D Fresno
<0.1 0.15 0.2 0.25 0.3 0.35 0.4 0.45 0.5 0.55 0.6 0.65 0.7 0.75 0.8 0.85 0.9 0.95 1 1.05 1.1 1.15 1.15>
V/L
Freq
uenc
y
0.65 0.7 0.75 0.8 0.85 0.9 0.95 1 1.05 1.1 1.15 1.15>
V/L

Figure IV-14: V/L Histogram – SITE E La Canada-Flintridge
Freq
uenc
y
g
14%
12%
10%
8%
6%
4%
2%
0%
Total Fueling Events: 2891
1.76%
1.04%
9.82%
11.52% 11.14%
8.68%
6.05%
4.77%
3.04%
1.69% 1.56% 0.93% 1.04%
0.66% 1.25%
3.46%
5.15%
3.67%
2.42%
3.67%
8.96%
4.36%
3.36%
<0.1 0.15 0.2 0.25 0.3 0.35 0.4 0.45 0.5 0.55 0.6 0.65 0.7 0.75 0.8 0.85 0.9 0.95 1 1.05 1.1 1.15 1.15>
V/L
22

SHELL | 1107 Hacienda Blvd | Hacienda Heights
Figure IV-15: V/L Histogram – SITE F Hacienda Heights
Total Fueling Events: 2852
0.00% 0.04% 0.21%
4.28%
9.61% 10.27%
9.64%
7.43%
6.14%
4.84%
3.58%
1.82% 1.23%
0.70% 0.56% 0.63% 1.12%
1.79%
3.61%
6.52%
7.57%
4.73%
13.67%
0%
2%
4%
6%
8%
10%
12%
14%
16%
<0.1 0.15 0.2 0.25 0.3 0.35 0.4 0.45 0.5 0.55 0.6 0.65 0.7 0.75 0.8 0.85 0.9 0.95 1 1.05 1.1 1.15 1.15>
Freq
uenc
y
V/L
23

Figure IV-16: V/L Histogram – SITE G Garden Grove Total Fueling Events: 2722
<0.1 0.15 0.2 0.25 0.3 0.35 0.4 0.45 0.5 0.55 0.6 0.65 0.7 0.75 0.8 0.85 0.9 0.95 1
14%
0.04% 0.04%
2.13%
7.27%
10.10% 9.66%
8.85%
6.06%
4.30%
3.53%
2.68%
1.65% 1.14%
0.81% 1.40%
3.16%
7.75% 8.27%
5.07%
3.42% 3.82%
3.56%
5.29%
0%
2%
4%
6%
8%
10%
12%
1.05 1.1 1.15 1.15>
Freq
uenc
y
Figure IV-17: V/L Histogram – SITE H San Diego V/L
o Total Fueling Events: 6818
0.19% 0.15%
3.33%
9.06% 9.18% 9.46%
7.57%
6.19%
5.21%
3.53% 2.99%
1.94% 1.67% 1.26% 1.13% 1.32%
2.29% 3.01%
6.75%
4.94%
3.64% 2.99%
12.20%
0%
2%
4%
6%
8%
10%
12%
<0.1 0.15 0.2 0.25 0.3 0.35 0.4 0.45 0.5 0.55 0.6 0.65 0.7 0.75 0.8 0.85 0.9 0.95 1 1.05 1.1 1.15 1.15>
Freq
uenc
y
V/L
24

PRO | 3918 Governor Dr | San Diego
Figure IV-18: V/L Histogram – SITE I San Diego A
20%
18%
16%
14%
12%
10%
8%
6%
4%
2%
0%
Freq
uenc
y
Total Fueling Events: 2903
0.10% 0.07%
5.27%
17.15%
14.33%
8.68%
6.06%
4.96%
3.86%
2.38% 1.62%
1.72%
1.65% 1.21%
1.31%
1.24% 1.62%
2.89% 2.24% 2.58%
3.65% 4.03%
11.37%
<0.1 0.15 0.2 0.25 0.3 0.35 0.4 0.45 0.5 0.55 0.6 0.65 0.7 0.75 0.8 0.85 0.9 0.95 1 1.05 1.1 1.15 1.15>
V/L
25

V. DISCUSSION As previously stated in Section III of this report, the objective of this evaluation was to determine if readily identifiable vapor recovery component failures are responsible for the occurrence of PWD at GDFs equipped with the Assist Phase II EVR systems. Based upon review of test results from seven of the nine GDFs and analysis of ISD data collected at nine GDFs, which previously exhibited PWD, answers are provided below:
Question 1: Are low fuel dispensing rates observed at GDFs that routinely exhibit PWD?
Answer: No, low flow rates were not observed at all seven GDFs, yet all exhibited PWD either in December or February. The range of flow rates observed was between 7.5 gallons per minute and 9.0 gallons per minute which is within normal operating parameters for the assist nozzle.
Question 2: Are GDFs that routinely exhibit PWD equipped with assist nozzles with V/L ratios being adjusted excessively high?
Answer: No, V/L ratios observed at all seven GDFs indicate that the nozzles were adjusted on the low end of the allowable range, or slightly below the acceptable range (0.95-1.15). This suggests that over collection on non-ORVR vehicles need not occur for a GDF to exhibit PWD.
Question 3: Are GDFs that routinely exhibit PWD equipped with ISD components that have malfunctioned, or are out of calibration, which ultimately lead to false alarms?
Answer: No, ISD vapor pressure sensors and ISD vapor flow meters at all seven GDFs were found perfectly operational and well within acceptable calibration range and settings.
Question 4: Are GDFs that routinely exhibit PWD experiencing a high number of leaks within the vapor return piping of the dispensers?
Answer: Four GDFs were found with dispenser leaks and three GDFs were not. The one of the four GDFs that continued to exhibit PWD had a passing rate of 75% (12 out of 16 dispensers passed); the three GDFs which no longer exhibited PWD had a passing rate of 83% (10 out of 12 dispensers passed). Dispenser leaks can contribute PWD, but due to the absence of leaks at three GDFs, a solid conclusion cannot be drawn.
Question 5: Are common or readily identified vapor recovery equipment failures observed at GDFs that exhibit PWD? In other words, is there a common trend or “smoking gun” which would explain why PWD is present?
Answer: Based on the results of this testing and analysis of ISD data, a total of four GDFs were found to be operating optimally which means no equipment
26

failures were observed. This suggests that a fully optimized Phase II vapor recovery system can still exhibit PWD. This finding suggests that either ARB’s existing test methods are not capable of detecting the “smoking gun,” or that other operating characteristics (such as vehicle fill pipe interface compatibility) should be explored. There was not common equipment defect identified.
Question 6: Do GDFs that routinely exhibit PWD also exhibit an irregular distribution of V/L ratios for individual fueling transaction?
Answer: No, GDFs which routinely exhibit PWD do not exhibit an irregular distribution of V/L ratios for individual fueling transactions.
Appendix I, II, and III provides the full test results and the raw ISD data captured at each GDF included in this experiment. Overall, the majority of vapor recovery components tested performed within the defined requirements of Executive Order VR-202.
VI.CONCLUSION Upon review and analysis of the test results and data collected from the ISD system at each GDF, ARB staff has concluded that PWD is not caused by a readily identifiable vapor recovery equipment failure and that existing compliance test procedures and troubleshooting techniques are unable to identify a common characteristic or “smoking gun” which can explain the occurrence of PWD at some GDF and the absence at others.
The experiment does however confirm that uncontrolled Reid Vapor Pressure (RVP) winter blend gasoline is a primary contributor to PWD and overpressure, and that new field studies and additional investigative work is needed to identify key secondary and tertiary contributors.
27

VII. APPENDICES Appendix I: Pressure Ullage Data for Nine GDFs
• Appendix I-1: SITE A Campbell
• Appendix I-2: SITE B Redwood City
• Appendix I-3: SITE C Madera
• Appendix I-4: SITE D Fresno
• Appendix I-5: SITE E La Cañada Flintridge
• Appendix I-6: SITE F Hacienda Heights
• Appendix I-7: SITE G Garden Grove
• Appendix I-8: SITE H San Diego
• Appendix I-9: SITE I San Diego
Appendix II: Field Test Data for Seven GDFs
• Appendix II-1: SITE A Campbell
• Appendix II-2: SITE B Redwood City
• Appendix II-3: SITE E La Cañada Flintridge
• Appendix II-4: SITE F Hacienda Heights
• Appendix II-5: SITE G Garden Grove
• Appendix II-6: SITE H San Diego
• Appendix II-7: SITE I San Diego
Appendix III: ISD Data for Histogram for Nine GDFs
• Appendix III-1: SITE A Campbell
• Appendix III-2: SITE B Redwood City
• Appendix III-3: SITE C Madera
• Appendix III-4: SITE D Fresno
• Appendix III-5: SITE E La Cañada Flintridge
• Appendix III-6: SITE F Hacienda Heights
• Appendix III-7: SITE G Garden Grove
• Appendix III-8: SITE H San Diego
• Appendix III-9: SITE I San Diego
Appendices will be provided upon request
28