
Results of the KGHM Polska Miedź Group in the first half...
39
Results of the KGHM Polska Miedź Group in the first half of 2014 14 August 2014
Transcript of Results of the KGHM Polska Miedź Group in the first half...
Results of the KGHM Polska Miedź Group
in the first half of 2014
14 August 2014
2
This presentation was prepared by KGHM Polska Miedź S.A. (KGHM). The presentation is strictly of an informational nature and
should not be construed as containing investment advice. The users of this presentation are solely responsible for their own
analysis and assessment of the market situation and of the potential future results of KGHM based on the information contained in
this presentation. The presentation is not, and should not be construed to be, an offer to sell, or to submit an offer to purchase, any
of the securities of KGHM. The presentation is also neither in whole nor in part the basis for concluding any agreement or contract
whatsoever or for undertaking any liabilities whatsoever. Moreover, this presentation does not represent a recommendation to
invest in the securities of KGHM.
Neither KGHM nor any of its subsidiaries shall be held liable for the results of any decisions taken based on or utilising the
information contained in this presentation or arising from its contents. The market-related information contained within this
presentation was partially prepared on the basis of data arising from those third parties mentioned in this presentation.
Furthermore, certain declarations contained in this presentation may be of a foward-looking nature – in particular, such
declarations may be in the nature of projections, developed based on actual assumptions, reflecting known and unknown types of
risk as well as a certain level of uncertainty. The actual results, achievements and events which occur in future may significantly
differ from the data directly contained or understood to be contained within this presentation.
In no case whatsoever should the information contained within this presentation be considered as a clear or understood
declaration, or as any type of assertion whatsoever by KGHM or persons acting in its behalf. Neither KGHM nor any of its
subsidiaries are required or obligated to update this presentation or to provide its users with any additional information whatsoever.
KGHM furthermore hereby notifies the users of this presentation, that the sole reliable source of data on its financial results,
forecasts, events and company indicators are the current and periodic reports published by KGHM in performance of the
informational obligations arising from Polish law.
Cautionary Statement
Agenda
3
Start of production at Sierra Gorda
Debt consolidation and major investment projects
Macroeconomic outlook
Group results
KGHM Polska Miedź S.A. results
KGHM INTERNATIONAL results
Strategic priorities of KGHM

4
New mine in Chile – copper, gold, molybdenum
30 July
2014 Production of the first copper
concentrate at the Sierra Gorda mine
64 K OUNCES
of target annual
GOLD production
220 K TONNES
of target annual
COPPER production
25 M POUNDS
of target annual
MOLYBDENUM production

5
Construction of coarse ore stockpile dome and loading
infrastructure completed
Sierra Gorda
Resources
~1463.3 Mt @ 0.40% Cu
0.02% Mo
0.065 g/t Au
Ownership 55% KGHM
45% Sumitomo
Mine type Open pit
Progress to date
On 4 August 2014 the Supreme Court of Chile issued a favorable
court judgment regarding compliance with environmental laws to
transport copper concentrate from Sierra Gorda to the Port of
Antofagasta
Sierra Gorda and its logistics partners, ATI and FCAB, are
finalizing the construction of a dedicated world-class warehouse
and loading facilities at the Port of Antofagasta
Stage two - work in progress to design and develop processing
plant infrastructure
Total number of employees required for operations is estimated at
2 000
Cu Mo Au
Primary crushing

6
Sierra Gorda progress
Primary crushing
Sea water pond
Coarse ore stockpile dome
Ball mill #1

7
Additional potential of the project
Exploration drilling is planned in the areas adjacent to
the Sierra Gorda project
Potential areas around
the project
The implemented technical optimisation enabled a
substantial increase in avaliable reserves
Thanks to optimisation of the pit wall angle, the
amount of waste rock in the mine life cycle will be
lower by 11%
Increased reserves
KGHM is analysing the possibility of building a
photovoltaic farm, which would partially cover the
annual power needs of the Sierra Gorda mine
Utilisation of the world’s
best conditions for
operating a
photovoltaic farm
Semi-industrial tests are currently underway,
the results of which will be used to develop a project
feasibility study
Oxide ore processing
1 275 +15%
1 463 M tonnes
8
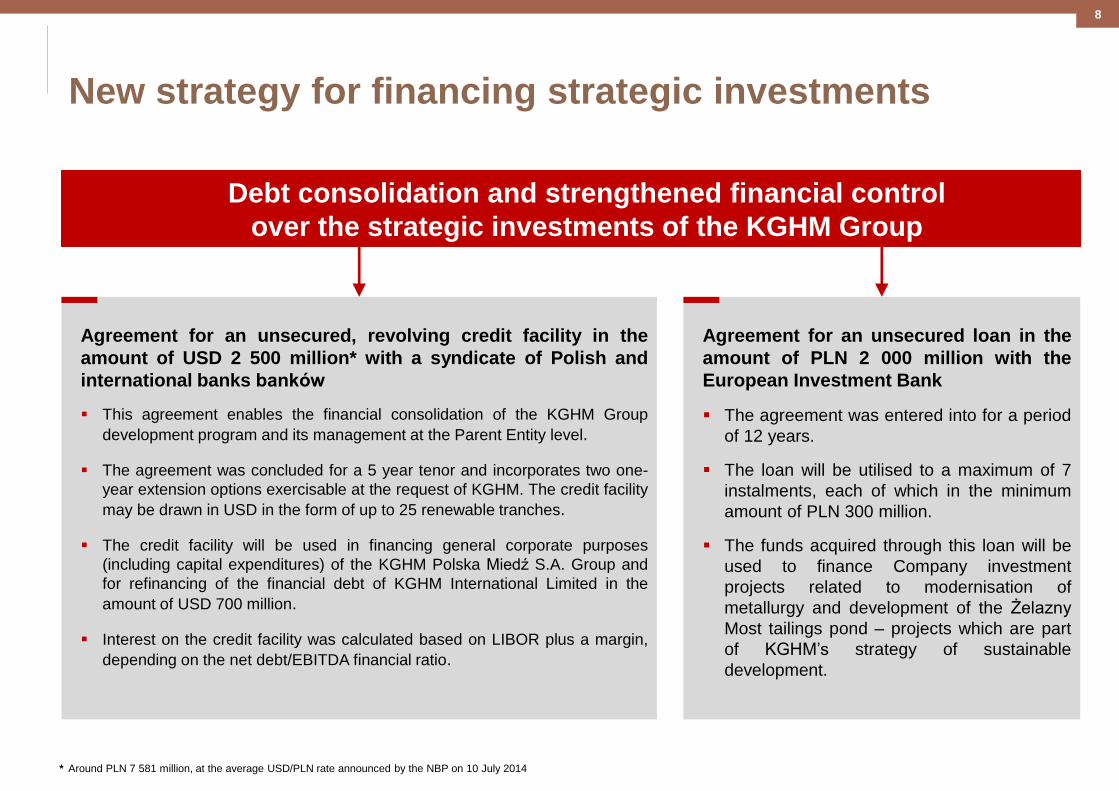
Debt consolidation and strengthened financial control
over the strategic investments of the KGHM Group
New strategy for financing strategic investments
Agreement for an unsecured, revolving credit facility in the
amount of USD 2 500 million* with a syndicate of Polish and
international banks banków
This agreement enables the financial consolidation of the KGHM Group
development program and its management at the Parent Entity level.
The agreement was concluded for a 5 year tenor and incorporates two one-
year extension options exercisable at the request of KGHM. The credit facility
may be drawn in USD in the form of up to 25 renewable tranches.
The credit facility will be used in financing general corporate purposes
(including capital expenditures) of the KGHM Polska Miedź S.A. Group and
for refinancing of the financial debt of KGHM International Limited in the
amount of USD 700 million.
Interest on the credit facility was calculated based on LIBOR plus a margin,
depending on the net debt/EBITDA financial ratio.
* Around PLN 7 581 million, at the average USD/PLN rate announced by the NBP on 10 July 2014
Agreement for an unsecured loan in the
amount of PLN 2 000 million with the
European Investment Bank
The agreement was entered into for a period
of 12 years.
The loan will be utilised to a maximum of 7
instalments, each of which in the minimum
amount of PLN 300 million.
The funds acquired through this loan will be
used to finance Company investment
projects related to modernisation of
metallurgy and development of the Żelazny
Most tailings pond – projects which are part
of KGHM’s strategy of sustainable
development.

9
Major projects of the KGHM Group’s investment and
development program
Gaining access to the
Deep Głogów
deposit
Research in the Old
Copper Belt
Exploration and
assessment work in
new concessioned
areas
Construction of a
second flash furnace
and modernisation of
the Głogów Smelter
Modernisation of the
Legnica Smelter
Development of the
Sierra Gorda open pit
mine in Chile
Construction of the
Victoria underground
mine in Canada
Construction of the
Afton- Ajax open pit
mine in Canada
Development of the
Żelazny Most tailings
pond
Application of new
tailings storage
technology (paste
technology)

10
Understanding with local communities opens the door
to development of the Żelazny Most Tailings Facility
Progress to date
Advanced preparations underway to develop the Southern
Quarter of the Żelazny Most tailings facility.
Thanks to the use of tailings thickening technology, it is
possible to substantially reduce the surface area of the facility
and to minimise the risk of leaks.
On 18 July 2014, KGHM signed an agreement with the
citizens of the 5 municipalities which lie the closest to the
future Southern Quarter. This also concluded the key stage of
consultations with local communities regarding development
of Żelazny Most.
KGHM has received permission to change the zoning of
approx. 300 ha into non-agricultural and non-forestry purposes
in the municipalities Rudna and Grębocice.
A similar decision is expected in the near future as regards the
Polkowice municipality.
The Southern Quarter will open in 2017. The investment will
enable the deposition of tailings until the year 2042 without the
need to restrict production in KGHM.
Current area 1 580 ha
Area after expansion 2 189 ha
Żelazny Most tailings treatment facility
Żelazny Most is the largest copper ore tailings treatment facility in
Europe. Of the approx. 30 million tonnes of copper ore extracted each
year by KGHM, over 29 million tonnes are waste, which is deposited in
the Żelazny Most tailings pond. It was initially assumed that the facility
would operate until the year 2015–2016, when – according to estimates
made at the time – the extraction of ore from the mines of KGHM would
end. Thanks to new technology, which enables mining to continue at
depths below 1200 m, KGHM will remain in operation for another 20–30
years.

11
Victoria – steady progress in mine development
Victoria
Resources
~14.5 Mt @ 2.5% Cu
2.5% Ni
7.6 g/t TPM
Ownership 100% KGHM
Mine type Underground
Progress to date
In the first half of 2014 land preparation for the
construction of mine infrastructure was completed
Preparations for the hoisting machinery foundations
and preliminary drilling for the shaft head in progress
Work is underway on the Integrated Development
Study, whose elements include a detailed project
schedule, budget and operational plan
Ni Cu Pt Pd Au

12
Deep Głogów –
guarantor of KGHM’s stable production
Deep Głogów
Resources ~290 Mt @ 2.4% Cu in ore
79g/t Ag
Ownership 100% KGHM
Mine type Underground
Progress to date Cu Ag
Construction of drifts with infrastructure (water pipes,
power cables, power switching stations, conveyor
belts, retention reservoirs, climate control pipes and
equipment, communications) in progress;
During the first three months of its operations, the first
mining section from the Rudna mine to access the
Deep Głogów deposit extracted over 110 kt of ore.
Work continued on deepening the GG-1 ventilation
(inlet) shaft using tubing technology. This will be the
deepest of the 31 shafts in the Polish Copper Belt,
with a target depth of 1340 meters and a width of 7.5
meters.
13
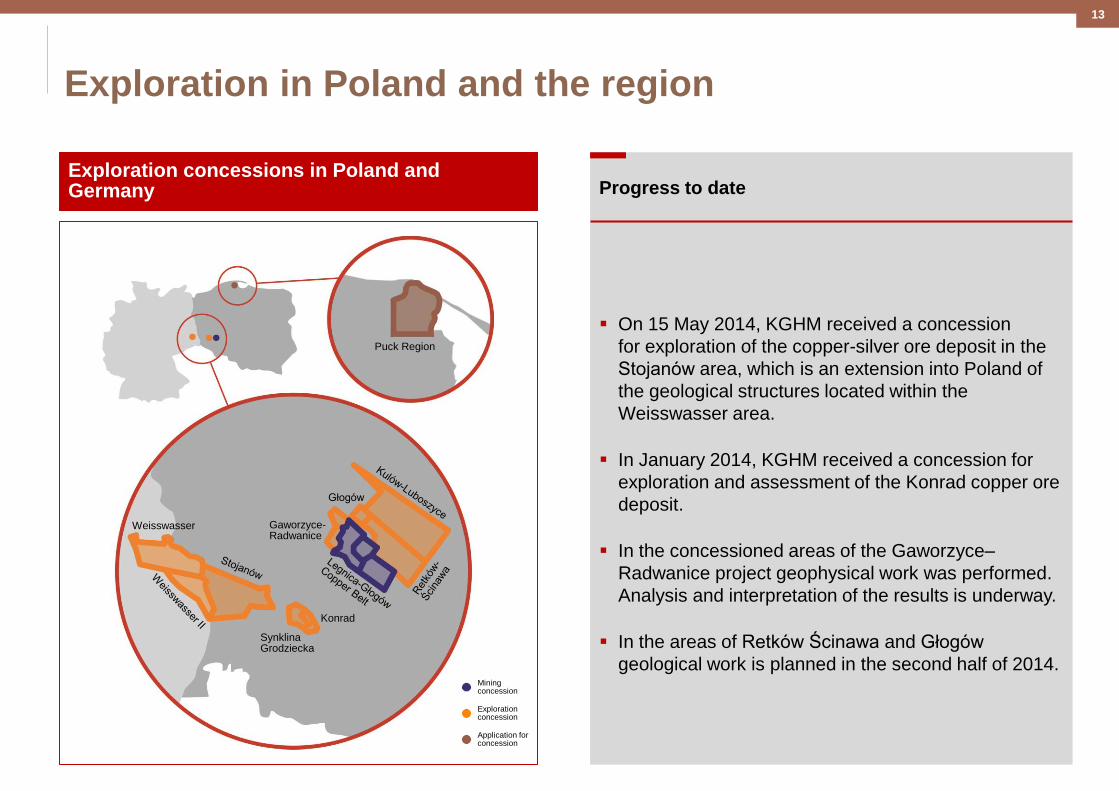
Exploration in Poland and the region
Exploration concessions in Poland and Germany
Puck Region
Głogów
Gaworzyce-Radwanice
Konrad
Synklina Grodziecka
Weisswasser
Progress to date
On 15 May 2014, KGHM received a concession
for exploration of the copper-silver ore deposit in the
Stojanów area, which is an extension into Poland of
the geological structures located within the
Weisswasser area.
In January 2014, KGHM received a concession for
exploration and assessment of the Konrad copper ore
deposit.
In the concessioned areas of the Gaworzyce–
Radwanice project geophysical work was performed.
Analysis and interpretation of the results is underway.
In the areas of Retków Ścinawa and Głogów
geological work is planned in the second half of 2014. Mining concession
Exploration concession
Application for concession

Macroeconomic outlook

15
Recovery of the global economy is accelerating - higher growth forecast for 2015 confirmed by the International Monetary Fund (IMF)
Note: The GDP growth and CPI inflation forecasts for 2014 and 2015 are based on the IMF’s World Economic Outlook (from 08 April 2014 and 24 July 2014); F – forecast; y/y – year to year;
USA GDP y/y 2014F: 1.7%
GDP y/y 2015F: 3.0%
CPI y/y 2014F: 1.4%
CPI y/y 2015F: 1.6%
World GDP y/y 2014F: 3.4%
GDP y/y 2015F: 4.0%
Canada GDP y/y 2014F: 2.2%
GDP y/y 2015F: 2.4%
CPI y/y 2014F: 1.5%
CPI y/y 2015F: 1.9%
Chile GDP y/y 2014F: 3.6%
GDP y/y 2015F: 4.1%
CPI y/y 2014F: 3.5%
CPI y/y 2015F: 2.9%
Euro zone GDP y/y 2014F: 1.1%
GDP y/y 2015F: 1.5%
CPI y/y 2014F: 0.9%
CPI y/y 2015F: 1.2%
Poland GDP y/y 2014F: 3.1%
GDP y/y 2015F: 3.3%
CPI y/y 2014F: 1.5%
CPI y/y 2015F: 2.4%
China GDP y/y 2014F: 7.4%
GDP y/y 2015F: 7.1%
CPI y/y 2014F: 3.0%
CPI y/y 2015F: 3.0%

16
90
92
94
96
98
100
102
104
106
01 02 03 04 05 06 07 08 09 10 11 12 13
USA Polska Chiny Niemcy
Economic recovery a fact, but: large risks from geopolitical situation
(Ukraine, Middle East) and lack of uniformity in global monetary policy
Source: Bloomberg, KGHM
WORLD
OECD Composite Leading Indicators
The OECD’s Composite Leading Indicators suggest continued
growth in the USA and economic stabilisation in China
The IMF, in its April revision of the global economic outlook, reduced the
expected rate of global growth in 2014 to 3.4%, due to the weaker first half,
simultaneously raising the growth outlook for 2015 to 4.0%.
Weather problems in the USA in the first quarter caused a substantial
interruption to the American economic trend. Nonetheless the recessionary
reading in the first three months (-2.1% q/q saar*) was overshadowed by the
increase in economic activity in the second quarter at the level of 4.0% q/q
saar*.
Thanks to the improved economic outlook in subsequent quarters the
American Federal Reserve (Fed) continued to restrict its quantitative easing
policy, reducing in July the scale of monthly assets purchases to USD 25
billion. The reading of the next-to-last Fed minutes suggests the total ending
of QE in the autumn of 2014. The increase in economic activity together with
the gradual improvement in the labour market raises the probability of higher
US interest rates in 2015.
The acceleration of economic growth in China to 7.5% y/y supported by
government actions increases credibility that this goal will be achieved at the
same level throughout the year. The improvement in a broad spectrum of
macroeconomic indicators has substantially reduced doubts as to the
sustainability of growth in China.
The risk of deflation in the Eurozone and the continued reluctance of the
banking sector to provide loans encouraged the European Central Bank
(ECB) to reduce interest rates and to take actions aimed at invigorating
economic growth. 98.5
99.0
99.5
100.0
100.5
101.0
* q/q – quarter to quarter; saar – seasonally adjusted annual rate
Poland China Germany USA

17
Copper back to early-March price level mainly due to better macroeconomic
outlook and lower production from new mining projects
Source: * LMEX = London Metal Exchange Index – comprised of the 6 most important non-ferrous metals traded on the LME; Bloomberg, KGHM; ** Macquarie, CRU, Thomson Reuters
COPPER
Following the March losses caused mainly by selling pressure in China and fears about the sustainability of economic growth, the price of copper rose to 6 935 USD/t,
recovering nearly all of its losses from the beginning of March. Following reports by Reuters on purchases by the State Reserves Bureau of approx. 200 kt of copper,
participants on the copper market continued to benefit from copper price increases, taking advantage of positive sentiment towards the base metals market reflected in the
growth of the LMEX as well as of a greater inflow of capital to the commodities market than in the previous year.
Since the beginning of the year official copper inventories of the three markets (LME, COMEX and SHFE) have fallen by half (from approx. 500 kt to approx. 250 kt). Also
worth noting is the decrease of inventories in unofficial duty-free warehouses in China. The market estimates the amount of stored copper at the level of approx. 700 kt,
versus approx. 1 million tonnes in January 2014.
In recent weeks market uncertainty has significantly risen due to the investigation underway at the Chinese port of Qingdao, involving metals-secured credit. As reported by
Reuters, by falsifying warrants for the offtake/delivery of copper and other metals it was possible to obtain financing at a much higher level than was required to ensure
collateral. In the case of copper the investigation may involve 20 thousand tonnes, while the potential repercussions of such falsification may have an impact on metals
prices.
Based on information disclosed in recent months it appears that there remain problems with investment projects currently underway,
as a result of which delays are arising in their completion. The level of production from new projects which is to appear this year has been systematically revised
downwards, at the same time impacting the copper market balance in the near future.
LMEX and 3M Copper* [1 Jan 2014 = 100] Production in 2014** [kt]
Estimates of supply from new projects have been revised downwards, implying a
change in the forecasted market balance in 2014.
Base metals prices (LMEX) overcame their March losses with a vengeance mainly due
to the increase in the nickel price. Copper still has some room for improvement.
86
88
90
92
94
96
98
100
102
Jan-14 Feb-14 Mar-14 Apr-14 May-14 Jun-14
LMEX Copper 3M
0
20
40
60
80
100
120
140
160
180
200
Toromocho Oyu Tolgoi Caserones Concs Collahuasi
Prior production forecast Actual production

18
From 15 August 2014 a new
system will be in place for
setting the price of silver.
The mechanism behind the new
system – the London Silver Price
– is based on an auctioning
system, with the price determined
by an algorithm, and not as until
now by various banks.
Thomson Reuters will also
announce volumes and proposed
prices, while simultaneously
ensuring the anonimity of market
participants.
As a result, there will be greater
confidence in the pricing combined
with greater transparency, as well
as an appropriate liquidity level for
transactions.
New method for setting the silver price
14 May
2014 Market participants informed that the London Silver
Fix will be suspended from 15 August 2014
Start of consultations with market participants through
the London Bullion Market Association (LBMA)
11 July
2014 Announcement by the LBMA of the result of these
consultations – acceptance of solutions proposed by
the CME Group and Thomson Reuters
Early August
2014 Testing of new system
Initial declaration by market participants of acceptance
of the new solutions for settling physical transactions,
with final decision contingent on the results of the
tests
15 August
2014 Presumed smooth transition from the London Silver
Fix to the London Silver Price from 15 August 2014

19
Macroeconomic conditions worse in the first half of 2014
7 540 6 916
1H'13 1H'14
Copper price (USD/t)
7 148 7 073 7 153 7 041 6 787
2Q '13 3Q '13 4Q '13 1Q '14 2Q '14
-8%
26.63
20.05
1H'13 1H'14
Silver price (USD/troz)
23.14
21.32 20.82 20.48
19.62
2Q '13 3Q '13 4Q '13 1Q '14 2Q '14
-25%
3.18 3.05
1H'13 1H'14
Exchange rate (USD/PLN)
3.21 3.21 3.07 3.06 3.04
2Q '13 3Q '13 4Q '13 1Q '14 2Q '14
-4%
Decrease in the copper price due to the fears on the
sustainability of economic growth in China, and therefore
on demand for base metals; a reduction in positions in
metals-hedged financial transactions related to the
investigation underway in the Chinese port of Qingdao; and
expectations of an expected metals production surplus in
the years 2014-2016.
After last year’s falls, mainly caused by the start of a
restriction of quantitative easing (QE) and expectations of a
tighter monetary policy in the USA in 2015 (given the
restriction in QE announced in the autumn of 2014), the
silver price stabilised in the range of 18.5–22 USD/troz.
Geopolitical events related to the crises in Ukraine and the
Middle East and to the return of liquidity problems for the
Argentinian government have caused increased uncertainty
in the short-term on financial markets, generating greater
interest in the precious metals segment.
Following a decrease in interest rates by the ECB in June,
the Monetary Council ended its neutral stance (forward
guidance), opening the way for potential monetary easing.
Macroeconomic data in the first half of the year were very
positive, with low inflationary pressure (below the NBP’s
goals), which led to stabilisation of the Polish zloty versus
the USD.

KGHM Group economic results

21
1.81 1.87
1H'13 1H'14
First half 2014 Group results - weaker prices impact results
420 396
1H'13 1H'14
Electrolytic copper production (thousand tonnes Cu equivalent)
205 192 209 195 201
2Q '13 3Q '13 4Q '13 1Q '14 2Q '14
C1 cost of producing copper in concentrate
(USD/lb)
The decrease in production of copper equivalent was mainly due to lower prices of silver and gold and to the lower volume of
payable copper production in KGHM International (a change in geological conditions in the Robinson mine)
The increase in the C1 cost was mainly due to the lower prices of associated metals – silver and gold
The decrease in the Group’s EBITDA by 28% versus the first half of 2014 was mainly due to the deterioration in macroeconomic
conditions.
+3% -6% 3 365
2 436
1H'13 1H'14
EBITDA (in million PLN)
1 369 1 243 1 326 1 075
1 361
2Q '13 3Q '13 4Q '13 1Q '14 2Q '14
-28%
KGHM Polska Miedź S.A.
KGHM International
1.85 1.88 1.92 1.90 1.85
2Q '13 3Q '13 4Q '13 1Q '14 2Q '14

KGHM Polska Miedź S.A.
economic results
23
15.5 15.7
1.58 1.55
1H'13 1H'14
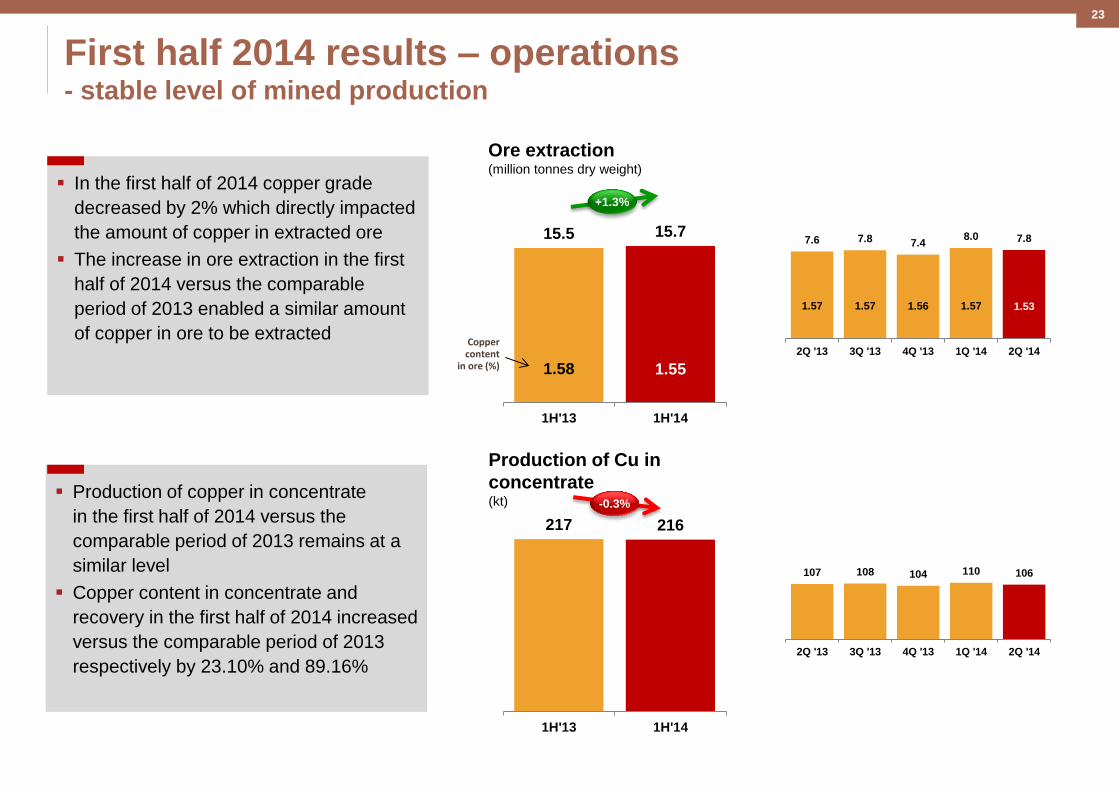
First half 2014 results – operations - stable level of mined production
Ore extraction (million tonnes dry weight)
Copper content
in ore (%)
+1.3%
In the first half of 2014 copper grade
decreased by 2% which directly impacted
the amount of copper in extracted ore
The increase in ore extraction in the first
half of 2014 versus the comparable
period of 2013 enabled a similar amount
of copper in ore to be extracted
Production of copper in concentrate
in the first half of 2014 versus the
comparable period of 2013 remains at a
similar level
Copper content in concentrate and
recovery in the first half of 2014 increased
versus the comparable period of 2013
respectively by 23.10% and 89.16%
7.6 7.8 7.4 8.0 7.8
1.57 1.57 1.56 1.57 1.53
2Q '13 3Q '13 4Q '13 1Q '14 2Q '14
217 216
1H'13 1H'14
Production of Cu in
concentrate (kt) -0.3%
107 108 104 110 106
2Q '13 3Q '13 4Q '13 1Q '14 2Q '14

24
544 605
1H'13 1H'14
213 210
73 73
286 283
1H'13 1H'14
First half 2014 results – operations - higher silver production
1) Together with processing of customer-supplied materials
Electrolytic copper production (kt)
From own concentrate
From purchased Cu-
bearing materials(1
-1%
Electrolytic copper production remains at
a high level, similar to last year’s level
Metallic silver production (t)
+11%
107 91 126
106 104
37 40
22 37 36
144 131
148 143 140
2Q '13 3Q '13 4Q '13 1Q '14 2Q '14
264
320 297 278
328
2Q '13 3Q '13 4Q '13 1Q '14 2Q '14
The 11% higher production of metallic
silver in the first half of 2014 versus the
comparable period of 2013 was due to
the maintenance performed at the
Precious Metals Plant in April and May
2013

25
First half 2014 results – sales - weaker prices in the first half of 2014 impact results
298 275
1H'13 1H'14
Copper and copper products (kt)
-8%
Sales volume
596 572
1H'13 1H'14
Silver (t)
-4%
7 395
6 174
1 704
1 145
403
408
9 503
7 727
1H'13 1H'14
Sales (in million PLN)
Copper and copper
products
Silver
Other
The simultaneous decrease in recovered prices of copper and
silver (respectively by 9% and 30%) and the lower sales volume
(8% and 4%) caused a decrease in revenues by 19% versus the
first half of 2013
-19%
144 129
168
138 136
2Q '13 3Q '13 4Q '13 1Q '14 2Q '14
293 319 335
220
352
2Q '13 3Q '13 4Q '13 1Q '14 2Q '14
3 444 3 086 3 879
3 153 3 021
753 744
743
455 690
4 397 4 171
4 905
3 800 3 927
2Q '13 3Q '13 4Q '13 1Q '14 2Q '14

26
First half 2014 results – Costs - cost discipline maintained
1 988 1 826
1 021
748
3 971 3 913
6 980
6 486
1H'13 1H'142 001 1 975 1 980 1 952 1 961
3 394 3 437
2 836
3 300 3 187
2Q '13 3Q '13 4Q '13 1Q '14 2Q '14
Minerals extraction tax
Purchased Cu-bearing materials
Total expenses by nature
Expenses by nature excluding purchased Cu-bearing materials and the minerals extraction tax
-7%
-1%
Expenses by nature (in million PLN)
Labour costs
External services
Other materials and energy
Depreciation
Taxation and charges
After excluding the minerals extraction tax and purchased copper-bearing
materials, expenses by nature are lower by 1% than in the first half of 2013 (-PLN
58 million)
Costs versus the first half of 2013 were impacted by:
lower energy costs (-PLN 36 million), of which:
electricity (-PLN 27 million) due to lower prices (5.6%) and consumption
heat energy (-PLN 7 million)
the planned reduction in the scope of preparatory mine development work
(-PLN 64 million) – a decrease in scope by 23%, or 5.4 km
alongside the following increases:
labour costs (+PLN 38 million) – a higher allowance for future employee
benefits (+PLN 15 million) and higher remuneration by 2.4% alongside a
lower annual bonus by 2 percentage points and lower employment (187
positions)
taxation, charges and mining usufruct fees (+PLN 15 million)

27
First half 2014 results – Costs - unit cost of production down
1) Pre-precious metals credit cost - Total unti cost prior to deduction by the value of associated metals
2) Under comparative conditions – assuming the macroeconomic conditions from the first half of 2013
1.73 1.79 1.62
1H'13 1H'14 1H'14 (2
C1 cash cost of producing copper in concentrate (USD/lb)
1.74 1.77 1.91
1.77 1.82
2Q '13 3Q '13 4Q '13 1Q '14 2Q '14
The pre-precious metals credit1 unit
cost of electrolytic copper production
from own concentrate was lower by 6%
versus the first half of 2013 with a
similar level of production
The decrease in silver and gold prices
led to a lower valuation of associated
metals, resulting in a higher unit cost of
copper production from own
concentrate and a higher C1 cost
Under the macroeconomic conditions
of 2013 the total cost of copper
production would have been 13 477
USD/t, with a C1 cost of 1.62 USD/lb,
which means a decrease versus the
prior year respectively by 5% and 6%
14 197 14 235 13 477
21 103 19 809
21 172
1H'13 1H'14 1H'14 (2
Pre-precious metals credit cost of electrolytic copper production from own concentrate (PLN/t)
15 871 15 290 14 984 13 971 14 502
21 747 22 598
19 740 20 018 19 596
2Q '13 3Q '13 4Q '13 1Q '14 2Q '14
+3.5%
Minerals extraction tax
Value of associated metals
-6%
Total cost of production
from own concentrate
+0.3%
2

28
Market risk management – hedging position (as at 30 June 2014)
in thousand tonnes
Mewa 4 500 – 7 700 – 10 200
Mewa 4 500 – 7 800 – 10 300
Mewa 5 000 – 7 700 – 9 300
Position in derivatives on the commodities market
Cu
• In the first half of 2014 volatility decreased on the copper market, with the copper price within the range 6 400 – 7 450 USD/t.
• In the first half of 2014 there were no new transactions hedging the price of copper and silver. On the currency market there was a restructuring of an existing position (details on next slide).
• In the first half of 2014 the Company recorded a positive result on derivatives of PLN 160 million, of which +PLN 264 million increased revenues from sales and PLN 104 million decreased the result on other operating activities.
• The fair value of derivatives as at 30 June 2014 amounted to PLN 292 million.
•At present the Company does not have a hedged position on the silver market
Comments to positions and results of KGHM Polska Miedź
Seagull 4 500 – 7 700 – 10 200
Seagull 4 500 – 7 800 – 10 300
Seagull 5 000 – 7 700 – 9 300

29
Position in derivatives on the currency market
in million USD 2014
The closure of the position and un-designation of the
hedging transaction was reflected in:
• Revenues from sales in the amount of PLN 72
million, in the second quarter of 2014
• Revaluation reserve from the measurement of
financial instruments in the amount of PLN 132
million, which increases Revenues from sales in the
period from July to December 2014
2015
The closure of the purchased put option at USDPLN
3.40 and un-designation of the hedging transaction
was reflected in the Revaluation reserve from the
measurement of financial instruments in the amount
of:
• PLN 50 million, which will increase Revenues from
sales for the period from January to June 2015
• PLN 43 million, which will increase Revenues from
sales for the period from July to December 2015
Mewa 2,70 – 3,50 – 4,50 Korytarz 3,40 – 4,50
Korytarz 3,30 – 4,00 Opcja put 2,85
Korytarz 3,20 – 4,00 Opcja put 2,70
USDPLN
transactions entered into in 1Q 2014
transactions closed in 1Q 2014
Seagull 2.70 – 3.50 – 4.50 Collar 3.40 – 4.50
Collar 3.30 – 4.00 Put 2.85
Collar 3.20 – 4.00 Put 2.70
Market risk management – hedging position (as at 30 June 2014)

30
First half 2014 results – Costs - worse macro conditions partially offset by continued cost discipline and hedging
* Impact on revenues from sales of copper, silver and gold
** Excluding the minerals extraction tax and consumption of purchasedi copper-bearing materials
1 725
1 119
+194
+475
+179
+163 +11
+209
-576
-905
-354
Profit1H'13
Changein sales
volume (Cu,Ag,Au)*
Changein prices
(Cu,Ag,Au)*
Change in USD/PLN rate*
Hedging Totalcost of
productssold**
Mineralsextraction
tax
Purchased Cu-bearing materials
Other Incometax Profit
1H'14
Change in net profit (in million PLN)
2 809
1 965
1H'13 1H'14
EBITDA (in million PLN)
-30%
The lower profit versus the first half of 2013 was due to the deterioration in
macroeconomic conditions and to a lower sales volume
The decrease in first half 2014 profit was partially offset by the lower level
of costs, the impact of hedging and lower income tax
Mainly due to lower expenses by nature and higher production for inventories purposes of
semi-products and finished goods

31
2014 assumptions remain unchanged
Average annual copper price
Average annual silver price
Exchange rate
Pre-precious metals unit cost of electrolytic
copper production from own concentrate
Total unit cost of electrolytic copper
production from own concentrate
C1 cash cost of producing copper in
concentrate
Production of copper in concentrate
Production of silver in concentrate
Production of electrolytic copper
- of which from own concentrate
Production of metallic silver
Copper products sales volume
Silver products sales volume
Capital expenditures
Equity investments
The impact of lower-than-
expected metals prices was
offset by continued cost
discipline
The levels of production and
sales volume recorded in the
first half of 2014 do not
justify a change to
Management assumptions
100%
50%
97%
91%
100%
95%
92%
92%
51%
54%
50%
46%
53%
49%
51%
40%
46%

KGHM INTERNATIONAL
economic results

33
Production
Copper (kt) The decrease in copper production (-13
thousand tonnes) was mainly due to lower
production at the Robinson mine due to ore
quality deterioration from the Kimbley pit,
versus the amount of ore extracted in the
first half of 2013 from the Ruth pit.
55
42
H1'13 H1'14
26 21
24 19
22
2Q '13 3Q '13 4Q '13 1Q '14 2Q '14
-25%
Nickel (kt)
TPM (gold, platinum palladium) (k troz)
Nickel production was lower than last year
mainly due to the suspension of nickel ore
mining from McCreedy West in the first
quarter of 2014
The lower volume of precious metals
produced was mainly due to lower gold
production at Robinson due to lower ore
grade and lower recovery.
53
34
H1'13 H1'14
25 21 24
16 18
2Q '13 3Q '13 4Q '13 1Q '14 2Q '14
2.3
1.6
H1'13 H1'14
1.2 1.1 1.4
1.0 0.7
2Q '13 3Q '13 4Q '13 1Q '14 2Q '14
-30%
-37%
34
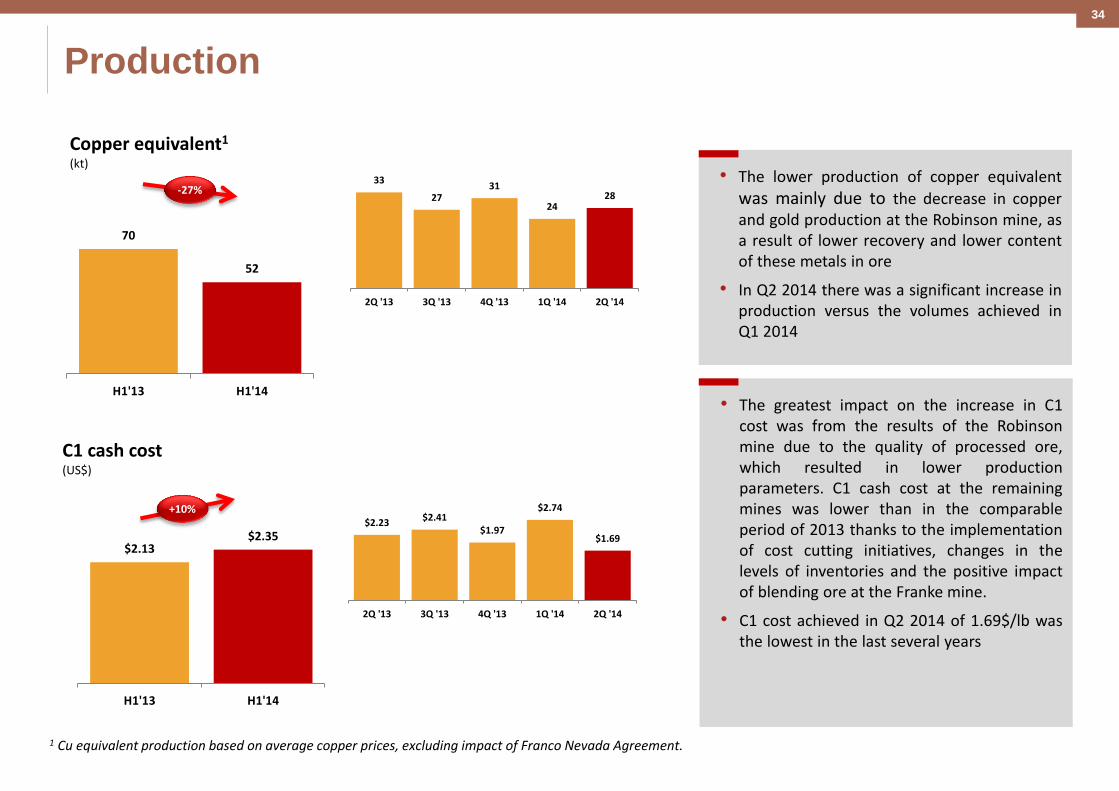
1 Cu equivalent production based on average copper prices, excluding impact of Franco Nevada Agreement.
• The greatest impact on the increase in C1 cost was from the results of the Robinson mine due to the quality of processed ore, which resulted in lower production parameters. C1 cash cost at the remaining mines was lower than in the comparable period of 2013 thanks to the implementation of cost cutting initiatives, changes in the levels of inventories and the positive impact of blending ore at the Franke mine.
• C1 cost achieved in Q2 2014 of 1.69$/lb was the lowest in the last several years
C1 cash cost (US$)
$2.23 $2.41 $1.97
$2.74
$1.69
2Q '13 3Q '13 4Q '13 1Q '14 2Q '14
+10%
$2.13 $2.35
H1'13 H1'14
• The lower production of copper equivalent
was mainly due to the decrease in copper and gold production at the Robinson mine, as a result of lower recovery and lower content of these metals in ore
• In Q2 2014 there was a significant increase in production versus the volumes achieved in Q1 2014
Copper equivalent1 (kt)
33
27 31
24 28
2Q '13 3Q '13 4Q '13 1Q '14 2Q '14
-27%
70
52
H1'13 H1'14
Production

35
First half 2014 financial results - worse macroeconomic conditions and lower sales volume
Improved results in Q2 2014 positively impacted cash flow and EBITDA
KGHM International continues its program of savings:
general management and administrative costs, sustaining Capex and Opex
expenditure on projects, exploration and new business
Results positively impacted by exchage rate changes – weakening of the CAD and CLP versus the USD
586
326
H1'13 H1'14
Sales1 (M USD)
314 224 253
148 179
2Q '13 3Q '13 4Q '13 1Q '14 2Q '14
-44%
145
50
H1'13 H1'14
EBITDA (adjusted) (M USD)
65 45
69
2 48
2Q '13 3Q '13 4Q '13 1Q '14 2Q '14
-66%
Main reasons for lower EBITDA:
Lower effective copper sales price, which
decreased revenues by USD 19 million
Lower production volume of copper and
gold and DMC contract revenues by USD
230 million
Lower costs, due to lower production
level and contract mining activities,
implemented cost initiatives and
inventories management, which resulted
in lower operating costs by USD 165
million
Substantial improvement in results by the
Robinson, Morrison and Carlota mines
versus Q1 2014
134
97
EBITDA3
1 Revenues from sales net of treatment and refining charges
2 Profit on mining operations plus depreciation and the Sierra Gorda JV management fee, less general administrative costs and impairment losses
3 Operating profit plus depreciation

36
Morrison mine - current status and outlook
1 cash cost per pound of copper sold (US$/lb)
Cu TPMs Ni
Improved results in Q2 2014:
Increased copper content in mined copper ore by 15% versus the first quarter of 2014, thanks to mining of rich area of
deposit
Due to the higher metals grade in Zone 3 of the Morrison Deposit, TPMs production in Q2 2014 was 13% higher than in Q1
2014
A lower C1 cost due to less ore mined, with higher metals grade and lower operating costs
3Q'13 4Q'13 1Q'14 2Q'14
0.5 0.6
0.4 0.4
1.3
1.6
0.9 1.1
Payable Cu (kt)
Payable TPMs
$1.48 $1.08
$1.78
$1.13
1Q’14 3Q’13
8.2
9.3
4Q’13
6.7
7.7
Q2’14
Cu grade %
C1 cost1
Outlook
In Q2 2014 drilling concentrated on gaining access to areas scheduled for mining in the second half of the year
Strong progress on work related to the backfilling of completed areas supports realisation of mining plans in the second
half of 2014
In Q3 2014 work is scheduled to gain access to ore at the 5000 ft level
37
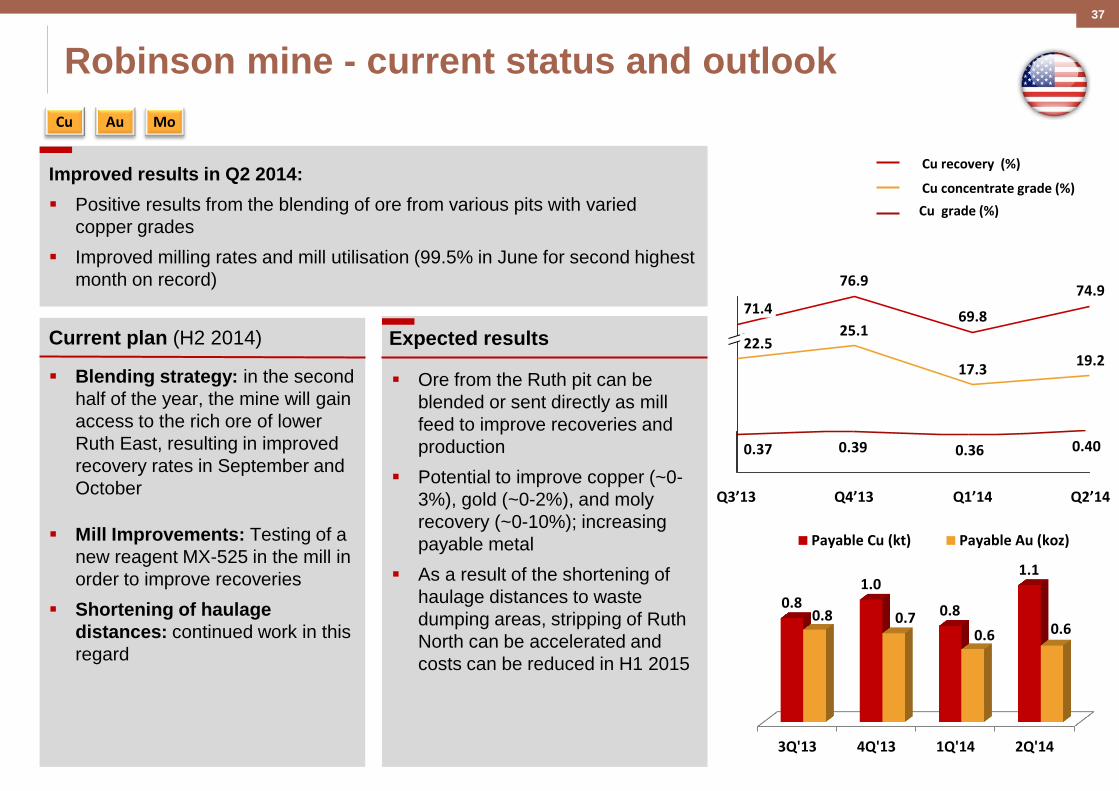
Robinson mine - current status and outlook
Cu Mo Au
Improved results in Q2 2014:
Positive results from the blending of ore from various pits with varied
copper grades
Improved milling rates and mill utilisation (99.5% in June for second highest
month on record)
19.2
74.9
Q2’14 Q1’14
17.3
69.8
Q4’13
25.1
76.9
Q3’13
22.5
71.4
0.37 0.39 0.40 0.36
Cu grade (%)
Cu concentrate grade (%)
Cu recovery (%)
Current plan (H2 2014)
Blending strategy: in the second
half of the year, the mine will gain
access to the rich ore of lower
Ruth East, resulting in improved
recovery rates in September and
October
Mill Improvements: Testing of a
new reagent MX-525 in the mill in
order to improve recoveries
Shortening of haulage
distances: continued work in this
regard
Expected results
Ore from the Ruth pit can be
blended or sent directly as mill
feed to improve recoveries and
production
Potential to improve copper (~0-
3%), gold (~0-2%), and moly
recovery (~0-10%); increasing
payable metal
As a result of the shortening of
haulage distances to waste
dumping areas, stripping of Ruth
North can be accelerated and
costs can be reduced in H1 2015
3Q'13 4Q'13 1Q'14 2Q'14
0.8 1.0
0.8
1.1
0.8 0.7 0.6 0.6
Payable Cu (kt) Payable Au (koz)

38
Strategic priorities of KGHM
Commission the Sierra Gorda mine
Ensure stable, high cash flow
Continue to grow
Development of the global organisation
Further enhance skills
Reach full production Prepare Stage 2 Optimise costs (Opex)
Near-term priorities
Value Creation Program (VCP) Stabilise employment level Maintain stable dividends
Deep Głogów Victoria Regional exploration
Global financing Global organisation
Build skills at all levels Program of support for students and graduates