Results of the 30th Annual “Questionnaire on Environmental ...
Results of the 29th Annual“Questionnaire on Environmental Problems and the Survival of
Humankind”
Report
September 2020

Contents
Preface ........................................................................................................................................... 1
I. Survey Overview .............................................................................................................. 2
II. Summary of Questionnaire Results .................................................................................. 3
III. Questionnaire Results ...................................................................................................... 4
III-1. Awareness of the Crisis Facing Human Survival-The Environmental Doomsday Clock .... 4
III-1-1. The Time on the Environmental Doomsday Clock .......................................................... 4
III-1-2. Environmental Issues to be Taken into Account .............................................................. 7
III-2. Awareness of Signs of Improvement in the Approach to Environmental Issues............ 25
IV. Closing Comment .......................................................................................................... 27
V. Data ................................................................................................................................ 28
VI. Questionnaire as Distributed to Respondents ............................................................ 33
Reference: Changes in the Environmental Doomsday Clock .................................................. 35
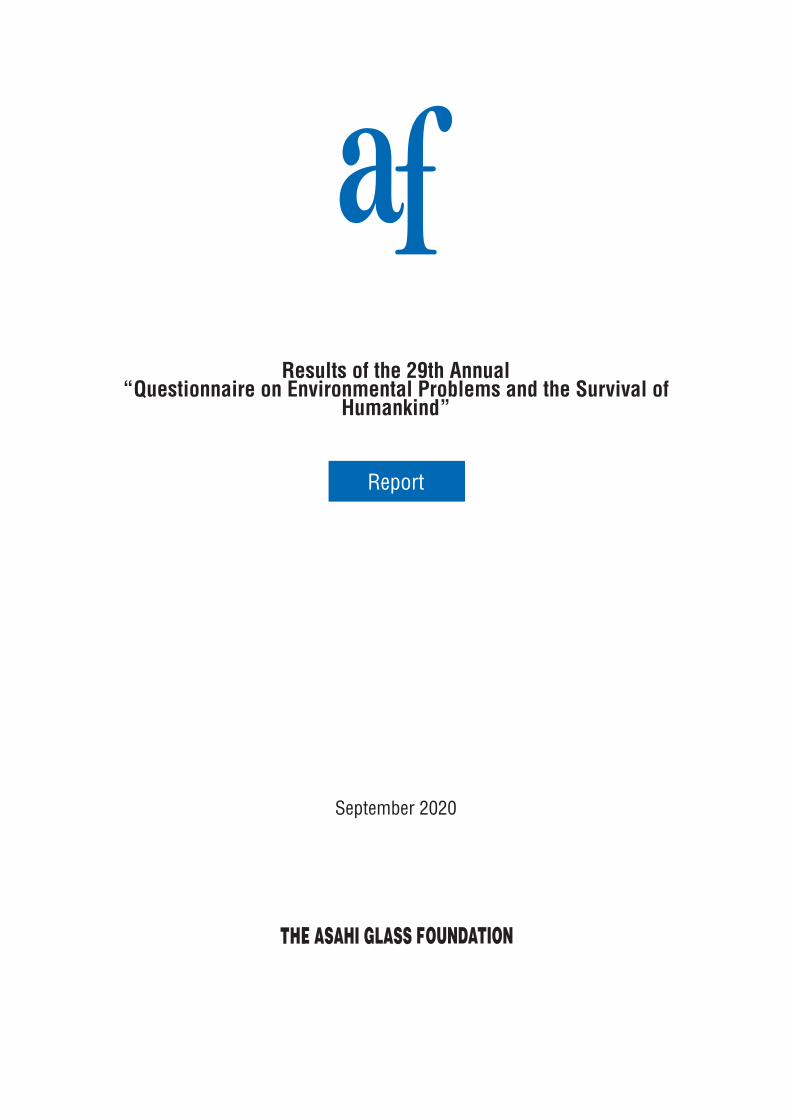
The Environmental Doomsday Clockthe sense of crisis felt about the continuance of the human race

1
Preface
This report summarizes the results of the 2020 Questionnaire on Environmental Problems and the Survival
of Humankind, a survey conducted annually by the Asahi Glass Foundation since 1992. As in the previous
years, the Asahi Glass Foundation wishes to continue communicating to as many people as possible the current
thoughts and opinions of environmental experts around the world on the state of the global environment.
The environmental survey was conducted in April and May 2020 when novel coronavirus (COVID-19) infec-
tions began spreading worldwide. This raised a concern about a potential sizeable drop in the number of survey
responses we would receive. Indeed, we received comments from some respondents that their workplaces were
closed or their responses to the survey were delayed as they had been hospitalized with COVID-19. With the
deterioration of postage services, many items we had posted were returned as “undeliverable”. Despite this situa-
tion, we are grateful that we eventually received responses from 1,813 people, only a little over 10% less than in
2019 when we had received responses from 2,072 people. We would like to take this opportunity to express our
gratitude for being able to provide this report on the environmental questionnaire results in which people from
regions around the world participated during this difficult time.
This year, the time on the Environmental Doomsday Clock (the “time on the Clock”) has struck 9:47. It first
went closet to midnight at 9:47 in 2018, while it was at 9:46 in 2019. This year’s time is almost the same as in the
past two years, demonstrating a strong awareness of crisis in these three consecutive years.
On the questions about the signs of improvement which were introduced in 2019, “Climate Change” was most
frequently selected as the area where the respondents saw signs of improvement. The ratio of respondents who
answered that an awareness of the general public had improved also rose in comparison with the previous year.
We received many responses. Furthermore, more than half the respondents provided meaningful opinions and
comments.
As in the previous year, we will post the comments we received from the respondents living in various countries
on the Asahi Glass Foundation website (https://www. af-info.or.jp/questionnaire/result.html).
Please read the candid opinions of environmental experts.
We sincerely hope that we can make a contribution to the resolution of global environmental issues through this
questionnaire by inspiring not only those who are involved in environmental issues but also as many other peo-
ple as possible to take an interest in environmental issues.
We once again extend our deepest gratitude to the respondents for taking time to share their valuable opinions
and experience through the survey. We would also appreciate valuable advice and guidance from the readers of
this report.
The Asahi Glass Foundation
September 2020

2
I. Survey Overview
Survey period: April to June 2020
Respondents: Environmental experts working for national or local governments, NGOs, NPOs, universities and research institutions, corporations, mass media, and so on, worldwide (listed on the Asahi Glass Foundation database)
Number of questionnaires mailed: 27,925 (26,779+ to overseas respondents and 1,146 to respondents in Japan)
Number of questionnaires returned: 1,813
Response rate: 6.5%
Region Number of responses Percent of total
49 2.7176 9.776 4.2
112 6.2223 12.386 4.728 1.546 2.5
OceaniaNorth AmericaCentral America & The Caribbean South AmericaWestern EuropeAfricaMiddle EastEastern Europe & former Soviet Union Asia 1017 56.1
Total 1813 100.0
Occupational AffiliationCentral government, Local government 221 12.2University or research institution 628 34.6NGO/NPO 369 20.4Corporation 343 18.9Mass Media 30 1.7Other 217 12.0No response 5 0.3Total 1813 100.0
Table 1. Breakdown of Respondents by Region, Gender, and Occupational Affiliation
Unless otherwise specifically explained, the questionnaire calculated the percentages for its analysis as follow:For questions where respondents were asked to choose one response: the denominator is the number or questionnaires returned. Forquestions where respondents were given options to provide multiple answers: the denominator is the total number of valid responses.Figures have been rounded to whole numbers or the first decimal place.On the total number of responses basis: When the total number of responses given to a specific qustion is used as the base, instead of thenumber of qustionnaires returned.
*1
*2*3
Table 1 Breakdown of Respondents by Region and Occupational Affiliation
*1. Unless otherwise specifically explained, the questionnaire calculated the percentages for its analysis as follows:
For questions where respondents were asked to choose one response: the denominator is the number of questionnaires returned. For questions where respondents were given options to provide multiple answers: the denominator is the total number of valid responses.
*2. Figures have been rounded to whole numbers or the first decimal place.
*3. On the total number of responses basis: When the total number of responses given to a specific question is used as the base, instead of the number ofquestionnaires returned.

3
II. Summary of Questionnaire Results
II-1. Awareness of the Crisis for Human Survival—The Environmental Doomsday Clock
• The time on the Environmental Doomsday Clock (the “time on the Clock”) for the world is now 9:47, oneminute closer to midnight than last year. This time is the same as that in 2018 when the strongest sense ofenvironmental crisis was felt by the respondents since the start of the survey in 1992, and showing a strongsense of crisis through the three consecutive years.
• As in the last year, “Climate Change” was the most often selected category of the “environmental issues tobe taken into account,” which were used to calculate the time on the Clock worldwide. This was followed by“Biosphere Integrity (Biodiversity),” “Society, Economy and Environment, Policies, Measures,” “WaterResources,” “Population,” “Biochemical Flows (Pollution/Contamination),” “Lifestyles (Consumption Hab-its),” “Land-System Change (Land Use),” and “Food.”
• When arranging the “environmental issues to be taken into account” for the entire world on the Environ-mental Doomsday Clock, “Biosphere Integrity (Biodiversity)” had the time closest to midnight, followedby “Climate Change,” “Biochemical Flows (Pollution/Contamination),” “Population,” “Lifestyle (Con-sumption Habits),” “Society, Economy and Environment, Policies, Measures,” “Land-System Change(Land Use),” “Food,” and “Water Resources.”
II-2. Awareness of Signs of Improvements in the Approach to Environmental Issues: Comparisonwith the Situation before the Adoption of the Paris Agreement and the SDGs in 2015
• In 2019, we introduced questions on signs of improvement in the approach to environmental issues intransitioning to a decarbonized society and choosing one category from “environmental issues to betaken into account,” respectively, in terms of the following three aspects: “Public Awareness,”“Policies and Legal System,” and “Social Infrastructure (Funds, Human Resources, Technologies, andFacilities).”
• With regard to the transition to a decarbonized society, some signs of improvement were noted, but theresult shows that the advances made in “Policies and Legal System” and “Social Infrastructure (Funds,Human Resources, Technologies, and Facilities)” were less pronounced than those for “Public Aware-ness.” Nonetheless, improvements were made in all three areas compared with the 2019 results.
• The category most commonly identified as showing signs of improvement in approach was “ClimateChange” at 28%, which was followed by “Lifestyle (Consumption Habits)” (14%) and “Society, Economyand Environment, Policies, Measures” (14%). Sixteen percentage of the respondents selected the answer,“There is no sign of improvement at all.” In comparison with the 2019 results, a larger percentage of therespondents considered that improvements have been made in “Public Awareness” and “Social Infrastruc-ture (Funds, Human Resources, Technologies, and Facilities),” while a smaller percentage of the respon-dents answered that improvements have been made in “Policies and Legal System.”
• By region, a greater percentage of the respondents in the USA and Western Europe (except UK)selected “Public Awareness” as a category showing signs of improvement, while a greater percentage ofthe respondents in China selected “Policies and Legal System” as a category showing signs ofimprovement. There were fewer regional dif-ferences with respect to “Social Infrastructure (Funds,Human Resources, Technologies, and Facilities).”
4
III. Questionnaire Results
III-1. Awareness of the Crisis Facing Human Survival – The Environmental Doomsday Clock
In Table 5 on page 7, “Environmental issues to be taken into account” are shown. Keeping in mind the problems that the environment faces at a global level, please select the three most pressing issues for the country or the region where you reside. Then, please rank them in the order of importance. Lastly, for each item, select a time using hours and minutes between 0:10 to 12:00, to indicate the level of crisis for that issue. For the purpose of calculating results, please select your times in units of no less than 10 minutes.
About the calculation of the time on the Environmental Doomsday ClockThe time on the Environmental Doomsday Clock will be determined by taking the weighted average of the data. The issue ranked in first place will be weighted at 50%, second place at 30%, and third place at 20%.If a respondent selected only two issues, the first-ranked issue is weighted at 62.5% and second place at 37.5%. If the respondent selected only one issue, the selected issue is weighted at 100%.
III-1-1. The Time on the Environmental Doomsday Clock
Fig. 1 Changes in the Time on the Environmental Doomsday Clock since 1992
Table 2 Changes in the Time on the Environmental Doomsday Clock over Time
• The time on the Clock for the world is 9:47, which is one minute closer to midnight than last year.
Table 2. Changes in Times on the Environmental Doomsday Clock over Time
Year 2010 2019 2020 2010 → 2020 2019 → 2020World 9:19 → 9:46 → 9:47 +28 +1
10:29 → 10:31 → 10:20 -9 -1110:13 → 10:30 → 10:33 +20 +3
→ 9:36 → 9:38 -10 +2
→ 9:38 → 9:29 -19 -99:45 → 10:06 → 9:59 +14 -7
10:24 → 8:59 → 8:34 -110 -2510:47 → 9:45 → 9:35 -72 -109:47 → 9:13 → 9:30 -17 +17
OceaniaNorth AmericaCentral America & The Caribbean South AmericaWestern EuropeAfricaMiddle EastEastern Europe & former Soviet Union Asia 9:06 → 9:38 → 9:44 +38 +6
Red numbers indicate the time moved closer to midnight; green indicates the time receded back from midnight.*Time for South America, Central America, and the Caribbean
Change in Time on the Clock Change in Time (min)
9:48*
Red numbers indicate the time moved closer to midnight; green numbers indicate the time receded back from midnight.
*: Time for South America, Central America and The Caribbean
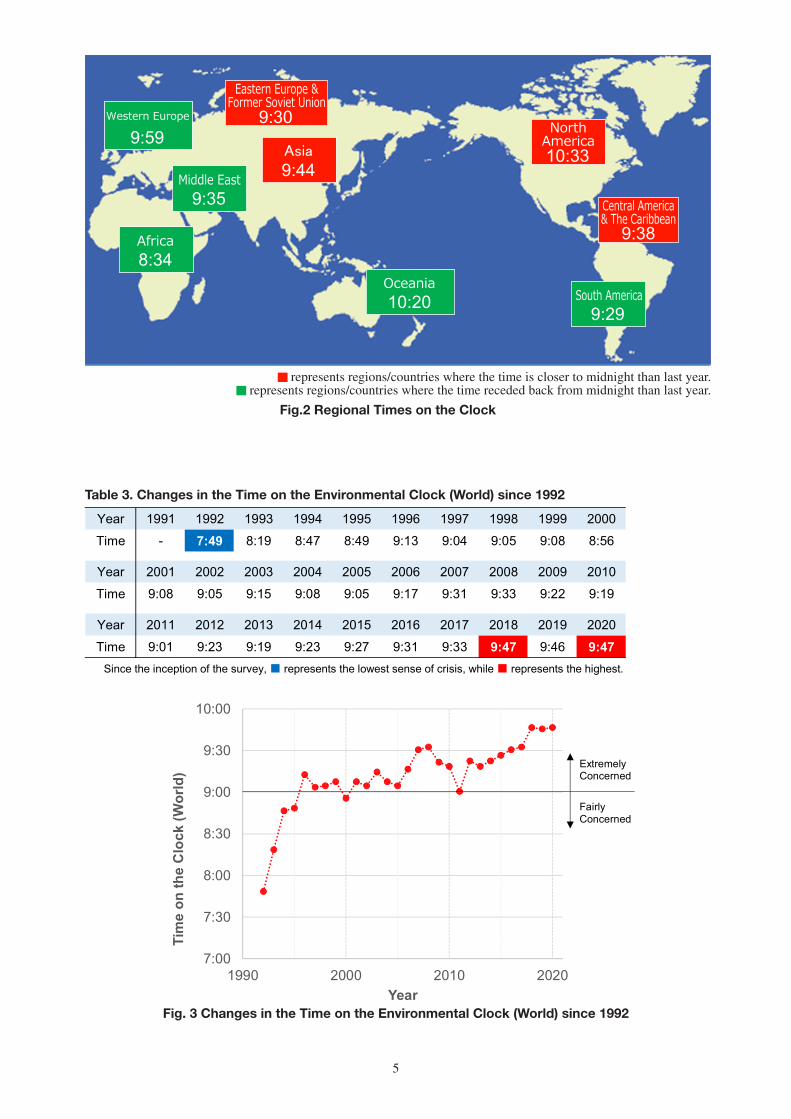
5
represents regions/countries where the time is closer to midnight than last year. represents regions/countries where the time receded back from midnight than last year.
Eastern Europe &Former Soviet Union
9:30Western Europe
9:59
Central America& The Caribbean
9:38
South America9:29
Middle East9:35
NorthAmerica10:33
Oceania10:20
Asia
9:44
Africa8:34
■Represents regions/countries where the time is closer to midnaight than last year.■Represents regions/countries where the time receded back from midnight than last year.
Table 3. Changes in the Time on the Environmental Clock (World) since 1992
Fig. 3 Changes in the Time on the Environmental Clock (World) since 1992
Fig.2 Regional Times on the Clock
Table 3. Changes in the Time on the Environmental Clock (World) since 1992Year 1991 1992 1993 1994 1995 1996 1997 1998 1999 2000Time - 7:49 8:19 8:47 8:49 9:13 9:04 9:05 9:08 8:56
Year 2001 2002 2003 2004 2005 2006 2007 2008 2009 2010Time 9:08 9:05 9:15 9:08 9:05 9:17 9:31 9:33 9:22 9:19
Year 2011 2012 2013 2014 2015 2016 2017 2018 2019 2020Time 9:01 9:23 9:19 9:23 9:27 9:31 9:33 9:47 9:46 9:47
Since the inception of the survey, ■ represents the lowest sense of crisis, while ■ represents the highest.
7:00
7:30
8:00
8:30
9:00
9:30
10:00
1990 2000 2010 2020
Tim
eon
the
Clo
ck(W
orld
)
Year
ExtremelyConcerned
FairlyConcerned
Fig.3 Changes in the Time on the Environmental Clock (World) since 1992
Table 3. Changes in the Time on the Environmental Clock (World) since 1992Year 1991 1992 1993 1994 1995 1996 1997 1998 1999 2000Time - 7:49 8:19 8:47 8:49 9:13 9:04 9:05 9:08 8:56
Year 2001 2002 2003 2004 2005 2006 2007 2008 2009 2010Time 9:08 9:05 9:15 9:08 9:05 9:17 9:31 9:33 9:22 9:19
Year 2011 2012 2013 2014 2015 2016 2017 2018 2019 2020Time 9:01 9:23 9:19 9:23 9:27 9:31 9:33 9:47 9:46 9:47
Since the inception of the survey,■ represents the lowest sense of crisis, while ■ represents the highest.
7:00
7:30
8:00
8:30
9:00
9:30
10:00
1990 2000 2010 2020
Tim
e on
the
Clo
ck (W
orld
)
Year
ExtremelyConcerned
FairlyConcerned
Fig.3 Changes in the Time on the Environmental Clock (World) since 1992

6
Table 4. Changes in the Time on the Environmental Doomsday Clock by GenerationYear 2011 2012 2013 2014 2015 2016 2017 2018 2019 2020Time 9:01 9:23 9:19 9:23 9:27 9:31 9:33 9:47 9:46 9:47
60 or Over 9:28 9:35 9:30 9:35 9:33 9:36 9:43 9:49 9:57 9:5540s, 50s 8:56 9:30 9:25 9:16 9:30 9:28 9:29 9:33 9:44 9:4120s, 30s 8:34 9:05 9:01 9:25 9:17 9:30 9:32 10:00 9:40 9:45
7:30
8:00
8:30
9:00
9:30
10:00
10:30
2010 2015 2020
Tim
e on
the
Clo
ck
Year
60s or Over40s & 50s20s & 30s
Fig.4 Changes in the Time on the Clock by Generation
III-1-1-2. Changes in the Times on the Environmental Doomsday Clock by Generation
• The survey respondents aged 60 or over tended to report more advanced times on the Clock than other age groups.
• While all age groups are developing a stronger sense of crisis each year, the result shows only a a small change overoll fromlast year.
• The times reported by the respondents aged 60 or over were closer to midnight than the times reported by other age groupsand remained stable (between 9:28 and 9:36) until 2016. The Clock started moving forward in 2017 and reached the upper9:50 range last year and this year.
• The times reported by the respondents in their 40s and 50s remained stable at around 9:30 between 2012 and 2017, butadvanced to the 9:40 range last year and this year.
• Times reported by the respondents in their 20s and 30s have kept moving forward since 2011 (when the Clock struck 8:34).In 2018, the time on the Clock hit 10:00 for these age groups due to the impact of the growing sense of crisis among the Chinese respondents in their 20s and 30s. It returned to the 9:40 range last year and this year.
Table 4 Changes in the Times on the Environmental Doomsday Clock by GenerationTable 4. Changes in the Time on the Environmental Doomsday Clock by Generation
Year 2011 2012 2013 2014 2015 2016 2017 2018 2019 2020Time 9:01 9:23 9:19 9:23 9:27 9:31 9:33 9:47 9:46 9:47
60 or Over 9:28 9:35 9:30 9:35 9:33 9:36 9:43 9:49 9:57 9:5540s, 50s 8:56 9:30 9:25 9:16 9:30 9:28 9:29 9:33 9:44 9:4120s, 30s 8:34 9:05 9:01 9:25 9:17 9:30 9:32 10:00 9:40 9:45
7:30
8:00
8:30
9:00
9:30
10:00
10:30
2010 2015 2020
Tim
eon
the
Clo
ck
Year
60s or Over40s & 50s20s & 30s
Fig.4 Changes in the Time on the Clock by Generation
Fig. 4 Changes in the Time on the Clock by Generation

7
Table 1. Environmental issues to be taken into account:
No. Category Examples of Observable Changes in the Country or the Region in which You Reside
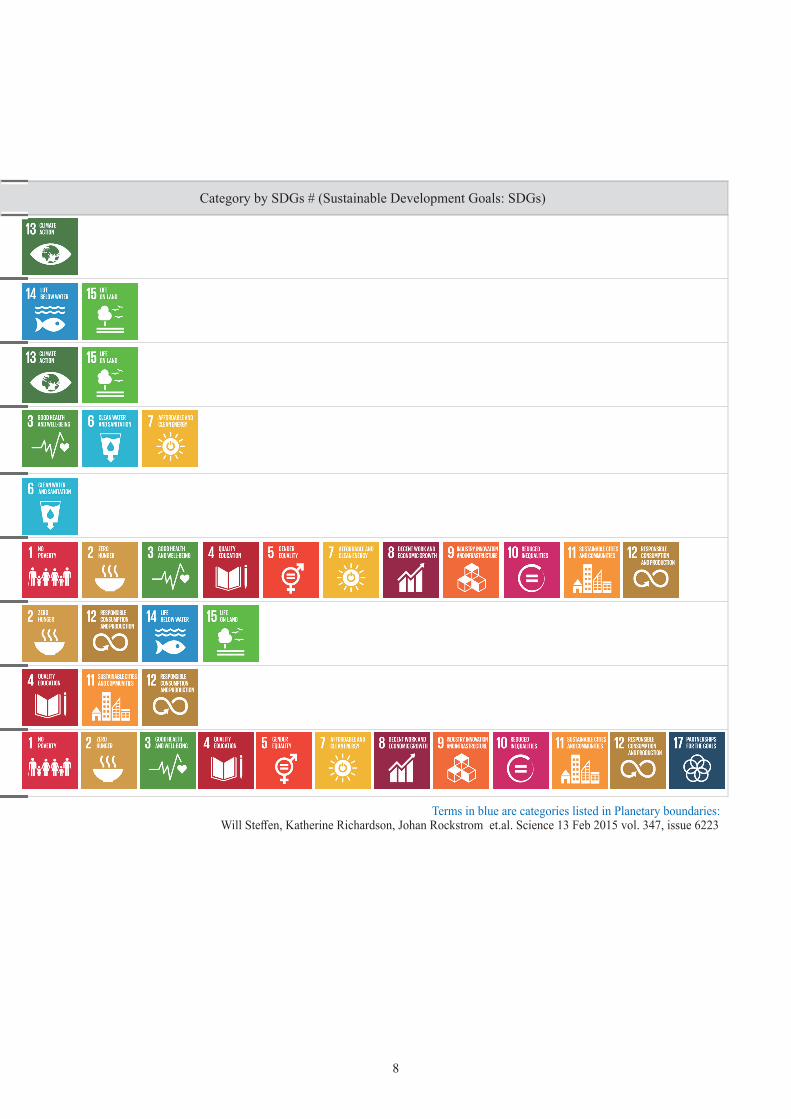
Planetary Boundaries (PB) Category by SDGs # (Sustainable Development Goals: SDGs)
1. Climate ChangeGlobal warming; CO2%, ocean acidification; climatic aberrations (droughts, torrential rains and flooding, severe storms, heavy snow, abnormal temperatures, desertification, etc.)
Climate change, Ocean acidification, Atmospheric aerosol loading, Stratospheric ozone depletion
2.Biosphere Integrity(Biodiversity)
Acceleration of species extinction rate; effects of contamination, climate change, land use
Genetic diversity, Functional diversity
3.Land-System Change(Land Use)
Change in the amount of forest cover remaining at the tropical, temperate and boreal biomes.Change in the amount of cropland
Land-system change
4.Biochemical flows (Pollution/Contamination)
Increase in river, ocean and soil pollution: eutrophication caused by excessive nitrogen and phosphorus and contamination by microplastics and chemical substances; atmospheric pollution: particulates suspended in the atmosphere, soot and chemical substances
Chemical polution, Nitrogen andphosphorous cycles
5. Water ResourcesDiminution of usable fresh water resources (depletion, contamination)Control and degeneration of green water quality (water contained in soil and used by plants)
Freshwater use
6. Population Population growth beyond what the Earth can support; aging of the population Related with almost all the PB
7. Food Diminution of food supply from land and oceans Related with almost all the PB
8.Lifestyles(Consumption Habits)
Transformation of lifestyles away from excessive consumption of resources like energy
Related with almost all the PB
9.Society, Economy and Environment, Policies, Measures
Establishing a green economy with environmental economics and accountingEnvironmental awareness at the individual and societal levels, progress of environmental education, Legal system, social foundation; poverty, governance; the status of women
Related with almost all the PB
Terms in blue are categories listed in Planetary boundaries: Will Steffen, Katherine Richardson, Johan Rockstrom et.al. Science 13 Feb 2015 vol. 347, issue 6223
To be continued
1. Awareness of the Crisis Facing Human Survival - Environmental Doomsday Clock
In Table 1, “Environmental issues to be taken into account” are shown. Keeping in mind the problems that the en-vironment faces at a global level, please select the three most pressing issues for the country or the region where you reside. Then, please rank them in the order of importance. Lastly, for each item, select a time using hours and minutes between 0:10 to 12:00, to indicate the level of crisis for that issue. For the purpose of calculating results, please select your times in units no smaller than 10 minutes.
------------ Example ------------ --------------- Answer ---------------Category Number TIME Category Number TIME
First ( 1 ) 9 : 30 First ( ) :(of the first magnitude) (of the first magnitude)
Second ( 5 ) 7 : 40 Second ( ) :(of the second magnitude) (of the second magnitude)
Third ( 3 ) 8 : 20 Third ( ) :(of the third magnitude) (of the third magnitude)
12
3
6
9
0:01〜 3:00Barely Concerned
3:01〜 6:00Slightly Concerned
9:01〜12:00Extremely Concerned
6:01〜 9:00Fairly Concerned
2. Do you see any signs of improvement in the approach to global environmental issues. Please answer these questions fromthe following three viewpoints in comparison with before 2015 when the Paris Agreement and SDGs were adopted:
2-1 Do you think we are shifting to a decarbonized society?
Definitely Somewhat Cannot say Not really Definitely noteither way
1. Public awareness A B C D E
2. Policies, legal system A B C D E
3. Funds, human resources, A B C D Etechnologies and facilities
2-2 Where do you see signs of improvement? Please choose one category from the Table 1 that shows a list of “Envi-ronmental issues to be taken into account”.Number of the category that shows signs of improvement: □ No sign of improvement at all
There are There are perhaps Cannot say There aren’t really There are noimprovements some improvements either way any improvements improvements at all
1. Public awareness A B C D E
2. Policies, legal system A B C D E
3. Funds, human resources, A B C D Etechnologies and facilities
-Regarding the calculation of the time on the Environmental Doomsday Clock:The time on the Environmental Doomsday Clock will be determined by taking the weighted average of the data. The issue ranked in first place will be weighted at 50%, second place at 30%, and third place at 20%. In the example shown, the time comes to 8:43.
Table 1. Environmental issues to be taken into account:
No. Category Examples of Observable Changes in the Country or the Region in which You Reside
Planetary Boundaries (PB) Category by SDGs # (Sustainable Development Goals: SDGs)
1. Climate ChangeGlobal warming; CO2%, ocean acidification; climatic aberrations (droughts,torrential rains and flooding, severe storms, heavy snow, abnormaltemperatures, desertification, etc.)
Climate change, Ocean acidification, Atmosphericaerosol loading, Stratospheric ozone depletion
2.Biosphere Integrity(Biodiversity)
Acceleration of species extinction rate; effects of contamination, climate change, land use
Genetic diversity, Functional diversity
3.Land-System Change(Land Use)
Change in the amount of forest cover remaining at the tropical, temperate and boreal biomes.Change in the amount of cropland
Land-system change
4.Biochemical flows (Pollution/Contamination)
Increase in river, ocean and soil pollution: eutrophication caused by excessive nitrogen and phosphorus and contamination by microplastics and chemical substances; atmospheric pollution: particulates suspended in the atmosphere, soot and chemical substances
Chemical polution, Nitrogen andphosphorous cycles
5. Water ResourcesDiminution of usable fresh water resources (depletion, contamination)Control and degeneration of green water quality (water contained in soil and used by plants)
Freshwater use
6. Population Population growth beyond what the Earth can support; aging of the population Related with almost all the PB
7. Food Diminution of food supply from land and oceans Related with almost all the PB
8.Lifestyles(Consumption Habits)
Transformation of lifestyles away from excessive consumption of resources like energy
Related with almost all the PB
9.Society, Economy and Environment, Policies, Measures
Establishing a green economy with environmental economics and accountingEnvironmental awareness at the individual and societal levels, progress of environmental education, Legal system, social foundation; poverty, governance; the status of women
Related with almost all the PB
Terms in blue are categories listed in Planetary boundaries: Will Steffen, Katherine Richardson, Johan Rockstrom et.al. Science 13 Feb 2015 vol. 347, issue 6223
To be continued
1. Awareness of the Crisis Facing Human Survival - Environmental Doomsday Clock
In Table 1, “Environmental issues to be taken into account” are shown. Keeping in mind the problems that the en-vironment faces at a global level, please select the three most pressing issues for the country or the region where you reside. Then, please rank them in the order of importance. Lastly, for each item, select a time using hours and minutes between 0:10 to 12:00, to indicate the level of crisis for that issue. For the purpose of calculating results, please select your times in units no smaller than 10 minutes.
------------ Example ------------ --------------- Answer ---------------Category Number TIME Category Number TIME
First ( 1 ) 9 : 30 First ( ) :(of the first magnitude) (of the first magnitude)
Second ( 5 ) 7 : 40 Second ( ) :(of the second magnitude) (of the second magnitude)
Third ( 3 ) 8 : 20 Third ( ) :(of the third magnitude) (of the third magnitude)
12
3
6
9
0:01〜 3:00Barely Concerned
3:01〜 6:00Slightly Concerned
9:01〜12:00Extremely Concerned
6:01〜 9:00Fairly Concerned
2. Do you see any signs of improvement in the approach to global environmental issues. Please answer these questions fromthe following three viewpoints in comparison with before 2015 when the Paris Agreement and SDGs were adopted:
2-1 Do you think we are shifting to a decarbonized society?
Definitely Somewhat Cannot say Not really Definitely noteither way
1. Public awareness A B C D E
2. Policies, legal system A B C D E
3. Funds, human resources, A B C D Etechnologies and facilities
2-2 Where do you see signs of improvement? Please choose one category from the Table 1 that shows a list of “Envi-ronmental issues to be taken into account”.Number of the category that shows signs of improvement: □ No sign of improvement at all
There are There are perhaps Cannot say There aren’t really There are noimprovements some improvements either way any improvements improvements at all
1. Public awareness A B C D E
2. Policies, legal system A B C D E
3. Funds, human resources, A B C D Etechnologies and facilities
-Regarding the calculation of the time on the Environmental Doomsday Clock:The time on the Environmental Doomsday Clock will be determined by taking the weighted average of the data. The issue ranked in first place will be weighted at 50%, second place at 30%, and third place at 20%. In the example shown, the time comes to 8:43.
Table 1. Environmental issues to be taken into account:
No. Category Examples of Observable Changes in the Country or the Region in which You Reside
Planetary Boundaries (PB) Category by SDGs # (Sustainable Development Goals: SDGs)
1. Climate ChangeGlobal warming; CO2%, ocean acidification; climatic aberrations (droughts,torrential rains and flooding, severe storms, heavy snow, abnormaltemperatures, desertification, etc.)
Climate change, Ocean acidification, Atmospheric aerosol loading, Stratospheric ozone depletion
2.Biosphere Integrity(Biodiversity)
Acceleration of species extinction rate; effects of contamination, climate change, land use
Genetic diversity, Functional diversity
3.Land-System Change(Land Use)
Change in the amount of forest cover remaining at the tropical, temperate and boreal biomes.Change in the amount of cropland
Land-system change
4.Biochemical flows (Pollution/Contamination)
Increase in river, ocean and soil pollution: eutrophication caused by excessive nitrogen and phosphorus and contamination by microplastics and chemical substances; atmospheric pollution: particulates suspended in the atmosphere, soot and chemical substances
Chemical polution, Nitrogen andphosphorous cycles
5. Water ResourcesDiminution of usable fresh water resources (depletion, contamination)Control and degeneration of green water quality (water contained in soil and used by plants)
Freshwater use
6. Population Population growth beyond what the Earth can support; aging of the population Related with almost all the PB
7. Food Diminution of food supply from land and oceans Related with almost all the PB
8.Lifestyles(Consumption Habits)
Transformation of lifestyles away from excessive consumption of resources like energy
Related with almost all the PB
9.Society, Economy and Environment, Policies, Measures
Establishing a green economy with environmental economics and accountingEnvironmental awareness at the individual and societal levels, progress of environmental education, Legal system, social foundation; poverty, governance; the status of women
Related with almost all the PB
Terms in blue are categories listed in Planetary boundaries: Will Steffen, Katherine Richardson, Johan Rockstrom et.al. Science 13 Feb 2015 vol. 347, issue 6223
To be continued
1. Awareness of the Crisis Facing Human Survival - Environmental Doomsday Clock
In Table 1, “Environmental issues to be taken into account” are shown. Keeping in mind the problems that the en-vironment faces at a global level, please select the three most pressing issues for the country or the region where you reside. Then, please rank them in the order of importance. Lastly, for each item, select a time using hours and minutes between 0:10 to 12:00, to indicate the level of crisis for that issue. For the purpose of calculating results, please select your times in units no smaller than 10 minutes.
------------ Example ------------ --------------- Answer ---------------Category Number TIME Category Number TIME
First ( 1 ) 9 : 30 First ( ) :(of the first magnitude) (of the first magnitude)
Second ( 5 ) 7 : 40 Second ( ) :(of the second magnitude) (of the second magnitude)
Third ( 3 ) 8 : 20 Third ( ) :(of the third magnitude) (of the third magnitude)
12
3
6
9
0:01〜 3:00Barely Concerned
3:01〜 6:00Slightly Concerned
9:01〜12:00Extremely Concerned
6:01〜 9:00Fairly Concerned
2. Do you see any signs of improvement in the approach to global environmental issues. Please answer these questions fromthe following three viewpoints in comparison with before 2015 when the Paris Agreement and SDGs were adopted:
2-1 Do you think we are shifting to a decarbonized society?
Definitely Somewhat Cannot say Not really Definitely noteither way
1. Public awareness A B C D E
2. Policies, legal system A B C D E
3. Funds, human resources, A B C D Etechnologies and facilities
2-2 Where do you see signs of improvement? Please choose one category from the Table 1 that shows a list of “Envi-ronmental issues to be taken into account”.Number of the category that shows signs of improvement: □ No sign of improvement at all
There are There are perhaps Cannot say There aren’t really There are noimprovements some improvements either way any improvements improvements at all
1. Public awareness A B C D E
2. Policies, legal system A B C D E
3. Funds, human resources, A B C D Etechnologies and facilities
-Regarding the calculation of the time on the Environmental Doomsday Clock:The time on the Environmental Doomsday Clock will be determined by taking the weighted average of the data. The issue ranked in first place will be weighted at 50%, second place at 30%, and third place at 20%. In the example shown, the time comes to 8:43.
III-1-2. Environmental Issues to be Taken into Account
Table 5 Environmental Issues to be Taken into Account
Global warming: Increase in CO2%, Ocean acidification,Climatic aberrations (droughts, torrential rains and flooding, severe storms, heavy snow, abnormal temperatures, desertification, etc.)
Acceleration of species extinction rate(Effects of contamination, climate change, land use)
Change in the amount of forest cover remaining at the tropical, temperate and boreal biomes, Change in the amount of cropland
Increase in river, ocean, and soil pollution: eutrophication caused by exces-sive nitrogen and phosphorus, contamination by microplastics and chemical substances; Atmospheric pollution: particulates suspended in the atmo-sphere, soot, and chemical substances
Diminution of usable fresh water resources (depletion, contamination), Control and degeneration of green water quality (water contained in soil and used by plants)
Population growth beyond what the Earth can support, Aging of the population
Diminution of food supply from land and sea
Transformation of lifestyle away from excessive consumption of resources like energy
Establishing a green economy with environmental economics and account-ing, Environmental awareness at the individual and societal levels, Progress of environmental education, Legal system, Social foundation, Poverty, Governance, Status of women
8
Table 1. Environmental issues to be taken into account:
No. Category Examples of Observable Changes in the Country or the Region in which You Reside
Planetary Boundaries (PB) Category by SDGs # (Sustainable Development Goals: SDGs)
1. Climate ChangeGlobal warming; CO2%, ocean acidification; climatic aberrations (droughts,torrential rains and flooding, severe storms, heavy snow, abnormaltemperatures, desertification, etc.)
Climate change, Oceanacidification, Atmosphericaerosol loading, Stratospheric ozone depletion
2.Biosphere Integrity(Biodiversity)
Acceleration of species extinction rate; effects of contamination, climate change, land use
Genetic diversity, Functional diversity
3.Land-System Change(Land Use)
Change in the amount of forest cover remaining at the tropical, temperate and boreal biomes.Change in the amount of cropland
Land-system change
4.Biochemical flows (Pollution/Contamination)
Increase in river, ocean and soil pollution: eutrophication caused by excessive nitrogen and phosphorus and contamination by microplastics and chemical substances; atmospheric pollution: particulates suspended in the atmosphere, soot and chemical substances
Chemical polution, Nitrogen andphosphorous cycles
5. Water ResourcesDiminution of usable fresh water resources (depletion, contamination)Control and degeneration of green water quality (water contained in soil and used by plants)
Freshwater use
6. Population Population growth beyond what the Earth can support; aging of the population Related with almost all the PB
7. Food Diminution of food supply from land and oceans Related with almost all the PB
8.Lifestyles(Consumption Habits)
Transformation of lifestyles away from excessive consumption of resources like energy
Related with almost all the PB
9.Society, Economy and Environment, Policies, Measures
Establishing a green economy with environmental economics and accountingEnvironmental awareness at the individual and societal levels, progress of environmental education, Legal system, social foundation; poverty, governance; the status of women
Related with almost all the PB
Terms in blue are categories listed in Planetary boundaries: Will Steffen, Katherine Richardson, Johan Rockstrom et.al. Science 13 Feb 2015 vol. 347, issue 6223
To be continued
1. Awareness of the Crisis Facing Human Survival - Environmental Doomsday Clock
In Table 1, “Environmental issues to be taken into account” are shown. Keeping in mind the problems that the en-vironment faces at a global level, please select the three most pressing issues for the country or the region where you reside. Then, please rank them in the order of importance. Lastly, for each item, select a time using hours and minutes between 0:10 to 12:00, to indicate the level of crisis for that issue. For the purpose of calculating results, please select your times in units no smaller than 10 minutes.
------------ Example ------------ --------------- Answer ---------------Category Number TIME Category Number TIME
First ( 1 ) 9 : 30 First ( ) :(of the first magnitude) (of the first magnitude)
Second ( 5 ) 7 : 40 Second ( ) :(of the second magnitude) (of the second magnitude)
Third ( 3 ) 8 : 20 Third ( ) :(of the third magnitude) (of the third magnitude)
12
3
6
9
0:01〜 3:00Barely Concerned
3:01〜 6:00Slightly Concerned
9:01〜12:00Extremely Concerned
6:01〜 9:00Fairly Concerned
2. Do you see any signs of improvement in the approach to global environmental issues. Please answer these questions fromthe following three viewpoints in comparison with before 2015 when the Paris Agreement and SDGs were adopted:
2-1 Do you think we are shifting to a decarbonized society?
Definitely Somewhat Cannot say Not really Definitely noteither way
1. Public awareness A B C D E
2. Policies, legal system A B C D E
3. Funds, human resources, A B C D Etechnologies and facilities
2-2 Where do you see signs of improvement? Please choose one category from the Table 1 that shows a list of “Envi-ronmental issues to be taken into account”.Number of the category that shows signs of improvement: □ No sign of improvement at all
There are There are perhaps Cannot say There aren’t really There are noimprovements some improvements either way any improvements improvements at all
1. Public awareness A B C D E
2. Policies, legal system A B C D E
3. Funds, human resources, A B C D Etechnologies and facilities
-Regarding the calculation of the time on the Environmental Doomsday Clock:The time on the Environmental Doomsday Clock will be determined by taking the weighted average of the data. The issue ranked in first place will be weighted at 50%, second place at 30%, and third place at 20%. In the example shown, the time comes to 8:43.
Table 1. Environmental issues to be taken into account:
No. Category Examples of Observable Changes in the Country or the Region in which You Reside
Planetary Boundaries (PB) Category by SDGs # (Sustainable Development Goals: SDGs)
1. Climate ChangeGlobal warming; CO2%, ocean acidification; climatic aberrations (droughts,torrential rains and flooding, severe storms, heavy snow, abnormaltemperatures, desertification, etc.)
Climate change, Ocean acidification, Atmospheric aerosol loading, Stratospheric ozone depletion
2.Biosphere Integrity(Biodiversity)
Acceleration of species extinction rate; effects of contamination, climate change, land use
Genetic diversity, Functional diversity
3.Land-System Change(Land Use)
Change in the amount of forest cover remaining at the tropical, temperate and boreal biomes.Change in the amount of cropland
Land-system change
4.Biochemical flows (Pollution/Contamination)
Increase in river, ocean and soil pollution: eutrophication caused by excessive nitrogen and phosphorus and contamination by microplastics and chemical substances; atmospheric pollution: particulates suspended in the atmosphere, soot and chemical substances
Chemical polution, Nitrogen andphosphorous cycles
5. Water ResourcesDiminution of usable fresh water resources (depletion, contamination)Control and degeneration of green water quality (water contained in soil and used by plants)
Freshwater use
6. Population Population growth beyond what the Earth can support; aging of the population Related with almost all the PB
7. Food Diminution of food supply from land and oceans Related with almost all the PB
8.Lifestyles(Consumption Habits)
Transformation of lifestyles away from excessive consumption of resources like energy
Related with almost all the PB
9.Society, Economy and Environment, Policies, Measures
Establishing a green economy with environmental economics and accountingEnvironmental awareness at the individual and societal levels, progress of environmental education, Legal system, social foundation; poverty, governance; the status of women
Related with almost all the PB
Terms in blue are categories listed in Planetary boundaries: Will Steffen, Katherine Richardson, Johan Rockstrom et.al. Science 13 Feb 2015 vol. 347, issue 6223
To be continued
1. Awareness of the Crisis Facing Human Survival - Environmental Doomsday Clock
In Table 1, “Environmental issues to be taken into account” are shown. Keeping in mind the problems that the en-vironment faces at a global level, please select the three most pressing issues for the country or the region where you reside. Then, please rank them in the order of importance. Lastly, for each item, select a time using hours and minutes between 0:10 to 12:00, to indicate the level of crisis for that issue. For the purpose of calculating results, please select your times in units no smaller than 10 minutes.
------------ Example ------------ --------------- Answer ---------------Category Number TIME Category Number TIME
First ( 1 ) 9 : 30 First ( ) :(of the first magnitude) (of the first magnitude)
Second ( 5 ) 7 : 40 Second ( ) :(of the second magnitude) (of the second magnitude)
Third ( 3 ) 8 : 20 Third ( ) :(of the third magnitude) (of the third magnitude)
12
3
6
9
0:01〜 3:00Barely Concerned
3:01〜 6:00Slightly Concerned
9:01〜12:00Extremely Concerned
6:01〜 9:00Fairly Concerned
2. Do you see any signs of improvement in the approach to global environmental issues. Please answer these questions fromthe following three viewpoints in comparison with before 2015 when the Paris Agreement and SDGs were adopted:
2-1 Do you think we are shifting to a decarbonized society?
Definitely Somewhat Cannot say Not really Definitely noteither way
1. Public awareness A B C D E
2. Policies, legal system A B C D E
3. Funds, human resources, A B C D Etechnologies and facilities
2-2 Where do you see signs of improvement? Please choose one category from the Table 1 that shows a list of “Envi-ronmental issues to be taken into account”.Number of the category that shows signs of improvement: □ No sign of improvement at all
There are There are perhaps Cannot say There aren’t really There are noimprovements some improvements either way any improvements improvements at all
1. Public awareness A B C D E
2. Policies, legal system A B C D E
3. Funds, human resources, A B C D Etechnologies and facilities
-Regarding the calculation of the time on the Environmental Doomsday Clock:The time on the Environmental Doomsday Clock will be determined by taking the weighted average of the data. The issue ranked in first place will be weighted at 50%, second place at 30%, and third place at 20%. In the example shown, the time comes to 8:43.
Table 1. Environmental issues to be taken into account:
No. Category Examples of Observable Changes in the Country or the Region in which You Reside
Planetary Boundaries (PB) Category by SDGs # (Sustainable Development Goals: SDGs)
1. Climate ChangeGlobal warming; CO2%, ocean acidification; climatic aberrations (droughts,torrential rains and flooding, severe storms, heavy snow, abnormaltemperatures, desertification, etc.)
Climate change, Oceanacidification, Atmosphericaerosol loading, Stratospheric ozone depletion
2.Biosphere Integrity(Biodiversity)
Acceleration of species extinction rate; effects of contamination, climate change, land use
Genetic diversity, Functional diversity
3.Land-System Change(Land Use)
Change in the amount of forest cover remaining at the tropical, temperate and boreal biomes.Change in the amount of cropland
Land-system change
4.Biochemical flows (Pollution/Contamination)
Increase in river, ocean and soil pollution: eutrophication caused by excessive nitrogen and phosphorus and contamination by microplastics and chemical substances; atmospheric pollution: particulates suspended in the atmosphere, soot and chemical substances
Chemical polution, Nitrogen andphosphorous cycles
5. Water ResourcesDiminution of usable fresh water resources (depletion, contamination)Control and degeneration of green water quality (water contained in soil and used by plants)
Freshwater use
6. Population Population growth beyond what the Earth can support; aging of the population Related with almost all the PB
7. Food Diminution of food supply from land and oceans Related with almost all the PB
8.Lifestyles(Consumption Habits)
Transformation of lifestyles away from excessive consumption of resources like energy
Related with almost all the PB
9.Society, Economy and Environment, Policies, Measures
Establishing a green economy with environmental economics and accountingEnvironmental awareness at the individual and societal levels, progress of environmental education, Legal system, social foundation; poverty, governance; the status of women
Related with almost all the PB
Terms in blue are categories listed in Planetary boundaries: Will Steffen, Katherine Richardson, Johan Rockstrom et.al. Science 13 Feb 2015 vol. 347, issue 6223
To be continued
1. Awareness of the Crisis Facing Human Survival - Environmental Doomsday Clock
In Table 1, “Environmental issues to be taken into account” are shown. Keeping in mind the problems that the en-vironment faces at a global level, please select the three most pressing issues for the country or the region where you reside. Then, please rank them in the order of importance. Lastly, for each item, select a time using hours and minutes between 0:10 to 12:00, to indicate the level of crisis for that issue. For the purpose of calculating results, please select your times in units no smaller than 10 minutes.
------------ Example ------------ --------------- Answer ---------------Category Number TIME Category Number TIME
First ( 1 ) 9 : 30 First ( ) :(of the first magnitude) (of the first magnitude)
Second ( 5 ) 7 : 40 Second ( ) :(of the second magnitude) (of the second magnitude)
Third ( 3 ) 8 : 20 Third ( ) :(of the third magnitude) (of the third magnitude)
12
3
6
9
0:01〜 3:00Barely Concerned
3:01〜 6:00Slightly Concerned
9:01〜12:00Extremely Concerned
6:01〜 9:00Fairly Concerned
2. Do you see any signs of improvement in the approach to global environmental issues. Please answer these questions fromthe following three viewpoints in comparison with before 2015 when the Paris Agreement and SDGs were adopted:
2-1 Do you think we are shifting to a decarbonized society?
Definitely Somewhat Cannot say Not really Definitely noteither way
1. Public awareness A B C D E
2. Policies, legal system A B C D E
3. Funds, human resources, A B C D Etechnologies and facilities
2-2 Where do you see signs of improvement? Please choose one category from the Table 1 that shows a list of “Envi-ronmental issues to be taken into account”.Number of the category that shows signs of improvement: □ No sign of improvement at all
There are There are perhaps Cannot say There aren’t really There are noimprovements some improvements either way any improvements improvements at all
1. Public awareness A B C D E
2. Policies, legal system A B C D E
3. Funds, human resources, A B C D Etechnologies and facilities
-Regarding the calculation of the time on the Environmental Doomsday Clock:The time on the Environmental Doomsday Clock will be determined by taking the weighted average of the data. The issue ranked in first place will be weighted at 50%, second place at 30%, and third place at 20%. In the example shown, the time comes to 8:43.
Table 1. Environmental issues to be taken into account:
No. Category Examples of Observable Changes in the Country or the Region in which You Reside
Planetary Boundaries (PB) Category by SDGs # (Sustainable Development Goals: SDGs)
1. Climate ChangeGlobal warming; CO2%, ocean acidification; climatic aberrations (droughts,torrential rains and flooding, severe storms, heavy snow, abnormaltemperatures, desertification, etc.)
Climate change, Oceanacidification, Atmosphericaerosol loading, Stratospheric ozone depletion
2.Biosphere Integrity(Biodiversity)
Acceleration of species extinction rate; effects of contamination, climate change, land use
Genetic diversity, Functional diversity
3.Land-System Change(Land Use)
Change in the amount of forest cover remaining at the tropical, temperate and boreal biomes.Change in the amount of cropland
Land-system change
4.Biochemical flows (Pollution/Contamination)
Increase in river, ocean and soil pollution: eutrophication caused by excessive nitrogen and phosphorus and contamination by microplastics and chemical substances; atmospheric pollution: particulates suspended in the atmosphere, soot and chemical substances
Chemical polution, Nitrogen andphosphorous cycles
5. Water ResourcesDiminution of usable fresh water resources (depletion, contamination)Control and degeneration of green water quality (water contained in soil and used by plants)
Freshwater use
6. Population Population growth beyond what the Earth can support; aging of the population Related with almost all the PB
7. Food Diminution of food supply from land and oceans Related with almost all the PB
8.Lifestyles(Consumption Habits)
Transformation of lifestyles away from excessive consumption of resources like energy
Related with almost all the PB
9.Society, Economy and Environment, Policies, Measures
Establishing a green economy with environmental economics and accountingEnvironmental awareness at the individual and societal levels, progress of environmental education, Legal system, social foundation; poverty, governance; the status of women
Related with almost all the PB
Terms in blue are categories listed in Planetary boundaries: Will Steffen, Katherine Richardson, Johan Rockstrom et.al. Science 13 Feb 2015 vol. 347, issue 6223
To be continued
1. Awareness of the Crisis Facing Human Survival - Environmental Doomsday Clock
In Table 1, “Environmental issues to be taken into account” are shown. Keeping in mind the problems that the en-vironment faces at a global level, please select the three most pressing issues for the country or the region where you reside. Then, please rank them in the order of importance. Lastly, for each item, select a time using hours and minutes between 0:10 to 12:00, to indicate the level of crisis for that issue. For the purpose of calculating results, please select your times in units no smaller than 10 minutes.
------------ Example ------------ --------------- Answer ---------------Category Number TIME Category Number TIME
First ( 1 ) 9 : 30 First ( ) :(of the first magnitude) (of the first magnitude)
Second ( 5 ) 7 : 40 Second ( ) :(of the second magnitude) (of the second magnitude)
Third ( 3 ) 8 : 20 Third ( ) :(of the third magnitude) (of the third magnitude)
12
3
6
9
0:01〜 3:00Barely Concerned
3:01〜 6:00Slightly Concerned
9:01〜12:00Extremely Concerned
6:01〜 9:00Fairly Concerned
2. Do you see any signs of improvement in the approach to global environmental issues. Please answer these questions fromthe following three viewpoints in comparison with before 2015 when the Paris Agreement and SDGs were adopted:
2-1 Do you think we are shifting to a decarbonized society?
Definitely Somewhat Cannot say Not really Definitely noteither way
1. Public awareness A B C D E
2. Policies, legal system A B C D E
3. Funds, human resources, A B C D Etechnologies and facilities
2-2 Where do you see signs of improvement? Please choose one category from the Table 1 that shows a list of “Envi-ronmental issues to be taken into account”.Number of the category that shows signs of improvement: □ No sign of improvement at all
There are There are perhaps Cannot say There aren’t really There are noimprovements some improvements either way any improvements improvements at all
1. Public awareness A B C D E
2. Policies, legal system A B C D E
3. Funds, human resources, A B C D Etechnologies and facilities
-Regarding the calculation of the time on the Environmental Doomsday Clock:The time on the Environmental Doomsday Clock will be determined by taking the weighted average of the data. The issue ranked in first place will be weighted at 50%, second place at 30%, and third place at 20%. In the example shown, the time comes to 8:43.

9
III-1-2-1. Distribution of the Environmental Issues (showing selection rate of respondent’s 3 most pressing issues as a percentage and the time on the Clock)
• As in the last year, “Climate Change” (30%) was the most often selected category among the “environmental issues to betaken into account,” which are used to calculate the time on the worldwide Environmental Doomsday Clock. This was fol-lowed by “Biosphere Integrity (Biodiversity)” (14%), “Society, Economy and Environment, Policies, Measures” (12%),“Water Resources” (9%), “Population” (8%), “Biochemical Flows (Pollution/Contamination)” (8%), “Lifestyles” (7%),“Land-System Change (Land Use)” (7%), and “Food” (4%).
• When arranging the “environmental issues to be taken into account,” for the entire world on the Environmental DoomsdayClock, “Biosphere Integrity (Biodiversity)” was at 9:57, “Climate Change” 9:52, and “Biochemical Flows (Pollution/Con-tamination)” 9:50 were closer to midnight than the world’s average time, followed by “Population” 9:46, “Lifestyles” 9:46,“Society, Economy and Environment, Policies, Measures” 9:39, “Land-System Change (Land Use)” 9:39, “Food” 9:38, and “Water Resources” 9:33.
Weig
hte
d A
vera
ge T
ime o
n t
he C
lock
by C
atego
ry
Selection Percentage (%)
Fig 5-1. 2020 Distribution of theEnvironmental lssues
9:52, 30%
9:57, 14%
9:39, 7%
9:50, 8%
9:33, 9%
9:46, 8%
9:38, 4%
9:46, 7%
9:39, 12%
9:30
9:40
9:50
10:00
10:10
0 5 10 15 20 25 30 35
worldaverage
9:47
Climate Change
Biosphere Integrity(Biodiversity)
Biochemical flows(Pollution/Contamination)
Lifestyle(Consumption Habits) Population
Food
Water Resources
Land-System Change(Land Use) Society, Economy, Environment,
Policies and Measures
Fig. 5-1 2020 Distribution of the Environmental Issues (showing selection rate of
respondent's 3 most pressing issues as a percentage and the time on the Clock)

10
Weig
hte
d A
vera
ge T
ime o
n t
he C
lock
by C
atego
ry
Selection Percentage (%)
pressing issues as a percentage and the time on the clockFig 5-2. 2019 Distribution of the Environmental Issues (showing selection rate of respondent's 3 most
9:44, 30%
9:58, 14%
9:35, 7%
9:41, 9%
9:41, 10%
9:54, 8%
9:39, 4%
9:54, 7%
9:41, 11%
9:30
9:40
9:50
10:00
10:10
0 5 10 15 20 25 30 35
Climate Change
Land-SystemChange(Land Use)
Water Resources
worldaverage
9:46
Population
Food
Lifestyles
Biosphere Integrity(Biodiversity)
Biochemical flows(Pollution/Contamination)
Society, Economy, Environment,Policies and Measures
Fig. 5-2 2019 Distribution of the Environmental Issues (showing selection rate of
respondent's 3 most pressing issues as a percentage and the time on the Clock)
Weig
hte
d A
vera
ge T
ime o
n t
he C
lock
by C
atego
ry
Selection Percentage (%)
Fig 5-3. 2018 Distribution of the Environmental Issues (showing selection rate of respondent's 3 mostpressing issues as a percentage and the time on the clock
9:49, 28%9:51, 12%
9:23, 7%
9:49, 8%
9:45, 11%
10:02, 9%
10:12, 6%
9:47, 7%
9:35, 10%
9:10
9:20
9:30
9:40
9:50
10:00
10:10
10:20
10:30
0 5 10 15 20 25 30 35
Climate ChangeBiosphere Integrity(Biodiversity)
Land-SystemChange(Land Use)
WaterResources
worldlaverage
9:47
Population
Food
Lifestyles
Society, Economy and Environment
Biochemical flows(Pollution/Contamination)
Fig. 5-3 2018 Distribution of the Environmental Issues (showing selection rate of
respondent's 3 most pressing issues as a percentage and the time on the Clock)
11
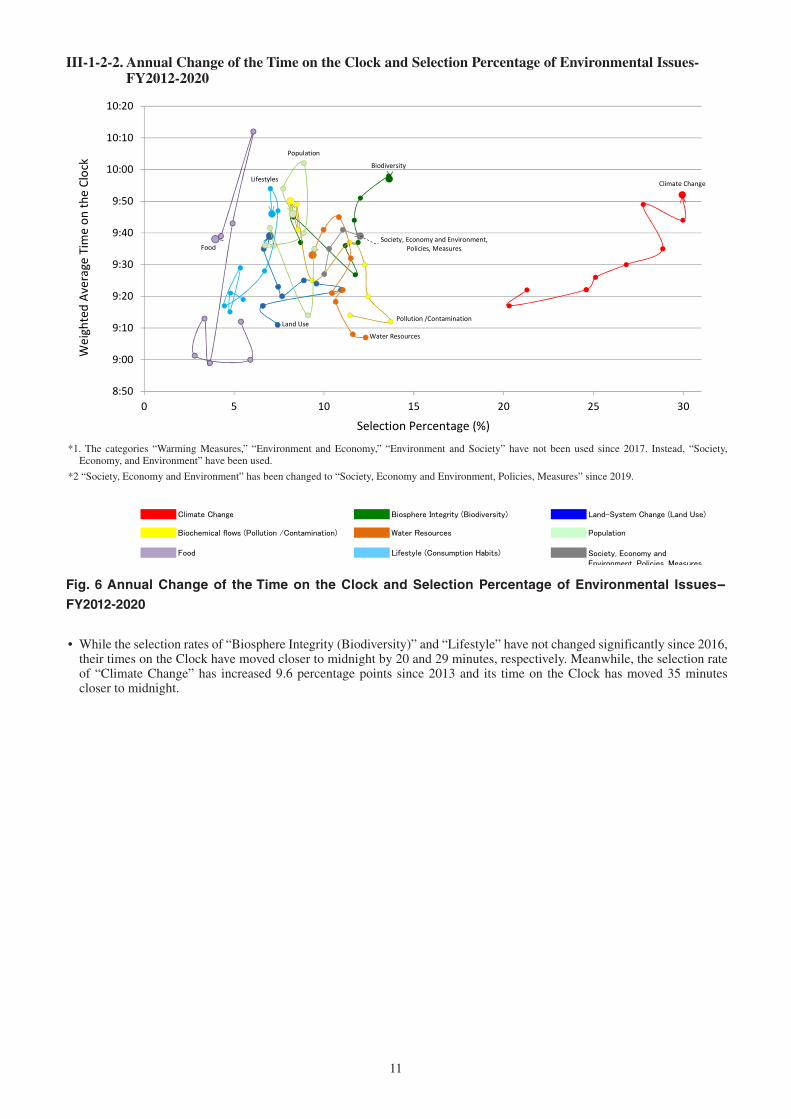
III-1-2-2. Annual Change of the Time on the Clock and Selection Percentage of Environmental Issues-FY2012-2020
*2. "Society, Eeconomy and Environment" has been changed to "Society, Economy and Environment, Policies, Measures" since 2019.
Climate Change Biosphere Integrity (Biodiversity) Land-System Change (Land Use)
Biochemical flows (Pollution /Contamination) Water Resources Population
Food Lifestyle (Consumption Habits) Society, Economy and Environment, Policies, Measures
*1. The categories "Warming Measures" "Environment and Economy," "Environment and Society" have not been used since 2017.Instead, "Society, Economy, and Environment" have been used.
Climate Change
Biodiversity
Land UsePollution /Contamination
Water Resources
Population
Food
Lifestyles
Society, Economy and Environment,Policies, Measures
8:50
9:00
9:10
9:20
9:30
9:40
9:50
10:00
10:10
10:20
0 5 10 15 20 25 30
Wei
ghte
d Av
erag
e Ti
me
on th
e Cl
ock
Fig 6
Selection Percentage (%)
Fig. 6 Annual Change of the Time on the Clock and Selection Percentage of Environmental Issues-
FY2012-2020
• While the selection rates of “Biosphere Integrity (Biodiversity)” and “Lifestyle” have not changed significantly since 2016,their times on the Clock have moved closer to midnight by 20 and 29 minutes, respectively. Meanwhile, the selection rateof “Climate Change” has increased 9.6 percentage points since 2013 and its time on the Clock has moved 35 minutescloser to midnight.
*1. The categories “Warming Measures,” “Environment and Economy,” “Environment and Society” have not been used since 2017. Instead, “Society, Economy, and Environment” have been used.
*2 “Society, Economy and Environment” has been changed to “Society, Economy and Environment, Policies, Measures” since 2019.

12
III-1-2-3. Selection Percentage for “Environmental Issues” by Region
• “Climate Change” was the issue that the respondents worldwide most often selected as the most pressing environmentalissues to be taken into account (30%), which is almost at the same level as last year, followed by “Biosphere Integrity (Bio-diversity)” (14%). This trend is shown in many geographical regions.
• Regional differences emerged, however, in the second most often selected category, as it was “Population” in India, “WaterResources” in China, “Biochemical Flows (Pollution/Contamination)” in Taiwan and Korea, and “Society, Economy andEnvironment, Policies, Measures” in Japan.
• While “Climate Change” has the highest selection rate worldwide, the respondents in the Middle East and South Americamost often selected “Water Resources” and “Land-System Change (Land Use),” respectively.
*Red columns ( ) represent the most frequently selected category in the region/country; blue columns ( ) represent the sec-ond most frequently selected category in the region/country.
Table 6. Selection Percentage for “Environmental Issues” by Region1. ClimateChange
2. BiosphereIntegrity(Biodiversity)
3. Land-SystemChange(Land Use)
4. BiochemicalFlows (Polution/Contamination)
5. WaterResources
6. Population 7. Food 8. Lifestyles 9. Society,Economy andEnvironment,Policies,Measures
World 30% 14% 7% 8% 9% 8% 4% 7% 12%Oceania 38% 27% 8% 2% 8% 8% 0% 3% 6%
Australia 37% 25% 9% 1% 7% 10% 0% 3% 8%Oceania (except Australia) 39% 31% 7% 2% 8% 5% 1% 3% 3%
North America 35% 18% 4% 4% 6% 10% 1% 8% 14%Canada 30% 18% 6% 6% 4% 7% 0% 12% 17%
USA 37% 17% 4% 4% 6% 11% 1% 7% 14%Central America & The Caribbean 28% 19% 12% 4% 12% 4% 2% 5% 15%South America 17% 18% 22% 4% 10% 5% 2% 7% 16%Western Europe 31% 23% 8% 4% 4% 7% 1% 9% 11%
Western Europe (except UK) 30% 23% 9% 5% 4% 7% 1% 9% 11%UK 34% 23% 5% 1% 4% 7% 3% 9% 13%
Africa 30% 14% 13% 3% 11% 11% 4% 2% 12%Middle East 23% 15% 15% 6% 24% 7% 1% 1% 9%Eastern Europe &former Soviet Unions 20% 17% 10% 12% 10% 5% 1% 12% 13%
Asia 31% 9% 4% 11% 10% 9% 6% 7% 12%Japan 39% 11% 4% 7% 5% 6% 5% 7% 14%India 25% 10% 10% 5% 16% 16% 3% 5% 11%China 22% 7% 3% 13% 15% 12% 8% 8% 10%
Taiwan 37% 5% 4% 25% 10% 5% 2% 4% 9%Korea 43% 10% 4% 15% 4% 2% 2% 14% 5%
Asia (excl. the above 5 nations) 28% 17% 10% 4% 11% 9% 2% 2% 16%*Red columns (■) represent the most frequently selected category in the region/countryblue columns (■) represent the second most frequently selectedcategory in the region/country.
Table 6. Selection Percentage for “Environmental Issues” by Region
13
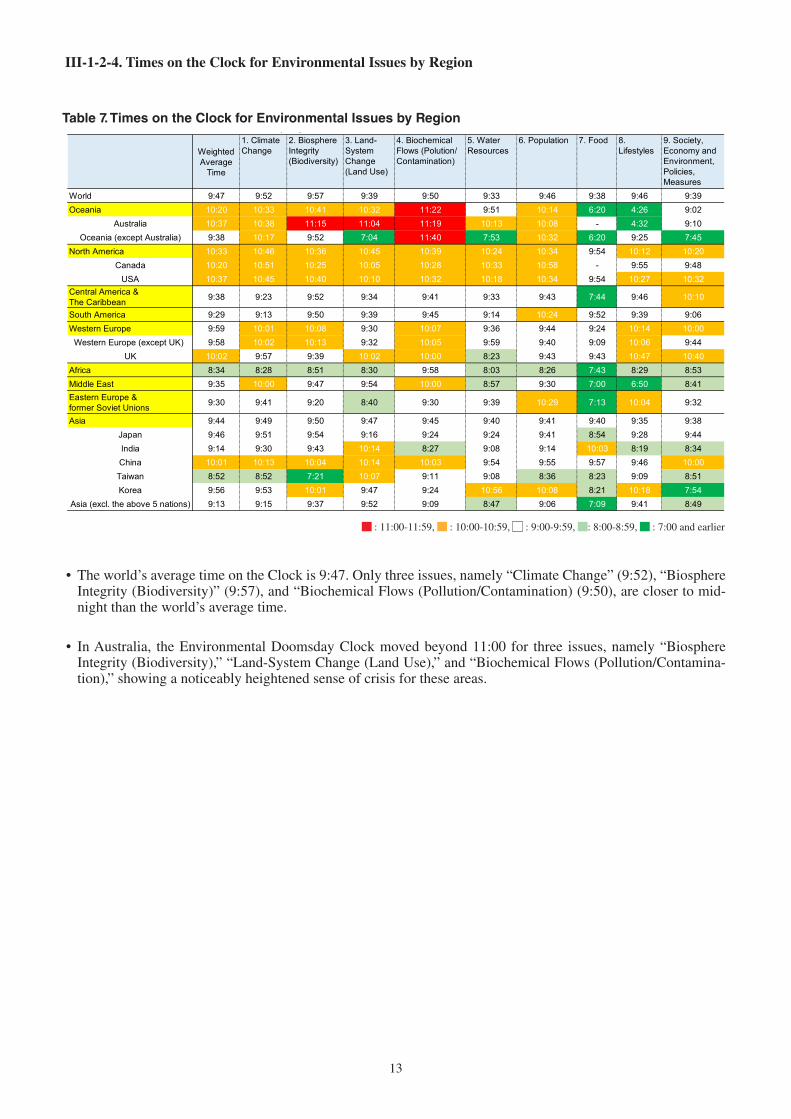
III-1-2-4. Times on the Clock for Environmental Issues by Region
• The world’s average time on the Clock is 9:47. Only three issues, namely “Climate Change” (9:52), “BiosphereIntegrity (Biodiversity)” (9:57), and “Biochemical Flows (Pollution/Contamination) (9:50), are closer to mid-night than the world’s average time.
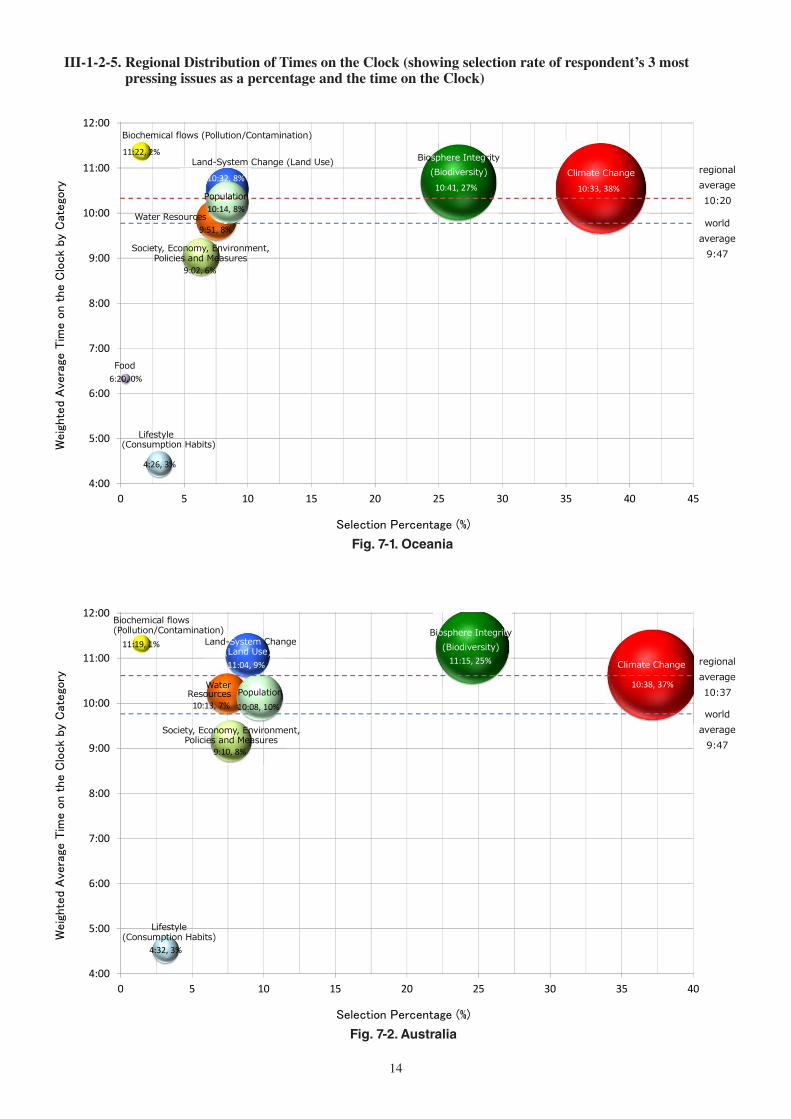
• In Australia, the Environmental Doomsday Clock moved beyond 11:00 for three issues, namely “BiosphereIntegrity (Biodiversity),” “Land-System Change (Land Use),” and “Biochemical Flows (Pollution/Contamina-tion),” showing a noticeably heightened sense of crisis for these areas.
: 11:00-11:59, : 10:00-10:59, : 9:00-9:59, : 8:00-8:59, : 7:00 and earlier
Table 7. Times on the Clock for Environmental Issues by Region
WeightedAverage
Time
1. ClimateChange
2. BiosphereIntegrity(Biodiversity)
3. Land-SystemChange(Land Use)
4. BiochemicalFlows (Polution/Contamination)
5. WaterResources
6. Population 7. Food 8.Lifestyles
9. Society,Economy andEnvironment,Policies,Measures
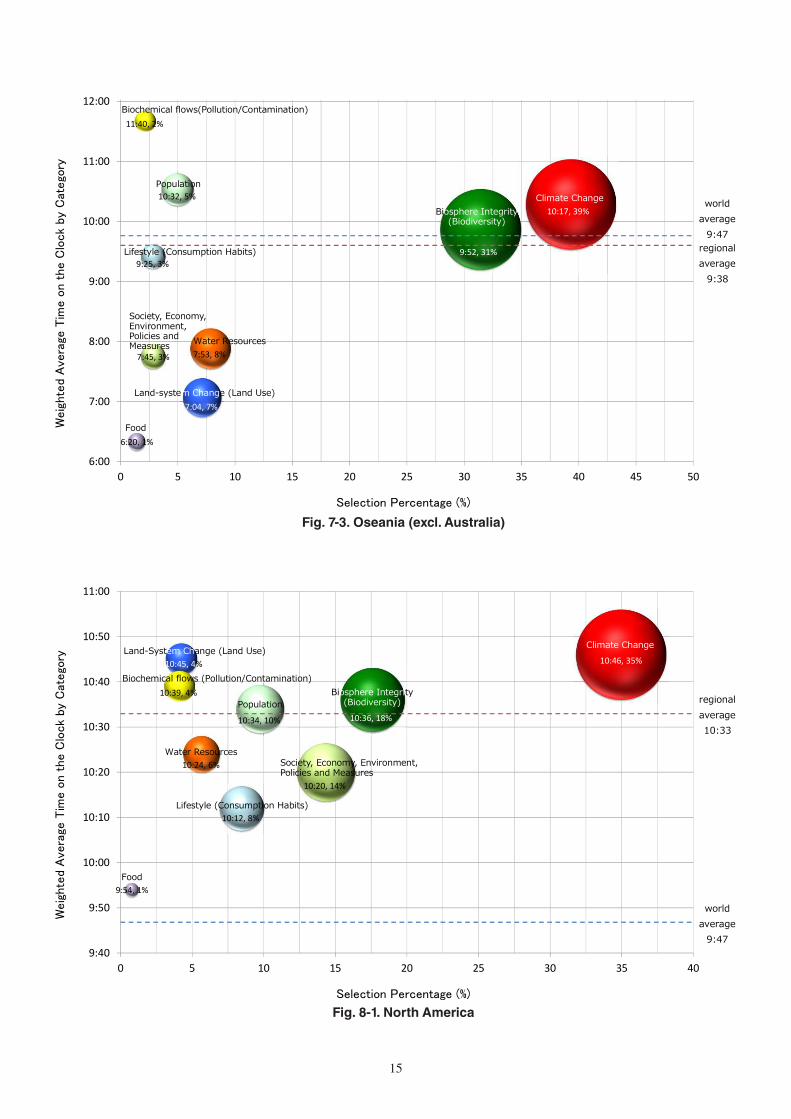
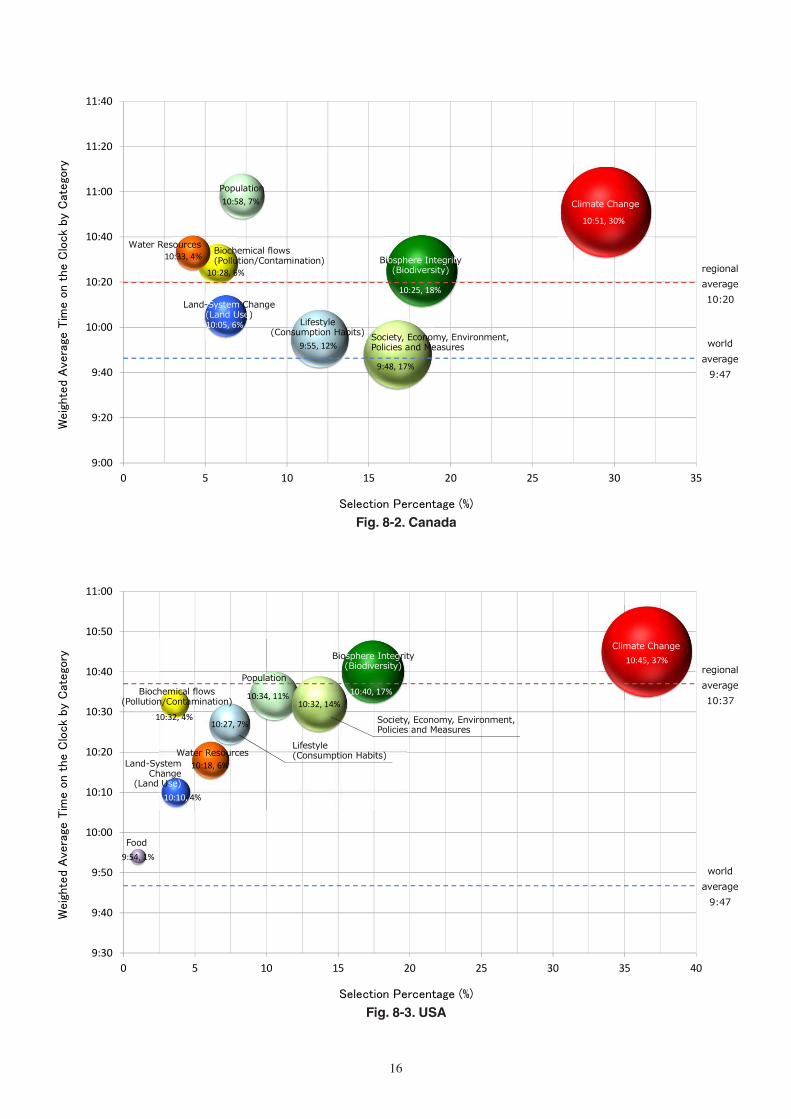
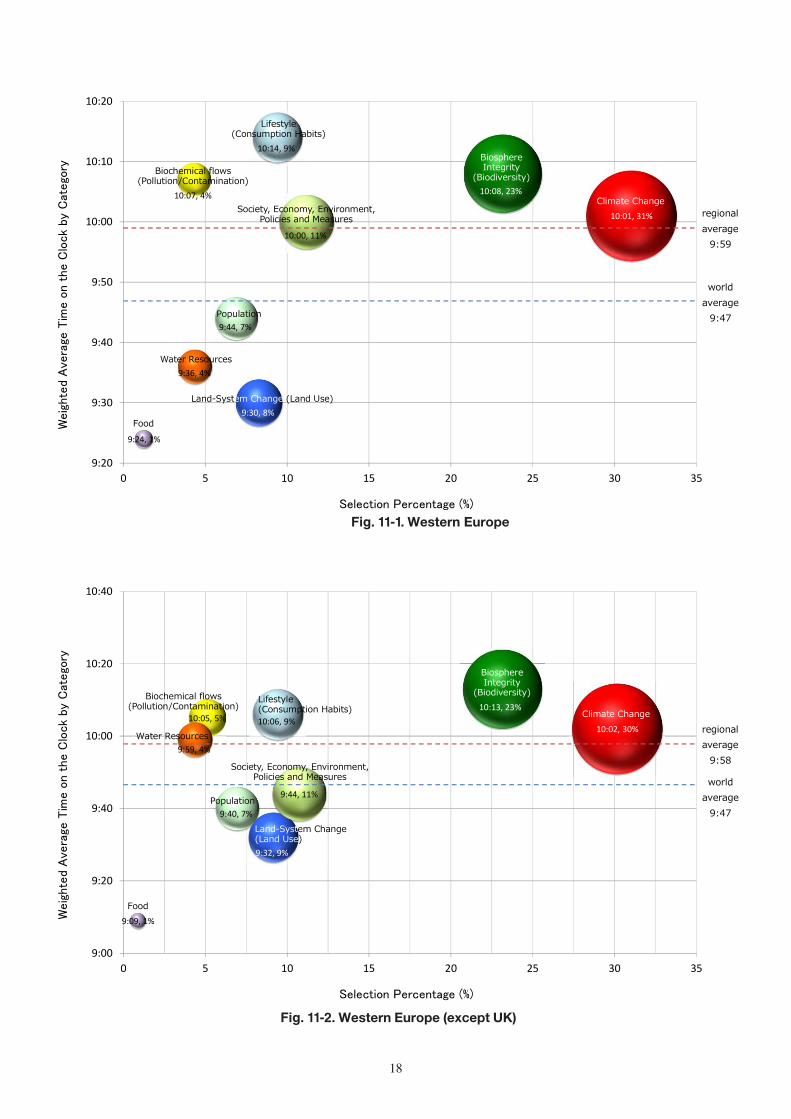
World 9:47 9:52 9:57 9:39 9:50 9:33 9:46 9:38 9:46 9:39Oceania 10:20 10:33 10:41 10:32 11:22 9:51 10:14 6:20 4:26 9:02
Australia 10:37 10:38 11:15 11:04 11:19 10:13 10:08 - 4:32 9:10Oceania (except Australia) 9:38 10:17 9:52 7:04 11:40 7:53 10:32 6:20 9:25 7:45
North America 10:33 10:46 10:36 10:45 10:39 10:24 10:34 9:54 10:12 10:20Canada 10:20 10:51 10:25 10:05 10:28 10:33 10:58 - 9:55 9:48
USA 10:37 10:45 10:40 10:10 10:32 10:18 10:34 9:54 10:27 10:32Central America &The Caribbean 9:38 9:23 9:52 9:34 9:41 9:33 9:43 7:44 9:46 10:10
South America 9:29 9:13 9:50 9:39 9:45 9:14 10:24 9:52 9:39 9:06Western Europe 9:59 10:01 10:08 9:30 10:07 9:36 9:44 9:24 10:14 10:00
Western Europe (except UK) 9:58 10:02 10:13 9:32 10:05 9:59 9:40 9:09 10:06 9:44UK 10:02 9:57 9:39 10:02 10:00 8:23 9:43 9:43 10:47 10:40
Africa 8:34 8:28 8:51 8:30 9:58 8:03 8:26 7:43 8:29 8:53Middle East 9:35 10:00 9:47 9:54 10:00 8:57 9:30 7:00 6:50 8:41Eastern Europe &former Soviet Unions 9:30 9:41 9:20 8:40 9:30 9:39 10:29 7:13 10:04 9:32
Asia 9:44 9:49 9:50 9:47 9:45 9:40 9:41 9:40 9:35 9:38Japan 9:46 9:51 9:54 9:16 9:24 9:24 9:41 8:54 9:28 9:44India 9:14 9:30 9:43 10:14 8:27 9:08 9:14 10:03 8:19 8:34China 10:01 10:13 10:04 10:14 10:03 9:54 9:55 9:57 9:46 10:00
Taiwan 8:52 8:52 7:21 10:07 9:11 9:08 8:36 8:23 9:09 8:51Korea 9:56 9:53 10:01 9:47 9:24 10:56 10:08 8:21 10:18 7:54
Asia (excl. the above 5 nations) 9:13 9:15 9:37 9:52 9:09 8:47 9:06 7:09 9:41 8:49■: 11:00-11:59, ■: 10:00-10:59, □: 9:00-9:59, ■: 8:00-8:59, ■: 7:00 and earlier
Table 7. Times on the Clock for Environmental Issues by Region
14
III-1-2-5. Regional Distribution of Times on the Clock (showing selection rate of respondent’s 3 mostpressing issues as a percentage and the time on the Clock)
Weig
hte
d A
vera
ge T
ime o
n t
he C
lock
by C
atego
ry
Selection Percentage (%)
Fig. 7-1. Oceania
10:33, 38%10:41, 27%10:32, 8%
11:22, 2%
9:51, 8%
10:14, 8%
6:20, 0%
4:26, 3%
9:02, 6%
4:00
5:00
6:00
7:00
8:00
9:00
10:00
11:00
12:00
0 5 10 15 20 25 30 35 40 45
Climate ChangeBiosphere Integrity
(Biodiversity)
worldaverage
9:47
regionalaverage10:20Population
Land-System Change (Land Use)
Society, Economy, Environment,Policies and Measures
Biochemical flows (Pollution/Contamination)
Food
Water Resources
Lifestyle(Consumption Habits)
Fig. 7-1. Oceania
Weig
hte
d A
vera
ge T
ime o
n t
he C
lock
by C
atego
ry
Selection Percentage (%)
Fig. 7-2. Australia
10:38, 37%
11:15, 25%11:04, 9%
11:19, 1%
10:13, 7% 10:08, 10%
4:32, 3%
9:10, 8%
4:00
5:00
6:00
7:00
8:00
9:00
10:00
11:00
12:00
0 5 10 15 20 25 30 35 40
Climate Change
Biosphere Integrity(Biodiversity)
worldaverage
9:47
regionalaverage10:37Population
Society, Economy, Environment,Policies and Measures
Land-System Change(Land Use)
Biochemical flows(Pollution/Contamination)
WaterResources
Lifestyle(Consumption Habits)
Fig. 7-2. Australia
15
Selection Percentage (%)
Weig
hte
d A
vera
ge T
ime o
n t
he C
lock
by C
atego
ry
Fig. 8-1. North America
10:46, 35%
10:36, 18%
10:45, 4%
10:39, 4%
10:24, 6%
10:34, 10%
9:54, 1%
10:12, 8%
10:20, 14%
9:40
9:50
10:00
10:10
10:20
10:30
10:40
10:50
11:00
0 5 10 15 20 25 30 35 40
Climate ChangeLand-System Change (Land Use)
Biochemical flows (Pollution/Contamination)
Water Resources
worldaverage
9:47
regionalaverage10:33
Population
Food
Biosphere Integrity(Biodiversity)
Lifestyle (Consumption Habits)
Society, Economy, Environment,Policies and Measures
Fig. 8-1. North America
Weig
hte
d A
vera
ge T
ime o
n t
he C
lock
by C
atego
ry
Selection Percentage (%)
Fig. 7-3. Oceania (excl Australia)
10:17, 39%
9:52, 31%
7:04, 7%
11:40, 2%
7:53, 8%
10:32, 5%
6:20, 1%
9:25, 3%
7:45, 3%
6:00
7:00
8:00
9:00
10:00
11:00
12:00
0 5 10 15 20 25 30 35 40 45 50
Climate Change worldaverage
9:47regionalaverage
9:38
Biosphere Integrity(Biodiversity)
Biochemical flows(Pollution/Contamination)
Water Resources
Food
Population
Land-system Change (Land Use)
Lifestyle (Consumption Habits)
Society, Economy,Environment,Policies andMeasures
Fig. 7-3. Oseania (excl. Australia)
16
Weig
hte
d A
vera
ge T
ime o
n t
he C
lock
by C
atego
ry
Selection Percentage (%)
Fig. 8-3. USA
10:45, 37%
10:40, 17%
10:10, 4%
10:32, 4%
10:18, 6%
10:34, 11%
9:54, 1%
10:27, 7%
10:32, 14%
9:30
9:40
9:50
10:00
10:10
10:20
10:30
10:40
10:50
11:00
0 5 10 15 20 25 30 35 40
Climate Change
Water Resources
worldaverage
9:47
regionalaverage10:37
Population
Society, Economy, Environment,Policies and Measures
Biosphere Integrity(Biodiversity)
Biochemical flows(Pollution/Contamination)
Food
Land-SystemChange
(Land Use)
Lifestyle(Consumption Habits)
Fig. 8-3. USA
Weig
hte
d A
vera
ge T
ime o
n t
he C
lock
by C
atego
ry
Selection Percentage (%)
Fig. 8-2. Canada
10:51, 30%
10:25, 18%
10:05, 6%
10:28, 6%
10:33, 4%
10:58, 7%
9:55, 12%
9:48, 17%
9:00
9:20
9:40
10:00
10:20
10:40
11:00
11:20
11:40
0 5 10 15 20 25 30 35
Climate Change
worldaverage
9:47
regionalaverage10:20
Population
Biosphere Integrity(Biodiversity)
Land-System Change(Land Use)
Water Resources Biochemical flows(Pollution/Contamination)
Lifestyle(Consumption Habits) Society, Economy, Environment,
Policies and Measures
Fig. 8-2. Canada

17
Weig
hte
d A
vera
ge T
ime o
n t
he C
lock
by C
atego
ry
Selection Percentage (%)
Fig. 9. Central America, The Caribbean
9:23, 28%
9:52, 19%
9:34, 12%
9:41, 4%
9:33, 12%9:43, 4%
7:44, 2%
9:46, 5%
10:10, 15%
7:30
7:50
8:10
8:30
8:50
9:10
9:30
9:50
10:10
10:30
0 5 10 15 20 25 30
Climate Change
worldaverage
9:47regionalaverage
9:38
Biosphere Integrity(Biodiversity)
Biochemical flows(Pollution/Contamination)
Water Resources
Society, Economy, Environment,Policies and Measures
Population
Food
Land-System Change(Land Use)Lifestyle
(Consumption Habits)
Fig. 9. Central America & The Caribbean
Selection Percentage (%)
Weig
hte
d A
vera
ge T
ime o
n t
he C
lock
by C
atego
ry
Fig. 10. South America
9:13, 17%
9:50, 18%
9:39, 22%
9:45, 4%
9:14, 10%
10:24, 5%
9:52, 2%
9:39, 7%
9:06, 16%
8:50
9:00
9:10
9:20
9:30
9:40
9:50
10:00
10:10
10:20
10:30
10:40
0 5 10 15 20 25
Climate Change
worldaverage
9:47
regionalaverage
9:29
Population
Land-SystemChange
(Land Use)
BiosphereIntegrity
(Biodiversity)
WaterResources
Food
Biochemical flows(Pollution/Contamination)
Society, Economy,Environment,
Lifestyle(Consumption Habits)
Fig. 10. South America
18
Selection Percentage (%)
Weig
hte
d A
vera
ge T
ime o
n t
he C
lock
by C
atego
ry
Fig. 11-2. EU
10:02, 30%
10:13, 23%
9:32, 9%
10:05, 5%
9:59, 4%
9:40, 7%
9:09, 1%
10:06, 9%
9:44, 11%
9:00
9:20
9:40
10:00
10:20
10:40
0 5 10 15 20 25 30 35
Climate Change
worldaverage
9:47
regionalaverage
9:58
Population
Food
Water Resources
BiosphereIntegrity
(Biodiversity)
Land-System Change(Land Use)
Biochemical flows(Pollution/Contamination)
Lifestyle(Consumption Habits)
Society, Economy, Environment,Policies and Measures
Fig. 11-2. Western Europe (except UK)
Selection Percentage (%)
Weig
hte
d A
vera
ge T
ime o
n t
he C
lock
by C
atego
ry
Fig. 11-1. EU &UK
10:01, 31%
10:08, 23%
9:30, 8%
10:07, 4%
9:36, 4%
9:44, 7%
9:24, 1%
10:14, 9%
10:00, 11%
9:20
9:30
9:40
9:50
10:00
10:10
10:20
0 5 10 15 20 25 30 35
Climate Change
Land-System Change (Land Use)
worldaverage
9:47
regionalaverage
9:59
Population
Food
BiosphereIntegrity
(Biodiversity)Biochemical flows(Pollution/Contamination)
Society, Economy, Environment,Policies and Measures
Water Resources
Lifestyle(Consumption Habits)
Fig. 11-1. Western Europe
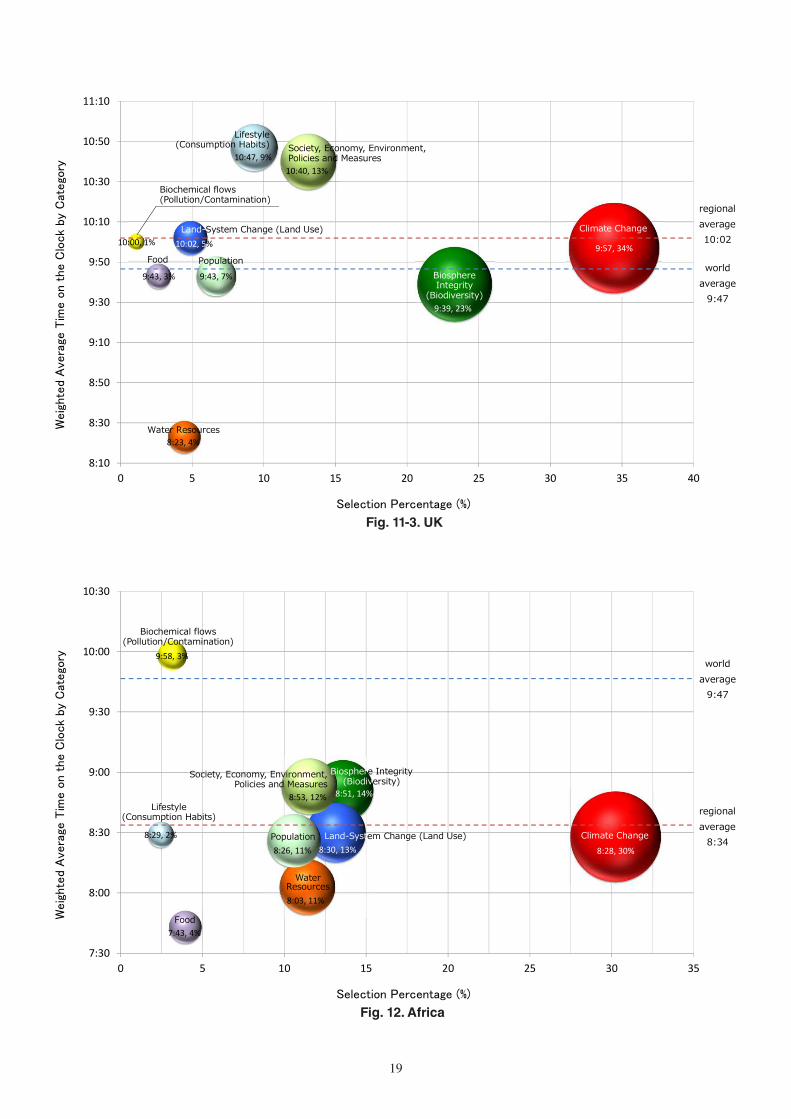
19
Weig
hte
d A
vera
ge T
ime o
n t
he C
lock
by C
atego
ry
Selection Percentage (%)
Fig. 11-3. UK
9:57, 34%
9:39, 23%
10:02, 5%10:00, 1%
8:23, 4%
9:43, 7%9:43, 3%
10:47, 9%10:40, 13%
8:10
8:30
8:50
9:10
9:30
9:50
10:10
10:30
10:50
11:10
0 5 10 15 20 25 30 35 40
Climate ChangeLand-System Change (Land Use)
worldaverage
9:47
regionalaverage10:02
PopulationBiosphereIntegrity
(Biodiversity)
Society, Economy, Environment,Policies and Measures
Biochemical flows(Pollution/Contamination)
Food
Water Resources
Lifestyle(Consumption Habits)
Fig. 11-3. UK
Selection Percentage (%)
Weig
hte
d A
vera
ge T
ime o
n t
he C
lock
by C
atego
ry
Fig. 12. Africa
8:28, 30%
8:51, 14%
8:30, 13%
9:58, 3%
8:03, 11%
8:26, 11%
7:43, 4%
8:29, 2%
8:53, 12%
7:30
8:00
8:30
9:00
9:30
10:00
10:30
0 5 10 15 20 25 30 35
Climate Change
worldaverage
9:47
regionalaverage
8:34Population
Food
Biosphere Integrity(Biodiversity)
WaterResources
Society, Economy, Environment,Policies and Measures
Biochemical flows(Pollution/Contamination)
Land-System Change (Land Use)
Lifestyle(Consumption Habits)
Fig. 12. Africa
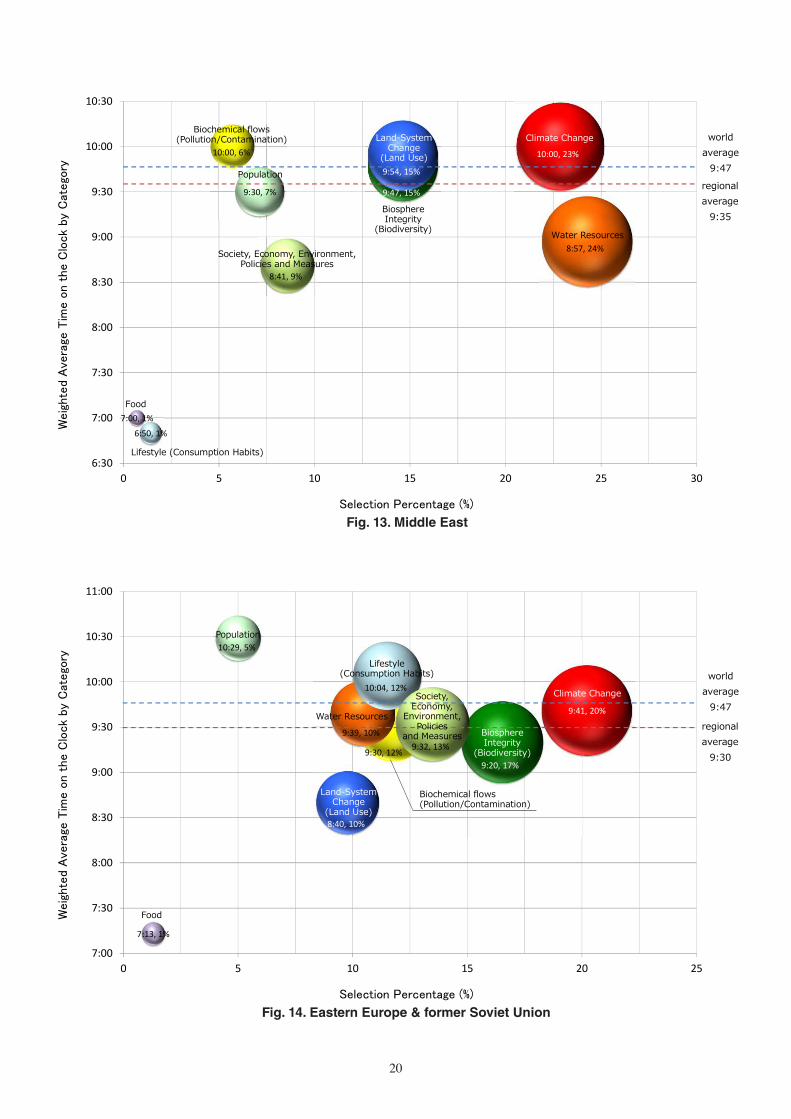
20
Selection Percentage (%)
Weig
hte
d A
vera
ge T
ime o
n t
he C
lock
by C
atego
ry
Fig. 13. Middle East
10:00, 23%
9:47, 15%
9:54, 15%
10:00, 6%
8:57, 24%
9:30, 7%
7:00, 1%
6:50, 1%
8:41, 9%
6:30
7:00
7:30
8:00
8:30
9:00
9:30
10:00
10:30
0 5 10 15 20 25 30
Climate Change worldaverage
9:47
regionalaverage
9:35
Water Resources
BiosphereIntegrity
(Biodiversity)
Land-SystemChange
(Land Use)
Biochemical flows(Pollution/Contamination)
Population
Food
Lifestyle (Consumption Habits)
Society, Economy, Environment,Policies and Measures
Fig. 13. Middle East
Selection Percentage (%)
Weig
hte
d A
vera
ge T
ime o
n t
he C
lock
by C
atego
ry
Fig. 14. Eastern Europe & former Soviet Union
9:41, 20%
9:20, 17%
8:40, 10%
9:30, 12%
9:39, 10%
10:29, 5%
7:13, 1%
10:04, 12%
9:32, 13%
7:00
7:30
8:00
8:30
9:00
9:30
10:00
10:30
11:00
0 5 10 15 20 25
Climate Change
worldaverage
9:47
regionalaverage
9:30
Land-SystemChange
(Land Use)
BiosphereIntegrity
(Biodiversity)
Water Resources
Society,Economy,
Environment,Policies
and Measures
Biochemical flows(Pollution/Contamination)
Population
Food
Lifestyle(Consumption Habits)
Fig. 14. Eastern Europe & former Soviet Union

21
Selection Percentage (%)
Weig
hte
d A
vera
ge T
ime o
n t
he C
lock
by C
atego
ry
Fig. 15-1. Asia
9:49, 31%9:50, 9%
9:47, 4%
9:45, 11%
9:40, 10%9:41, 9%9:40, 6%
9:35, 7%
9:38, 12%
9:30
9:35
9:40
9:45
9:50
9:55
0 5 10 15 20 25 30 35 40
Climate Change
worldaverage
9:47regionalaverage
9:44
PopulationFood
Water Resources
Biochemical flows(Pollution/Contamination)
Biosphere Integrity(Biodiversity)
Land-System Change(Land Use)
Lifestyle(Consumption Habits)
Society, Economy, Environment,Policies and Measures
Fig. 15-1. Asia
Selection Percentage (%)
Weig
hte
d A
vera
ge T
ime o
n t
he C
lock
by C
atego
ry
Fig. 15-2. Japan
9:51, 39%9:54, 11%
9:16, 4%
9:24, 7%9:24, 5%
9:41, 6%
8:54, 5%
9:28, 7%
9:44, 14%
8:50
9:00
9:10
9:20
9:30
9:40
9:50
10:00
0 5 10 15 20 25 30 35 40 45
Climate Change worldaverage
9:47regionalaverage
9:46Population
Food
Biosphere Integrity (Biodiversity)
Society, Economy, Environment, Policies and Measures
Biochemical flows(Pollution/Contamination)
WaterResources
Land-system Change (Land Use)
Lifestyle (Consumption Habits)
Fig. 15-2. Japan
22
Weig
hte
d A
vera
ge T
ime o
n t
he C
lock
by C
atego
ry
Selection Percentage (%)
Fig. 15-3. India
9:30, 25%
9:43, 10%
10:14, 10%
8:27, 5%
9:08, 16%
9:14, 16%
10:03, 3%
8:19, 5%
8:34, 11%
8:00
8:30
9:00
9:30
10:00
10:30
0 5 10 15 20 25 30
Climate Change
worldaverage
9:47
regionalaverage
9:14
Population
Land-SystemChange
(Land Use)
WaterResources
Biochemical flows(Pollution/Contamination)
BiosphereIntegrity
(Biodiversity)
Food
Lifestyle (Consumption Habits)
Society, Economy,Environment,
Policies and Measures
Fig. 15-3. India
Selection Percentage (%)
Weig
hte
d A
vera
ge T
ime o
n t
he C
lock
by C
atego
ry
Fig. 15-4. China
10:13, 22%
10:04, 7%
10:14, 3%
10:03, 13%
9:54, 15%9:55, 12%
9:57, 8%
9:46, 8%
10:00, 10%
9:40
9:45
9:50
9:55
10:00
10:05
10:10
10:15
10:20
0 5 10 15 20 25
Climate Change
Population
worldaverage
9:47
regionalaverage10:01
Food
Land-System Change (Land Use)
Biochemical flows(Pollution/Contamination)
WaterResources
Lifestyle (Consumption Habits)
Society, Economy,Environment,Policies andMeasures
Biosphere Integrity(Biodiversity)
Fig. 15-4. China
23
Weig
hte
d A
vera
ge T
ime o
n t
he C
lock
by C
atego
ry
Selection Percentage (%)
Fig. 15-6. Korea
9:53, 43%10:01, 10%
9:47, 4%
9:24, 15%
10:56, 4%
10:08, 2%
8:21, 2%
10:18, 14%
7:54, 5%
7:30
8:00
8:30
9:00
9:30
10:00
10:30
11:00
11:30
0 5 10 15 20 25 30 35 40 45 50
Population
worldaverage
9:47
regionalaverage
9:56
BiosphereIntegrity
(Biodiversity)
Climate Change
Biochemical flows(Pollution/Contamination)
Land-System Change(Land Use)
Water Resources
Food
Society, Economy, Environment, Policies and Measures
Lifestyle(Consumption Habits)
Fig. 15-6. Korea
Weig
hte
d A
vera
ge T
ime o
n t
he C
lock
by C
atego
ry
Selection Percentage (%)
Fig. 15-5. Taiwan
8:52, 37%
7:21, 5%
10:07, 4%
9:11, 25%9:08, 10%
8:36, 5%
8:23, 2%
9:09, 4%
8:51, 9%
7:00
7:20
7:40
8:00
8:20
8:40
9:00
9:20
9:40
10:00
10:20
0 5 10 15 20 25 30 35 40 45
Climate Change
worldaverage
9:47
regionalaverage
8:52
Food
Biochemical flows(Pollution/Contamination)
WaterResources
PopulationSociety, Economy, Environment,Policies and Measures
Land-System Change (Land Use)
Biosphere Integrity(Biodiversity)
Lifestyle(Consumption Habits)
Fig. 15-5. Taiwan
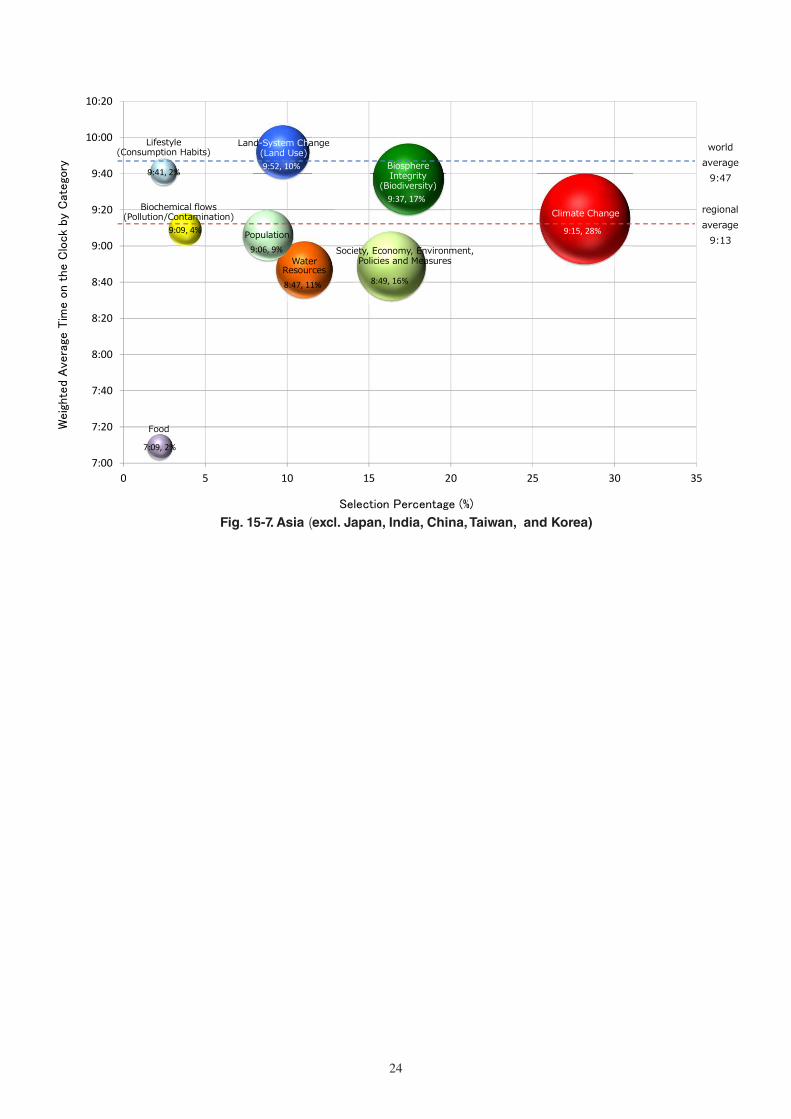
24
Selection Percentage (%)
Weig
hte
d A
vera
ge T
ime o
n t
he C
lock
by C
atego
ry
Fig. 15-7. Asian Region (excl Japan, India, China, Taiwan, and Korea)
9:15, 28%
9:37, 17%
9:52, 10%
9:09, 4%
8:47, 11%
9:06, 9%
7:09, 2%
9:41, 2%
8:49, 16%
7:00
7:20
7:40
8:00
8:20
8:40
9:00
9:20
9:40
10:00
10:20
0 5 10 15 20 25 30 35
Climate Change
worldaverage
9:47
regionalaverage
9:13Population
Food
BiosphereIntegrity
(Biodiversity)
Land-System Change(Land Use)
WaterResources
Biochemical flows(Pollution/Contamination)
Society, Economy, Environment,Policies and Measures
Lifestyle(Consumption Habits)
Fig. 15-7. Asia (excl. Japan, India, China, Taiwan, and Korea)
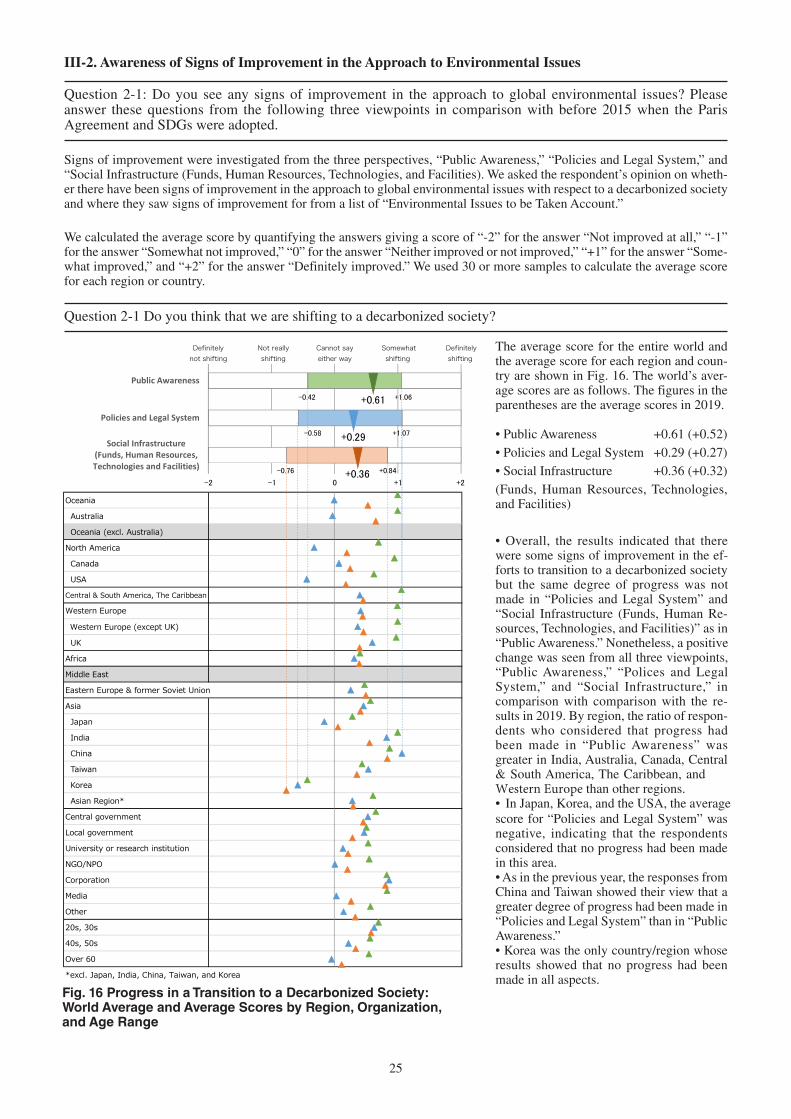
25
Signs of improvement were investigated from the three perspectives, “Public Awareness,” “Policies and Legal System,” and “Social Infrastructure (Funds, Human Resources, Technologies, and Facilities). We asked the respondent’s opinion on wheth-er there have been signs of improvement in the approach to global environmental issues with respect to a decarbonized society and where they saw signs of improvement for from a list of “Environmental Issues to be Taken Account.”
We calculated the average score by quantifying the answers giving a score of “-2” for the answer “Not improved at all,” “-1” for the answer “Somewhat not improved,” “0” for the answer “Neither improved or not improved,” “+1” for the answer “Some-what improved,” and “+2” for the answer “Definitely improved.” We used 30 or more samples to calculate the average score for each region or country.
Question 2-1 Do you think that we are shifting to a decarbonized society?
The average score for the entire world and the average score for each region and coun-try are shown in Fig. 16. The world’s aver-age scores are as follows. The figures in the parentheses are the average scores in 2019.
• Public Awareness +0.61 (+0.52)• Policies and Legal System +0.29 (+0.27)• Social Infrastructure +0.36 (+0.32)(Funds, Human Resources, Technologies, and Facilities)
• Overall, the results indicated that therewere some signs of improvement in the ef-forts to transition to a decarbonized societybut the same degree of progress was notmade in “Policies and Legal System” and“Social Infrastructure (Funds, Human Re-sources, Technologies, and Facilities)” as in“Public Awareness.” Nonetheless, a positivechange was seen from all three viewpoints,“Public Awareness,” “Polices and LegalSystem,” and “Social Infrastructure,” incomparison with comparison with the re-sults in 2019. By region, the ratio of respon-dents who considered that progress hadbeen made in “Public Awareness” wasgreater in India, Australia, Canada, Central& South America, The Caribbean, andWestern Europe than other regions.• In Japan, Korea, and the USA, the averagescore for “Policies and Legal System” was negative, indicating that the respondents considered that no progress had been made in this area.• As in the previous year, the responses fromChina and Taiwan showed their view that a greater degree of progress had been made in “Policies and Legal System” than in “Public Awareness.” • Korea was the only country/region whoseresults showed that no progress had been made in all aspects.
Oceania
Australia
Oceania (excl. Australia)
North America
Canada
USA
Central & South America, The Caribbean
Western Europe
Western Europe (except UK)
UK
Africa
Middle East
Eastern Europe & former Soviet Union
Asia
Japan
India
China
Taiwan
Korea
Asian Region*
Central government
Local government
University or research institution
NGO/NPO
Corporation
Media
Other
20s, 30s
40s, 50s
Over 60
*excl. Japan, India, China, Taiwan, and Korea
Public Awareness
Policies and Legal System
Social Infrastructure(Funds, Human Resources,Technologies and Facilities)
Definitelynot shifting
No reallyshifting
Cannot sayeither way
Somewhatshifting
Definitelyshifting
-2 -1 0 +2+1
+1.06-0.42
+1.07-0.58
+0.84-0.76
+0.61
+0.29
+0.36
Fig.16 Progress in a Transition to a Decarbonized Society:Wold Average and Average Scores by Region, Organization,and Age Range
III-2. Awareness of Signs of Improvement in the Approach to Environmental Issues
Question 2-1: Do you see any signs of improvement in the approach to global environmental issues? Please answer these questions from the following three viewpoints in comparison with before 2015 when the Paris Agreement and SDGs were adopted.
Fig. 16 Progress in a Transition to a Decarbonized Society: World Average and Average Scores by Region, Organization, and Age Range
Definitely not shifting
Not reallyshifting
Cannot sayeither way
Somewhatshifting
Definitelyshifting
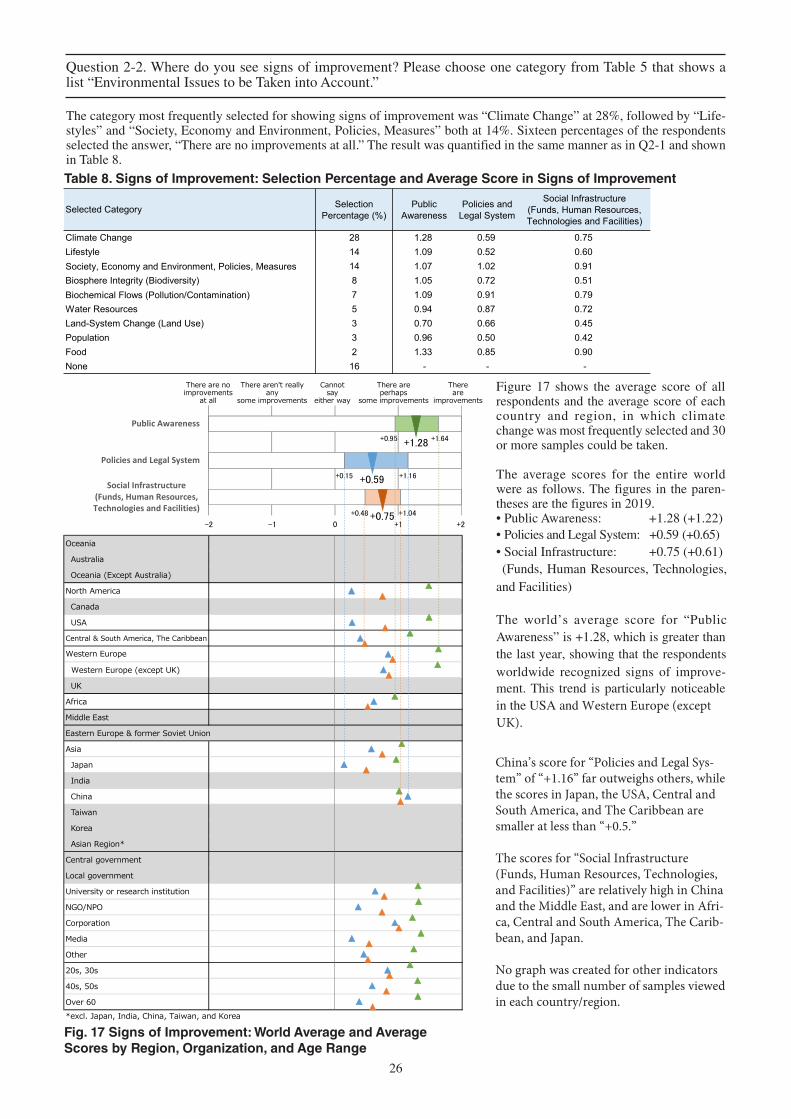
26
Figure 17 shows the average score of all respondents and the average score of each country and region, in which climate change was most frequently selected and 30 or more samples could be taken.
The average scores for the entire world were as follows. The figures in the paren-theses are the figures in 2019.
+1.28 (+1.22)• Public Awareness:• Policies and Legal System: +0.59 (+0.65)• Social Infrastructure: +0.75 (+0.61)(Funds, Human Resources, Technologies,
and Facilities)
The world’s average score for “Public Awareness” is +1.28, which is greater than the last year, showing that the respondents worldwide recognized signs of improve-ment. This trend is particularly noticeable in the USA and Western Europe (except UK).
Question 2-2. Where do you see signs of improvement? Please choose one category from Table 5 that shows a list “Environmental Issues to be Taken into Account.”
The category most frequently selected for showing signs of improvement was “Climate Change” at 28%, followed by “Life-styles” and “Society, Economy and Environment, Policies, Measures” both at 14%. Sixteen percentages of the respondents selected the answer, “There are no improvements at all.” The result was quantified in the same manner as in Q2-1 and shown in Table 8.
Table 8. Signs of Improvement: Selection Percentage and Average Score in Signs of Improvement
Oceania
Australia
Oceania (Except Australia)
North America
Canada
USA
Central & South America, The Caribbean
Western Europe
Western Europe (except UK)
UK
Africa
Middle East
Eastern Europe & former Soviet Union
Asia
Japan
India
China
Taiwan
Korea
Asian Region*
Central government
Local government
University or research institution
NGO/NPO
Corporation
Media
Other
20s, 30s
40s, 50s
Over 60*excl. Japan, India, China, Taiwan, and Korea
Public Awareness
Policies and Legal System
Social Infrastructure(Funds, Human Resources,Technologies and Facilities)
-2 -1 0 +2+1
+1.64+0.95
+1.16+0.15
+1.04+0.48
There are noimprovements
at all
There aren't reallyany
some improvements
Cannotsay
either way
Thereare
improvements
There areperhaps
some improvements
+1.28
+0.59
+0.75
Fig 17. Sings of Inprovement: World Average and Average Scores byRegion, Organization, and Age Range
Table 8. Signs of Improvement: Selection Percentage and Average Score in Signs of Improvement
Selected Category SelectionPercentage (%)
PublicAwareness
Policies andLegal System
Social Infrastructure(Funds, Human Resources,Technologies and Facilities)
Climate Change 28 1.28 0.59 0.75Lifestyle 14 1.09 0.52 0.60Society, Economy and Environment, Policies, Measures 14 1.07 1.02 0.91Biosphere Integrity (Biodiversity) 8 1.05 0.72 0.51Biochemical Flows (Pollution/Contamination) 7 1.09 0.91 0.79Water Resources 5 0.94 0.87 0.72Land-System Change (Land Use) 3 0.70 0.66 0.45Population 3 0.96 0.50 0.42Food 2 1.33 0.85 0.90None 16 - - -
Fig. 17 Signs of Improvement: World Average and Average Scores by Region, Organization, and Age Range
China’s score for “Policies and Legal Sys-tem” of “+1.16” far outweighs others, while the scores in Japan, the USA, Central and South America, and The Caribbean are smaller at less than “+0.5.”
The scores for “Social Infrastructure (Funds, Human Resources, Technologies, and Facilities)” are relatively high in China and the Middle East, and are lower in Afri-ca, Central and South America, The Carib-bean, and Japan.
No graph was created for other indicators due to the small number of samples viewed in each country/region.
27
IV. Closing Comment
The average time on the Environmental Doomsday Clock in 2020 at 9:47 has barely changed from the times recorded in the previous two years. The result shows the highest level of sustained crisis awareness since the beginning of the survey in 1992. With regard to “Environmental Issues to be Taken into Account,” which are used to decide the time on the Clock, 30% of the respondents selected “Climate Change”. The selection rate for this category has been on the rise since 2013, indicating that climate change is considered more urgent than other categories.
As in the previous year, the survey asked the respondents if they saw any signs of improvement in comparison with the situ-ations before 2015 when the Paris Agreement and SDGs were adopted. Given that the respondents’ answer to this question in terms of “Policies and Legal System” and “Social Infrastructure (Funds, Human Resources, Technologies, and Facilities)” varied from one region or country to another, we calculated the average scores for the entire world and for each region/coun-try and showed them as graphs to display an overall image and regional distribution.
With regard to a transition to a decarbonized society in Question 2-1, there were regional differences in the respondents’ perception of improvements made in “Public Awareness” and “Policies and Legal System.” In China and Taiwan, the differ-ence in the scores for the two was small, with “Policies and Legal System” being perceived as having made a slightly greater degree of improvement than “Public Awareness.” In contrast, the difference between the two issues was significant in Austra-lia and the USA, with “Policies and Legal System” considered to be falling significantly behind “Public Awareness.” These results indicate that, while in China and Taiwan people’s awareness is not keeping up with the measures the governments are taking proactively, in Australia and the USA, the governments’ measures are not keeping up with a strong concern their citi-zens have. Looking at the responses to this question by generation, the older the age group gets, the greater the difference between the perception of improvements made in “Public Awareness” and “Policies and Legal System” grows—that is, the older respondents tend to consider that the governments’ measures were not improving as fast as their citizens’ awareness.
In Question 2-2, the categories showing signs of improvement in the approach to environmental issues were as follows in the descending order of the selection rate: “Climate Change” at 28%, “Lifestyles” at 14%, “Society, Economy and Environment, Policies, Measures” at 14%, and “Biosphere Integrity (Biodiversity)” at 8%. “Climate Change” was also selected most fre-quently as a category that was important in considering environmental issues in Q1. This shows the strong worldwide interest in the “Climate Change” issue and the efforts to improve it. Meanwhile, “Biosphere Integrity (Biodiversity),” which was also a factor in moving the time on the Clock closer to midnight, was the second most frequently selected category in Q1 but ranked fourth as the categories showing signs of improvement. It is thus feared that the situation concerning “Biosphere Integrity (Biodiversity)” is serious but there are not many perceived signs of improvement.
We will continue using the above questions for a while and continue conducting this survey, paying attention to the average scores for the entire world and variances among regions and countries.
Looking back at the worldwide environmental incidents in the year immediately preceding the response period of this survey, there were many widely reported news events such as bush fires in Australia and Brazil from 2019 to early 2020, a desert locust plague in Africa, flooding in Venice, Italy, and a record high temperature of 38 degrees Celsius in the Arctic Circle. It may be interesting to read this report imagining that these incidents might have influenced the responses in each location.

28
V. Data
Number of Respondents Surveyed and Country of ResidenceNumber of Respondents Surveyed and County of Residence
Region Country Total Region Country Total Region Country TotalAfrica ALGERIA 1 Central Middle East BAHRAIN 2
BENIN 1 America & CYPRUS 3BOTSWANA 2 The BELIZE 1 IRAN 3BURKINA FASO 4 Caribbean BONAIRE 1 IRAQ 1CAMEROON 5 COSTA RICA 15 ISRAEL 7COTE DIVOIRE 6 CUBA 2 JORDAN 3DEMOCRATIC LEBANON 2REPUBLIC OF THE 2 SAUDI ARABIA 1CONGO EL SALVADOR 5 SYRIA 2ETHIOPIA 3 GRENADA 1 TURKEY 3GABON 1 GUATEMALA 7GUINEA 2 HONDURAS 2KENYA 8 MEXICO 30 Middle East Total 28MADAGASCAR 2 NICARAGUA 2 North CANADA 40MALI 3 PANAMA 3 America USA 136MAURITIUS 1 PUERTO RICO 2 North America Total 176MOROCCO 3 SINT EUSTATIUS 1 Oceania AUSTRALIA 35MOZAMBIQUE 3 FIJI 1NAMIBIA 1 NEW CALEDONIA 2NIGERIA 6 NEW ZEALAND 10RWANDA 2 The Caribbean Total SOLOMON 1SENEGAL 1 Eastern ALBANIA 3 Oceania Total 49SEYCHELLES 2 Europe & AZERBAIJAN 1 South ARGENTINA 12SOUTH AFRICA 13 Former America BOLIVIA 7TANZANIA 4 Soviet BRAZIL 31TUNISIA 3 Union BULGARIA 1 CHILE 6UGANDA 2 CROATIA 3 COLOMBIA 18ZAMBIA 4 CZECH 3 ECUADOR 10ZIMBABWE 1 HUNGARY 4 GUYANA 2
Africa Total 86 KAZAKHSTAN 1 PARAGUAY 2Asia BANGLADESH 5 LITHUANIA 1 PERU 16
BHUTAN 2 MOLDOVA 1 SURINAME 1BRUNEI 1 MONTENEGRO 4 URUGUAY 3CAMBODIA 3 NORTH MACEDONIA 2 VENEZUELA 4CHINA 408 POLAND 4 South America Total 112HONG KONG 2 ROMANIA 2INDIA 52 RUSSIA 5INDONESIA 4 SERBIA 3JAPAN 365 SLOVAKIA 2KOREA 33 SLOVENIA 1LAOS 1 TAJIKISTAN 1MALAYSIA 14 TURKMENISTAN 1MONGOLIA 1 UKRAINE 2MYANMAR 1NEPAL 8PAKISTAN 9 Western
EuropeAUSTRIA 10
PHILIPPINES 8 BELGIUM 5SINGAPORE 2 DENMARK 2SRI LANKA 2 FINLAND 4TAIWAN 82 FRANCE 18THAILAND 10 GERMANY 25VIETNAM 4 GREECE 5
Asia Total 1017 ICELAND 2IRELAND 3ITALY 16JERSEY 1LUXEMBOURG 1MALTA 1NORWAY 4PORTUGAL 13SPAIN 22SWEDEN 7SWITZERLAND 24THE NETHERLANDS 15UK 45
Western Europe Total 223
UNITED ARABEMIRATES
1
ANTIGUA ANDBARBUDA
1
BOSNIAHERZEGOVINA
1
DOMINICANREPUBLIC
2
TRINIDAD ANDTOBAGO
1
Eastern Europe & Former Soviet Union46
Total
Central America &76
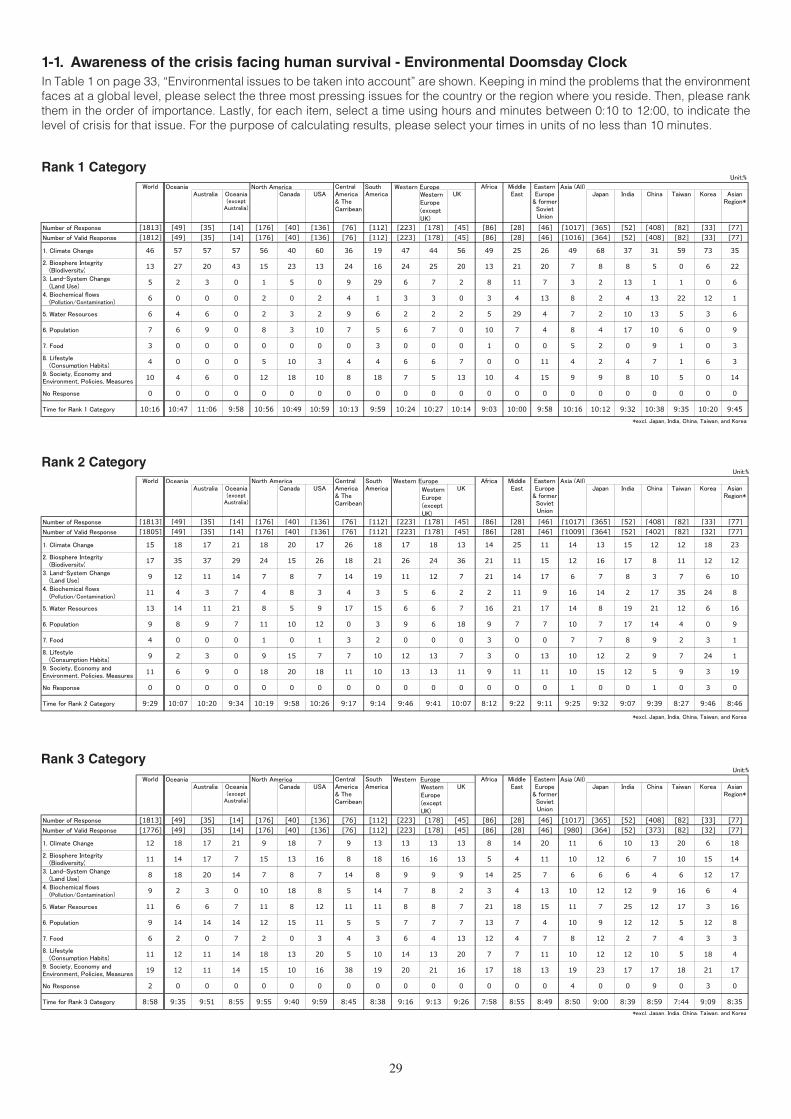
29
1-1. Awareness of the crisis facing human survival - Environmental Doomsday ClockIn Table 1 on page 33, “Environmental issues to be taken into account” are shown. Keeping in mind the problems that the environment faces at a global level, please select the three most pressing issues for the country or the region where you reside. Then, please rank them in the order of importance. Lastly, for each item, select a time using hours and minutes between 0:10 to 12:00, to indicate the level of crisis for that issue. For the purpose of calculating results, please select your times in units of no less than 10 minutes.2020データブック
1. Awareness of the Crisis Facing Human Survival - Environmental Doomsday Clock
Rank 1 Category Unit:%
World Oceania Asia (All)Australia Oceania
(exceptAustralia)
Japan India China Taiwan Korea AsianRegion*
Number of Response [1813] [49] [35] [14] [176] [40] [136] [76] [112] [223] [178] [45] [86] [28] [46] [1017] [365] [52] [408] [82] [33] [77]Number of Valid Response [1812] [49] [35] [14] [176] [40] [136] [76] [112] [223] [178] [45] [86] [28] [46] [1016] [364] [52] [408] [82] [33] [77]
1. Climate Change 46 57 57 57 56 40 60 36 19 47 44 56 49 25 26 49 68 37 31 59 73 352. Biosphere Integrity (Biodiversity)
13 27 20 43 15 23 13 24 16 24 25 20 13 21 20 7 8 8 5 0 6 223. Land-System Change (Land Use)
5 2 3 0 1 5 0 9 29 6 7 2 8 11 7 3 2 13 1 1 0 64. Biochemical flows (Pollution/Contamination)
6 0 0 0 2 0 2 4 1 3 3 0 3 4 13 8 2 4 13 22 12 1
5. Water Resources 6 4 6 0 2 3 2 9 6 2 2 2 5 29 4 7 2 10 13 5 3 6
6. Population 7 6 9 0 8 3 10 7 5 6 7 0 10 7 4 8 4 17 10 6 0 9
7. Food 3 0 0 0 0 0 0 0 3 0 0 0 1 0 0 5 2 0 9 1 0 38. Lifestyle
(Consumption Habits)4 0 0 0 5 10 3 4 4 6 6 7 0 0 11 4 2 4 7 1 6 3
9. Society, Economy andEnvironment, Policies, Measures
10 4 6 0 12 18 10 8 18 7 5 13 10 4 15 9 9 8 10 5 0 14
No Response 0 0 0 0 0 0 0 0 0 0 0 0 0 0 0 0 0 0 0 0 0 0
Time for Rank 1 Category 10:16 10:47 11:06 9:58 10:56 10:49 10:59 10:13 9:59 10:24 10:27 10:14 9:03 10:00 9:58 10:16 10:12 9:32 10:38 9:35 10:20 9:45*excl. Japan, India, China, Taiwan, and Korea
Rank 2 Category Unit:%
World Oceania North America EU & UK Asia (All)Australia Oceania
(exceptAustralia)
Canada USA EU UK Japan India China Taiwan Korea AsianRegion*
Number of Response [1813] [49] [35] [14] [176] [40] [136] [76] [112] [223] [178] [45] [86] [28] [46] [1017] [365] [52] [408] [82] [33] [77]Number of Valid Response [1805] [49] [35] [14] [176] [40] [136] [76] [112] [223] [178] [45] [86] [28] [46] [1009] [364] [52] [402] [82] [32] [77]
1. Climate Change 15 18 17 21 18 20 17 26 18 17 18 13 14 25 11 14 13 15 12 12 18 232. Biosphere Integrity
(Biodiversity)17 35 37 29 24 15 26 18 21 26 24 36 21 11 15 12 16 17 8 11 12 12
3. Land-System Change(Land Use)
9 12 11 14 7 8 7 14 19 11 12 7 21 14 17 6 7 8 3 7 6 104. Biochemical flows
(Pollution/Contamination)11 4 3 7 4 8 3 4 3 5 6 2 2 11 9 16 14 2 17 35 24 8
5. Water Resources 13 14 11 21 8 5 9 17 15 6 6 7 16 21 17 14 8 19 21 12 6 16
6. Population 9 8 9 7 11 10 12 0 3 9 6 18 9 7 7 10 7 17 14 4 0 9
7. Food 4 0 0 0 1 0 1 3 2 0 0 0 3 0 0 7 7 8 9 2 3 18. Lifestyle
(Consumption Habits)9 2 3 0 9 15 7 7 10 12 13 7 3 0 13 10 12 2 9 7 24 1
9. Society, Economy andEnvironment, Policies, Measures
11 6 9 0 18 20 18 11 10 13 13 11 9 11 11 10 15 12 5 9 3 19
No Response 0 0 0 0 0 0 0 0 0 0 0 0 0 0 0 1 0 0 1 0 3 0
Time for Rank 2 Category 9:29 10:07 10:20 9:34 10:19 9:58 10:26 9:17 9:14 9:46 9:41 10:07 8:12 9:22 9:11 9:25 9:32 9:07 9:39 8:27 9:46 8:46
*excl. Japan, India, China, Taiwan, and Korea
Rank 3 Category Unit:%
World Oceania North America EU & UK Asia (All)Australia Oceania
(exceptAustralia)
Canada USA EU UK Japan India China Taiwan Korea AsianRegion*
Number of Response [1813] [49] [35] [14] [176] [40] [136] [76] [112] [223] [178] [45] [86] [28] [46] [1017] [365] [52] [408] [82] [33] [77]Number of Valid Response [1776] [49] [35] [14] [176] [40] [136] [76] [112] [223] [178] [45] [86] [28] [46] [980] [364] [52] [373] [82] [32] [77]
1. Climate Change 12 18 17 21 9 18 7 9 13 13 13 13 8 14 20 11 6 10 13 20 6 182. Biosphere Integrity
(Biodiversity)11 14 17 7 15 13 16 8 18 16 16 13 5 4 11 10 12 6 7 10 15 14
3. Land-System Change(Land Use)
8 18 20 14 7 8 7 14 8 9 9 9 14 25 7 6 6 6 4 6 12 174. Biochemical flows
(Pollution/Contamination)9 2 3 0 10 18 8 5 14 7 8 2 3 4 13 10 12 12 9 16 6 4
5. Water Resources 11 6 6 7 11 8 12 11 11 8 8 7 21 18 15 11 7 25 12 17 3 16
6. Population 9 14 14 14 12 15 11 5 5 7 7 7 13 7 4 10 9 12 12 5 12 8
7. Food 6 2 0 7 2 0 3 4 3 6 4 13 12 4 7 8 12 2 7 4 3 38. Lifestyle
(Consumption Habits)11 12 11 14 18 13 20 5 10 14 13 20 7 7 11 10 12 12 10 5 18 4
9. Society, Economy andEnvironment, Policies, Measures
19 12 11 14 15 10 16 38 19 20 21 16 17 18 13 19 23 17 17 18 21 17
No Response 2 0 0 0 0 0 0 0 0 0 0 0 0 0 0 4 0 0 9 0 3 0
Time for Rank 3 Category 8:58 9:35 9:51 8:55 9:55 9:40 9:59 8:45 8:38 9:16 9:13 9:26 7:58 8:55 8:49 8:50 9:00 8:39 8:59 7:44 9:09 8:35*excl. Japan, India, China, Taiwan, and Korea
In Table 1, “Environmental issues to be taken into account” are shown. Keeping in mind the problems that the en-vironment faces at a global level, please select the three most pressing issues for the country or the region where you reside. Then, please rank them in theorder of importance. Lastly, for each item, select a time using hours and minutes between 0:10 to 12:00, to indicate the level of crisis for that issue. For the purposes of calculating results, please select your times in units of 10 minutes.
MiddleEast
CentralAmerica& TheCarribean
North America South Western EuropeCanada USA America UK
EasternEurope
& formerSovietUnion
Africa
MiddleEast
EasternEurope
& formerSovietUnion
CentralAmerica& TheCarribean
SouthAmerica
Africa MiddleEast
EasternEurope
& formerSovietUnion
AfricaCentralAmerica& TheCarribean
SouthAmerica
2020データブック
1. Awareness of the Crisis Facing Human Survival - Environmental Doomsday Clock
Rank 1 Category Unit:%
World Oceania North America EU & UK Asia (All)Australia Oceania
(exceptAustralia)
Canada USA EU UK Japan India China Taiwan Korea AsianRegion*
Number of Response [1813] [49] [35] [14] [176] [40] [136] [76] [112] [223] [178] [45] [86] [28] [46] [1017] [365] [52] [408] [82] [33] [77]Number of Valid Response [1812] [49] [35] [14] [176] [40] [136] [76] [112] [223] [178] [45] [86] [28] [46] [1016] [364] [52] [408] [82] [33] [77]
1. Climate Change 46 57 57 57 56 40 60 36 19 47 44 56 49 25 26 49 68 37 31 59 73 352. Biosphere Integrity
(Biodiversity)13 27 20 43 15 23 13 24 16 24 25 20 13 21 20 7 8 8 5 0 6 22
3. Land-System Change(Land Use)
5 2 3 0 1 5 0 9 29 6 7 2 8 11 7 3 2 13 1 1 0 64. Biochemical flows
(Pollution/Contamination)6 0 0 0 2 0 2 4 1 3 3 0 3 4 13 8 2 4 13 22 12 1
5. Water Resources 6 4 6 0 2 3 2 9 6 2 2 2 5 29 4 7 2 10 13 5 3 6
6. Population 7 6 9 0 8 3 10 7 5 6 7 0 10 7 4 8 4 17 10 6 0 9
7. Food 3 0 0 0 0 0 0 0 3 0 0 0 1 0 0 5 2 0 9 1 0 38. Lifestyle
(Consumption Habits)4 0 0 0 5 10 3 4 4 6 6 7 0 0 11 4 2 4 7 1 6 3
9. Society, Economy andEnvironment, Policies, Measures
10 4 6 0 12 18 10 8 18 7 5 13 10 4 15 9 9 8 10 5 0 14
No Response 0 0 0 0 0 0 0 0 0 0 0 0 0 0 0 0 0 0 0 0 0 0
Time for Rank 1 Category 10:16 10:47 11:06 9:58 10:56 10:49 10:59 10:13 9:59 10:24 10:27 10:14 9:03 10:00 9:58 10:16 10:12 9:32 10:38 9:35 10:20 9:45*excl. Japan, India, China, Taiwan, and Korea
Rank 2 Category Unit:%
World Oceania North America Western Europe Asia (All)Australia Oceania
(exceptAustralia)
Canada USA Western Europe (except UK)
UK Japan India China Taiwan Korea AsianRegion*
Number of Response [1813] [49] [35] [14] [176] [40] [136] [76] [112] [223] [178] [45] [86] [28] [46] [1017] [365] [52] [408] [82] [33] [77]Number of Valid Response [1805] [49] [35] [14] [176] [40] [136] [76] [112] [223] [178] [45] [86] [28] [46] [1009] [364] [52] [402] [82] [32] [77]
1. Climate Change 15 18 17 21 18 20 17 26 18 17 18 13 14 25 11 14 13 15 12 12 18 232. Biosphere Integrity (Biodiversity)
17 35 37 29 24 15 26 18 21 26 24 36 21 11 15 12 16 17 8 11 12 123. Land-System Change (Land Use)
9 12 11 14 7 8 7 14 19 11 12 7 21 14 17 6 7 8 3 7 6 104. Biochemical flows (Pollution/Contamination)
11 4 3 7 4 8 3 4 3 5 6 2 2 11 9 16 14 2 17 35 24 8
5. Water Resources 13 14 11 21 8 5 9 17 15 6 6 7 16 21 17 14 8 19 21 12 6 16
6. Population 9 8 9 7 11 10 12 0 3 9 6 18 9 7 7 10 7 17 14 4 0 9
7. Food 4 0 0 0 1 0 1 3 2 0 0 0 3 0 0 7 7 8 9 2 3 18. Lifestyle (Consumption Habits)
9 2 3 0 9 15 7 7 10 12 13 7 3 0 13 10 12 2 9 7 24 19. Society, Economy andEnvironment, Policies, Measures
11 6 9 0 18 20 18 11 10 13 13 11 9 11 11 10 15 12 5 9 3 19
No Response 0 0 0 0 0 0 0 0 0 0 0 0 0 0 0 1 0 0 1 0 3 0
Time for Rank 2 Category 9:29 10:07 10:20 9:34 10:19 9:58 10:26 9:17 9:14 9:46 9:41 10:07 8:12 9:22 9:11 9:25 9:32 9:07 9:39 8:27 9:46 8:46
*excl. Japan, India, China, Taiwan, and Korea
Rank 3 Category Unit:%
World Oceania North America EU & UK Asia (All)Australia Oceania
(exceptAustralia)
Canada USA EU UK Japan India China Taiwan Korea AsianRegion*
Number of Response [1813] [49] [35] [14] [176] [40] [136] [76] [112] [223] [178] [45] [86] [28] [46] [1017] [365] [52] [408] [82] [33] [77]Number of Valid Response [1776] [49] [35] [14] [176] [40] [136] [76] [112] [223] [178] [45] [86] [28] [46] [980] [364] [52] [373] [82] [32] [77]
1. Climate Change 12 18 17 21 9 18 7 9 13 13 13 13 8 14 20 11 6 10 13 20 6 182. Biosphere Integrity
(Biodiversity)11 14 17 7 15 13 16 8 18 16 16 13 5 4 11 10 12 6 7 10 15 14
3. Land-System Change(Land Use)
8 18 20 14 7 8 7 14 8 9 9 9 14 25 7 6 6 6 4 6 12 174. Biochemical flows
(Pollution/Contamination)9 2 3 0 10 18 8 5 14 7 8 2 3 4 13 10 12 12 9 16 6 4
5. Water Resources 11 6 6 7 11 8 12 11 11 8 8 7 21 18 15 11 7 25 12 17 3 16
6. Population 9 14 14 14 12 15 11 5 5 7 7 7 13 7 4 10 9 12 12 5 12 8
7. Food 6 2 0 7 2 0 3 4 3 6 4 13 12 4 7 8 12 2 7 4 3 38. Lifestyle
(Consumption Habits)11 12 11 14 18 13 20 5 10 14 13 20 7 7 11 10 12 12 10 5 18 4
9. Society, Economy andEnvironment, Policies, Measures
19 12 11 14 15 10 16 38 19 20 21 16 17 18 13 19 23 17 17 18 21 17
No Response 2 0 0 0 0 0 0 0 0 0 0 0 0 0 0 4 0 0 9 0 3 0
Time for Rank 3 Category 8:58 9:35 9:51 8:55 9:55 9:40 9:59 8:45 8:38 9:16 9:13 9:26 7:58 8:55 8:49 8:50 9:00 8:39 8:59 7:44 9:09 8:35*excl. Japan, India, China, Taiwan, and Korea
In Table 1, “Environmental issues to be taken into account” are shown. Keeping in mind the problems that the en-vironment faces at a global level, please select the three most pressing issues for the country or the region where you reside. Then, please rank them in theorder of importance. Lastly, for each item, select a time using hours and minutes between 0:10 to 12:00, to indicate the level of crisis for that issue. For the purposes of calculating results, please select your times in units of 10 minutes.
MiddleEast
CentralAmerica& TheCarribean
SouthAmerica
EasternEurope
& formerSovietUnion
Africa
MiddleEast
EasternEurope
& formerSovietUnion
CentralAmerica& TheCarribean
SouthAmerica
Africa MiddleEast
EasternEurope
& formerSovietUnion
AfricaCentralAmerica& TheCarribean
SouthAmerica
2020データブック
1. Awareness of the Crisis Facing Human Survival - Environmental Doomsday Clock
Rank 1 Category Unit:%
World Oceania North America EU & UK Asia (All)Australia Oceania
(exceptAustralia)
Canada USA EU UK Japan India China Taiwan Korea AsianRegion*
Number of Response [1813] [49] [35] [14] [176] [40] [136] [76] [112] [223] [178] [45] [86] [28] [46] [1017] [365] [52] [408] [82] [33] [77]Number of Valid Response [1812] [49] [35] [14] [176] [40] [136] [76] [112] [223] [178] [45] [86] [28] [46] [1016] [364] [52] [408] [82] [33] [77]
1. Climate Change 46 57 57 57 56 40 60 36 19 47 44 56 49 25 26 49 68 37 31 59 73 352. Biosphere Integrity
(Biodiversity)13 27 20 43 15 23 13 24 16 24 25 20 13 21 20 7 8 8 5 0 6 22
3. Land-System Change(Land Use)
5 2 3 0 1 5 0 9 29 6 7 2 8 11 7 3 2 13 1 1 0 64. Biochemical flows
(Pollution/Contamination)6 0 0 0 2 0 2 4 1 3 3 0 3 4 13 8 2 4 13 22 12 1
5. Water Resources 6 4 6 0 2 3 2 9 6 2 2 2 5 29 4 7 2 10 13 5 3 6
6. Population 7 6 9 0 8 3 10 7 5 6 7 0 10 7 4 8 4 17 10 6 0 9
7. Food 3 0 0 0 0 0 0 0 3 0 0 0 1 0 0 5 2 0 9 1 0 38. Lifestyle
(Consumption Habits)4 0 0 0 5 10 3 4 4 6 6 7 0 0 11 4 2 4 7 1 6 3
9. Society, Economy andEnvironment, Policies, Measures
10 4 6 0 12 18 10 8 18 7 5 13 10 4 15 9 9 8 10 5 0 14
No Response 0 0 0 0 0 0 0 0 0 0 0 0 0 0 0 0 0 0 0 0 0 0
Time for Rank 1 Category 10:16 10:47 11:06 9:58 10:56 10:49 10:59 10:13 9:59 10:24 10:27 10:14 9:03 10:00 9:58 10:16 10:12 9:32 10:38 9:35 10:20 9:45*excl. Japan, India, China, Taiwan, and Korea
Rank 2 Category Unit:%
World Oceania North America EU & UK Asia (All)Australia Oceania
(exceptAustralia)
Canada USA EU UK Japan India China Taiwan Korea AsianRegion*
Number of Response [1813] [49] [35] [14] [176] [40] [136] [76] [112] [223] [178] [45] [86] [28] [46] [1017] [365] [52] [408] [82] [33] [77]Number of Valid Response [1805] [49] [35] [14] [176] [40] [136] [76] [112] [223] [178] [45] [86] [28] [46] [1009] [364] [52] [402] [82] [32] [77]
1. Climate Change 15 18 17 21 18 20 17 26 18 17 18 13 14 25 11 14 13 15 12 12 18 232. Biosphere Integrity
(Biodiversity)17 35 37 29 24 15 26 18 21 26 24 36 21 11 15 12 16 17 8 11 12 12
3. Land-System Change(Land Use)
9 12 11 14 7 8 7 14 19 11 12 7 21 14 17 6 7 8 3 7 6 104. Biochemical flows
(Pollution/Contamination)11 4 3 7 4 8 3 4 3 5 6 2 2 11 9 16 14 2 17 35 24 8
5. Water Resources 13 14 11 21 8 5 9 17 15 6 6 7 16 21 17 14 8 19 21 12 6 16
6. Population 9 8 9 7 11 10 12 0 3 9 6 18 9 7 7 10 7 17 14 4 0 9
7. Food 4 0 0 0 1 0 1 3 2 0 0 0 3 0 0 7 7 8 9 2 3 18. Lifestyle
(Consumption Habits)9 2 3 0 9 15 7 7 10 12 13 7 3 0 13 10 12 2 9 7 24 1
9. Society, Economy andEnvironment, Policies, Measures
11 6 9 0 18 20 18 11 10 13 13 11 9 11 11 10 15 12 5 9 3 19
No Response 0 0 0 0 0 0 0 0 0 0 0 0 0 0 0 1 0 0 1 0 3 0
Time for Rank 2 Category 9:29 10:07 10:20 9:34 10:19 9:58 10:26 9:17 9:14 9:46 9:41 10:07 8:12 9:22 9:11 9:25 9:32 9:07 9:39 8:27 9:46 8:46
*excl. Japan, India, China, Taiwan, and Korea
Rank 3 Category Unit:%
World Oceania North America Western Europe Asia (All)Australia Oceania
(exceptAustralia)
Canada USA UK Japan India China Taiwan Korea AsianRegion*
Number of Response [1813] [49] [35] [14] [176] [40] [136] [76] [112] [223] [178] [45] [86] [28] [46] [1017] [365] [52] [408] [82] [33] [77]Number of Valid Response [1776] [49] [35] [14] [176] [40] [136] [76] [112] [223] [178] [45] [86] [28] [46] [980] [364] [52] [373] [82] [32] [77]
1. Climate Change 12 18 17 21 9 18 7 9 13 13 13 13 8 14 20 11 6 10 13 20 6 182. Biosphere Integrity (Biodiversity)
11 14 17 7 15 13 16 8 18 16 16 13 5 4 11 10 12 6 7 10 15 143. Land-System Change (Land Use)
8 18 20 14 7 8 7 14 8 9 9 9 14 25 7 6 6 6 4 6 12 174. Biochemical flows
(Pollution/Contamination)9 2 3 0 10 18 8 5 14 7 8 2 3 4 13 10 12 12 9 16 6 4
5. Water Resources 11 6 6 7 11 8 12 11 11 8 8 7 21 18 15 11 7 25 12 17 3 16
6. Population 9 14 14 14 12 15 11 5 5 7 7 7 13 7 4 10 9 12 12 5 12 8
7. Food 6 2 0 7 2 0 3 4 3 6 4 13 12 4 7 8 12 2 7 4 3 38. Lifestyle (Consumption Habits)
11 12 11 14 18 13 20 5 10 14 13 20 7 7 11 10 12 12 10 5 18 49. Society, Economy andEnvironment, Policies, Measures
19 12 11 14 15 10 16 38 19 20 21 16 17 18 13 19 23 17 17 18 21 17
No Response 2 0 0 0 0 0 0 0 0 0 0 0 0 0 0 4 0 0 9 0 3 0
Time for Rank 3 Category 8:58 9:35 9:51 8:55 9:55 9:40 9:59 8:45 8:38 9:16 9:13 9:26 7:58 8:55 8:49 8:50 9:00 8:39 8:59 7:44 9:09 8:35*excl. Japan, India, China, Taiwan, and Korea
In Table 1, “Environmental issues to be taken into account” are shown. Keeping in mind the problems that the en-vironment faces at a global level, please select the three most pressing issues for the country or the region where you reside. Then, please rank them in theorder of importance. Lastly, for each item, select a time using hours and minutes between 0:10 to 12:00, to indicate the level of crisis for that issue. For the purposes of calculating results, please select your times in units of 10 minutes.
MiddleEast
CentralAmerica& TheCarribean
SouthAmerica
EasternEurope
& formerSovietUnion
Africa
MiddleEast
EasternEurope
& formerSovietUnion
CentralAmerica& TheCarribean
SouthAmerica
Africa MiddleEast
EasternEurope
& formerSovietUnion
AfricaCentralAmerica& TheCarribean
SouthAmerica
2020データブック
1. Awareness of the Crisis Facing Human Survival - Environmental Doomsday Clock
Rank 1 Category Unit:%
World Oceania North America EU & UK Asia (All)Australia Oceania
(exceptAustralia)
Canada USA EU UK Japan India China Taiwan Korea AsianRegion*
Number of Response [1813] [49] [35] [14] [176] [40] [136] [76] [112] [223] [178] [45] [86] [28] [46] [1017] [365] [52] [408] [82] [33] [77]Number of Valid Response [1812] [49] [35] [14] [176] [40] [136] [76] [112] [223] [178] [45] [86] [28] [46] [1016] [364] [52] [408] [82] [33] [77]
1. Climate Change 46 57 57 57 56 40 60 36 19 47 44 56 49 25 26 49 68 37 31 59 73 352. Biosphere Integrity
(Biodiversity)13 27 20 43 15 23 13 24 16 24 25 20 13 21 20 7 8 8 5 0 6 22
3. Land-System Change(Land Use)
5 2 3 0 1 5 0 9 29 6 7 2 8 11 7 3 2 13 1 1 0 64. Biochemical flows
(Pollution/Contamination)6 0 0 0 2 0 2 4 1 3 3 0 3 4 13 8 2 4 13 22 12 1
5. Water Resources 6 4 6 0 2 3 2 9 6 2 2 2 5 29 4 7 2 10 13 5 3 6
6. Population 7 6 9 0 8 3 10 7 5 6 7 0 10 7 4 8 4 17 10 6 0 9
7. Food 3 0 0 0 0 0 0 0 3 0 0 0 1 0 0 5 2 0 9 1 0 38. Lifestyles
(Consumption Habits)4 0 0 0 5 10 3 4 4 6 6 7 0 0 11 4 2 4 7 1 6 3
9. Society, Economy andEnvironment, Policies, Measures
10 4 6 0 12 18 10 8 18 7 5 13 10 4 15 9 9 8 10 5 0 14
No Response 0 0 0 0 0 0 0 0 0 0 0 0 0 0 0 0 0 0 0 0 0 0
Time for Rank 1 Category 10:16 10:47 11:06 9:58 10:56 10:49 10:59 10:13 9:59 10:24 10:27 10:14 9:03 10:00 9:58 10:16 10:12 9:32 10:38 9:35 10:20 9:45*excl. Japan, India, China, Taiwan, and Korea
Rank 2 Category Unit:%
World Oceania North America EU & UK Asia (All)Australia Oceania
(exceptAustralia)
Canada USA EU UK Japan India China Taiwan Korea AsianRegion*
Number of Response [1813] [49] [35] [14] [176] [40] [136] [76] [112] [223] [178] [45] [86] [28] [46] [1017] [365] [52] [408] [82] [33] [77]Number of Valid Response [1805] [49] [35] [14] [176] [40] [136] [76] [112] [223] [178] [45] [86] [28] [46] [1009] [364] [52] [402] [82] [32] [77]
1. Climate Change 15 18 17 21 18 20 17 26 18 17 18 13 14 25 11 14 13 15 12 12 18 232. Biosphere Integrity
(Biodiversity)17 35 37 29 24 15 26 18 21 26 24 36 21 11 15 12 16 17 8 11 12 12
3. Land-System Change(Land Use)
9 12 11 14 7 8 7 14 19 11 12 7 21 14 17 6 7 8 3 7 6 104. Biochemical flows
(Pollution/Contamination)11 4 3 7 4 8 3 4 3 5 6 2 2 11 9 16 14 2 17 35 24 8
5. Water Resources 13 14 11 21 8 5 9 17 15 6 6 7 16 21 17 14 8 19 21 12 6 16
6. Population 9 8 9 7 11 10 12 0 3 9 6 18 9 7 7 10 7 17 14 4 0 9
7. Food 4 0 0 0 1 0 1 3 2 0 0 0 3 0 0 7 7 8 9 2 3 18. Lifestyles
(Consumption Habits)9 2 3 0 9 15 7 7 10 12 13 7 3 0 13 10 12 2 9 7 24 1
9. Society, Economy andEnvironment, Policies, Measures
11 6 9 0 18 20 18 11 10 13 13 11 9 11 11 10 15 12 5 9 3 19
No Response 0 0 0 0 0 0 0 0 0 0 0 0 0 0 0 1 0 0 1 0 3 0
Time for Rank 2 Category 9:29 10:07 10:20 9:34 10:19 9:58 10:26 9:17 9:14 9:46 9:41 10:07 8:12 9:22 9:11 9:25 9:32 9:07 9:39 8:27 9:46 8:46
*excl. Japan, India, China, Taiwan, and Korea
Rank 3 Category Unit:%
World Oceania North America EU & UK Asia (All)Australia Oceania
(exceptAustralia)
Canada USA EU UK Japan India China Taiwan Korea AsianRegion*
Number of Response [1813] [49] [35] [14] [176] [40] [136] [76] [112] [223] [178] [45] [86] [28] [46] [1017] [365] [52] [408] [82] [33] [77]Number of Valid Response [1776] [49] [35] [14] [176] [40] [136] [76] [112] [223] [178] [45] [86] [28] [46] [980] [364] [52] [373] [82] [32] [77]
1. Climate Change 12 18 17 21 9 18 7 9 13 13 13 13 8 14 20 11 6 10 13 20 6 182. Biosphere Integrity
(Biodiversity)11 14 17 7 15 13 16 8 18 16 16 13 5 4 11 10 12 6 7 10 15 14
3. Land-System Change(Land Use)
8 18 20 14 7 8 7 14 8 9 9 9 14 25 7 6 6 6 4 6 12 174. Biochemical flows
(Pollution/Contamination)9 2 3 0 10 18 8 5 14 7 8 2 3 4 13 10 12 12 9 16 6 4
5. Water Resources 11 6 6 7 11 8 12 11 11 8 8 7 21 18 15 11 7 25 12 17 3 16
6. Population 9 14 14 14 12 15 11 5 5 7 7 7 13 7 4 10 9 12 12 5 12 8
7. Food 6 2 0 7 2 0 3 4 3 6 4 13 12 4 7 8 12 2 7 4 3 38. Lifestyles
(Consumption Habits)11 12 11 14 18 13 20 5 10 14 13 20 7 7 11 10 12 12 10 5 18 4
9. Society, Economy andEnvironment, Policies, Measures
19 12 11 14 15 10 16 38 19 20 21 16 17 18 13 19 23 17 17 18 21 17
No Response 2 0 0 0 0 0 0 0 0 0 0 0 0 0 0 4 0 0 9 0 3 0
Time for Rank 3 Category 8:58 9:35 9:51 8:55 9:55 9:40 9:59 8:45 8:38 9:16 9:13 9:26 7:58 8:55 8:49 8:50 9:00 8:39 8:59 7:44 9:09 8:35*excl. Japan, India, China, Taiwan, and Korea
MiddleEast
EasternEurope
& formerSovietUnion
CentralAmerica& TheCarribean
SouthAmerica
Africa MiddleEast
EasternEurope
& formerSovietUnion
AfricaCentralAmerica& TheCarribean
SouthAmerica
In Table 1, “Environmental issues to be taken into account” are shown. Keeping in mind the problems that the en-vironment faces at a global level, please select the three most pressing issues for the country or the region where you reside. Then, please rank them in theorder of importance. Lastly, for each item, select a time using hours and minutes between 0:10 to 12:00, to indicate the level of crisis for that issue. For the purposes of calculating results, please select your times in units of 10 minutes.
MiddleEast
CentralAmerica& TheCarribean
SouthAmerica
EasternEurope
& formerSovietUnion
Africa
Rank 1 Category
Rank 2 Category
Rank 3 Category
Western Europe (except UK)
Western Europe (except UK)
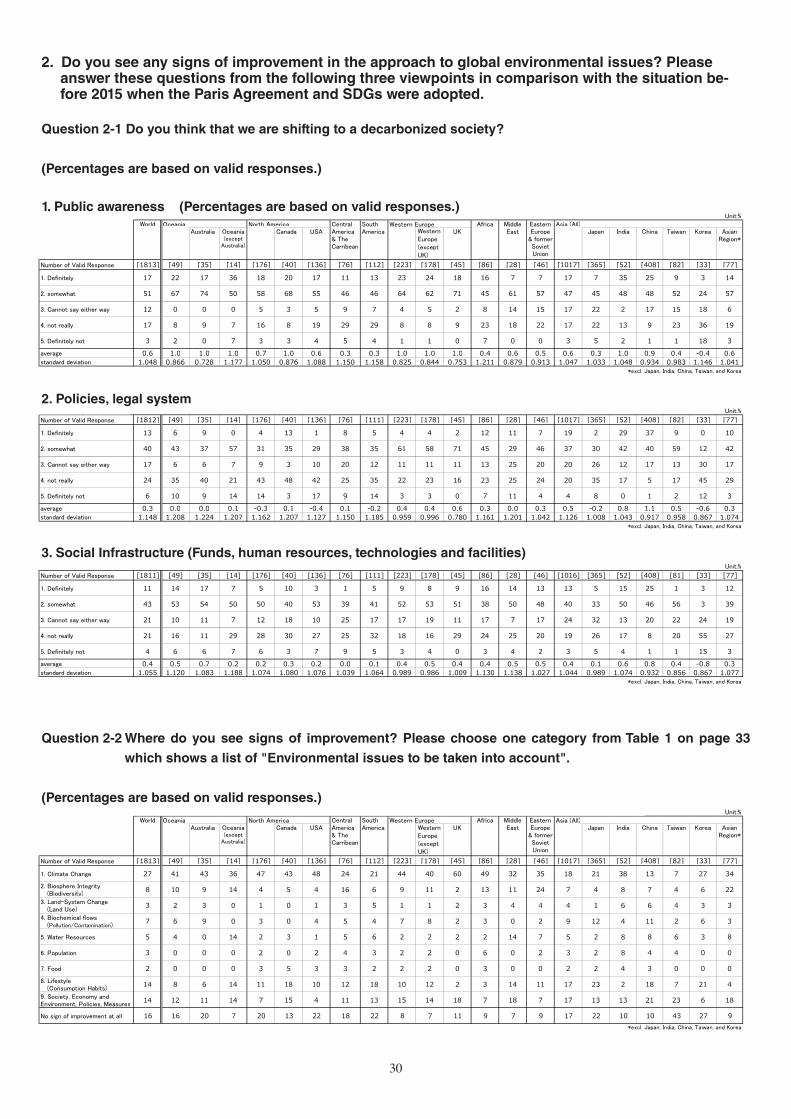
30
2. Do you see any signs of improvement in the approach to global environmental issues? Pleaseanswer these questions from the following three viewpoints in comparison with the situation be-fore 2015 when the Paris Agreement and SDGs were adopted.
Question 2-1 Do you think that we are shifting to a decarbonized society?
(Percentages are based on valid responses.)
(Percentages are based on valid responses.)1. Public awareness Unit:%
World Oceania North America Western Europe Asia (All)Australia Oceania
(exceptAustralia)
Canada USA UK Japan India China Taiwan Korea AsianRegion*
Number of Valid Response [1813] [49] [35] [14] [176] [40] [136] [76] [112] [223] [178] [45] [86] [28] [46] [1017] [365] [52] [408] [82] [33] [77]
1. Definitely 17 22 17 36 18 20 17 11 13 23 24 18 16 7 7 17 7 35 25 9 3 14
2. somewhat 51 67 74 50 58 68 55 46 46 64 62 71 45 61 57 47 45 48 48 52 24 57
3. Cannot say either way 12 0 0 0 5 3 5 9 7 4 5 2 8 14 15 17 22 2 17 15 18 6
4. not really 17 8 9 7 16 8 19 29 29 8 8 9 23 18 22 17 22 13 9 23 36 19
5. Definitely not 3 2 0 7 3 3 4 5 4 1 1 0 7 0 0 3 5 2 1 1 18 3average 0.6 1.0 1.0 1.0 0.7 1.0 0.6 0.3 0.3 1.0 1.0 1.0 0.4 0.6 0.5 0.6 0.3 1.0 0.9 0.4 -0.4 0.6standard deviation 1.048 0.866 0.728 1.177 1.050 0.876 1.088 1.150 1.158 0.825 0.844 0.753 1.211 0.879 0.913 1.047 1.033 1.048 0.934 0.983 1.146 1.041
*excl. Japan, India, China, Taiwan, and Korea
2. Policies, legal system Unit:%
Number of Valid Response [1812] [49] [35] [14] [176] [40] [136] [76] [111] [223] [178] [45] [86] [28] [46] [1017] [365] [52] [408] [82] [33] [77]
1. Definitely 13 6 9 0 4 13 1 8 5 4 4 2 12 11 7 19 2 29 37 9 0 10
2. somewhat 40 43 37 57 31 35 29 38 35 61 58 71 45 29 46 37 30 42 40 59 12 42
3. Cannot say either way 17 6 6 7 9 3 10 20 12 11 11 11 13 25 20 20 26 12 17 13 30 17
4. not really 24 35 40 21 43 48 42 25 35 22 23 16 23 25 24 20 35 17 5 17 45 29
5. Definitely not 6 10 9 14 14 3 17 9 14 3 3 0 7 11 4 4 8 0 1 2 12 3average 0.3 0.0 0.0 0.1 -0.3 0.1 -0.4 0.1 -0.2 0.4 0.4 0.6 0.3 0.0 0.3 0.5 -0.2 0.8 1.1 0.5 -0.6 0.3standard deviation 1.148 1.208 1.224 1.207 1.162 1.207 1.127 1.150 1.185 0.959 0.996 0.780 1.161 1.201 1.042 1.126 1.008 1.043 0.917 0.958 0.867 1.074
*excl. Japan, India, China, Taiwan, and Korea
3. Funds, human resources, technologies and facilities Unit:%
Number of Valid Response [1811] [49] [35] [14] [176] [40] [136] [76] [111] [223] [178] [45] [86] [28] [46] [1016] [365] [52] [408] [81] [33] [77]
1. Definitely 11 14 17 7 5 10 3 1 5 9 8 9 16 14 13 13 5 15 25 1 3 12
2. somewhat 43 53 54 50 50 40 53 39 41 52 53 51 38 50 48 40 33 50 46 56 3 39
3. Cannot say either way 21 10 11 7 12 18 10 25 17 17 19 11 17 7 17 24 32 13 20 22 24 19
4. not really 21 16 11 29 28 30 27 25 32 18 16 29 24 25 20 19 26 17 8 20 55 27
5. Definitely not 4 6 6 7 6 3 7 9 5 3 4 0 3 4 2 3 5 4 1 1 15 3average 0.4 0.5 0.7 0.2 0.2 0.3 0.2 0.0 0.1 0.4 0.5 0.4 0.4 0.5 0.5 0.4 0.1 0.6 0.8 0.4 -0.8 0.3standard deviation 1.055 1.120 1.083 1.188 1.074 1.080 1.076 1.039 1.064 0.989 0.986 1.009 1.130 1.138 1.027 1.044 0.989 1.074 0.932 0.856 0.867 1.077
*excl. Japan, India, China, Taiwan, and Korea
Question 2-2 Where do you see signs of improvement? Please choose one category from Table 1 on page 33 which shows a list of "Environmental issues to be taken into account".
(Percentages are based on valid responses.) Unit:%World Oceania North America EU & UK Asia (All)
Australia Oceania(except
Australia)
Canada USA EU UK Japan India China Taiwan Korea AsianRegion*
Number of Valid Response [1813] [49] [35] [14] [176] [40] [136] [76] [112] [223] [178] [45] [86] [28] [46] [1017] [365] [52] [408] [82] [33] [77]
1. Climate Change 27 41 43 36 47 43 48 24 21 44 40 60 49 32 35 18 21 38 13 7 27 342. Biosphere Integrity
(Biodiversity)8 10 9 14 4 5 4 16 6 9 11 2 13 11 24 7 4 8 7 4 6 22
3. Land-System Change(Land Use)
3 2 3 0 1 0 1 3 5 1 1 2 3 4 4 4 1 6 6 4 3 34. Biochemical flows
(Pollution/Contamination)7 6 9 0 3 0 4 5 4 7 8 2 3 0 2 9 12 4 11 2 6 3
5. Water Resources 5 4 0 14 2 3 1 5 6 2 2 2 2 14 7 5 2 8 8 6 3 8
6. Population 3 0 0 0 2 0 2 4 3 2 2 0 6 0 2 3 2 8 4 4 0 0
7. Food 2 0 0 0 3 5 3 3 2 2 2 0 3 0 0 2 2 4 3 0 0 08. Lifestyle
(Consumption Habits)14 8 6 14 11 18 10 12 18 10 12 2 3 14 11 17 23 2 18 7 21 4
9. Society, Economy andEnvironment, Policies, Measures
14 12 11 14 7 15 4 11 13 15 14 18 7 18 7 17 13 13 21 23 6 18
No sign of improvement at all 16 16 20 7 20 13 22 18 22 8 7 11 9 7 9 17 22 10 10 43 27 9*excl. Japan, India, China, Taiwan, and Korea
CentralAmerica& TheCarribean
SouthAmerica
Africa MiddleEast
EasternEurope
& formerSovietUnion
2020データブック
Question 2-1 Do you think that we are shifting to a decarbonized society ?
MiddleEast
EasternEurope
& formerSovietUnion
CentralAmerica& TheCarribean
SouthAmerica
Africa
2. Do you see any signs of improvement in the approach to global environmental issues? Please answer these questions from the following three viewpoints in comparison with the situation before 2015 when the Paris Agreement and SDGs were adopted.
(Percentages are based on valid responses.)1. Public awareness Unit:%
World Oceania North America EU & UK Asia (All)Australia Oceania
(exceptAustralia)
Canada USA EU UK Japan India China Taiwan Korea AsianRegion*
Number of Valid Response [1813] [49] [35] [14] [176] [40] [136] [76] [112] [223] [178] [45] [86] [28] [46] [1017] [365] [52] [408] [82] [33] [77]
1. Definitely 17 22 17 36 18 20 17 11 13 23 24 18 16 7 7 17 7 35 25 9 3 14
2. somewhat 51 67 74 50 58 68 55 46 46 64 62 71 45 61 57 47 45 48 48 52 24 57
3. Cannot say either way 12 0 0 0 5 3 5 9 7 4 5 2 8 14 15 17 22 2 17 15 18 6
4. not really 17 8 9 7 16 8 19 29 29 8 8 9 23 18 22 17 22 13 9 23 36 19
5. Definitely not 3 2 0 7 3 3 4 5 4 1 1 0 7 0 0 3 5 2 1 1 18 3average 0.6 1.0 1.0 1.0 0.7 1.0 0.6 0.3 0.3 1.0 1.0 1.0 0.4 0.6 0.5 0.6 0.3 1.0 0.9 0.4 -0.4 0.6standard deviation 1.048 0.866 0.728 1.177 1.050 0.876 1.088 1.150 1.158 0.825 0.844 0.753 1.211 0.879 0.913 1.047 1.033 1.048 0.934 0.983 1.146 1.041
*excl. Japan, India, China, Taiwan, and Korea
2. Policies, legal system Unit:%
Number of Valid Response [1812] [49] [35] [14] [176] [40] [136] [76] [111] [223] [178] [45] [86] [28] [46] [1017] [365] [52] [408] [82] [33] [77]
1. Definitely 13 6 9 0 4 13 1 8 5 4 4 2 12 11 7 19 2 29 37 9 0 10
2. somewhat 40 43 37 57 31 35 29 38 35 61 58 71 45 29 46 37 30 42 40 59 12 42
3. Cannot say either way 17 6 6 7 9 3 10 20 12 11 11 11 13 25 20 20 26 12 17 13 30 17
4. not really 24 35 40 21 43 48 42 25 35 22 23 16 23 25 24 20 35 17 5 17 45 29
5. Definitely not 6 10 9 14 14 3 17 9 14 3 3 0 7 11 4 4 8 0 1 2 12 3average 0.3 0.0 0.0 0.1 -0.3 0.1 -0.4 0.1 -0.2 0.4 0.4 0.6 0.3 0.0 0.3 0.5 -0.2 0.8 1.1 0.5 -0.6 0.3standard deviation 1.148 1.208 1.224 1.207 1.162 1.207 1.127 1.150 1.185 0.959 0.996 0.780 1.161 1.201 1.042 1.126 1.008 1.043 0.917 0.958 0.867 1.074
*excl. Japan, India, China, Taiwan, and Korea
3. Funds, human resources, technologies and facilities Unit:%
Number of Valid Response [1811] [49] [35] [14] [176] [40] [136] [76] [111] [223] [178] [45] [86] [28] [46] [1016] [365] [52] [408] [81] [33] [77]
1. Definitely 11 14 17 7 5 10 3 1 5 9 8 9 16 14 13 13 5 15 25 1 3 12
2. somewhat 43 53 54 50 50 40 53 39 41 52 53 51 38 50 48 40 33 50 46 56 3 39
3. Cannot say either way 21 10 11 7 12 18 10 25 17 17 19 11 17 7 17 24 32 13 20 22 24 19
4. not really 21 16 11 29 28 30 27 25 32 18 16 29 24 25 20 19 26 17 8 20 55 27
5. Definitely not 4 6 6 7 6 3 7 9 5 3 4 0 3 4 2 3 5 4 1 1 15 3average 0.4 0.5 0.7 0.2 0.2 0.3 0.2 0.0 0.1 0.4 0.5 0.4 0.4 0.5 0.5 0.4 0.1 0.6 0.8 0.4 -0.8 0.3standard deviation 1.055 1.120 1.083 1.188 1.074 1.080 1.076 1.039 1.064 0.989 0.986 1.009 1.130 1.138 1.027 1.044 0.989 1.074 0.932 0.856 0.867 1.077
*excl. Japan, India, China, Taiwan, and Korea
Question 2-2 Where do you see signs of improvement? Please choose one category from Table 1 on page 33 which shows a list of "Environmental issues to be taken into account".
(Percentages are based on valid responses.) Unit:%World Oceania North America Western Europe Asia (All)
Australia Oceania(except
Australia)
Canada USA UK Japan India China Taiwan Korea AsianRegion*
Number of Valid Response [1813] [49] [35] [14] [176] [40] [136] [76] [112] [223] [178] [45] [86] [28] [46] [1017] [365] [52] [408] [82] [33] [77]
1. Climate Change 27 41 43 36 47 43 48 24 21 44 40 60 49 32 35 18 21 38 13 7 27 342. Biosphere Integrity (Biodiversity)
8 10 9 14 4 5 4 16 6 9 11 2 13 11 24 7 4 8 7 4 6 223. Land-System Change (Land Use)
3 2 3 0 1 0 1 3 5 1 1 2 3 4 4 4 1 6 6 4 3 34. Biochemical flows
(Pollution/Contamination)7 6 9 0 3 0 4 5 4 7 8 2 3 0 2 9 12 4 11 2 6 3
5. Water Resources 5 4 0 14 2 3 1 5 6 2 2 2 2 14 7 5 2 8 8 6 3 8
6. Population 3 0 0 0 2 0 2 4 3 2 2 0 6 0 2 3 2 8 4 4 0 0
7. Food 2 0 0 0 3 5 3 3 2 2 2 0 3 0 0 2 2 4 3 0 0 08. Lifestyle
(Consumption Habits)14 8 6 14 11 18 10 12 18 10 12 2 3 14 11 17 23 2 18 7 21 4
9. Society, Economy andEnvironment, Policies, Measures
14 12 11 14 7 15 4 11 13 15 14 18 7 18 7 17 13 13 21 23 6 18
No sign of improvement at all 16 16 20 7 20 13 22 18 22 8 7 11 9 7 9 17 22 10 10 43 27 9*excl. Japan, India, China, Taiwan, and Korea
CentralAmerica& TheCarribean
SouthAmerica
Africa MiddleEast
EasternEurope
& formerSovietUnion
2020データブック
Question 2-1 Do you think that we are shifting to a decarbonized society ?
MiddleEast
EasternEurope
& formerSovietUnion
CentralAmerica& TheCarribean
SouthAmerica
Africa
2. Do you see any signs of improvement in the approach to global environmental issues? Please answer these questions from the following three viewpoints in comparison with the situation before 2015 when the Paris Agreement and SDGs were adopted.
1. Public awareness (Percentages are based on valid responses.)
2. Policies, legal system
3. Social Infrastructure (Funds, human resources, technologies and facilities)
Question 2-2 Where do you see signs of improvement? Please choose one category from Table 1 on page 33
which shows a list of "Environmental issues to be taken into account".
(Percentages are based on valid responses.)
Western Europe (except UK)
Western Europe (except UK)
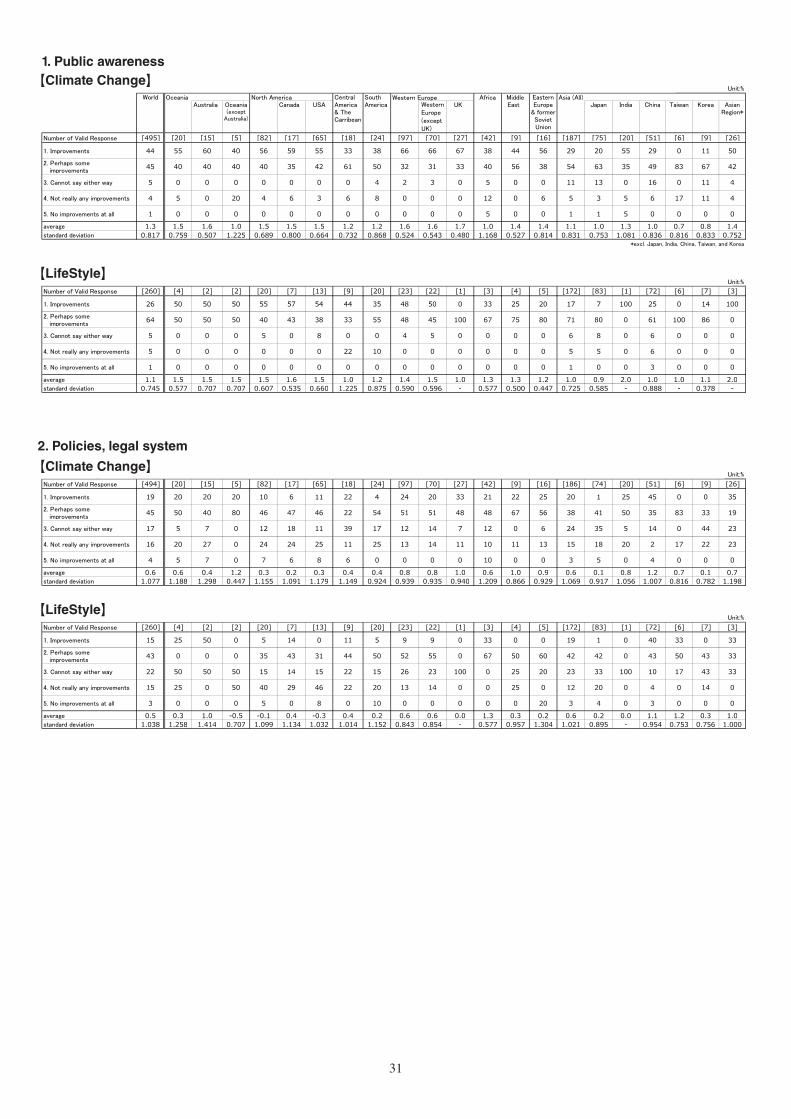
31
1. Public awareness【Climate Change】 Unit:%
World Oceania North America EU & UK Asia (All)Australia Oceania
(exceptAustralia)
Canada USA EU UK Japan India China Taiwan Korea AsianRegion*
Number of Valid Response [495] [20] [15] [5] [82] [17] [65] [18] [24] [97] [70] [27] [42] [9] [16] [187] [75] [20] [51] [6] [9] [26]
1. Improvements 44 55 60 40 56 59 55 33 38 66 66 67 38 44 56 29 20 55 29 0 11 502. Perhaps some improvements
45 40 40 40 40 35 42 61 50 32 31 33 40 56 38 54 63 35 49 83 67 42
3. Cannot say either way 5 0 0 0 0 0 0 0 4 2 3 0 5 0 0 11 13 0 16 0 11 4
4. Not really any improvements 4 5 0 20 4 6 3 6 8 0 0 0 12 0 6 5 3 5 6 17 11 4
5. No improvements at all 1 0 0 0 0 0 0 0 0 0 0 0 5 0 0 1 1 5 0 0 0 0average 1.3 1.5 1.6 1.0 1.5 1.5 1.5 1.2 1.2 1.6 1.6 1.7 1.0 1.4 1.4 1.1 1.0 1.3 1.0 0.7 0.8 1.4standard deviation 0.817 0.759 0.507 1.225 0.689 0.800 0.664 0.732 0.868 0.524 0.543 0.480 1.168 0.527 0.814 0.831 0.753 1.081 0.836 0.816 0.833 0.752
*excl. Japan, India, China, Taiwan, and Korea
【LifeStyle】 Unit:%
Number of Valid Response [260] [4] [2] [2] [20] [7] [13] [9] [20] [23] [22] [1] [3] [4] [5] [172] [83] [1] [72] [6] [7] [3]
1. Improvements 26 50 50 50 55 57 54 44 35 48 50 0 33 25 20 17 7 100 25 0 14 1002. Perhaps some improvements
64 50 50 50 40 43 38 33 55 48 45 100 67 75 80 71 80 0 61 100 86 0
3. Cannot say either way 5 0 0 0 5 0 8 0 0 4 5 0 0 0 0 6 8 0 6 0 0 0
4. Not really any improvements 5 0 0 0 0 0 0 22 10 0 0 0 0 0 0 5 5 0 6 0 0 0
5. No improvements at all 1 0 0 0 0 0 0 0 0 0 0 0 0 0 0 1 0 0 3 0 0 0average 1.1 1.5 1.5 1.5 1.5 1.6 1.5 1.0 1.2 1.4 1.5 1.0 1.3 1.3 1.2 1.0 0.9 2.0 1.0 1.0 1.1 2.0standard deviation 0.745 0.577 0.707 0.707 0.607 0.535 0.660 1.225 0.875 0.590 0.596 - 0.577 0.500 0.447 0.725 0.585 - 0.888 - 0.378 -
2. Policies, legal system【Climate Change】 Unit:%
Number of Valid Response [494] [20] [15] [5] [82] [17] [65] [18] [24] [97] [70] [27] [42] [9] [16] [186] [74] [20] [51] [6] [9] [26]
1. Improvements 19 20 20 20 10 6 11 22 4 24 20 33 21 22 25 20 1 25 45 0 0 352. Perhaps some improvements
45 50 40 80 46 47 46 22 54 51 51 48 48 67 56 38 41 50 35 83 33 19
3. Cannot say either way 17 5 7 0 12 18 11 39 17 12 14 7 12 0 6 24 35 5 14 0 44 23
4. Not really any improvements 16 20 27 0 24 24 25 11 25 13 14 11 10 11 13 15 18 20 2 17 22 23
5. No improvements at all 4 5 7 0 7 6 8 6 0 0 0 0 10 0 0 3 5 0 4 0 0 0average 0.6 0.6 0.4 1.2 0.3 0.2 0.3 0.4 0.4 0.8 0.8 1.0 0.6 1.0 0.9 0.6 0.1 0.8 1.2 0.7 0.1 0.7standard deviation 1.077 1.188 1.298 0.447 1.155 1.091 1.179 1.149 0.924 0.939 0.935 0.940 1.209 0.866 0.929 1.069 0.917 1.056 1.007 0.816 0.782 1.198
【LifeStyle】 Unit:%
Number of Valid Response [260] [4] [2] [2] [20] [7] [13] [9] [20] [23] [22] [1] [3] [4] [5] [172] [83] [1] [72] [6] [7] [3]
1. Improvements 15 25 50 0 5 14 0 11 5 9 9 0 33 0 0 19 1 0 40 33 0 332. Perhaps some improvements
43 0 0 0 35 43 31 44 50 52 55 0 67 50 60 42 42 0 43 50 43 33
3. Cannot say either way 22 50 50 50 15 14 15 22 15 26 23 100 0 25 20 23 33 100 10 17 43 33
4. Not really any improvements 15 25 0 50 40 29 46 22 20 13 14 0 0 25 0 12 20 0 4 0 14 0
5. No improvements at all 3 0 0 0 5 0 8 0 10 0 0 0 0 0 20 3 4 0 3 0 0 0average 0.5 0.3 1.0 -0.5 -0.1 0.4 -0.3 0.4 0.2 0.6 0.6 0.0 1.3 0.3 0.2 0.6 0.2 0.0 1.1 1.2 0.3 1.0standard deviation 1.038 1.258 1.414 0.707 1.099 1.134 1.032 1.014 1.152 0.843 0.854 - 0.577 0.957 1.304 1.021 0.895 - 0.954 0.753 0.756 1.000
2020データブック
2-2 Where do you see signs of improvement? Please choose one category from the Table 1 that shows a list of "Environmental issues to be taken into account".
EasternEurope
& formerSovietUnion
CentralAmerica& TheCarribean
SouthAmerica
Africa MiddleEast
1. Public awareness【Climate Change】 Unit:%
World Oceania North America EU & UK Asia (All)Australia Oceania
(exceptAustralia)
Canada USA EU UK Japan India China Taiwan Korea AsianRegion*
Number of Valid Response [495] [20] [15] [5] [82] [17] [65] [18] [24] [97] [70] [27] [42] [9] [16] [187] [75] [20] [51] [6] [9] [26]
1. Improvements 44 55 60 40 56 59 55 33 38 66 66 67 38 44 56 29 20 55 29 0 11 502. Perhaps some improvements
45 40 40 40 40 35 42 61 50 32 31 33 40 56 38 54 63 35 49 83 67 42
3. Cannot say either way 5 0 0 0 0 0 0 0 4 2 3 0 5 0 0 11 13 0 16 0 11 4
4. Not really any improvements 4 5 0 20 4 6 3 6 8 0 0 0 12 0 6 5 3 5 6 17 11 4
5. No improvements at all 1 0 0 0 0 0 0 0 0 0 0 0 5 0 0 1 1 5 0 0 0 0average 1.3 1.5 1.6 1.0 1.5 1.5 1.5 1.2 1.2 1.6 1.6 1.7 1.0 1.4 1.4 1.1 1.0 1.3 1.0 0.7 0.8 1.4standard deviation 0.817 0.759 0.507 1.225 0.689 0.800 0.664 0.732 0.868 0.524 0.543 0.480 1.168 0.527 0.814 0.831 0.753 1.081 0.836 0.816 0.833 0.752
*excl. Japan, India, China, Taiwan, and Korea
【LifeStyle】 Unit:%
Number of Valid Response [260] [4] [2] [2] [20] [7] [13] [9] [20] [23] [22] [1] [3] [4] [5] [172] [83] [1] [72] [6] [7] [3]
1. Improvements 26 50 50 50 55 57 54 44 35 48 50 0 33 25 20 17 7 100 25 0 14 1002. Perhaps some improvements
64 50 50 50 40 43 38 33 55 48 45 100 67 75 80 71 80 0 61 100 86 0
3. Cannot say either way 5 0 0 0 5 0 8 0 0 4 5 0 0 0 0 6 8 0 6 0 0 0
4. Not really any improvements 5 0 0 0 0 0 0 22 10 0 0 0 0 0 0 5 5 0 6 0 0 0
5. No improvements at all 1 0 0 0 0 0 0 0 0 0 0 0 0 0 0 1 0 0 3 0 0 0average 1.1 1.5 1.5 1.5 1.5 1.6 1.5 1.0 1.2 1.4 1.5 1.0 1.3 1.3 1.2 1.0 0.9 2.0 1.0 1.0 1.1 2.0standard deviation 0.745 0.577 0.707 0.707 0.607 0.535 0.660 1.225 0.875 0.590 0.596 - 0.577 0.500 0.447 0.725 0.585 - 0.888 - 0.378 -
2. Policies, legal system【Climate Change】 Unit:%
Number of Valid Response [494] [20] [15] [5] [82] [17] [65] [18] [24] [97] [70] [27] [42] [9] [16] [186] [74] [20] [51] [6] [9] [26]
1. Improvements 19 20 20 20 10 6 11 22 4 24 20 33 21 22 25 20 1 25 45 0 0 352. Perhaps some improvements
45 50 40 80 46 47 46 22 54 51 51 48 48 67 56 38 41 50 35 83 33 19
3. Cannot say either way 17 5 7 0 12 18 11 39 17 12 14 7 12 0 6 24 35 5 14 0 44 23
4. Not really any improvements 16 20 27 0 24 24 25 11 25 13 14 11 10 11 13 15 18 20 2 17 22 23
5. No improvements at all 4 5 7 0 7 6 8 6 0 0 0 0 10 0 0 3 5 0 4 0 0 0average 0.6 0.6 0.4 1.2 0.3 0.2 0.3 0.4 0.4 0.8 0.8 1.0 0.6 1.0 0.9 0.6 0.1 0.8 1.2 0.7 0.1 0.7standard deviation 1.077 1.188 1.298 0.447 1.155 1.091 1.179 1.149 0.924 0.939 0.935 0.940 1.209 0.866 0.929 1.069 0.917 1.056 1.007 0.816 0.782 1.198
【LifeStyle】 Unit:%
Number of Valid Response [260] [4] [2] [2] [20] [7] [13] [9] [20] [23] [22] [1] [3] [4] [5] [172] [83] [1] [72] [6] [7] [3]
1. Improvements 15 25 50 0 5 14 0 11 5 9 9 0 33 0 0 19 1 0 40 33 0 332. Perhaps some
improvements43 0 0 0 35 43 31 44 50 52 55 0 67 50 60 42 42 0 43 50 43 33
3. Cannot say either way 22 50 50 50 15 14 15 22 15 26 23 100 0 25 20 23 33 100 10 17 43 33
4. Not really any improvements 15 25 0 50 40 29 46 22 20 13 14 0 0 25 0 12 20 0 4 0 14 0
5. No improvements at all 3 0 0 0 5 0 8 0 10 0 0 0 0 0 20 3 4 0 3 0 0 0average 0.5 0.3 1.0 -0.5 -0.1 0.4 -0.3 0.4 0.2 0.6 0.6 0.0 1.3 0.3 0.2 0.6 0.2 0.0 1.1 1.2 0.3 1.0standard deviation 1.038 1.258 1.414 0.707 1.099 1.134 1.032 1.014 1.152 0.843 0.854 - 0.577 0.957 1.304 1.021 0.895 - 0.954 0.753 0.756 1.000
2020データブック
2-2 Where do you see signs of improvement? Please choose one category from the Table 1 that shows a list of "Environmental issues to be taken into account".
EasternEurope
& formerSovietUnion
CentralAmerica& TheCarribean
SouthAmerica
Africa MiddleEast
【Climate Change】
【LifeStyle】
2. Policies, legal system
1. Public awareness1. Public awareness【Climate Change】 Unit:%
World Oceania North America Asia (All)Australia Oceania
(exceptAustralia)
Canada USA Japan India China Taiwan Korea AsianRegion*
Number of Valid Response [495] [20] [15] [5] [82] [17] [65] [18] [24] [97] [70] [27] [42] [9] [16] [187] [75] [20] [51] [6] [9] [26]
1. Improvements 44 55 60 40 56 59 55 33 38 66 66 67 38 44 56 29 20 55 29 0 11 502. Perhaps some improvements
45 40 40 40 40 35 42 61 50 32 31 33 40 56 38 54 63 35 49 83 67 42
3. Cannot say either way 5 0 0 0 0 0 0 0 4 2 3 0 5 0 0 11 13 0 16 0 11 4
4. Not really any improvements 4 5 0 20 4 6 3 6 8 0 0 0 12 0 6 5 3 5 6 17 11 4
5. No improvements at all 1 0 0 0 0 0 0 0 0 0 0 0 5 0 0 1 1 5 0 0 0 0average 1.3 1.5 1.6 1.0 1.5 1.5 1.5 1.2 1.2 1.6 1.6 1.7 1.0 1.4 1.4 1.1 1.0 1.3 1.0 0.7 0.8 1.4standard deviation 0.817 0.759 0.507 1.225 0.689 0.800 0.664 0.732 0.868 0.524 0.543 0.480 1.168 0.527 0.814 0.831 0.753 1.081 0.836 0.816 0.833 0.752
*excl. Japan, India, China, Taiwan, and Korea
【LifeStyle】 Unit:%
Number of Valid Response [260] [4] [2] [2] [20] [7] [13] [9] [20] [23] [22] [1] [3] [4] [5] [172] [83] [1] [72] [6] [7] [3]
1. Improvements 26 50 50 50 55 57 54 44 35 48 50 0 33 25 20 17 7 100 25 0 14 1002. Perhaps some improvements
64 50 50 50 40 43 38 33 55 48 45 100 67 75 80 71 80 0 61 100 86 0
3. Cannot say either way 5 0 0 0 5 0 8 0 0 4 5 0 0 0 0 6 8 0 6 0 0 0
4. Not really any improvements 5 0 0 0 0 0 0 22 10 0 0 0 0 0 0 5 5 0 6 0 0 0
5. No improvements at all 1 0 0 0 0 0 0 0 0 0 0 0 0 0 0 1 0 0 3 0 0 0average 1.1 1.5 1.5 1.5 1.5 1.6 1.5 1.0 1.2 1.4 1.5 1.0 1.3 1.3 1.2 1.0 0.9 2.0 1.0 1.0 1.1 2.0standard deviation 0.745 0.577 0.707 0.707 0.607 0.535 0.660 1.225 0.875 0.590 0.596 - 0.577 0.500 0.447 0.725 0.585 - 0.888 - 0.378 -
2. Policies, legal system【Climate Change】 Unit:%
Number of Valid Response [494] [20] [15] [5] [82] [17] [65] [18] [24] [97] [70] [27] [42] [9] [16] [186] [74] [20] [51] [6] [9] [26]
1. Improvements 19 20 20 20 10 6 11 22 4 24 20 33 21 22 25 20 1 25 45 0 0 352. Perhaps some improvements
45 50 40 80 46 47 46 22 54 51 51 48 48 67 56 38 41 50 35 83 33 19
3. Cannot say either way 17 5 7 0 12 18 11 39 17 12 14 7 12 0 6 24 35 5 14 0 44 23
4. Not really any improvements 16 20 27 0 24 24 25 11 25 13 14 11 10 11 13 15 18 20 2 17 22 23
5. No improvements at all 4 5 7 0 7 6 8 6 0 0 0 0 10 0 0 3 5 0 4 0 0 0average 0.6 0.6 0.4 1.2 0.3 0.2 0.3 0.4 0.4 0.8 0.8 1.0 0.6 1.0 0.9 0.6 0.1 0.8 1.2 0.7 0.1 0.7standard deviation 1.077 1.188 1.298 0.447 1.155 1.091 1.179 1.149 0.924 0.939 0.935 0.940 1.209 0.866 0.929 1.069 0.917 1.056 1.007 0.816 0.782 1.198
【LifeStyle】 Unit:%
Number of Valid Response [260] [4] [2] [2] [20] [7] [13] [9] [20] [23] [22] [1] [3] [4] [5] [172] [83] [1] [72] [6] [7] [3]
1. Improvements 15 25 50 0 5 14 0 11 5 9 9 0 33 0 0 19 1 0 40 33 0 332. Perhaps some improvements
43 0 0 0 35 43 31 44 50 52 55 0 67 50 60 42 42 0 43 50 43 33
3. Cannot say either way 22 50 50 50 15 14 15 22 15 26 23 100 0 25 20 23 33 100 10 17 43 33
4. Not really any improvements 15 25 0 50 40 29 46 22 20 13 14 0 0 25 0 12 20 0 4 0 14 0
5. No improvements at all 3 0 0 0 5 0 8 0 10 0 0 0 0 0 20 3 4 0 3 0 0 0average 0.5 0.3 1.0 -0.5 -0.1 0.4 -0.3 0.4 0.2 0.6 0.6 0.0 1.3 0.3 0.2 0.6 0.2 0.0 1.1 1.2 0.3 1.0standard deviation 1.038 1.258 1.414 0.707 1.099 1.134 1.032 1.014 1.152 0.843 0.854 - 0.577 0.957 1.304 1.021 0.895 - 0.954 0.753 0.756 1.000
2020データブック
2-2 Where do you see signs of improvement? Please choose one category from the Table 1 that shows a list of "Environmental issues to be taken into account".
EasternEurope
& formerSovietUnion
CentralAmerica& TheCarribean
SouthAmerica
Western Europe Africa Middle UK East
【Climate Change】
1. Public awareness【Climate Change】 Unit:%
World Oceania North America EU & UK Asia (All)Australia Oceania
(exceptAustralia)
Canada USA EU UK Japan India China Taiwan Korea AsianRegion*
Number of Valid Response [495] [20] [15] [5] [82] [17] [65] [18] [24] [97] [70] [27] [42] [9] [16] [187] [75] [20] [51] [6] [9] [26]
1. Improvements 44 55 60 40 56 59 55 33 38 66 66 67 38 44 56 29 20 55 29 0 11 502. Perhaps some improvements
45 40 40 40 40 35 42 61 50 32 31 33 40 56 38 54 63 35 49 83 67 42
3. Cannot say either way 5 0 0 0 0 0 0 0 4 2 3 0 5 0 0 11 13 0 16 0 11 4
4. Not really any improvements 4 5 0 20 4 6 3 6 8 0 0 0 12 0 6 5 3 5 6 17 11 4
5. No improvements at all 1 0 0 0 0 0 0 0 0 0 0 0 5 0 0 1 1 5 0 0 0 0average 1.3 1.5 1.6 1.0 1.5 1.5 1.5 1.2 1.2 1.6 1.6 1.7 1.0 1.4 1.4 1.1 1.0 1.3 1.0 0.7 0.8 1.4standard deviation 0.817 0.759 0.507 1.225 0.689 0.800 0.664 0.732 0.868 0.524 0.543 0.480 1.168 0.527 0.814 0.831 0.753 1.081 0.836 0.816 0.833 0.752
*excl. Japan, India, China, Taiwan, and Korea
【LifeStyle】 Unit:%
Number of Valid Response [260] [4] [2] [2] [20] [7] [13] [9] [20] [23] [22] [1] [3] [4] [5] [172] [83] [1] [72] [6] [7] [3]
1. Improvements 26 50 50 50 55 57 54 44 35 48 50 0 33 25 20 17 7 100 25 0 14 1002. Perhaps some improvements
64 50 50 50 40 43 38 33 55 48 45 100 67 75 80 71 80 0 61 100 86 0
3. Cannot say either way 5 0 0 0 5 0 8 0 0 4 5 0 0 0 0 6 8 0 6 0 0 0
4. Not really any improvements 5 0 0 0 0 0 0 22 10 0 0 0 0 0 0 5 5 0 6 0 0 0
5. No improvements at all 1 0 0 0 0 0 0 0 0 0 0 0 0 0 0 1 0 0 3 0 0 0average 1.1 1.5 1.5 1.5 1.5 1.6 1.5 1.0 1.2 1.4 1.5 1.0 1.3 1.3 1.2 1.0 0.9 2.0 1.0 1.0 1.1 2.0standard deviation 0.745 0.577 0.707 0.707 0.607 0.535 0.660 1.225 0.875 0.590 0.596 - 0.577 0.500 0.447 0.725 0.585 - 0.888 - 0.378 -
2. Policies, legal system【Climate Change】 Unit:%
Number of Valid Response [494] [20] [15] [5] [82] [17] [65] [18] [24] [97] [70] [27] [42] [9] [16] [186] [74] [20] [51] [6] [9] [26]
1. Improvements 19 20 20 20 10 6 11 22 4 24 20 33 21 22 25 20 1 25 45 0 0 352. Perhaps some improvements
45 50 40 80 46 47 46 22 54 51 51 48 48 67 56 38 41 50 35 83 33 19
3. Cannot say either way 17 5 7 0 12 18 11 39 17 12 14 7 12 0 6 24 35 5 14 0 44 23
4. Not really any improvements 16 20 27 0 24 24 25 11 25 13 14 11 10 11 13 15 18 20 2 17 22 23
5. No improvements at all 4 5 7 0 7 6 8 6 0 0 0 0 10 0 0 3 5 0 4 0 0 0average 0.6 0.6 0.4 1.2 0.3 0.2 0.3 0.4 0.4 0.8 0.8 1.0 0.6 1.0 0.9 0.6 0.1 0.8 1.2 0.7 0.1 0.7standard deviation 1.077 1.188 1.298 0.447 1.155 1.091 1.179 1.149 0.924 0.939 0.935 0.940 1.209 0.866 0.929 1.069 0.917 1.056 1.007 0.816 0.782 1.198
【LifeStyle】 Unit:%
Number of Valid Response [260] [4] [2] [2] [20] [7] [13] [9] [20] [23] [22] [1] [3] [4] [5] [172] [83] [1] [72] [6] [7] [3]
1. Improvements 15 25 50 0 5 14 0 11 5 9 9 0 33 0 0 19 1 0 40 33 0 332. Perhaps some improvements
43 0 0 0 35 43 31 44 50 52 55 0 67 50 60 42 42 0 43 50 43 33
3. Cannot say either way 22 50 50 50 15 14 15 22 15 26 23 100 0 25 20 23 33 100 10 17 43 33
4. Not really any improvements 15 25 0 50 40 29 46 22 20 13 14 0 0 25 0 12 20 0 4 0 14 0
5. No improvements at all 3 0 0 0 5 0 8 0 10 0 0 0 0 0 20 3 4 0 3 0 0 0average 0.5 0.3 1.0 -0.5 -0.1 0.4 -0.3 0.4 0.2 0.6 0.6 0.0 1.3 0.3 0.2 0.6 0.2 0.0 1.1 1.2 0.3 1.0standard deviation 1.038 1.258 1.414 0.707 1.099 1.134 1.032 1.014 1.152 0.843 0.854 - 0.577 0.957 1.304 1.021 0.895 - 0.954 0.753 0.756 1.000
2020データブック
2-2 Where do you see signs of improvement? Please choose one category from the Table 1 that shows a list of "Environmental issues to be taken into account".
EasternEurope
& formerSovietUnion
CentralAmerica& TheCarribean
SouthAmerica
Africa MiddleEast
【LifeStyle】
Western Europe (except UK)
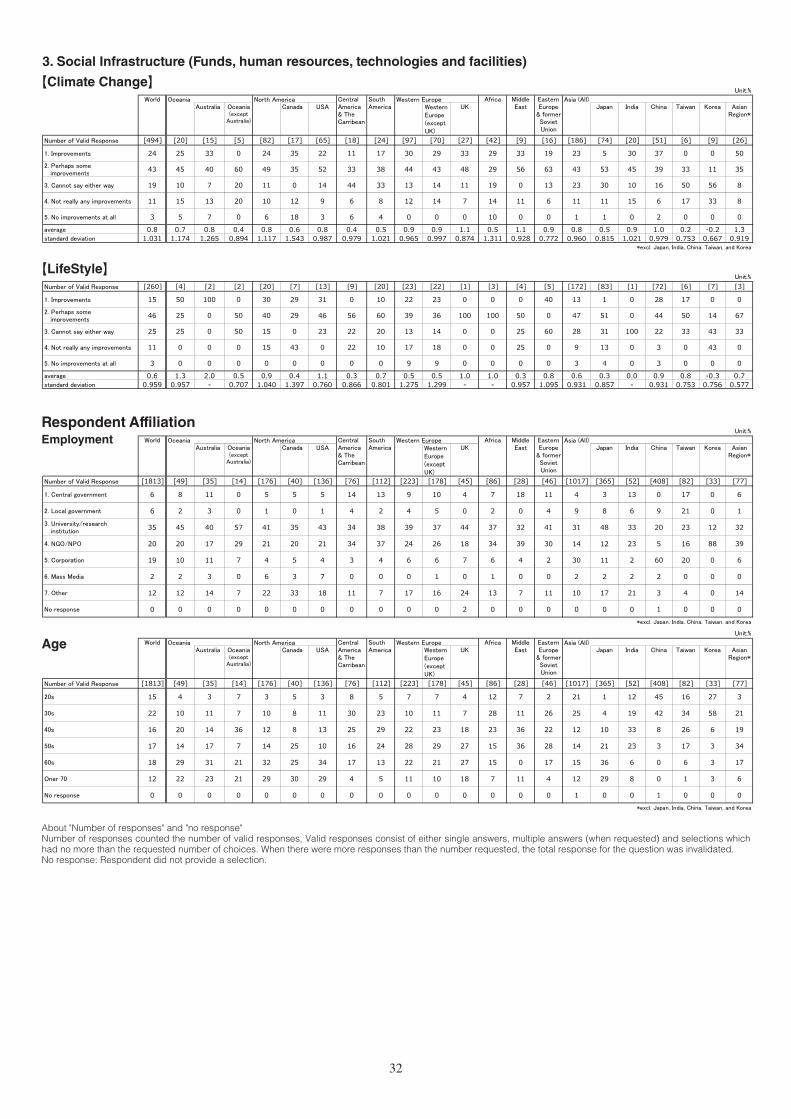
32
About "Number of responses" and "no response"Number of responses counted the number of valid responses, Valid responses consist of either single answers, multiple answers (when requested) and selections which had no more than the requested number of choices. When there were more responses than the number requested, the total response for the question was invalidated.No response: Respondent did not provide a selection.
2020データブック
2-2 Where do you see signs of improvement? Please choose one category from the Table 1 that shows a list of "Environmental issues to be taken into account".3. Funds, human resources, technologies and facilities【Climate Change】 Unit:%
World Oceania North America EU & UK Asia (All)Australia Oceania
(exceptAustralia)
Canada USA EU UK Japan India China Taiwan Korea AsianRegion*
Number of Valid Response [494] [20] [15] [5] [82] [17] [65] [18] [24] [97] [70] [27] [42] [9] [16] [186] [74] [20] [51] [6] [9] [26]
1. Improvements 24 25 33 0 24 35 22 11 17 30 29 33 29 33 19 23 5 30 37 0 0 502. Perhaps some improvements
43 45 40 60 49 35 52 33 38 44 43 48 29 56 63 43 53 45 39 33 11 35
3. Cannot say either way 19 10 7 20 11 0 14 44 33 13 14 11 19 0 13 23 30 10 16 50 56 8
4. Not really any improvements 11 15 13 20 10 12 9 6 8 12 14 7 14 11 6 11 11 15 6 17 33 8
5. No improvements at all 3 5 7 0 6 18 3 6 4 0 0 0 10 0 0 1 1 0 2 0 0 0average 0.8 0.7 0.8 0.4 0.8 0.6 0.8 0.4 0.5 0.9 0.9 1.1 0.5 1.1 0.9 0.8 0.5 0.9 1.0 0.2 -0.2 1.3standard deviation 1.031 1.174 1.265 0.894 1.117 1.543 0.987 0.979 1.021 0.965 0.997 0.874 1.311 0.928 0.772 0.960 0.815 1.021 0.979 0.753 0.667 0.919
*excl. Japan, India, China, Taiwan, and Korea
【LifeStyle】 Unit:%
Number of Valid Response [260] [4] [2] [2] [20] [7] [13] [9] [20] [23] [22] [1] [3] [4] [5] [172] [83] [1] [72] [6] [7] [3]
1. Improvements 15 50 100 0 30 29 31 0 10 22 23 0 0 0 40 13 1 0 28 17 0 02. Perhaps some improvements
46 25 0 50 40 29 46 56 60 39 36 100 100 50 0 47 51 0 44 50 14 67
3. Cannot say either way 25 25 0 50 15 0 23 22 20 13 14 0 0 25 60 28 31 100 22 33 43 33
4. Not really any improvements 11 0 0 0 15 43 0 22 10 17 18 0 0 25 0 9 13 0 3 0 43 0
5. No improvements at all 3 0 0 0 0 0 0 0 0 9 9 0 0 0 0 3 4 0 3 0 0 0average 0.6 1.3 2.0 0.5 0.9 0.4 1.1 0.3 0.7 0.5 0.5 1.0 1.0 0.3 0.8 0.6 0.3 0.0 0.9 0.8 -0.3 0.7standard deviation 0.959 0.957 - 0.707 1.040 1.397 0.760 0.866 0.801 1.275 1.299 - - 0.957 1.095 0.931 0.857 - 0.931 0.753 0.756 0.577
Respondent AffiliationEmployment Unit:%
World Oceania North America EU & UK Asia (All)Australia Oceania
(exceptAustralia)
Canada USA EU UK Japan India China Taiwan Korea AsianRegion*
Number of Valid Response [1813] [49] [35] [14] [176] [40] [136] [76] [112] [223] [178] [45] [86] [28] [46] [1017] [365] [52] [408] [82] [33] [77]
1. Central government 6 8 11 0 5 5 5 14 13 9 10 4 7 18 11 4 3 13 0 17 0 6
2. Local government 6 2 3 0 1 0 1 4 2 4 5 0 2 0 4 9 8 6 9 21 0 1
3. University/researchinstitution
35 45 40 57 41 35 43 34 38 39 37 44 37 32 41 31 48 33 20 23 12 32
4. NGO/NPO 20 20 17 29 21 20 21 34 37 24 26 18 34 39 30 14 12 23 5 16 88 39
5. Corporation 19 10 11 7 4 5 4 3 4 6 6 7 6 4 2 30 11 2 60 20 0 6
6. Mass Media 2 2 3 0 6 3 7 0 0 0 1 0 1 0 0 2 2 2 2 0 0 0
7. Other 12 12 14 7 22 33 18 11 7 17 16 24 13 7 11 10 17 21 3 4 0 14
No response 0 0 0 0 0 0 0 0 0 0 0 2 0 0 0 0 0 0 1 0 0 0*excl. Japan, India, China, Taiwan, and Korea
Age Unit:%
World Oceania North America Western Europe Asia (All)Australia Oceania
(exceptAustralia)
Canada USA UK Japan India China Taiwan Korea AsianRegion*
Number of Valid Response [1813] [49] [35] [14] [176] [40] [136] [76] [112] [223] [178] [45] [86] [28] [46] [1017] [365] [52] [408] [82] [33] [77]
20s 15 4 3 7 3 5 3 8 5 7 7 4 12 7 2 21 1 12 45 16 27 3
30s 22 10 11 7 10 8 11 30 23 10 11 7 28 11 26 25 4 19 42 34 58 21
40s 16 20 14 36 12 8 13 25 29 22 23 18 23 36 22 12 10 33 8 26 6 19
50s 17 14 17 7 14 25 10 16 24 28 29 27 15 36 28 14 21 23 3 17 3 34
60s 18 29 31 21 32 25 34 17 13 22 21 27 15 0 17 15 36 6 0 6 3 17
Oner 70 12 22 23 21 29 30 29 4 5 11 10 18 7 11 4 12 29 8 0 1 3 6
No response 0 0 0 0 0 0 0 0 0 0 0 0 0 0 0 1 0 0 1 0 0 0*excl. Japan, India, China, Taiwan, and Korea
No response: Respondent did not provide a selection.
CentralAmerica& TheCarribean
SouthAmerica
Africa MiddleEast
EasternEurope
& formerSovietUnion
About "Number of responses" and "no response"
Number of responses counted the number of valid responses, Valid responses consist of either single answers, multiple answers (When requested) and selections which had no more than the requested number of choices. When there were more responses than the numberrequested, the total response for the question was invalidated.
EasternEurope
& formerSovietUnion
CentralAmerica& TheCarribean
SouthAmerica
Africa MiddleEast
CentralAmerica& TheCarribean
SouthAmerica
Africa MiddleEast
EasternEurope
& formerSovietUnion
Age
2020データブック
2-2 Where do you see signs of improvement? Please choose one category from the Table 1 that shows a list of "Environmental issues to be taken into account".3. Funds, human resources, technologies and facilities【Climate Change】 Unit:%
World Oceania North America EU & UK Asia (All)Australia Oceania
(exceptAustralia)
Canada USA EU UK Japan India China Taiwan Korea AsianRegion*
Number of Valid Response [494] [20] [15] [5] [82] [17] [65] [18] [24] [97] [70] [27] [42] [9] [16] [186] [74] [20] [51] [6] [9] [26]
1. Improvements 24 25 33 0 24 35 22 11 17 30 29 33 29 33 19 23 5 30 37 0 0 502. Perhaps some improvements
43 45 40 60 49 35 52 33 38 44 43 48 29 56 63 43 53 45 39 33 11 35
3. Cannot say either way 19 10 7 20 11 0 14 44 33 13 14 11 19 0 13 23 30 10 16 50 56 8
4. Not really any improvements 11 15 13 20 10 12 9 6 8 12 14 7 14 11 6 11 11 15 6 17 33 8
5. No improvements at all 3 5 7 0 6 18 3 6 4 0 0 0 10 0 0 1 1 0 2 0 0 0average 0.8 0.7 0.8 0.4 0.8 0.6 0.8 0.4 0.5 0.9 0.9 1.1 0.5 1.1 0.9 0.8 0.5 0.9 1.0 0.2 -0.2 1.3standard deviation 1.031 1.174 1.265 0.894 1.117 1.543 0.987 0.979 1.021 0.965 0.997 0.874 1.311 0.928 0.772 0.960 0.815 1.021 0.979 0.753 0.667 0.919
*excl. Japan, India, China, Taiwan, and Korea
【LifeStyle】 Unit:%
Number of Valid Response [260] [4] [2] [2] [20] [7] [13] [9] [20] [23] [22] [1] [3] [4] [5] [172] [83] [1] [72] [6] [7] [3]
1. Improvements 15 50 100 0 30 29 31 0 10 22 23 0 0 0 40 13 1 0 28 17 0 02. Perhaps some improvements
46 25 0 50 40 29 46 56 60 39 36 100 100 50 0 47 51 0 44 50 14 67
3. Cannot say either way 25 25 0 50 15 0 23 22 20 13 14 0 0 25 60 28 31 100 22 33 43 33
4. Not really any improvements 11 0 0 0 15 43 0 22 10 17 18 0 0 25 0 9 13 0 3 0 43 0
5. No improvements at all 3 0 0 0 0 0 0 0 0 9 9 0 0 0 0 3 4 0 3 0 0 0average 0.6 1.3 2.0 0.5 0.9 0.4 1.1 0.3 0.7 0.5 0.5 1.0 1.0 0.3 0.8 0.6 0.3 0.0 0.9 0.8 -0.3 0.7standard deviation 0.959 0.957 - 0.707 1.040 1.397 0.760 0.866 0.801 1.275 1.299 - - 0.957 1.095 0.931 0.857 - 0.931 0.753 0.756 0.577
Respondent AffiliationEmployment Unit:%
World Oceania North America Western Europe Asia (All)Australia Oceania
(exceptAustralia)
Canada USA UK Japan India China Taiwan Korea AsianRegion*
Number of Valid Response [1813] [49] [35] [14] [176] [40] [136] [76] [112] [223] [178] [45] [86] [28] [46] [1017] [365] [52] [408] [82] [33] [77]
1. Central government 6 8 11 0 5 5 5 14 13 9 10 4 7 18 11 4 3 13 0 17 0 6
2. Local government 6 2 3 0 1 0 1 4 2 4 5 0 2 0 4 9 8 6 9 21 0 1
3. University/researchinstitution
35 45 40 57 41 35 43 34 38 39 37 44 37 32 41 31 48 33 20 23 12 32
4. NGO/NPO 20 20 17 29 21 20 21 34 37 24 26 18 34 39 30 14 12 23 5 16 88 39
5. Corporation 19 10 11 7 4 5 4 3 4 6 6 7 6 4 2 30 11 2 60 20 0 6
6. Mass Media 2 2 3 0 6 3 7 0 0 0 1 0 1 0 0 2 2 2 2 0 0 0
7. Other 12 12 14 7 22 33 18 11 7 17 16 24 13 7 11 10 17 21 3 4 0 14
No response 0 0 0 0 0 0 0 0 0 0 0 2 0 0 0 0 0 0 1 0 0 0*excl. Japan, India, China, Taiwan, and Korea
Age Unit:%
World Oceania North America EU & UK Asia (All)Australia Oceania
(exceptAustralia)
Canada USA EU UK Japan India China Taiwan Korea AsianRegion*
Number of Valid Response [1813] [49] [35] [14] [176] [40] [136] [76] [112] [223] [178] [45] [86] [28] [46] [1017] [365] [52] [408] [82] [33] [77]
20s 15 4 3 7 3 5 3 8 5 7 7 4 12 7 2 21 1 12 45 16 27 3
30s 22 10 11 7 10 8 11 30 23 10 11 7 28 11 26 25 4 19 42 34 58 21
40s 16 20 14 36 12 8 13 25 29 22 23 18 23 36 22 12 10 33 8 26 6 19
50s 17 14 17 7 14 25 10 16 24 28 29 27 15 36 28 14 21 23 3 17 3 34
60s 18 29 31 21 32 25 34 17 13 22 21 27 15 0 17 15 36 6 0 6 3 17
Oner 70 12 22 23 21 29 30 29 4 5 11 10 18 7 11 4 12 29 8 0 1 3 6
No response 0 0 0 0 0 0 0 0 0 0 0 0 0 0 0 1 0 0 1 0 0 0*excl. Japan, India, China, Taiwan, and Korea
No response: Respondent did not provide a selection.
CentralAmerica& TheCarribean
SouthAmerica
Africa MiddleEast
EasternEurope
& formerSovietUnion
About "Number of responses" and "no response"
Number of responses counted the number of valid responses, Valid responses consist of either single answers, multiple answers (When requested) and selections which had no more than the requested number of choices. When there were more responses than the numberrequested, the total response for the question was invalidated.
EasternEurope
& formerSovietUnion
CentralAmerica& TheCarribean
SouthAmerica
Africa MiddleEast
CentralAmerica& TheCarribean
SouthAmerica
Africa MiddleEast
EasternEurope
& formerSovietUnion
Respondent AffiliationEmployment
3. Social Infrastructure (Funds, human resources, technologies and facilities)2020データブック
2-2 Where do you see signs of improvement? Please choose one category from the Table 1 that shows a list of "Environmental issues to be taken into account".3. Funds, human resources, technologies and facilities【Climate Change】 Unit:%
World Oceania North America EU & UK Asia (All)Australia Oceania
(exceptAustralia)
Canada USA EU UK Japan India China Taiwan Korea AsianRegion*
Number of Valid Response [494] [20] [15] [5] [82] [17] [65] [18] [24] [97] [70] [27] [42] [9] [16] [186] [74] [20] [51] [6] [9] [26]
1. Improvements 24 25 33 0 24 35 22 11 17 30 29 33 29 33 19 23 5 30 37 0 0 502. Perhaps some improvements
43 45 40 60 49 35 52 33 38 44 43 48 29 56 63 43 53 45 39 33 11 35
3. Cannot say either way 19 10 7 20 11 0 14 44 33 13 14 11 19 0 13 23 30 10 16 50 56 8
4. Not really any improvements 11 15 13 20 10 12 9 6 8 12 14 7 14 11 6 11 11 15 6 17 33 8
5. No improvements at all 3 5 7 0 6 18 3 6 4 0 0 0 10 0 0 1 1 0 2 0 0 0average 0.8 0.7 0.8 0.4 0.8 0.6 0.8 0.4 0.5 0.9 0.9 1.1 0.5 1.1 0.9 0.8 0.5 0.9 1.0 0.2 -0.2 1.3standard deviation 1.031 1.174 1.265 0.894 1.117 1.543 0.987 0.979 1.021 0.965 0.997 0.874 1.311 0.928 0.772 0.960 0.815 1.021 0.979 0.753 0.667 0.919
*excl. Japan, India, China, Taiwan, and Korea
【LifeStyle】 Unit:%
Number of Valid Response [260] [4] [2] [2] [20] [7] [13] [9] [20] [23] [22] [1] [3] [4] [5] [172] [83] [1] [72] [6] [7] [3]
1. Improvements 15 50 100 0 30 29 31 0 10 22 23 0 0 0 40 13 1 0 28 17 0 02. Perhaps some improvements
46 25 0 50 40 29 46 56 60 39 36 100 100 50 0 47 51 0 44 50 14 67
3. Cannot say either way 25 25 0 50 15 0 23 22 20 13 14 0 0 25 60 28 31 100 22 33 43 33
4. Not really any improvements 11 0 0 0 15 43 0 22 10 17 18 0 0 25 0 9 13 0 3 0 43 0
5. No improvements at all 3 0 0 0 0 0 0 0 0 9 9 0 0 0 0 3 4 0 3 0 0 0average 0.6 1.3 2.0 0.5 0.9 0.4 1.1 0.3 0.7 0.5 0.5 1.0 1.0 0.3 0.8 0.6 0.3 0.0 0.9 0.8 -0.3 0.7standard deviation 0.959 0.957 - 0.707 1.040 1.397 0.760 0.866 0.801 1.275 1.299 - - 0.957 1.095 0.931 0.857 - 0.931 0.753 0.756 0.577
Respondent AffiliationEmployment Unit:%
World Oceania North America EU & UK Asia (All)Australia Oceania
(exceptAustralia)
Canada USA EU UK Japan India China Taiwan Korea AsianRegion*
Number of Valid Response [1813] [49] [35] [14] [176] [40] [136] [76] [112] [223] [178] [45] [86] [28] [46] [1017] [365] [52] [408] [82] [33] [77]
1. Central government 6 8 11 0 5 5 5 14 13 9 10 4 7 18 11 4 3 13 0 17 0 6
2. Local government 6 2 3 0 1 0 1 4 2 4 5 0 2 0 4 9 8 6 9 21 0 1
3. University/researchinstitution
35 45 40 57 41 35 43 34 38 39 37 44 37 32 41 31 48 33 20 23 12 32
4. NGO/NPO 20 20 17 29 21 20 21 34 37 24 26 18 34 39 30 14 12 23 5 16 88 39
5. Corporation 19 10 11 7 4 5 4 3 4 6 6 7 6 4 2 30 11 2 60 20 0 6
6. Mass Media 2 2 3 0 6 3 7 0 0 0 1 0 1 0 0 2 2 2 2 0 0 0
7. Other 12 12 14 7 22 33 18 11 7 17 16 24 13 7 11 10 17 21 3 4 0 14
No response 0 0 0 0 0 0 0 0 0 0 0 2 0 0 0 0 0 0 1 0 0 0*excl. Japan, India, China, Taiwan, and Korea
Age Unit:%
World Oceania North America EU & UK Asia (All)Australia Oceania
(exceptAustralia)
Canada USA EU UK Japan India China Taiwan Korea AsianRegion*
Number of Valid Response [1813] [49] [35] [14] [176] [40] [136] [76] [112] [223] [178] [45] [86] [28] [46] [1017] [365] [52] [408] [82] [33] [77]
20s 15 4 3 7 3 5 3 8 5 7 7 4 12 7 2 21 1 12 45 16 27 3
30s 22 10 11 7 10 8 11 30 23 10 11 7 28 11 26 25 4 19 42 34 58 21
40s 16 20 14 36 12 8 13 25 29 22 23 18 23 36 22 12 10 33 8 26 6 19
50s 17 14 17 7 14 25 10 16 24 28 29 27 15 36 28 14 21 23 3 17 3 34
60s 18 29 31 21 32 25 34 17 13 22 21 27 15 0 17 15 36 6 0 6 3 17
Oner 70 12 22 23 21 29 30 29 4 5 11 10 18 7 11 4 12 29 8 0 1 3 6
No response 0 0 0 0 0 0 0 0 0 0 0 0 0 0 0 1 0 0 1 0 0 0*excl. Japan, India, China, Taiwan, and Korea
No response: Respondent did not provide a selection.
CentralAmerica& TheCarribean
SouthAmerica
Africa MiddleEast
EasternEurope
& formerSovietUnion
About "Number of responses" and "no response"
Number of responses counted the number of valid responses, Valid responses consist of either single answers, multiple answers (When requested) and selections which had no more than the requested number of choices. When there were more responses than the numberrequested, the total response for the question was invalidated.
EasternEurope
& formerSovietUnion
CentralAmerica& TheCarribean
SouthAmerica
Africa MiddleEast
CentralAmerica& TheCarribean
SouthAmerica
Africa MiddleEast
EasternEurope
& formerSovietUnion
【LifeStyle】
2020データブック
2-2 Where do you see signs of improvement? Please choose one category from the Table 1 that shows a list of "Environmental issues to be taken into account".3. Funds, human resources, technologies and facilities【Climate Change】 Unit:%
World Oceania North America Western Europe Asia (All)Australia Oceania
(exceptAustralia)
Canada USA UK Japan India China Taiwan Korea AsianRegion*
Number of Valid Response [494] [20] [15] [5] [82] [17] [65] [18] [24] [97] [70] [27] [42] [9] [16] [186] [74] [20] [51] [6] [9] [26]
1. Improvements 24 25 33 0 24 35 22 11 17 30 29 33 29 33 19 23 5 30 37 0 0 502. Perhaps some improvements
43 45 40 60 49 35 52 33 38 44 43 48 29 56 63 43 53 45 39 33 11 35
3. Cannot say either way 19 10 7 20 11 0 14 44 33 13 14 11 19 0 13 23 30 10 16 50 56 8
4. Not really any improvements 11 15 13 20 10 12 9 6 8 12 14 7 14 11 6 11 11 15 6 17 33 8
5. No improvements at all 3 5 7 0 6 18 3 6 4 0 0 0 10 0 0 1 1 0 2 0 0 0average 0.8 0.7 0.8 0.4 0.8 0.6 0.8 0.4 0.5 0.9 0.9 1.1 0.5 1.1 0.9 0.8 0.5 0.9 1.0 0.2 -0.2 1.3standard deviation 1.031 1.174 1.265 0.894 1.117 1.543 0.987 0.979 1.021 0.965 0.997 0.874 1.311 0.928 0.772 0.960 0.815 1.021 0.979 0.753 0.667 0.919
*excl. Japan, India, China, Taiwan, and Korea
【LifeStyle】 Unit:%
Number of Valid Response [260] [4] [2] [2] [20] [7] [13] [9] [20] [23] [22] [1] [3] [4] [5] [172] [83] [1] [72] [6] [7] [3]
1. Improvements 15 50 100 0 30 29 31 0 10 22 23 0 0 0 40 13 1 0 28 17 0 02. Perhaps some improvements
46 25 0 50 40 29 46 56 60 39 36 100 100 50 0 47 51 0 44 50 14 67
3. Cannot say either way 25 25 0 50 15 0 23 22 20 13 14 0 0 25 60 28 31 100 22 33 43 33
4. Not really any improvements 11 0 0 0 15 43 0 22 10 17 18 0 0 25 0 9 13 0 3 0 43 0
5. No improvements at all 3 0 0 0 0 0 0 0 0 9 9 0 0 0 0 3 4 0 3 0 0 0average 0.6 1.3 2.0 0.5 0.9 0.4 1.1 0.3 0.7 0.5 0.5 1.0 1.0 0.3 0.8 0.6 0.3 0.0 0.9 0.8 -0.3 0.7standard deviation 0.959 0.957 - 0.707 1.040 1.397 0.760 0.866 0.801 1.275 1.299 - - 0.957 1.095 0.931 0.857 - 0.931 0.753 0.756 0.577
Respondent AffiliationEmployment Unit:%
World Oceania North America EU & UK Asia (All)Australia Oceania
(exceptAustralia)
Canada USA EU UK Japan India China Taiwan Korea AsianRegion*
Number of Valid Response [1813] [49] [35] [14] [176] [40] [136] [76] [112] [223] [178] [45] [86] [28] [46] [1017] [365] [52] [408] [82] [33] [77]
1. Central government 6 8 11 0 5 5 5 14 13 9 10 4 7 18 11 4 3 13 0 17 0 6
2. Local government 6 2 3 0 1 0 1 4 2 4 5 0 2 0 4 9 8 6 9 21 0 1
3. University/researchinstitution
35 45 40 57 41 35 43 34 38 39 37 44 37 32 41 31 48 33 20 23 12 32
4. NGO/NPO 20 20 17 29 21 20 21 34 37 24 26 18 34 39 30 14 12 23 5 16 88 39
5. Corporation 19 10 11 7 4 5 4 3 4 6 6 7 6 4 2 30 11 2 60 20 0 6
6. Mass Media 2 2 3 0 6 3 7 0 0 0 1 0 1 0 0 2 2 2 2 0 0 0
7. Other 12 12 14 7 22 33 18 11 7 17 16 24 13 7 11 10 17 21 3 4 0 14
No response 0 0 0 0 0 0 0 0 0 0 0 2 0 0 0 0 0 0 1 0 0 0*excl. Japan, India, China, Taiwan, and Korea
Age Unit:%
World Oceania North America EU & UK Asia (All)Australia Oceania
(exceptAustralia)
Canada USA EU UK Japan India China Taiwan Korea AsianRegion*
Number of Valid Response [1813] [49] [35] [14] [176] [40] [136] [76] [112] [223] [178] [45] [86] [28] [46] [1017] [365] [52] [408] [82] [33] [77]
20s 15 4 3 7 3 5 3 8 5 7 7 4 12 7 2 21 1 12 45 16 27 3
30s 22 10 11 7 10 8 11 30 23 10 11 7 28 11 26 25 4 19 42 34 58 21
40s 16 20 14 36 12 8 13 25 29 22 23 18 23 36 22 12 10 33 8 26 6 19
50s 17 14 17 7 14 25 10 16 24 28 29 27 15 36 28 14 21 23 3 17 3 34
60s 18 29 31 21 32 25 34 17 13 22 21 27 15 0 17 15 36 6 0 6 3 17
Oner 70 12 22 23 21 29 30 29 4 5 11 10 18 7 11 4 12 29 8 0 1 3 6
No response 0 0 0 0 0 0 0 0 0 0 0 0 0 0 0 1 0 0 1 0 0 0*excl. Japan, India, China, Taiwan, and Korea
No response: Respondent did not provide a selection.
CentralAmerica& TheCarribean
SouthAmerica
Africa MiddleEast
EasternEurope
& formerSovietUnion
About "Number of responses" and "no response"
Number of responses counted the number of valid responses, Valid responses consist of either single answers, multiple answers (When requested) and selections which had no more than the requested number of choices. When there were more responses than the numberrequested, the total response for the question was invalidated.
EasternEurope
& formerSovietUnion
CentralAmerica& TheCarribean
SouthAmerica
Africa MiddleEast
CentralAmerica& TheCarribean
SouthAmerica
Africa MiddleEast
EasternEurope
& formerSovietUnion
【Climate Change】
Western Europe (except UK)
Western Europe (except UK)
Western Europe (except UK)

33
VI. Questionnaire as Distributed to Respondents
Table 1. Environmental issues to be taken into account:
No. Category Examples of Observable Changes in the Country or the Region in which You Reside
Planetary Boundaries (PB) Category by SDGs # (Sustainable Development Goals: SDGs)
1. Climate ChangeGlobal warming; CO2%, ocean acidification; climatic aberrations (droughts, torrential rains and flooding, severe storms, heavy snow, abnormal temperatures, desertification, etc.)
Climate change, Ocean acidification, Atmospheric aerosol loading, Stratospheric ozone depletion
2.Biosphere Integrity(Biodiversity)
Acceleration of species extinction rate; effects of contamination, climate change, land use
Genetic diversity, Functional diversity
3.Land-System Change(Land Use)
Change in the amount of forest cover remaining at the tropical, temperate and boreal biomes.Change in the amount of cropland
Land-system change
4.Biochemical flows (Pollution/Contamination)
Increase in river, ocean and soil pollution: eutrophication caused by excessive nitrogen and phosphorus and contamination by microplastics and chemical substances; atmospheric pollution: particulates suspended in the atmosphere, soot and chemical substances
Chemical polution, Nitrogen andphosphorous cycles
5. Water ResourcesDiminution of usable fresh water resources (depletion, contamination)Control and degeneration of green water quality (water contained in soil and used by plants)
Freshwater use
6. Population Population growth beyond what the Earth can support; aging of the population Related with almost all the PB
7. Food Diminution of food supply from land and oceans Related with almost all the PB
8.Lifestyles(Consumption Habits)
Transformation of lifestyles away from excessive consumption of resources like energy
Related with almost all the PB
9.Society, Economy and Environment, Policies, Measures
Establishing a green economy with environmental economics and accountingEnvironmental awareness at the individual and societal levels, progress of environmental education, Legal system, social foundation; poverty, governance; the status of women
Related with almost all the PB
Terms in blue are categories listed in Planetary boundaries: Will Steffen, Katherine Richardson, Johan Rockstrom et.al. Science 13 Feb 2015 vol. 347, issue 6223
To be continued
1. Awareness of the Crisis Facing Human Survival - Environmental Doomsday Clock
In Table 1, “Environmental issues to be taken into account” are shown. Keeping in mind the problems that the en-vironment faces at a global level, please select the three most pressing issues for the country or the region where you reside. Then, please rank them in the order of importance. Lastly, for each item, select a time using hours and minutes between 0:10 to 12:00, to indicate the level of crisis for that issue. For the purpose of calculating results, please select your times in units no smaller than 10 minutes.
------------ Example ------------ --------------- Answer ---------------Category Number TIME Category Number TIME
First ( 1 ) 9 : 30 First ( ) :(of the first magnitude) (of the first magnitude)
Second ( 5 ) 7 : 40 Second ( ) :(of the second magnitude) (of the second magnitude)
Third ( 3 ) 8 : 20 Third ( ) :(of the third magnitude) (of the third magnitude)
12
3
6
9
0:01〜 3:00Barely Concerned
3:01〜 6:00Slightly Concerned
9:01〜12:00Extremely Concerned
6:01〜 9:00Fairly Concerned
2. Do you see any signs of improvement in the approach to global environmental issues. Please answer these questions fromthe following three viewpoints in comparison with before 2015 when the Paris Agreement and SDGs were adopted:
2-1 Do you think we are shifting to a decarbonized society?
Definitely Somewhat Cannot say Not really Definitely noteither way
1. Public awareness A B C D E
2. Policies, legal system A B C D E
3. Funds, human resources, A B C D Etechnologies and facilities
2-2 Where do you see signs of improvement? Please choose one category from the Table 1 that shows a list of “Envi-ronmental issues to be taken into account”.Number of the category that shows signs of improvement: □ No sign of improvement at all
There are There are perhaps Cannot say There aren’t really There are noimprovements some improvements either way any improvements improvements at all
1. Public awareness A B C D E
2. Policies, legal system A B C D E
3. Funds, human resources, A B C D Etechnologies and facilities
-Regarding the calculation of the time on the Environmental Doomsday Clock:The time on the Environmental Doomsday Clock will be determined by taking the weighted average of the data. The issue ranked in first place will be weighted at 50%, second place at 30%, and third place at 20%. In the example shown, the time comes to 8:43.
Table 1. Environmental issues to be taken into account:
No. Category Examples of Observable Changes in the Country or the Region in which You Reside
Planetary Boundaries (PB) Category by SDGs # (Sustainable Development Goals: SDGs)
1. Climate ChangeGlobal warming; CO2%, ocean acidification; climatic aberrations (droughts,torrential rains and flooding, severe storms, heavy snow, abnormaltemperatures, desertification, etc.)
Climate change, Ocean acidification, Atmospheric aerosol loading, Stratospheric ozone depletion
2.Biosphere Integrity(Biodiversity)
Acceleration of species extinction rate; effects of contamination, climate change, land use
Genetic diversity, Functional diversity
3.Land-System Change(Land Use)
Change in the amount of forest cover remaining at the tropical, temperate and boreal biomes.Change in the amount of cropland
Land-system change
4.Biochemical flows (Pollution/Contamination)
Increase in river, ocean and soil pollution: eutrophication caused by excessive nitrogen and phosphorus and contamination by microplastics and chemical substances; atmospheric pollution: particulates suspended in the atmosphere, soot and chemical substances
Chemical polution, Nitrogen andphosphorous cycles
5. Water ResourcesDiminution of usable fresh water resources (depletion, contamination)Control and degeneration of green water quality (water contained in soil and used by plants)
Freshwater use
6. Population Population growth beyond what the Earth can support; aging of the population Related with almost all the PB
7. Food Diminution of food supply from land and oceans Related with almost all the PB
8.Lifestyles(Consumption Habits)
Transformation of lifestyles away from excessive consumption of resources like energy
Related with almost all the PB
9.Society, Economy and Environment, Policies, Measures
Establishing a green economy with environmental economics and accountingEnvironmental awareness at the individual and societal levels, progress of environmental education, Legal system, social foundation; poverty, governance; the status of women
Related with almost all the PB
Terms in blue are categories listed in Planetary boundaries: Will Steffen, Katherine Richardson, Johan Rockstrom et.al. Science 13 Feb 2015 vol. 347, issue 6223
To be continued
1. Awareness of the Crisis Facing Human Survival - Environmental Doomsday Clock
In Table 1, “Environmental issues to be taken into account” are shown. Keeping in mind the problems that the en-vironment faces at a global level, please select the three most pressing issues for the country or the region where you reside. Then, please rank them in the order of importance. Lastly, for each item, select a time using hours and minutes between 0:10 to 12:00, to indicate the level of crisis for that issue. For the purpose of calculating results, please select your times in units no smaller than 10 minutes.
------------ Example ------------ --------------- Answer ---------------Category Number TIME Category Number TIME
First ( 1 ) 9 : 30 First ( ) :(of the first magnitude) (of the first magnitude)
Second ( 5 ) 7 : 40 Second ( ) :(of the second magnitude) (of the second magnitude)
Third ( 3 ) 8 : 20 Third ( ) :(of the third magnitude) (of the third magnitude)
12
3
6
9
0:01〜 3:00Barely Concerned
3:01〜 6:00Slightly Concerned
9:01〜12:00Extremely Concerned
6:01〜 9:00Fairly Concerned
2. Do you see any signs of improvement in the approach to global environmental issues. Please answer these questions fromthe following three viewpoints in comparison with before 2015 when the Paris Agreement and SDGs were adopted:
2-1 Do you think we are shifting to a decarbonized society?
Definitely Somewhat Cannot say Not really Definitely noteither way
1. Public awareness A B C D E
2. Policies, legal system A B C D E
3. Funds, human resources, A B C D Etechnologies and facilities
2-2 Where do you see signs of improvement? Please choose one category from the Table 1 that shows a list of “Envi-ronmental issues to be taken into account”.Number of the category that shows signs of improvement: □ No sign of improvement at all
There are There are perhaps Cannot say There aren’t really There are noimprovements some improvements either way any improvements improvements at all
1. Public awareness A B C D E
2. Policies, legal system A B C D E
3. Funds, human resources, A B C D Etechnologies and facilities
-Regarding the calculation of the time on the Environmental Doomsday Clock:The time on the Environmental Doomsday Clock will be determined by taking the weighted average of the data. The issue ranked in first place will be weighted at 50%, second place at 30%, and third place at 20%. In the example shown, the time comes to 8:43.
Table 1. Environmental issues to be taken into accountTable 1. Environmental issues to be taken into account:
No. Category Examples of Observable Changes in the Country or the Region in which You Reside
Planetary Boundaries (PB) Category by SDGs # (Sustainable Development Goals: SDGs)
1. Climate ChangeGlobal warming; CO2torrential rains and flooding, severe storms, heavy snow, abnormal
Climate change, Oceanacidification, Atmosphericaerosol loading, Stratosphericozone depletion
2.Biosphere Integrity(Biodiversity)
n, climate change, land use
Genetic diversity,Functional diversity
3.Land-System Change(Land Use)
Change in the amount of forest cover remaining at the tropical, temperate and boreal biomes.Change in the amount of cropland
Land-system change
4.Biochemical
Contamination)
Increase in river, ocean and soil pollution: eutrophication caused by excessivenitrogen and phosphorus and contamination by microplastics and chemicalsubstances; atmospheric pollution: particulates suspended in the atmosphere,soot and chemical substances
Chemical polution, Nitrogen andphosphorous cycles
5. Water ResourcesDiminution of usable fresh water resources (depletion, contamination)Control and degeneration of green water quality (water contained in soil and used by plants)
Freshwater use
6. Population Population growth beyond what the Earth can support; aging of the population Related with almost all the PB
7. Food Diminution of food supply from land and oceans Related with almost all the PB
8.Lifestyles(ConsumptionHabits)
Transformation of lifestyles away from excessive consumption of resources likeenergy
Related with almost all the PB
9.Society, Economy and Environment, Policies, Measures
Establishing a green economy with environmental economics and accountingEnvironmental awareness at the individual and societal levels, progress of environmental education, Legal system, social foundation; poverty, governance; the status of women
Related with almost all the PB
Terms in blue are categories listed in Planetary boundaries:
To be continued
1. Awareness of the Crisis Facing Human Survival - Environmental Doomsday Clock
In Table 1, “Environmental issues to be taken into account” are shown. Keeping in mind the problems that the en-vironment faces at a global level, please select the three most pressing issues for the country or the region where you reside. Then, please rank them in the order of importance. Lastly, for each item, select a time using hours and minutes between 0:10 to 12:00, to indicate the level of crisis for that issue. For the purpose of calculating results, please select your times in units no smaller than 10 minutes.
------------ Example ------------ --------------- Answer ---------------Category Number TIME Category Number TIME
First ( 1 ) 9 : 30 First ( ) :)
Second ( 5 ) 7 : 40 Second ( ) :(of the second magnitude) (of the second magnitude)
Third ( 3 ) 8 : 20 Third ( ) :(of the third magnitude) (of the third magnitude)
12
3
6
9
0:01~ 3:00Barely Concerned
3:01~ 6:00Slightly Concerned
9:01~12:00Extremely Concerned
6:01~ 9:00Fairly Concerned
2. Do you see any signs of improvement in the approach to global environmental issues. Please answer these questions fromthe following three viewpoints in comparison with the situation before 2015 when the Paris Agreement and SDGs were adopted:
2-1 Do you think we are shifting to a decarbonized society?
Def Not really Def noteither way
1. Public Awareness A B C D E
2. Policies, Legal System A B C D E
3. Social Infrastructure(Funds, human resources,technologies and facilities)
A B C D E
2-2 Where do you see signs of improvement? Please choose one category from the Table 1 that shows a list of “Envi-ronmental issues to be taken into account”.Number of the category that shows signs of improvement: □ No sign of improvement at all
are really are noimprovements some improvements either way any improvements improvements at all
1. Public Awareness A B C D E
2. Policies, Legal System A B C D E
3. Social Infrastructure(Funds, human resources,technologies and facilities)
A B C D E
-About the calculation of the time on the Environmental Doomsday Clock:The time place will be weighted at 50%, second place at 30%, and third place at 20%. In the example shown, the time comes to 8:43.
Global warming: Increase in CO2%, Ocean acidification,Climatic aberrations (droughts, torrential rains and flooding, severe storms, heavy snow, abnormal temperatures, desertification, etc.)
Acceleration of species extinction rate(Effects of contamination, climate change, land use)
Change in the amount of forest cover remaining at the tropical, temperate and boreal biomes, Change in the amount of cropland
Increase in river, ocean, and soil pollution: eutrophication caused by exces-sive nitrogen and phosphorus, contamination by microplastics and chemical substances; Atmospheric pollution: particulates suspended in the atmo-sphere, soot, and chemical substances
Diminution of usable fresh water resources (depletion, contamination), Control and degeneration of green water quality (water contained in soil and used by plants)
Population growth beyond what the Earth can support, Aging of the population
Diminution of food supply from land and sea
Transformation of lifestyle away from excessive consumption of resources like energy
Establishing a green economy with environmental economics and account-ing, Environmental awareness at the individual and societal levels, Progress of environmental education, Legal system, Social foundation, Poverty, Governance, Status of women

34
Table 1. Environmental issues to be taken into account:
No. Category Examples of Observable Changes in the Country or the Region in which You Reside
Planetary Boundaries (PB) Category by SDGs # (Sustainable Development Goals: SDGs)
1. Climate ChangeGlobal warming; CO2%, ocean acidification; climatic aberrations (droughts,torrential rains and flooding, severe storms, heavy snow, abnormaltemperatures, desertification, etc.)
Climate change, Oceanacidification, Atmosphericaerosol loading, Stratospheric ozone depletion
2.Biosphere Integrity(Biodiversity)
Acceleration of species extinction rate; effects of contamination, climate change, land use
Genetic diversity, Functional diversity
3.Land-System Change(Land Use)
Change in the amount of forest cover remaining at the tropical, temperate and boreal biomes.Change in the amount of cropland
Land-system change
4.Biochemical flows (Pollution/Contamination)
Increase in river, ocean and soil pollution: eutrophication caused by excessive nitrogen and phosphorus and contamination by microplastics and chemical substances; atmospheric pollution: particulates suspended in the atmosphere, soot and chemical substances
Chemical polution, Nitrogen andphosphorous cycles
5. Water ResourcesDiminution of usable fresh water resources (depletion, contamination)Control and degeneration of green water quality (water contained in soil and used by plants)
Freshwater use
6. Population Population growth beyond what the Earth can support; aging of the population Related with almost all the PB
7. Food Diminution of food supply from land and oceans Related with almost all the PB
8.Lifestyles(Consumption Habits)
Transformation of lifestyles away from excessive consumption of resources like energy
Related with almost all the PB
9.Society, Economy and Environment, Policies, Measures
Establishing a green economy with environmental economics and accountingEnvironmental awareness at the individual and societal levels, progress of environmental education, Legal system, social foundation; poverty, governance; the status of women
Related with almost all the PB
Terms in blue are categories listed in Planetary boundaries: Will Steffen, Katherine Richardson, Johan Rockstrom et.al. Science 13 Feb 2015 vol. 347, issue 6223
To be continued
1. Awareness of the Crisis Facing Human Survival - Environmental Doomsday Clock
In Table 1, “Environmental issues to be taken into account” are shown. Keeping in mind the problems that the en-vironment faces at a global level, please select the three most pressing issues for the country or the region where you reside. Then, please rank them in the order of importance. Lastly, for each item, select a time using hours and minutes between 0:10 to 12:00, to indicate the level of crisis for that issue. For the purpose of calculating results, please select your times in units no smaller than 10 minutes.
------------ Example ------------ --------------- Answer ---------------Category Number TIME Category Number TIME
First ( 1 ) 9 : 30 First ( ) :(of the first magnitude) (of the first magnitude)
Second ( 5 ) 7 : 40 Second ( ) :(of the second magnitude) (of the second magnitude)
Third ( 3 ) 8 : 20 Third ( ) :(of the third magnitude) (of the third magnitude)
12
3
6
9
0:01〜 3:00Barely Concerned
3:01〜 6:00Slightly Concerned
9:01〜12:00Extremely Concerned
6:01〜 9:00Fairly Concerned
2. Do you see any signs of improvement in the approach to global environmental issues. Please answer these questions fromthe following three viewpoints in comparison with before 2015 when the Paris Agreement and SDGs were adopted:
2-1 Do you think we are shifting to a decarbonized society?
Definitely Somewhat Cannot say Not really Definitely noteither way
1. Public awareness A B C D E
2. Policies, legal system A B C D E
3. Funds, human resources, A B C D Etechnologies and facilities
2-2 Where do you see signs of improvement? Please choose one category from the Table 1 that shows a list of “Envi-ronmental issues to be taken into account”.Number of the category that shows signs of improvement: □ No sign of improvement at all
There are There are perhaps Cannot say There aren’t really There are noimprovements some improvements either way any improvements improvements at all
1. Public awareness A B C D E
2. Policies, legal system A B C D E
3. Funds, human resources, A B C D Etechnologies and facilities
-Regarding the calculation of the time on the Environmental Doomsday Clock:The time on the Environmental Doomsday Clock will be determined by taking the weighted average of the data. The issue ranked in first place will be weighted at 50%, second place at 30%, and third place at 20%. In the example shown, the time comes to 8:43.
Table 1. Environmental issues to be taken into account:
No. Category Examples of Observable Changes in the Country or the Region in which You Reside
Planetary Boundaries (PB) Category by SDGs # (Sustainable Development Goals: SDGs)
1. Climate ChangeGlobal warming; CO2%, ocean acidification; climatic aberrations (droughts,torrential rains and flooding, severe storms, heavy snow, abnormaltemperatures, desertification, etc.)
Climate change, Ocean acidification, Atmosphericaerosol loading, Stratospheric ozone depletion
2.Biosphere Integrity(Biodiversity)
Acceleration of species extinction rate; effects of contamination, climate change, land use
Genetic diversity, Functional diversity
3.Land-System Change(Land Use)
Change in the amount of forest cover remaining at the tropical, temperate and boreal biomes.Change in the amount of cropland
Land-system change
4.Biochemical flows (Pollution/Contamination)
Increase in river, ocean and soil pollution: eutrophication caused by excessive nitrogen and phosphorus and contamination by microplastics and chemical substances; atmospheric pollution: particulates suspended in the atmosphere, soot and chemical substances
Chemical polution, Nitrogen andphosphorous cycles
5. Water ResourcesDiminution of usable fresh water resources (depletion, contamination)Control and degeneration of green water quality (water contained in soil and used by plants)
Freshwater use
6. Population Population growth beyond what the Earth can support; aging of the population Related with almost all the PB
7. Food Diminution of food supply from land and oceans Related with almost all the PB
8.Lifestyles(Consumption Habits)
Transformation of lifestyles away from excessive consumption of resources like energy
Related with almost all the PB
9.Society, Economy and Environment, Policies, Measures
Establishing a green economy with environmental economics and accountingEnvironmental awareness at the individual and societal levels, progress of environmental education, Legal system, social foundation; poverty, governance; the status of women
Related with almost all the PB
Terms in blue are categories listed in Planetary boundaries: Will Steffen, Katherine Richardson, Johan Rockstrom et.al. Science 13 Feb 2015 vol. 347, issue 6223
To be continued
1. Awareness of the Crisis Facing Human Survival - Environmental Doomsday Clock
In Table 1, “Environmental issues to be taken into account” are shown. Keeping in mind the problems that the en-vironment faces at a global level, please select the three most pressing issues for the country or the region where you reside. Then, please rank them in the order of importance. Lastly, for each item, select a time using hours and minutes between 0:10 to 12:00, to indicate the level of crisis for that issue. For the purpose of calculating results, please select your times in units no smaller than 10 minutes.
------------ Example ------------ --------------- Answer ---------------Category Number TIME Category Number TIME
First ( 1 ) 9 : 30 First ( ) :(of the first magnitude) (of the first magnitude)
Second ( 5 ) 7 : 40 Second ( ) :(of the second magnitude) (of the second magnitude)
Third ( 3 ) 8 : 20 Third ( ) :(of the third magnitude) (of the third magnitude)
12
3
6
9
0:01〜 3:00Barely Concerned
3:01〜 6:00Slightly Concerned
9:01〜12:00Extremely Concerned
6:01〜 9:00Fairly Concerned
2. Do you see any signs of improvement in the approach to global environmental issues. Please answer these questions fromthe following three viewpoints in comparison with before 2015 when the Paris Agreement and SDGs were adopted:
2-1 Do you think we are shifting to a decarbonized society?
Definitely Somewhat Cannot say Not really Definitely noteither way
1. Public awareness A B C D E
2. Policies, legal system A B C D E
3. Funds, human resources, A B C D Etechnologies and facilities
2-2 Where do you see signs of improvement? Please choose one category from the Table 1 that shows a list of “Envi-ronmental issues to be taken into account”.Number of the category that shows signs of improvement: □ No sign of improvement at all
There are There are perhaps Cannot say There aren’t really There are noimprovements some improvements either way any improvements improvements at all
1. Public awareness A B C D E
2. Policies, legal system A B C D E
3. Funds, human resources, A B C D Etechnologies and facilities
-Regarding the calculation of the time on the Environmental Doomsday Clock:The time on the Environmental Doomsday Clock will be determined by taking the weighted average of the data. The issue ranked in first place will be weighted at 50%, second place at 30%, and third place at 20%. In the example shown, the time comes to 8:43.
Table 1. Environmental issues to be taken into account:
No. Category Examples of Observable Changes in the Country or the Region in which You Reside
Planetary Boundaries (PB) Category by SDGs # (Sustainable Development Goals: SDGs)
1. Climate ChangeGlobal warming; CO2%, ocean acidification; climatic aberrations (droughts,torrential rains and flooding, severe storms, heavy snow, abnormaltemperatures, desertification, etc.)
Climate change, Ocean acidification, Atmospheric aerosol loading, Stratospheric ozone depletion
2.Biosphere Integrity(Biodiversity)
Acceleration of species extinction rate; effects of contamination, climate change, land use
Genetic diversity, Functional diversity
3.Land-System Change(Land Use)
Change in the amount of forest cover remaining at the tropical, temperate and boreal biomes.Change in the amount of cropland
Land-system change
4.Biochemical flows (Pollution/Contamination)
Increase in river, ocean and soil pollution: eutrophication caused by excessive nitrogen and phosphorus and contamination by microplastics and chemical substances; atmospheric pollution: particulates suspended in the atmosphere, soot and chemical substances
Chemical polution, Nitrogen andphosphorous cycles
5. Water ResourcesDiminution of usable fresh water resources (depletion, contamination)Control and degeneration of green water quality (water contained in soil and used by plants)
Freshwater use
6. Population Population growth beyond what the Earth can support; aging of the population Related with almost all the PB
7. Food Diminution of food supply from land and oceans Related with almost all the PB
8.Lifestyles(Consumption Habits)
Transformation of lifestyles away from excessive consumption of resources like energy
Related with almost all the PB
9.Society, Economy and Environment, Policies, Measures
Establishing a green economy with environmental economics and accountingEnvironmental awareness at the individual and societal levels, progress of environmental education, Legal system, social foundation; poverty, governance; the status of women
Related with almost all the PB
Terms in blue are categories listed in Planetary boundaries: Will Steffen, Katherine Richardson, Johan Rockstrom et.al. Science 13 Feb 2015 vol. 347, issue 6223
To be continued
1. Awareness of the Crisis Facing Human Survival - Environmental Doomsday Clock
In Table 1, “Environmental issues to be taken into account” are shown. Keeping in mind the problems that the en-vironment faces at a global level, please select the three most pressing issues for the country or the region where you reside. Then, please rank them in the order of importance. Lastly, for each item, select a time using hours and minutes between 0:10 to 12:00, to indicate the level of crisis for that issue. For the purpose of calculating results, please select your times in units no smaller than 10 minutes.
------------ Example ------------ --------------- Answer ---------------Category Number TIME Category Number TIME
First ( 1 ) 9 : 30 First ( ) :(of the first magnitude) (of the first magnitude)
Second ( 5 ) 7 : 40 Second ( ) :(of the second magnitude) (of the second magnitude)
Third ( 3 ) 8 : 20 Third ( ) :(of the third magnitude) (of the third magnitude)
12
3
6
9
0:01〜 3:00Barely Concerned
3:01〜 6:00Slightly Concerned
9:01〜12:00Extremely Concerned
6:01〜 9:00Fairly Concerned
2. Do you see any signs of improvement in the approach to global environmental issues. Please answer these questions fromthe following three viewpoints in comparison with before 2015 when the Paris Agreement and SDGs were adopted:
2-1 Do you think we are shifting to a decarbonized society?
Definitely Somewhat Cannot say Not really Definitely noteither way
1. Public awareness A B C D E
2. Policies, legal system A B C D E
3. Funds, human resources, A B C D Etechnologies and facilities
2-2 Where do you see signs of improvement? Please choose one category from the Table 1 that shows a list of “Envi-ronmental issues to be taken into account”.Number of the category that shows signs of improvement: □ No sign of improvement at all
There are There are perhaps Cannot say There aren’t really There are noimprovements some improvements either way any improvements improvements at all
1. Public awareness A B C D E
2. Policies, legal system A B C D E
3. Funds, human resources, A B C D Etechnologies and facilities
-Regarding the calculation of the time on the Environmental Doomsday Clock:The time on the Environmental Doomsday Clock will be determined by taking the weighted average of the data. The issue ranked in first place will be weighted at 50%, second place at 30%, and third place at 20%. In the example shown, the time comes to 8:43.
Table 1. Environmental issues to be taken into account:
No. Category Examples of Observable Changes in the Country or the Region in which You Reside
Planetary Boundaries (PB) Category by SDGs # (Sustainable Development Goals: SDGs)
1. Climate ChangeGlobal warming; CO2torrential rains and flooding, severe storms, heavy snow, abnormal
Climate change, Oceanacidification, Atmosphericaerosol loading, Stratosphericozone depletion
2.Biosphere Integrity(Biodiversity)
n, climate change, land use
Genetic diversity,Functional diversity
3.Land-System Change(Land Use)
Change in the amount of forest cover remaining at the tropical, temperate and boreal biomes.Change in the amount of cropland
Land-system change
4.Biochemical
Contamination)
Increase in river, ocean and soil pollution: eutrophication caused by excessivenitrogen and phosphorus and contamination by microplastics and chemicalsubstances; atmospheric pollution: particulates suspended in the atmosphere,soot and chemical substances
Chemical polution, Nitrogen andphosphorous cycles
5. Water ResourcesDiminution of usable fresh water resources (depletion, contamination)Control and degeneration of green water quality (water contained in soil and used by plants)
Freshwater use
6. Population Population growth beyond what the Earth can support; aging of the population Related with almost all the PB
7. Food Diminution of food supply from land and oceans Related with almost all the PB
8.Lifestyles(ConsumptionHabits)
Transformation of lifestyles away from excessive consumption of resources likeenergy
Related with almost all the PB
9.Society, Economy and Environment, Policies, Measures
Establishing a green economy with environmental economics and accountingEnvironmental awareness at the individual and societal levels, progress of environmental education, Legal system, social foundation; poverty, governance; the status of women
Related with almost all the PB
Terms in blue are categories listed in Planetary boundaries:
To be continued
1. Awareness of the Crisis Facing Human Survival - Environmental Doomsday Clock
In Table 1, “Environmental issues to be taken into account” are shown. Keeping in mind the problems that the en-vironment faces at a global level, please select the three most pressing issues for the country or the region where youreside. Then, please rank them in the order of importance. Lastly, for each item, select a time using hours and minutesbetween 0:10 to 12:00, to indicate the level of crisis for that issue. For the purpose of calculating results, please selectyour times in units no smaller than 10 minutes.
------------ Example ------------ --------------- Answer ---------------Category Number TIME Category Number TIME
First ( 1 ) 9 : 30 First ( ) :)
Second ( 5 ) 7 : 40 Second ( ) :(of the second magnitude) (of the second magnitude)
Third ( 3 ) 8 : 20 Third ( ) :(of the third magnitude) (of the third magnitude)
12
3
6
9
0:01~ 3:00Barely Concerned
3:01~ 6:00Slightly Concerned
9:01~12:00Extremely Concerned
6:01~ 9:00Fairly Concerned
2. Do you see any signs of improvement in the approach to global environmental issues. Please answer these questions fromthe following three viewpoints in comparison with the situation before 2015 when the Paris Agreement and SDGs were adopted:
2-1 Do you think we are shifting to a decarbonized society?
Def Not really Def noteither way
1. Public Awareness A B C D E
2. Policies, Legal System A B C D E
3. Social Infrastructure (Funds, human resources, technologies and facilities)
A B C D E
2-2 Where do you see signs of improvement? Please choose one category from the Table 1 that shows a list of “Envi-ronmental issues to be taken into account”.Number of the category that shows signs of improvement: □ No sign of improvement at all
are really are noimprovements some improvements either way any improvements improvements at all
1. Public Awareness A B C D E
2. Policies, Legal System A B C D E
3. Social Infrastructure (Funds, human resources, technologies and facilities)
A B C D E
-About the calculation of the time on the Environmental Doomsday Clock:The timeplace will be weighted at 50%, second place at 30%, and third place at 20%. In the example shown, the time comes to 8:43.
Table 1. Environmental issues to be taken into account:
No. Category Examples of Observable Changes in the Country or the Region in which You Reside
Planetary Boundaries (PB) Category by SDGs # (Sustainable Development Goals: SDGs)
1. Climate ChangeGlobal warming; CO2%, ocean acidification; climatic aberrations (droughts,torrential rains and flooding, severe storms, heavy snow, abnormaltemperatures, desertification, etc.)
Climate change, Oceanacidification, Atmosphericaerosol loading, Stratospheric ozone depletion
2.Biosphere Integrity(Biodiversity)
Acceleration of species extinction rate; effects of contamination, climate change, land use
Genetic diversity, Functional diversity
3.Land-System Change(Land Use)
Change in the amount of forest cover remaining at the tropical, temperate and boreal biomes.Change in the amount of cropland
Land-system change
4.Biochemical flows (Pollution/Contamination)
Increase in river, ocean and soil pollution: eutrophication caused by excessive nitrogen and phosphorus and contamination by microplastics and chemical substances; atmospheric pollution: particulates suspended in the atmosphere, soot and chemical substances
Chemical polution, Nitrogen andphosphorous cycles
5. Water ResourcesDiminution of usable fresh water resources (depletion, contamination)Control and degeneration of green water quality (water contained in soil and used by plants)
Freshwater use
6. Population Population growth beyond what the Earth can support; aging of the population Related with almost all the PB
7. Food Diminution of food supply from land and oceans Related with almost all the PB
8.Lifestyles(Consumption Habits)
Transformation of lifestyles away from excessive consumption of resources like energy
Related with almost all the PB
9.Society, Economy and Environment, Policies, Measures
Establishing a green economy with environmental economics and accountingEnvironmental awareness at the individual and societal levels, progress of environmental education, Legal system, social foundation; poverty, governance; the status of women
Related with almost all the PB
Terms in blue are categories listed in Planetary boundaries: Will Steffen, Katherine Richardson, Johan Rockstrom et.al. Science 13 Feb 2015 vol. 347, issue 6223
To be continued
1. Awareness of the Crisis Facing Human Survival - Environmental Doomsday Clock
In Table 1, “Environmental issues to be taken into account” are shown. Keeping in mind the problems that the en-vironment faces at a global level, please select the three most pressing issues for the country or the region where you reside. Then, please rank them in the order of importance. Lastly, for each item, select a time using hours and minutes between 0:10 to 12:00, to indicate the level of crisis for that issue. For the purpose of calculating results, please select your times in units no smaller than 10 minutes.
------------ Example ------------ --------------- Answer ---------------Category Number TIME Category Number TIME
First ( 1 ) 9 : 30 First ( ) :(of the first magnitude) (of the first magnitude)
Second ( 5 ) 7 : 40 Second ( ) :(of the second magnitude) (of the second magnitude)
Third ( 3 ) 8 : 20 Third ( ) :(of the third magnitude) (of the third magnitude)
12
3
6
9
0:01〜 3:00Barely Concerned
3:01〜 6:00Slightly Concerned
9:01〜12:00Extremely Concerned
6:01〜 9:00Fairly Concerned
2. Do you see any signs of improvement in the approach to global environmental issues. Please answer these questions fromthe following three viewpoints in comparison with before 2015 when the Paris Agreement and SDGs were adopted:
2-1 Do you think we are shifting to a decarbonized society?
Definitely Somewhat Cannot say Not really Definitely noteither way
1. Public awareness A B C D E
2. Policies, legal system A B C D E
3. Funds, human resources, A B C D Etechnologies and facilities
2-2 Where do you see signs of improvement? Please choose one category from the Table 1 that shows a list of “Envi-ronmental issues to be taken into account”.Number of the category that shows signs of improvement: □ No sign of improvement at all
There are There are perhaps Cannot say There aren’t really There are noimprovements some improvements either way any improvements improvements at all
1. Public awareness A B C D E
2. Policies, legal system A B C D E
3. Funds, human resources, A B C D Etechnologies and facilities
-Regarding the calculation of the time on the Environmental Doomsday Clock:The time on the Environmental Doomsday Clock will be determined by taking the weighted average of the data. The issue ranked in first place will be weighted at 50%, second place at 30%, and third place at 20%. In the example shown, the time comes to 8:43.
Table 1. Environmental issues to be taken into account:
No. Category Examples of Observable Changes in the Country or the Region in which You Reside
Planetary Boundaries (PB) Category by SDGs # (Sustainable Development Goals: SDGs)
1. Climate ChangeGlobal warming; CO2%, ocean acidification; climatic aberrations (droughts,torrential rains and flooding, severe storms, heavy snow, abnormaltemperatures, desertification, etc.)
Climate change, Oceanacidification, Atmosphericaerosol loading, Stratospheric ozone depletion
2.Biosphere Integrity(Biodiversity)
Acceleration of species extinction rate; effects of contamination, climate change, land use
Genetic diversity, Functional diversity
3.Land-System Change(Land Use)
Change in the amount of forest cover remaining at the tropical, temperate and boreal biomes.Change in the amount of cropland
Land-system change
4.Biochemical flows (Pollution/Contamination)
Increase in river, ocean and soil pollution: eutrophication caused by excessive nitrogen and phosphorus and contamination by microplastics and chemical substances; atmospheric pollution: particulates suspended in the atmosphere, soot and chemical substances
Chemical polution, Nitrogen andphosphorous cycles
5. Water ResourcesDiminution of usable fresh water resources (depletion, contamination)Control and degeneration of green water quality (water contained in soil and used by plants)
Freshwater use
6. Population Population growth beyond what the Earth can support; aging of the population Related with almost all the PB
7. Food Diminution of food supply from land and oceans Related with almost all the PB
8.Lifestyles(Consumption Habits)
Transformation of lifestyles away from excessive consumption of resources like energy
Related with almost all the PB
9.Society, Economy and Environment, Policies, Measures
Establishing a green economy with environmental economics and accountingEnvironmental awareness at the individual and societal levels, progress of environmental education, Legal system, social foundation; poverty, governance; the status of women
Related with almost all the PB
Terms in blue are categories listed in Planetary boundaries: Will Steffen, Katherine Richardson, Johan Rockstrom et.al. Science 13 Feb 2015 vol. 347, issue 6223
To be continued
1. Awareness of the Crisis Facing Human Survival - Environmental Doomsday Clock
In Table 1, “Environmental issues to be taken into account” are shown. Keeping in mind the problems that the en-vironment faces at a global level, please select the three most pressing issues for the country or the region where you reside. Then, please rank them in the order of importance. Lastly, for each item, select a time using hours and minutes between 0:10 to 12:00, to indicate the level of crisis for that issue. For the purpose of calculating results, please select your times in units no smaller than 10 minutes.
------------ Example ------------ --------------- Answer ---------------Category Number TIME Category Number TIME
First ( 1 ) 9 : 30 First ( ) :(of the first magnitude) (of the first magnitude)
Second ( 5 ) 7 : 40 Second ( ) :(of the second magnitude) (of the second magnitude)
Third ( 3 ) 8 : 20 Third ( ) :(of the third magnitude) (of the third magnitude)
12
3
6
9
0:01〜 3:00Barely Concerned
3:01〜 6:00Slightly Concerned
9:01〜12:00Extremely Concerned
6:01〜 9:00Fairly Concerned
2. Do you see any signs of improvement in the approach to global environmental issues. Please answer these questions fromthe following three viewpoints in comparison with before 2015 when the Paris Agreement and SDGs were adopted:
2-1 Do you think we are shifting to a decarbonized society?
Definitely Somewhat Cannot say Not really Definitely noteither way
1. Public awareness A B C D E
2. Policies, legal system A B C D E
3. Funds, human resources, A B C D Etechnologies and facilities
2-2 Where do you see signs of improvement? Please choose one category from the Table 1 that shows a list of “Envi-ronmental issues to be taken into account”.Number of the category that shows signs of improvement: □ No sign of improvement at all
There are There are perhaps Cannot say There aren’t really There are noimprovements some improvements either way any improvements improvements at all
1. Public awareness A B C D E
2. Policies, legal system A B C D E
3. Funds, human resources, A B C D Etechnologies and facilities
-Regarding the calculation of the time on the Environmental Doomsday Clock:The time on the Environmental Doomsday Clock will be determined by taking the weighted average of the data. The issue ranked in first place will be weighted at 50%, second place at 30%, and third place at 20%. In the example shown, the time comes to 8:43.

35
The color of the clock reflects the sense of crisis.: Extremely Concerned, : Fairly Concerned, : Slightly Concerned, : Barely Concerned
1992
121110987 6 5
432
1
19921211
10987 6 5
432
1
19931211
10987 6 5
432
1
19941211
10987 6 5
432
1
19951211
10987 6 5
432
1
19961211
10987 6 5
432
1
19971211
10987 6 5
432
1
1998 19991211
10987 6 5
432
1 121110987 6 5
432
1
2000 20011211
10987 6 5
432
1 121110987 6 5
432
1
2002
121110987 6 5
432
1
2003 20041211
10987 6 5
432
1 121110987 6 5
432
1
20051211
10987 6 5
432
1
2006 20071211
10987 6 5
432
1
20161211
10987 6 5
432
1
20081211
10987 6 5
432
1 121110987 6 5
432
1
20091211
10987 6 5
432
1
20101211
10987 6 5
432
1
20111211
10987 6 5
432
1
20121211
10987 6 5
432
1
2013
121110987 6 5
432
1
20141211
10987 6 5
432
1
2015
World 7:49 Western Europe 8:54
Africa 8:10 Middle East 8:10
Asia 7:39 North America 8:35
Central & South America,The Caribbean 8:57 Oceania 9:58
Eastern Europe & Former Soviet Union
9:27
1993
121110987 6 5
432
1
19921211
10987 6 5
432
1
19931211
10987 6 5
432
1
19941211
10987 6 5
432
1
19951211
10987 6 5
432
1
19961211
10987 6 5
432
1
19971211
10987 6 5
432
1
1998 19991211
10987 6 5
432
1 121110987 6 5
432
1
2000 20011211
10987 6 5
432
1 121110987 6 5
432
1
2002
121110987 6 5
432
1
2003 20041211
10987 6 5
432
1 121110987 6 5
432
1
20051211
10987 6 5
432
1
2006 20071211
10987 6 5
432
1
20161211
10987 6 5
432
1
20081211
10987 6 5
432
1 121110987 6 5
432
1
20091211
10987 6 5
432
1
20101211
10987 6 5
432
1
20111211
10987 6 5
432
1
20121211
10987 6 5
432
1
2013
121110987 6 5
432
1
20141211
10987 6 5
432
1
2015
World 8:19 Western Europe 9:02
Africa 8:43 Middle East 8:12
Asia 8:17 North America 8:58
Central & South America,The Caribbean 8:37 Oceania 8:23
Eastern Europe & Former Soviet Union
7:02
1994
121110987 6 5
432
1
19921211
10987 6 5
432
1
19931211
10987 6 5
432
1
19941211
10987 6 5
432
1
19951211
10987 6 5
432
1
19961211
10987 6 5
432
1
19971211
10987 6 5
432
1
1998 19991211
10987 6 5
432
1 121110987 6 5
432
1
2000 20011211
10987 6 5
432
1 121110987 6 5
432
1
2002
121110987 6 5
432
1
2003 20041211
10987 6 5
432
1 121110987 6 5
432
1
20051211
10987 6 5
432
1
2006 20071211
10987 6 5
432
1
20161211
10987 6 5
432
1
20081211
10987 6 5
432
1 121110987 6 5
432
1
20091211
10987 6 5
432
1
20101211
10987 6 5
432
1
20111211
10987 6 5
432
1
20121211
10987 6 5
432
1
2013
121110987 6 5
432
1
20141211
10987 6 5
432
1
2015
World 8:47 Western Europe 9:35
Africa 9:14 Middle East -
Asia 8:26 North America 9:07
Central & South America,The Caribbean 9:37 Oceania 8:53
Eastern Europe & Former Soviet Union
8:10
1995
121110987 6 5
432
1
19921211
10987 6 5
432
1
19931211
10987 6 5
432
1
19941211
10987 6 5
432
1
19951211
10987 6 5
432
1
19961211
10987 6 5
432
1
19971211
10987 6 5
432
1
1998 19991211
10987 6 5
432
1 121110987 6 5
432
1
2000 20011211
10987 6 5
432
1 121110987 6 5
432
1
2002
121110987 6 5
432
1
2003 20041211
10987 6 5
432
1 121110987 6 5
432
1
20051211
10987 6 5
432
1
2006 20071211
10987 6 5
432
1
20161211
10987 6 5
432
1
20081211
10987 6 5
432
1 121110987 6 5
432
1
20091211
10987 6 5
432
1
20101211
10987 6 5
432
1
20111211
10987 6 5
432
1
20121211
10987 6 5
432
1
2013
121110987 6 5
432
1
20141211
10987 6 5
432
1
2015
World 8:49 Western Europe 9:02
Africa 9:33 Middle East 9:09
Asia 8:27 North America 8:52
Central & South America,The Caribbean 9:23 Oceania 9:44
Eastern Europe & Former Soviet Union
9:29
1996
121110987 6 5
432
1
19921211
10987 6 5
432
1
19931211
10987 6 5
432
1
19941211
10987 6 5
432
1
19951211
10987 6 5
432
1
19961211
10987 6 5
432
1
19971211
10987 6 5
432
1
1998 19991211
10987 6 5
432
1 121110987 6 5
432
1
2000 20011211
10987 6 5
432
1 121110987 6 5
432
1
2002
121110987 6 5
432
1
2003 20041211
10987 6 5
432
1 121110987 6 5
432
1
20051211
10987 6 5
432
1
2006 20071211
10987 6 5
432
1
20161211
10987 6 5
432
1
20081211
10987 6 5
432
1 121110987 6 5
432
1
20091211
10987 6 5
432
1
20101211
10987 6 5
432
1
20111211
10987 6 5
432
1
20121211
10987 6 5
432
1
2013
121110987 6 5
432
1
20141211
10987 6 5
432
1
2015
World 9:13 Western Europe 9:46
Africa 9:25 Middle East 8:30
Asia 9:00 North America 9:30
Central & South America,The Caribbean 9:28 Oceania 9:43
Eastern Europe & Former Soviet Union
9:12
Reference: Changes in the Time on the Environmental Doomsday Clock

36
1997
121110987 6 5
432
1
19921211
10987 6 5
432
1
19931211
10987 6 5
432
1
19941211
10987 6 5
432
1
19951211
10987 6 5
432
1
19961211
10987 6 5
432
1
19971211
10987 6 5
432
1
1998 19991211
10987 6 5
432
1 121110987 6 5
432
1
2000 20011211
10987 6 5
432
1 121110987 6 5
432
1
2002
121110987 6 5
432
1
2003 20041211
10987 6 5
432
1 121110987 6 5
432
1
20051211
10987 6 5
432
1
2006 20071211
10987 6 5
432
1
20161211
10987 6 5
432
1
20081211
10987 6 5
432
1 121110987 6 5
432
1
20091211
10987 6 5
432
1
20101211
10987 6 5
432
1
20111211
10987 6 5
432
1
20121211
10987 6 5
432
1
2013
121110987 6 5
432
1
20141211
10987 6 5
432
1
2015
World 9:04 Western Europe 9:53
Africa 9:15 Middle East 9:33
Asia 8:49 North America 9:09
Central & South America,The Caribbean 9:26 Oceania 9:58
Eastern Europe & Former Soviet Union 9:37
1998
121110987 6 5
432
1
19921211
10987 6 5
432
1
19931211
10987 6 5
432
1
19941211
10987 6 5
432
1
19951211
10987 6 5
432
1
19961211
10987 6 5
432
1
19971211
10987 6 5
432
1
1998 19991211
10987 6 5
432
1 121110987 6 5
432
1
2000 20011211
10987 6 5
432
1 121110987 6 5
432
1
2002
121110987 6 5
432
1
2003 20041211
10987 6 5
432
1 121110987 6 5
432
1
20051211
10987 6 5
432
1
2006 20071211
10987 6 5
432
1
20161211
10987 6 5
432
1
20081211
10987 6 5
432
1 121110987 6 5
432
1
20091211
10987 6 5
432
1
20101211
10987 6 5
432
1
20111211
10987 6 5
432
1
20121211
10987 6 5
432
1
2013
121110987 6 5
432
1
20141211
10987 6 5
432
1
2015
World 9:05 Western Europe 9:37
Africa 9:08 Middle East 8:47
Asia 9:01 North America 8:40
Central & South America,The Caribbean 9:04 Oceania 9:34
Eastern Europe & Former Soviet Union 9:44
1999
121110987 6 5
432
1
19921211
10987 6 5
432
1
19931211
10987 6 5
432
1
19941211
10987 6 5
432
1
19951211
10987 6 5
432
1
19961211
10987 6 5
432
1
19971211
10987 6 5
432
1
1998 19991211
10987 6 5
432
1 121110987 6 5
432
1
2000 20011211
10987 6 5
432
1 121110987 6 5
432
1
2002
121110987 6 5
432
1
2003 20041211
10987 6 5
432
1 121110987 6 5
432
1
20051211
10987 6 5
432
1
2006 20071211
10987 6 5
432
1
20161211
10987 6 5
432
1
20081211
10987 6 5
432
1 121110987 6 5
432
1
20091211
10987 6 5
432
1
20101211
10987 6 5
432
1
20111211
10987 6 5
432
1
20121211
10987 6 5
432
1
2013
121110987 6 5
432
1
20141211
10987 6 5
432
1
2015
World 9:08 Western Europe 8:46
Africa 9:13 Middle East 9:32
Asia 9:14 North America 9:03
Central & South America,The Caribbean 9:14 Oceania 8:52
Eastern Europe & Former Soviet Union
9:21
2000
121110987 6 5
432
1
19921211
10987 6 5
432
1
19931211
10987 6 5
432
1
19941211
10987 6 5
432
1
19951211
10987 6 5
432
1
19961211
10987 6 5
432
1
19971211
10987 6 5
432
1
1998 19991211
10987 6 5
432
1 121110987 6 5
432
1
2000 20011211
10987 6 5
432
1 121110987 6 5
432
1
2002
121110987 6 5
432
1
2003 20041211
10987 6 5
432
1 121110987 6 5
432
1
20051211
10987 6 5
432
1
2006 20071211
10987 6 5
432
1
20161211
10987 6 5
432
1
20081211
10987 6 5
432
1 121110987 6 5
432
1
20091211
10987 6 5
432
1
20101211
10987 6 5
432
1
20111211
10987 6 5
432
1
20121211
10987 6 5
432
1
2013
121110987 6 5
432
1
20141211
10987 6 5
432
1
2015
World 8:56 Western Europe 8:46
Africa 9:17 Middle East 9:38
Asia 9:00 North America 8:49
Central & South America,The Caribbean 8:52 Oceania 8:31
Eastern Europe & Former Soviet Union 8:21
2001
121110987 6 5
432
1
19921211
10987 6 5
432
1
19931211
10987 6 5
432
1
19941211
10987 6 5
432
1
19951211
10987 6 5
432
1
19961211
10987 6 5
432
1
19971211
10987 6 5
432
1
1998 19991211
10987 6 5
432
1 121110987 6 5
432
1
2000 20011211
10987 6 5
432
1 121110987 6 5
432
1
2002
121110987 6 5
432
1
2003 20041211
10987 6 5
432
1 121110987 6 5
432
1
20051211
10987 6 5
432
1
2006 20071211
10987 6 5
432
1
20161211
10987 6 5
432
1
20081211
10987 6 5
432
1 121110987 6 5
432
1
20091211
10987 6 5
432
1
20101211
10987 6 5
432
1
20111211
10987 6 5
432
1
20121211
10987 6 5
432
1
2013
121110987 6 5
432
1
20141211
10987 6 5
432
1
2015
World 9:08 Western Europe 8:58
Africa 9:37 Middle East 9:01
Asia 9:04 North America 9:54
Central & South America,The Caribbean 9:00 Oceania 8:58
Eastern Europe & Former Soviet Union
8:17

37
2002
121110987 6 5
432
1
19921211
10987 6 5
432
1
19931211
10987 6 5
432
1
19941211
10987 6 5
432
1
19951211
10987 6 5
432
1
19961211
10987 6 5
432
1
19971211
10987 6 5
432
1
1998 19991211
10987 6 5
432
1 121110987 6 5
432
1
2000 20011211
10987 6 5
432
1 121110987 6 5
432
1
2002
121110987 6 5
432
1
2003 20041211
10987 6 5
432
1 121110987 6 5
432
1
20051211
10987 6 5
432
1
2006 20071211
10987 6 5
432
1
20161211
10987 6 5
432
1
20081211
10987 6 5
432
1 121110987 6 5
432
1
20091211
10987 6 5
432
1
20101211
10987 6 5
432
1
20111211
10987 6 5
432
1
20121211
10987 6 5
432
1
2013
121110987 6 5
432
1
20141211
10987 6 5
432
1
2015
World 9:05 Western Europe 8:44
Africa 9:29 Middle East 8:02
Asia 9:10 North America 8:23
Central & South America,The Caribbean 9:22 Oceania 9:22
Eastern Europe & Former Soviet Union 9:28
2003
121110987 6 5
432
1
19921211
10987 6 5
432
1
19931211
10987 6 5
432
1
19941211
10987 6 5
432
1
19951211
10987 6 5
432
1
19961211
10987 6 5
432
1
19971211
10987 6 5
432
1
1998 19991211
10987 6 5
432
1 121110987 6 5
432
1
2000 20011211
10987 6 5
432
1 121110987 6 5
432
1
2002
121110987 6 5
432
1
2003 20041211
10987 6 5
432
1 121110987 6 5
432
1
20051211
10987 6 5
432
1
2006 20071211
10987 6 5
432
1
20161211
10987 6 5
432
1
20081211
10987 6 5
432
1 121110987 6 5
432
1
20091211
10987 6 5
432
1
20101211
10987 6 5
432
1
20111211
10987 6 5
432
1
20121211
10987 6 5
432
1
2013
121110987 6 5
432
1
20141211
10987 6 5
432
1
2015
World 9:15 Western Europe 8:52
Africa 9:22 Middle East 8:52
Asia 9:25 North America 9:03
Central & South America,The Caribbean 9:19 Oceania 9:37
Eastern Europe & Former Soviet Union 9:02
2004
121110987 6 5
432
1
19921211
10987 6 5
432
1
19931211
10987 6 5
432
1
19941211
10987 6 5
432
1
19951211
10987 6 5
432
1
19961211
10987 6 5
432
1
19971211
10987 6 5
432
1
1998 19991211
10987 6 5
432
1 121110987 6 5
432
1
2000 20011211
10987 6 5
432
1 121110987 6 5
432
1
2002
121110987 6 5
432
1
2003 20041211
10987 6 5
432
1 121110987 6 5
432
1
20051211
10987 6 5
432
1
2006 20071211
10987 6 5
432
1
20161211
10987 6 5
432
1
20081211
10987 6 5
432
1 121110987 6 5
432
1
20091211
10987 6 5
432
1
20101211
10987 6 5
432
1
20111211
10987 6 5
432
1
20121211
10987 6 5
432
1
2013
121110987 6 5
432
1
20141211
10987 6 5
432
1
2015
World 9:08 Western Europe 8:56
Africa 9:04 Middle East 8:41
Asia 9:14 North America 9:14
Central & South America,The Caribbean 9:12 Oceania 9:08
Eastern Europe & Former Soviet Union 8:30
2005
121110987 6 5
432
1
19921211
10987 6 5
432
1
19931211
10987 6 5
432
1
19941211
10987 6 5
432
1
19951211
10987 6 5
432
1
19961211
10987 6 5
432
1
19971211
10987 6 5
432
1
1998 19991211
10987 6 5
432
1 121110987 6 5
432
1
2000 20011211
10987 6 5
432
1 121110987 6 5
432
1
2002
121110987 6 5
432
1
2003 20041211
10987 6 5
432
1 121110987 6 5
432
1
20051211
10987 6 5
432
1
2006 20071211
10987 6 5
432
1
20161211
10987 6 5
432
1
20081211
10987 6 5
432
1 121110987 6 5
432
1
20091211
10987 6 5
432
1
20101211
10987 6 5
432
1
20111211
10987 6 5
432
1
20121211
10987 6 5
432
1
2013
121110987 6 5
432
1
20141211
10987 6 5
432
1
2015
World 9:05 Western Europe 8:43
Africa 9:03 Middle East 9:18
Asia 9:15 North America 8:54
Central & South America,The Caribbean 9:08 Oceania 9:18
Eastern Europe & Former Soviet Union 8:26
2006
121110987 6 5
432
1
19921211
10987 6 5
432
1
19931211
10987 6 5
432
1
19941211
10987 6 5
432
1
19951211
10987 6 5
432
1
19961211
10987 6 5
432
1
19971211
10987 6 5
432
1
1998 19991211
10987 6 5
432
1 121110987 6 5
432
1
2000 20011211
10987 6 5
432
1 121110987 6 5
432
1
2002
121110987 6 5
432
1
2003 20041211
10987 6 5
432
1 121110987 6 5
432
1
20051211
10987 6 5
432
1
2006 20071211
10987 6 5
432
1
20161211
10987 6 5
432
1
20081211
10987 6 5
432
1 121110987 6 5
432
1
20091211
10987 6 5
432
1
20101211
10987 6 5
432
1
20111211
10987 6 5
432
1
20121211
10987 6 5
432
1
2013
121110987 6 5
432
1
20141211
10987 6 5
432
1
2015
World 9:17 Western Europe 9:08
Africa 9:32 Middle East 10:05
Asia 9:15 North America 9:18
Central & South America,The Caribbean 9:31 Oceania 9:18
Eastern Europe & Former Soviet Union 9:07

38
2007
121110987 6 5
432
1
19921211
10987 6 5
432
1
19931211
10987 6 5
432
1
19941211
10987 6 5
432
1
19951211
10987 6 5
432
1
19961211
10987 6 5
432
1
19971211
10987 6 5
432
1
1998 19991211
10987 6 5
432
1 121110987 6 5
432
1
2000 20011211
10987 6 5
432
1 121110987 6 5
432
1
2002
121110987 6 5
432
1
2003 20041211
10987 6 5
432
1 121110987 6 5
432
1
20051211
10987 6 5
432
1
2006 20071211
10987 6 5
432
1
20161211
10987 6 5
432
1
20081211
10987 6 5
432
1 121110987 6 5
432
1
20091211
10987 6 5
432
1
20101211
10987 6 5
432
1
20111211
10987 6 5
432
1
20121211
10987 6 5
432
1
2013
121110987 6 5
432
1
20141211
10987 6 5
432
1
2015
World 9:31 Western Europe 9:23
Africa 10:02 Middle East 9:41
Asia 9:27 North America 9:40
Central & South America,The Caribbean 9:38 Oceania 10:27
Eastern Europe &Former Soviet Union 9:20
2008
121110987 6 5
432
1
19921211
10987 6 5
432
1
19931211
10987 6 5
432
1
19941211
10987 6 5
432
1
19951211
10987 6 5
432
1
19961211
10987 6 5
432
1
19971211
10987 6 5
432
1
1998 19991211
10987 6 5
432
1 121110987 6 5
432
1
2000 20011211
10987 6 5
432
1 121110987 6 5
432
1
2002
121110987 6 5
432
1
2003 20041211
10987 6 5
432
1 121110987 6 5
432
1
20051211
10987 6 5
432
1
2006 20071211
10987 6 5
432
1
20161211
10987 6 5
432
1
20081211
10987 6 5
432
1 121110987 6 5
432
1
20091211
10987 6 5
432
1
20101211
10987 6 5
432
1
20111211
10987 6 5
432
1
20121211
10987 6 5
432
1
2013
121110987 6 5
432
1
20141211
10987 6 5
432
1
2015
World 9:33 Western Europe 9:44
Africa 10:31 Middle East 9:24
Asia 9:23 North America 10:13
Central & South America,The Caribbean 9:49 Oceania 10:34
Eastern Europe &Former Soviet Union 9:37
2009
121110987 6 5
432
1
19921211
10987 6 5
432
1
19931211
10987 6 5
432
1
19941211
10987 6 5
432
1
19951211
10987 6 5
432
1
19961211
10987 6 5
432
1
19971211
10987 6 5
432
1
1998 19991211
10987 6 5
432
1 121110987 6 5
432
1
2000 20011211
10987 6 5
432
1 121110987 6 5
432
1
2002
121110987 6 5
432
1
2003 20041211
10987 6 5
432
1 121110987 6 5
432
1
20051211
10987 6 5
432
1
2006 20071211
10987 6 5
432
1
20161211
10987 6 5
432
1
20081211
10987 6 5
432
1 121110987 6 5
432
1
20091211
10987 6 5
432
1
20101211
10987 6 5
432
1
20111211
10987 6 5
432
1
20121211
10987 6 5
432
1
2013
121110987 6 5
432
1
20141211
10987 6 5
432
1
2015
World 9:22 Western Europe 9:55
Africa 10:15 Middle East 9:42
Asia 9:07 North America 10:01
Central & South America,The Caribbean 9:28 Oceania 10:10
Eastern Europe & Former Soviet Union 10:00
2010
121110987 6 5
432
1
19921211
10987 6 5
432
1
19931211
10987 6 5
432
1
19941211
10987 6 5
432
1
19951211
10987 6 5
432
1
19961211
10987 6 5
432
1
19971211
10987 6 5
432
1
1998 19991211
10987 6 5
432
1 121110987 6 5
432
1
2000 20011211
10987 6 5
432
1 121110987 6 5
432
1
2002
121110987 6 5
432
1
2003 20041211
10987 6 5
432
1 121110987 6 5
432
1
20051211
10987 6 5
432
1
2006 20071211
10987 6 5
432
1
20161211
10987 6 5
432
1
20081211
10987 6 5
432
1 121110987 6 5
432
1
20091211
10987 6 5
432
1
20101211
10987 6 5
432
1
20111211
10987 6 5
432
1
20121211
10987 6 5
432
1
2013
121110987 6 5
432
1
20141211
10987 6 5
432
1
2015
World 9:19 Western Europe 9:45
Africa 10:24 Middle East 10:47
Asia 9:06 North America 10:13
Central & South America,The Caribbean 9:48 Oceania 10:29
Eastern Europe & Former Soviet Union 9:47
2011
121110987 6 5
432
1
19921211
10987 6 5
432
1
19931211
10987 6 5
432
1
19941211
10987 6 5
432
1
19951211
10987 6 5
432
1
19961211
10987 6 5
432
1
19971211
10987 6 5
432
1
1998 19991211
10987 6 5
432
1 121110987 6 5
432
1
2000 20011211
10987 6 5
432
1 121110987 6 5
432
1
2002
121110987 6 5
432
1
2003 20041211
10987 6 5
432
1 121110987 6 5
432
1
20051211
10987 6 5
432
1
2006 20071211
10987 6 5
432
1
20161211
10987 6 5
432
1
20081211
10987 6 5
432
1 121110987 6 5
432
1
20091211
10987 6 5
432
1
20101211
10987 6 5
432
1
20111211
10987 6 5
432
1
20121211
10987 6 5
432
1
2013
121110987 6 5
432
1
20141211
10987 6 5
432
1
2015
World 9:01 Western Europe 9:28
Africa 9:09 Middle East 10:24
Asia 8:48 North America 9:35
Central & South America,The Caribbean 9:18 Oceania 10:06
Eastern Europe & Former Soviet Union 9:13
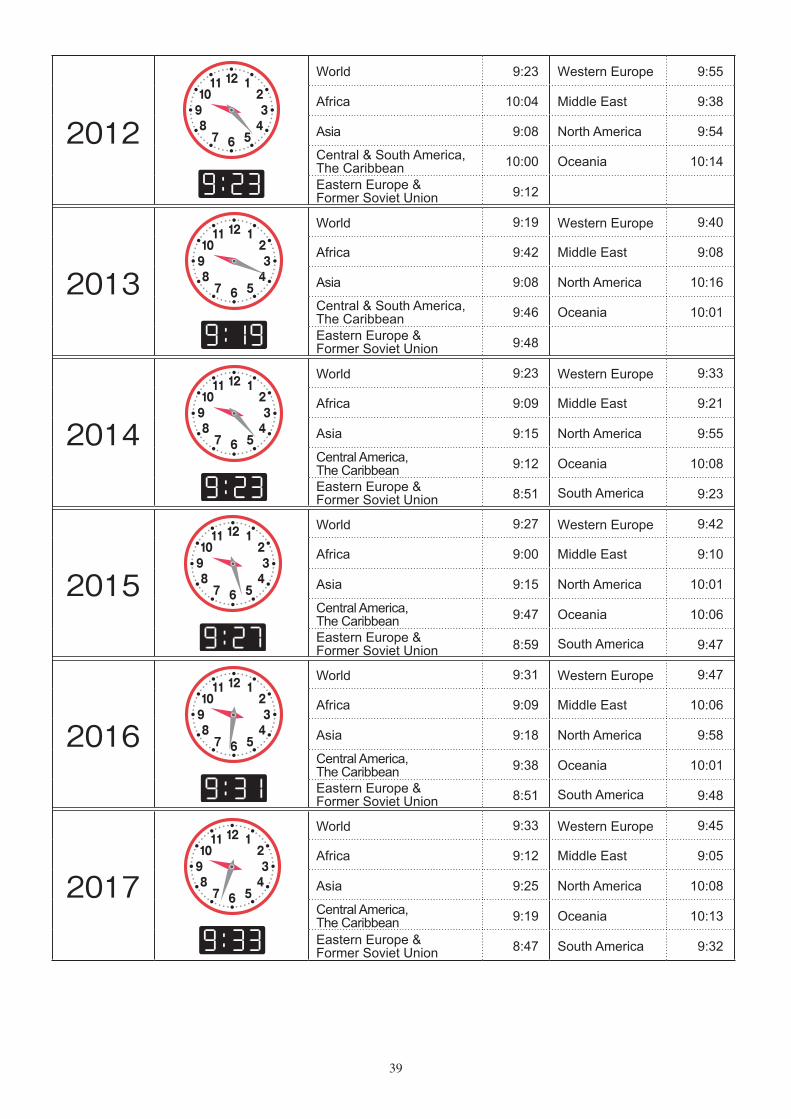
39
2012
121110987 6 5
432
1
19921211
10987 6 5
432
1
19931211
10987 6 5
432
1
19941211
10987 6 5
432
1
19951211
10987 6 5
432
1
19961211
10987 6 5
432
1
19971211
10987 6 5
432
1
1998 19991211
10987 6 5
432
1 121110987 6 5
432
1
2000 20011211
10987 6 5
432
1 121110987 6 5
432
1
2002
121110987 6 5
432
1
2003 20041211
10987 6 5
432
1 121110987 6 5
432
1
20051211
10987 6 5
432
1
2006 20071211
10987 6 5
432
1
20161211
10987 6 5
432
1
20081211
10987 6 5
432
1 121110987 6 5
432
1
20091211
10987 6 5
432
1
20101211
10987 6 5
432
1
20111211
10987 6 5
432
1
20121211
10987 6 5
432
1
2013
121110987 6 5
432
1
20141211
10987 6 5
432
1
2015
World 9:23 Western Europe 9:55
Africa 10:04 Middle East 9:38
Asia 9:08 North America 9:54
Central & South America,The Caribbean 10:00 Oceania 10:14
Eastern Europe & Former Soviet Union 9:12
2013
121110987 6 5
432
1
19921211
10987 6 5
432
1
19931211
10987 6 5
432
1
19941211
10987 6 5
432
1
19951211
10987 6 5
432
1
19961211
10987 6 5
432
1
19971211
10987 6 5
432
1
1998 19991211
10987 6 5
432
1 121110987 6 5
432
1
2000 20011211
10987 6 5
432
1 121110987 6 5
432
1
2002
121110987 6 5
432
1
2003 20041211
10987 6 5
432
1 121110987 6 5
432
1
20051211
10987 6 5
432
1
2006 20071211
10987 6 5
432
1
20161211
10987 6 5
432
1
20081211
10987 6 5
432
1 121110987 6 5
432
1
20091211
10987 6 5
432
1
20101211
10987 6 5
432
1
20111211
10987 6 5
432
1
20121211
10987 6 5
432
1
2013
121110987 6 5
432
1
20141211
10987 6 5
432
1
2015
World 9:19 Western Europe 9:40
Africa 9:42 Middle East 9:08
Asia 9:08 North America 10:16
Central & South America,The Caribbean 9:46 Oceania 10:01
Eastern Europe & Former Soviet Union 9:48
2014
121110987 6 5
432
1
19921211
10987 6 5
432
1
19931211
10987 6 5
432
1
19941211
10987 6 5
432
1
19951211
10987 6 5
432
1
19961211
10987 6 5
432
1
19971211
10987 6 5
432
1
1998 19991211
10987 6 5
432
1 121110987 6 5
432
1
2000 20011211
10987 6 5
432
1 121110987 6 5
432
1
2002
121110987 6 5
432
1
2003 20041211
10987 6 5
432
1 121110987 6 5
432
1
20051211
10987 6 5
432
1
2006 20071211
10987 6 5
432
1
20161211
10987 6 5
432
1
20081211
10987 6 5
432
1 121110987 6 5
432
1
20091211
10987 6 5
432
1
20101211
10987 6 5
432
1
20111211
10987 6 5
432
1
20121211
10987 6 5
432
1
2013
121110987 6 5
432
1
20141211
10987 6 5
432
1
2015World 9:23 Western Europe 9:33
Africa 9:09 Middle East 9:21
Asia 9:15 North America 9:55
Central America, The Caribbean 9:12 Oceania 10:08
Eastern Europe & Former Soviet Union 8:51 South America 9:23
2015
121110987 6 5
432
1
19921211
10987 6 5
432
1
19931211
10987 6 5
432
1
19941211
10987 6 5
432
1
19951211
10987 6 5
432
1
19961211
10987 6 5
432
1
19971211
10987 6 5
432
1
1998 19991211
10987 6 5
432
1 121110987 6 5
432
1
2000 20011211
10987 6 5
432
1 121110987 6 5
432
1
2002
121110987 6 5
432
1
2003 20041211
10987 6 5
432
1 121110987 6 5
432
1
20051211
10987 6 5
432
1
2006 20071211
10987 6 5
432
1
20161211
10987 6 5
432
1
20081211
10987 6 5
432
1 121110987 6 5
432
1
20091211
10987 6 5
432
1
20101211
10987 6 5
432
1
20111211
10987 6 5
432
1
20121211
10987 6 5
432
1
2013
121110987 6 5
432
1
20141211
10987 6 5
432
1
2015World 9:27 Western Europe 9:42
Africa 9:00 Middle East 9:10
Asia 9:15 North America 10:01
Central America, The Caribbean 9:47 Oceania 10:06
Eastern Europe & Former Soviet Union 8:59 South America 9:47
2016
121110987 6 5
432
1
19921211
10987 6 5
432
1
19931211
10987 6 5
432
1
19941211
10987 6 5
432
1
19951211
10987 6 5
432
1
19961211
10987 6 5
432
1
19971211
10987 6 5
432
1
1998 19991211
10987 6 5
432
1 121110987 6 5
432
1
2000 20011211
10987 6 5
432
1 121110987 6 5
432
1
2002
121110987 6 5
432
1
2003 20041211
10987 6 5
432
1 121110987 6 5
432
1
20051211
10987 6 5
432
1
2006 20071211
10987 6 5
432
1
20161211
10987 6 5
432
1
20081211
10987 6 5
432
1 121110987 6 5
432
1
20091211
10987 6 5
432
1
20101211
10987 6 5
432
1
20111211
10987 6 5
432
1
20121211
10987 6 5
432
1
2013
121110987 6 5
432
1
20141211
10987 6 5
432
1
2015World 9:31 Western Europe 9:47
Africa 9:09 Middle East 10:06
Asia 9:18 North America 9:58
Central America, The Caribbean 9:38 Oceania 10:01
Eastern Europe & Former Soviet Union 8:51 South America 9:48
2017
121110987 6 5
432
1
19921211
10987 6 5
432
1
19931211
10987 6 5
432
1
19941211
10987 6 5
432
1
19951211
10987 6 5
432
1
19961211
10987 6 5
432
1
19971211
10987 6 5
432
1
1998 19991211
10987 6 5
432
1 121110987 6 5
432
1
2000 20011211
10987 6 5
432
1 121110987 6 5
432
1
2002
121110987 6 5
432
1
2003 20041211
10987 6 5
432
1 121110987 6 5
432
1
20051211
10987 6 5
432
1
2006 20071211
10987 6 5
432
1
20161211
10987 6 5
432
1
20081211
10987 6 5
432
1 121110987 6 5
432
1
20091211
10987 6 5
432
1
20101211
10987 6 5
432
1
20111211
10987 6 5
432
1
20121211
10987 6 5
432
1
2013
121110987 6 5
432
1
20141211
10987 6 5
432
1
2015
World 9:33 Western Europe 9:45
Africa 9:12 Middle East 9:05
Asia 9:25 North America 10:08
Central America, The Caribbean 9:19 Oceania 10:13
Eastern Europe & Former Soviet Union 8:47 South America 9:32

40
2018
World 9:47 Western Europe 10:04
Africa 9:28 Middle East 9:30
Asia 9:48 North America 10:11
Central America, The Caribbean 9:10 Oceania 10:03
Eastern Europe & Former Soviet Union 8:42 South America 9:24
2019
World 9:46 Western Europe 10:06
Africa 8:59 Middle East 9:45
Asia 9:38 North America 10:30
Central America, The Caribbean 9:36 Oceania 10:31
Eastern Europe & Former Soviet Union 9:13 South America 9:38
2020
World 9:47 Western Europe 9:59
Africa 8:34 Middle East 9:35
Asia 9:44 North America 10:33
Central America, The Caribbean 9:38 Oceania 10:20
Eastern Europe & Former Soviet Union 9:30 South America 9:29

41

42
Gring
The time of 2020 is
Woodin
The Environmental Doomsday Clock 2020 9:479:47

Results of the 29th Annual“Questionnaire on Environmental Problems and the Survival of Humankind”
REPORT
September 2020Published by the Asahi Glass Foundation
2nd Floor, Science Plaza, 5-3, YonbanchoChiyoda-ku, Tokyo 102-0081, Japan
Phone +813 5275 0620Fax +813 5275 0871
If you have inquiries regarding this questionnaire,please contact Toshihiro Tanuma at the Asahi Glass Foundation.


2nd Floor, Science Plaza, 5-3, YonbanchoChiyoda-ku, Tokyo 102-0081, JapanTel.: +81 3 5275 0620 Fax: +81 3 5275 0871E-Mail: [email protected]: https://www.af-info.or.jp


