Results of Operations for the Third Quarter of the …...Title Results of Operations for the Third...
13
FREUND CORPORATION Selected by the Japanese Ministry of Economy, Trade and Industry as a Global Niche Top 100 Company (Securities code: 6312) Copyright(C) 2020 Freund Corp. All rights reserved. Results of Operations for the Third Quarter of the Fiscal Year Ending February 29, 2020 January 9, 2020
Transcript of Results of Operations for the Third Quarter of the …...Title Results of Operations for the Third...

FREUND CORPORATIONSelected by the Japanese Ministry of Economy, Trade and Industry as a Global Niche Top 100 Company
(Securities code: 6312)
Copyright(C) 2020 Freund Corp. All rights reserved.
Results of Operations for the Third Quarter of the Fiscal Year
Ending February 29, 2020January 9, 2020

Copyright(C) 2020 Freund Corp. All rights reserved.
Consolidated Financial Summary for 3Q of FY2/20
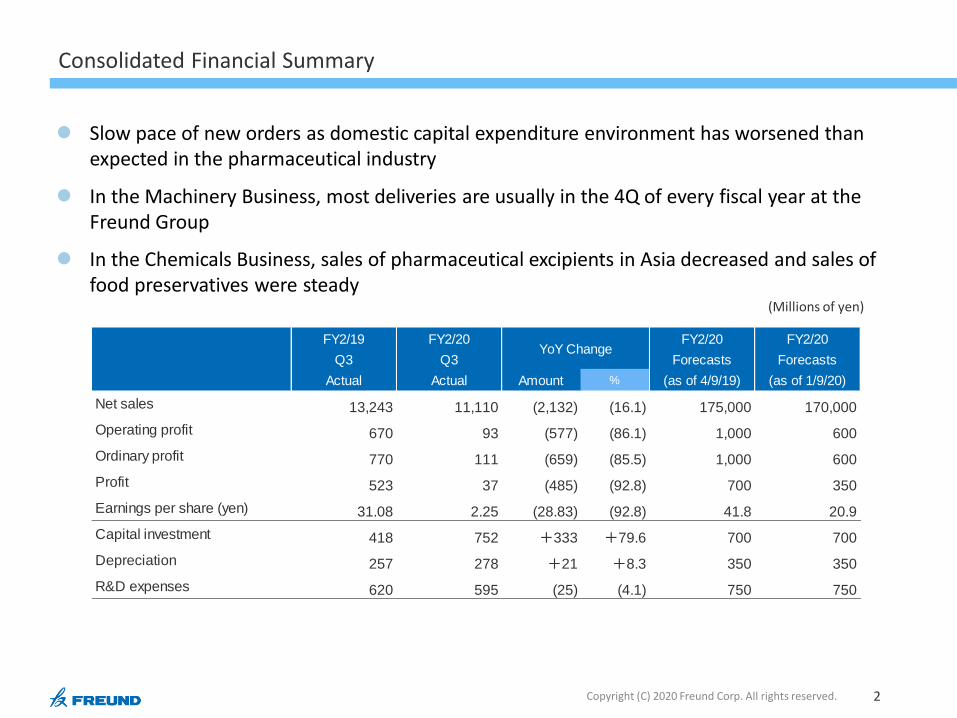
Slow pace of new orders as domestic capital expenditure environment has worsened than expected in the pharmaceutical industry
In the Machinery Business, most deliveries are usually in the 4Q of every fiscal year at the Freund Group
In the Chemicals Business, sales of pharmaceutical excipients in Asia decreased and sales of food preservatives were steady
2
Consolidated Financial Summary
(Millions of yen)
Copyright (C) 2020 Freund Corp. All rights reserved.
FY2/19 FY2/20 FY2/20 FY2/20
Q3 Q3 Forecasts Forecasts
Actual Actual Amount % (as of 4/9/19) (as of 1/9/20)
Net sales 13,243 11,110 (2,132) (16.1) 175,000 170,000
Operating profit 670 93 (577) (86.1) 1,000 600
Ordinary profit 770 111 (659) (85.5) 1,000 600
Profit 523 37 (485) (92.8) 700 350
Earnings per share (yen) 31.08 2.25 (28.83) (92.8) 41.8 20.9
Capital investment 418 752 +333 +79.6 700 700
Depreciation 257 278 +21 +8.3 350 350
R&D expenses 620 595 (25) (4.1) 750 750
YoY Change

Sales By Product Field
Pharmaceutical products: Fewer new orders due to weak demand in Japan for
pharmaceutical equipment
Industrial products: Slowdown in sales of machinery to customers in China and South Korea
Segment Profit
Decreased earnings caused in part by losses at two subsidiaries
3
Machinery Business: Overview
(Millions of yen)
Copyright (C) 2020 Freund Corp. All rights reserved.
FY2/19 FY2/20 FY2/20 FY2/20
Q3 Q3 Forecasts Forecasts
Actual Actual Amount % (as of 4/10/19) (as of 1/9/20)
Net sales 8,723 6,749 (1,973) (22.6) 11,500 11,000
医薬品関連Pharmaceutical Products 7,068 5,710 (1,357) (19.2) - -
産業関連Industrial Products 1,655 1,039 (616) (37.2) - -
Operating profit 295 (142) (437) - - -
Orders received 8,620 7,208 (1,412) (16.4) - -
Pharmaceutical Products 7,343 5,924 (1,419) (19.3) - -
Industrial Products 1,277 1,284 +6 +0.5 - -
Order backlog 5,818 5,994 +176 +3.0 - -
医薬品関連Pharmaceutical Products 5,288 5,228 (60) (1.1) - -
産業関連Industrial Products 529 765 +236 +44.7 - -
110.44 108.87 -1.57 yen/dollar (1.4) 105.00 105.00Yen/dollar rate
(+ is yen depreciation)
YoY change

Freund Corporation: Sales decline caused higher fixed expense ratio
Freund-Vector: A loss in the first three quarters because most sales and earnings
are in the 4Q of every fiscal year
Freund-Turbo: Posted a loss because of the cost of a new business site and
higher new product development expenses
4
Machinery Business: Group Company Performance
(Millions of yen)
Copyright (C) 2020 Freund Corp. All rights reserved.
FY2/19 FY2/20 FY2/20 FY2/20
Q3 Q3 Forecasts Forecasts
Amount Amount Amount % (as of 4/10/19) (as of 1/9/20)
Net sales 8,723 6,749 (1,973) (22.6) 11,500 11,000
FREUND CORPORATION 5,589 4,130 (1,458) (26.1) - -
FREUND-VECTOR 2,213 2,126 (87) (3.9) - -
FREUND-TURBO 1,485 823 (662) (44.6) - -
Operating profit 295 (142) (437) - - -
FREUND CORPORATION 537 134 (402) (74.9) - -
FREUND-VECTOR (227) (195) - - - -
FREUND-TURBO (14) (81) - - - -
Orders received 8,620 7,208 (1,412) (16.4) - -
FREUND CORPORATION 4,729 3,771 (958) (20.3) - -
FREUND-VECTOR 2,919 2,404 (515) (17.6) - -
FREUND-TURBO 971 1,032 +60 +6.3 - -
Order backlog 5,818 5,994 +176 +3.0 - -
FREUND CORPORATION 3,506 3,685 +179 +5.1 - -
FREUND-VECTOR 2,000 1,604 (396) (19.8) - -
FREUND-TURBO 310 704 +393 +126.5 - -
YoY change

Japan: Decrease in the number of projects and no contribution from
new products
North and South Americas: Sales in North America remained largely unchanged YoY
Europe: Sales remained unchanged YoY
Other (Asia): Slowdown in sales of battery machinery in India and China
5
Machinery Business: Sales by Region
(Millions of yen)
Copyright (C) 2020 Freund Corp. All rights reserved.
FY2/19 FY2/20 FY2/20 FY2/20
Q3 Q3 Forecasts Forecasts
Amount Amount Amount % (as of 4/10/19) (as of 1/9/20)
Net sales 8,723 7,080 (1,642) (18.8) 11,500 11,000
Japan 5,846 4,265 (1,581) (27.0) - -
Overseas 2,876 2,489 (387) (13.5) - -
North and South Americas 1,726 1,743 +16 +1.0 - -
Europe and Africa 270 236 (34) (12.7) - -
Middle East, Asia and Pacific 879 509 (369) (42.1) - -
YoY change

Machinery Business: Quarterly Results (by Product Field)
6
Net sales(Millions of yen)
Operating profit margin
Copyright (C) 2020 Freund Corp. All rights reserved.
(25.0)%
(20.0)%
(15.0)%
(10.0)%
(5.0)%
0.0%
5.0%
10.0%
15.0%
20.0%
(1,000)
0
1,000
2,000
3,000
4,000
5,000
Q1 Q2 Q3 Q4 Q1 Q2 Q3 Q4 Q1 Q2 Q3 Q4 Q1 Q2 Q3 Q4 Q1 Q2 Q3 Q4 Q1 Q2 Q3 Q4 Q1 Q2 Q3
FY2/14 FY2/15 FY2/16 FY2/17 FY2/18 FY2/19 FY2/20
Pharmaceutical Products
Industrial Products
Operating profit margin

Machinery Business: Quarterly Results (Net Sales/Orders Received/Order Backlog)
7
(Millions of yen)
Copyright (C) 2020 Freund Corp. All rights reserved.
0
2,000
4,000
6,000
8,000
10,000
Q1 Q2 Q3 Q4 Q1 Q2 Q3 Q4 Q1 Q2 Q3 Q4 Q1 Q2 Q3 Q4 Q1 Q2 Q3 Q4 Q1 Q2 Q3 Q4 Q1 Q2 Q3
FY2/14 FY2/15 FY2/16 FY2/17 FY2/18 FY2/19 FY2/20
Order backlog
Orders received
Net sales

Machinery Business: Quarterly Results (Orders Received and Order Backlog by Product Field)
8
(Millions of yen)
Copyright (C) 2020 Freund Corp. All rights reserved.
0
2,000
4,000
6,000
8,000
10,000
Q1 Q2 Q3 Q4 Q1 Q2 Q3 Q4 Q1 Q2 Q3 Q4 Q1 Q2 Q3 Q4 Q1 Q2 Q3 Q4 Q1 Q2 Q3 Q4 Q1 Q2 Q3
FY2/14 FY2/15 FY2/16 FY2/17 FY2/18 FY2/19 FY2/20
Order Backlog (Pharmaceutical Products)
Order Backlog (Industrial Products)
Orders Received (Pharmaceutical Products)
Orders Received (Industrial Products)

Net Sales
Pharmaceutical excipients: Solid sales growth in Japan
Food preservatives: Performing as planned, including activities to start selling
food preservatives in other countries
Export: Decline in sales to a major customer in India
Segment Profit: Higher because of an improvement in the product mix
9
Chemicals Business: Overview
*1: Sales to India, South Korea and Taiwan
(Millions of yen)
Copyright (C) 2020 Freund Corp. All rights reserved.
FY2/19 FY2/20 FY2/20 FY2/20
Q3 Q3 Forecasts Forecasts
Amount Amount Amount % (as of 4/10/19) (as of 1/9/20)
Net sales 4,519 4,360 (159) (3.5) 6,000 6,000
Pharmaceutical Excipients 2,346 2,271 (75) (3.2) - -
Food Preservatives 1650 1583 (67) (4.1) - -
Dietary Supplement Products 522 506 (16) (3.1) - -
(Export sales)*1 301 111 (189) (62.9) - -
Operating profit 781 652 (128) (16.5) - -
YoY change
1,650 1,583

Chemicals Business: Quarterly Results (by Product Field)
10
Net sales(Millions of yen)
Operating profit margin
Copyright (C) 2020 Freund Corp. All rights reserved.
0.0%
5.0%
10.0%
15.0%
20.0%
0
500
1,000
1,500
2,000
2,500
Q1 Q2 Q3 Q4 Q1 Q2 Q3 Q4 Q1 Q2 Q3 Q4 Q1 Q2 Q3 Q4 Q1 Q2 Q3 Q4 Q1 Q2 Q3 Q4 Q1 Q2 Q3
FY2/14 FY2/15 FY2/16 FY2/17 FY2/18 FY2/19 FY2/20
Pharmaceutical Excipients
Food Preservatives
Dietary Supplement Products
Operating profit margin

(Millions of yen)
Po
sitive factors
11Copyright (C) 2020 Freund Corp. All rights reserved.
670
93+25
+39+32
△589
+18 +14 △15 △28
△73
0
100
200
300
400
500
600
700
800
2019/2月期 3Q 2020/2月期 3Q
粗利増減
人件費
減価
償却費旅費
交通費
販売
手数料
その他
のれん
償却費広告
宣伝費
事務
委託費
Change in Consolidated Operating Profit
The decrease in the gross profit is the largest component of the change in operating profit
The change in SG&A expenses was a normal movement linked to the volume of business activities
Q3 FY2/19 Q3 FY2/20
Decrease in gross profit
Sales Commission
Advertising Expenses
Other
Amortization of goodwill
Traveling Expenses
DepreciationOperations
consignment expenses Personnel
Expenses
(15) (28)
(73)
(589)

12Copyright (C) 2020 Freund Corp. All rights reserved.
Inquiries:
Freund Corporation
Corporate Planning Division
Investor Relations and Public Relations Office
Tel: +81-3-6890-0767
Fax: +81-3-6890-0870
Email: [email protected]
IR website: http: //www.freund.co.jp
This presentation contains forward-looking statements involving plans, outlooks, strategies and policies. These statements reflect the judgments of management and assumptions based on information available at the time of this presentation. Actual results of operations may differ from these statements for a number of reasons. Consequently, forecasts and other forward-looking statements are not guarantees about future performance. Although Freund has checked this presentation carefully, there is still a possibility of errors in this information.