Results from a randomised controlled trial evaluating Mindfulness-Based Stress Reduction in Women...
34
Results from a randomised controlled trial evaluating Mindfulness-Based Stress Reduction in Women with stages 0 to III Breast Cancer Caroline Hoffman, PhD Clinical and Research Director, The Haven London – Hereford - Leeds [email protected]
-
Upload
oliver-baker -
Category
Documents
-
view
214 -
download
0
Transcript of Results from a randomised controlled trial evaluating Mindfulness-Based Stress Reduction in Women...

Results from a randomised controlled trial evaluating Mindfulness-Based Stress Reduction in Women with
stages 0 to III Breast Cancer
Caroline Hoffman, PhD Clinical and Research Director,
The HavenLondon – Hereford - Leeds

Introduction
• The Haven –Breast Cancer Support Centres
• Registered Charity in London, Hereford, Leeds
• Study setting – Fulham, SW London

What does the Haven do?
• ‘No-one should have to face breast cancer alone’
• Offering free support, information and complementary therapies before, during and after medical treatment.
• We have an outreach programme called The Haven at Home (2.5h DVD and 1h CD) for people who cannot reach a Haven

Hypothesis Tested
There would be a difference in the intervention group compared to controls as a consequence of being exposed to MBSR in mood, disease-related quality-of-life, including endocrine symptoms, and wellbeing for women with stages 0 to 3 breast cancer, measured after 8- and 12-weeks.

Additional research questions
1) Is there a dose-related effect from attending more MBSR classes?
2) Is there a dose-related effect from doing MBSR home practice during the 8-week program?

Study numbers
• Power calculation based on POMS figures from Speca et al (2000)
• To achieve 80% power, aimed to recruit 240 participants, which allowing for dropouts, was to obtain 170 completed data sets.
• We needed 85 participants per arm• Sample - women who had attended the Haven

Inclusion criteria
• Female• Diagnosis of stages 0 – III breast cancer• Age 18 – 80 years• Ability to complete a questionnaire• Aware of cancer diagnosis• Between 2-24 months following completion of
surgery, chemotherapy and/or radiotherapy• Had participated in the Haven Programme

Exclusion Criteria
• Diagnosis of Stage 1V breast cancer• Non-English speaking• Substance misuse• Suicidal thoughts• Unable to give informed consent due to
psychosis or apparent serious intellectual impairment

Recruitment method
• Eligible women were sent a letter of invitation• Invited to attend a 1:1 recruitment interview• Randomised into two groups• 229 women recruited into the study, average of 9 months post
hospital treatment• 114 in intervention group, average age 49• 115 in control group, average age 50• Controls given measurement tools at weeks 0, 8, 12 then
offered MBSR programme afterwards• MBSR offered between 2005-2006

Stages of breast cancer at diagnosis
Intervention Group (N=114)
• Stage 0: 11 (9.6%)• Stage 1: 34 (29.8%)• Stage 2: 47 (41.2%)• Stage 3: 22 (19.3%)
Control Group (N=115)
• Stage 0: 6 (5.2%)• Stage 1: 45 (39.1%)• Stage 2: 47 (40.9%)• Stage 3: 17 (14.8%)

Measurement Tools
• Profile of Mood States (POMS) (65 item) Primary outcome measure
• FACT-B (Breast) (37 item) plus FACT ES (Endocrine Symptoms) (19 item) (Quality of Life measures)
• WHO-5 Wellbeing scale (5 item)
• Completed at Weeks 0, 8 - 10, 12-14
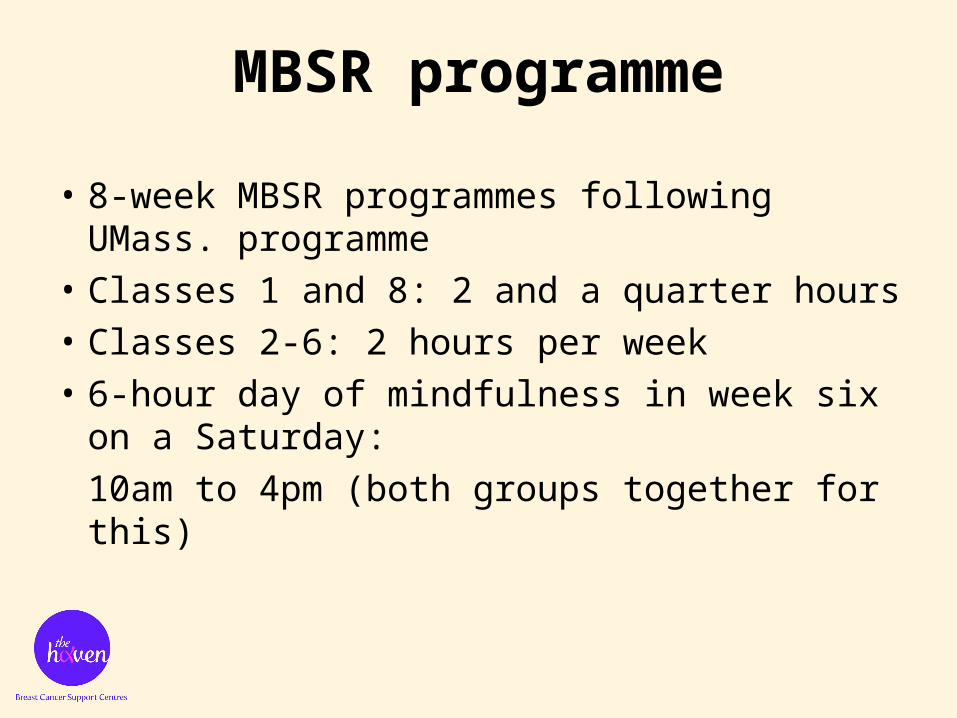
MBSR programme
• 8-week MBSR programmes following UMass. programme
• Classes 1 and 8: 2 and a quarter hours• Classes 2-6: 2 hours per week• 6-hour day of mindfulness in week six on a
Saturday:10am to 4pm (both groups together for this)

Number and sizes of classes
• Class sizes: Up to 22 participants• Pilot group• 7 cycles of 8 week programmes (13 groups)• Clinical supervision by phone

The Rose Room at the Haven in London

Reception at the Haven in London

Home Practice
• Home Practice Manual provided including photos of stretching exercises, meditation sitting positions, information on stress, some stories, exercises
• 4 x 45 minute CDs made for this research programme: Body Scan, Lying Stretches, Sitting Meditation, Standing Stretches
• Home practice sheets given out each week
• Record of formal home mindfulness practice kept and returned

Profile of Mood States (primary outcome measure)
• Total Mood Disturbance
Subscales: Tension-AnxietyDepression-DejectionAnger-HostilityVigour-ActivityFatigue-InertiaConfusion-Bewilderment
T1 = weeks -2 to 0, T2 = weeks 8 to 10, T3 = weeks 12 to 14

Primary outcome : Means (SD)for POMS Total Mood Disturbance and subscales and estimates of treatment effects (95% CI)
Outcome measure Experimental (N=103)
mean (SD)
Control (N=111)
mean (SD)
Mean difference (95% CI) between groups at T2 and T3
Model 1 – no covariates; T1 included as a repeated measure
Model 2 – includes T1 as a covariate
Model 3 – includes T1 and Depression-Dejection subscale as covariates
Total score
T1 Total Mood Disturbance 43.65 (34.73) 49.23 (39.37) Reference NA NA
T2 Total Mood Disturbance 30.02 (31.60) 48.08 (39.89) -12.48 (-22.32,-2.65) -15.30 (-23.75, -6.86) -15.23 (-23.77, -6.68)
T3 Total Mood Disturbance 29.83 (34.19) 45.47 (35.67) -10.7 (-19.67, -0.47) -12.91 (-21.02, -4.81) -13.51 (-21.69, -5.33)
Interaction time*group P=0.04 P=0.558 P=0.676
Group effect - P<0.001 P<0.001
Subscales
T1 Tension-Anxiety 13.16 (7.20) 13.42 (7.24) Reference NA NA
T2 Tension-Anxiety 10.32 (7.0) 13.36 (7.20) -2.78 (-4.85,-0.71) -2.93 (-4.67, -1.20) -2.77 (-4.53, -1.02)
T3 Tension-Anxiety 10.33 (7.02) 12.73 (6.59) -2.14 (-4.18, -0.11) -2.30 (-3.96, -0.63) -2.27 (-3.96, -0.59)
Interaction time*group P=0.026 a P=0.493 P=0.594
Group effect - P<0.001 a P=0.001 a
T1 Depression-Dejection †† 12.79 (10.76) 15.70 (12.79) Reference NA NA
T2 Depression-Dejection 10.0 (9.95) 14.96 (13.23) -2.06 (-5.09, 0.97) -3.39 (-6.06, -0.71) NA
T3 Depression-Dejection 10.34 (10.32) 14.10 (11.60) -0.85 (-3.85, 2.15) -2.32 (-4.86, 0.22) NA
Interaction time*group P=0.350 a P=0.365 NA
Group effect - P=0.017 a NA
T1 Anger-Hostility 10.75 (8.08) 11.60 (8.62) Reference NA NA
T2 Anger-Hostility 8.78 (7.57) 11.11 (8.88) -1.48 (-3.85, 0.89) -1.96 (-3.96, 0.05) -1.99 (-4.01, 0.03)
T3 Anger-Hostility 7.87 (6.72) 11.04 (8.95) -2.31 (-4.33, -0.29) -2.69 (-4.44, -0.95) -2.82 (-4.58, -1.06)
Interaction time*group P=0.079 a P=0.458 P=0.410
Group effect - P=0.005a P=0.004 a
T1 Vigor-Activity -14.31 (6.53) -14.06 (6.19) Reference NA NA
T2 Vigor-Activity -15.91 (6.0) -13.57 (6.61) -2.08 (-3.76, -0.41) -2.21 (-3.67, -0.75) -2.21(-3.69, -0.73)
T3 Vigor-Activity -16.23 (6.63) -13.47 (6.22) -2.51 (-4.21, -0.80) -2.63 (-4.12, -1.15) -2.67 (-4.17, -1.16)
Interaction time*group P=0.01a P=0.606 P=0.584
Group effect - P<0.001a P<0.001 a
T1 Fatigue-Inertia 11.17 (6.64) 11.75 (7.20) Reference NA NA
T2 Fatigue-Inertia 8.71 (6.10) 11.62 (7.16) -2.33 (-4.31, -0.35) -2.68 (-4.31, -1.04) -2.63 (-4.28, -0.98)
T3 Fatigue-Inertia 9.27 (6.90) 11.39 (6.73) -1.53 (-3.43, 0.37) -1.84 (-3.45, -0.22) -1.96 (-3.58, -0.33)
Interaction time*group P=0.068a P=0.324 P=0.427
Group effect - P=0.002a P=0.002a
T1 Confusion-Bewilderment 10.11 (5.58) 10.65 (5.57) Reference NA NA
T2 Confusion-Bewilderment 8.13 (4.71) 10.33 (5.30) -1.65 (-2.96, -0.34) -1.91 (-3.01, -0.81) -1.93 (-3.04, -0.82)
T3 Confusion-Bewilderment 8.24 (5.32) 9.63 (4.31) -0.84 (-2.15, 0.47) -1.09 (-2.20, 0.01) -1.20 (-2.31, -0.09)
Interaction time*group P=0.042a P=0.141 P=0.189
Group effect P=0.002a P=0.002a

POMS Statistically Significant Results from MBSR compared to controls using
Repeated Measures ANOVA
Without adjusting for baseline scores• Total mood disturbance, anxiety, vigour at T2 and T3• Confusion at T2 only
After adjusting for baseline scores, there is more significance:• Total Mood Disturbance, anxiety, vigour, fatigue, confusion
at both T2 and T3• Depression at T2 only• Anger at T3 only

FACT - Quality of Life measure
• FACT-B (breast) and FACT ES (endocrine symptoms)• Physical wellbeing (PWB)• Social and family wellbeing (SWB)• Emotional wellbeing (EWB)• Functional wellbeing (FWB)• Breast-specific subscale (B)• Endocrine-specific subscale (ES)

FACT-B and FACT-ES Results Statistically Significant Results from MBSR compared to controls using
Repeated Measures ANOVAWithout adjusting for baseline scores• FACT-B, FACT-B TOI, FACT-ES, FACT-ES TOI, PWB and FWB at both
T2 and T3 • SWB at T2 only• EWB at T3 onlyAfter adjusting for baseline scores• FACT-B, FACT-B TOI, FACT-ES, FACT-ES TOI, PWB, EWB and FWB at
T2 and T3 • SWB at T2 only • In addition EWB T3 scores were significantly greater than at T2

Clinical Significance for FACT from MBSR at T2 and T3
• FACT-B• FACT-B TOI

WHO-5 Wellbeing QuestionnaireStatistically Significant Results from MBSR
compared to controls using Repeated Measures ANOVA
Without adjusting for baseline scores• WHO-5 at both T2 and T3
After adjusting for baseline scores• WHO-5 at both T2 and T3

Clinical Significance for WHO-5
WHO-5 mean (SD) % score
Intervention (N=102) Control (N=110) Level of clinical significance in % (changes of ≥10% are significant)
T1 WHO-5 52.2% 50.1% 1.1%
T2 WHO-5 59.6% 50.4% 9.2%
T3 WHO-5 60.3% 50.6% 9.7%
T1= weeks -2 to 0, T2= weeks 8 to 10, T3 = weeks 12 to 14

Increased hours mindfulness home practice predicted improved scores
• At T2 for POMS anger (p=0.005) and WHO-5 (p=0.014)
• At T3 POMS subscales: vigor (p=0.029), confusion (p=0.001)FACT scales FACT-ES (p=0.006), FACT-ES TOI (p=0.003)WHO-5 item wellbeing scale (p=0.001).


Qualitative data feedback
• Do you believe you have experienced a greater degree of mindfulness as a result of participating in the stress reduction programme? Yes No
• Can you give some examples in your life where this has occurred?
• Please write down the most positive effect that this eight-week programme and mindfulness practice has had in your life
• Please write down what you found the most challenging about the programme and the mindfulness practice
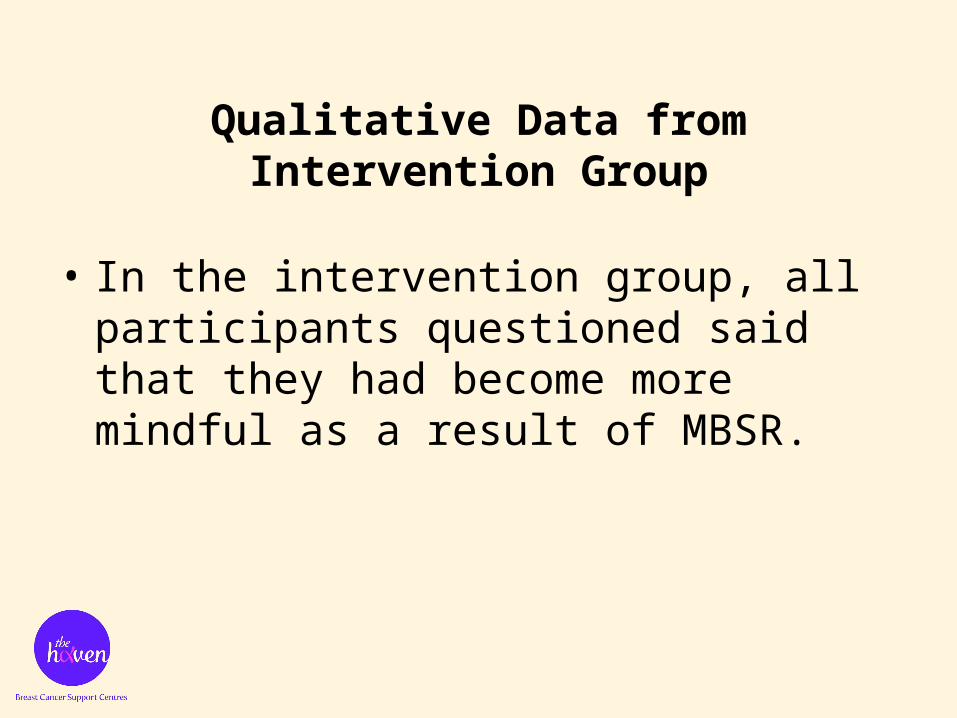
Qualitative Data from Intervention Group
• In the intervention group, all participants questioned said that they had become more mindful as a result of MBSR.

A summary of themes from the qualitative data
Main themes (N = 92) (%)
Being calmer, centred, at peace, connected and more confident
30 (32.6%)
The value and challenges of mindfulness practice
28 (30.4%)
Being more aware 27 (29.3%)
Coping with stress, anxiety and panic 27 (29.3%)
Accepting things as they are, being less judgemental of myself and others
18 (19.6%)
Improved communication and personal relationships
16 (17.4%)
Making time and creating space for myself 15 (16.3%)

How mindfulness has helped mood state
• ‘it has given me a number of tools to deal with stress and tension and also helped me trust my inner voice more. As a result I am much more “with me” and feel a bit more confident’

How mindfulness helped with pain and symptoms
‘I at first wondered if the program was for me. After the first session, I was in tears, but Caroline convinced me to continue with the body scan and I did. It has helped greatly with my pain (peripheral neuropathy for 18 mo). The other practices have helped with my daily stress and remaining calm.’

How mindfulness helped with perception and life
‘The most positive effect has been the ability to stand back and view situations / thoughts / events in their true context and being more generally aware, my life has a greater quality, is more enhanced’

Final comments
‘Great to be supported through a difficult time and this has truly been a gift that I will always have and I think not only support me, but my family and friends because I will be in a better place’

Questions?