RESULTS ANNOUNCEMENT FOR THE YEAR ENDED …...2019/08/30 · INVESTMENT PORTFOLIO Eildon Capital...
43
RESULTS ANNOUNCEMENT FOR THE YEAR ENDED 30 JUNE 2019 INTRODUCTION Eildon Capital Limited (ASX: EDC) is pleased to report a full year net profit after tax of $4.4 million (2018: $3.0 million) representing a 46% increase over the prior corresponding period. Net tangible assets at 30 June 2019 totalled $48.2 million (2018: $47.9 million), representing $1.06 per share. During the year, fully franked dividends of 7.7 cents per share were paid to shareholders. Based on the 28 June 2019 share price of $1.02, this represents a fully franked dividend yield of 7.6% (equivalent to a pre-tax yield of 10.8%, after grossing up the impact of franking credits). Since listing on the ASX in February 2017 total dividends have been 21.9 cents per share. INVESTMENT PORTFOLIO Eildon Capital has fully committed its available funds, with the current investment portfolio value amounting to approximately $42.4 million as at 30 June 2019 plus a further $6.7 million of commitments to fund further loan investments. The investment portfolio as at 30 June 2019, includes 11 debt related loan investments, generating interest returns, representing approximately 89% of the portfolio value, which provides a level of capital protection should property markets weaken and values stagnate or decrease. The balance of the portfolio, comprising 4 investments, represent strategic equity investments in property projects that have the potential to experience meaningful capital growth via either asset repositioning, market re-rating or planning outcomes. The portfolio has geographic diversity with investments in Queensland, Victoria and New South Wales. For personal use only
Transcript of RESULTS ANNOUNCEMENT FOR THE YEAR ENDED …...2019/08/30 · INVESTMENT PORTFOLIO Eildon Capital...

RESULTS ANNOUNCEMENT
FOR THE YEAR ENDED 30 JUNE 2019
INTRODUCTION
Eildon Capital Limited (ASX: EDC) is pleased to report a full year net profit after tax of $4.4 million (2018: $3.0 million) representing a 46% increase over the prior corresponding period. Net tangible assets at 30 June 2019 totalled $48.2 million (2018: $47.9 million), representing $1.06 per share.
During the year, fully franked dividends of 7.7 cents per share were paid to shareholders. Based on the 28 June 2019 share price of $1.02, this represents a fully franked dividend yield of 7.6% (equivalent to a pre-tax yield of 10.8%, after grossing up the impact of franking credits).
Since listing on the ASX in February 2017 total dividends have been 21.9 cents per share.
INVESTMENT PORTFOLIO
Eildon Capital has fully committed its available funds, with the current investment portfolio value amounting to approximately $42.4 million as at 30 June 2019 plus a further $6.7 million of commitments to fund further loan investments.
The investment portfolio as at 30 June 2019, includes 11 debt related loan investments, generating interest returns, representing approximately 89% of the portfolio value, which provides a level of capital protection should property markets weaken and values stagnate or decrease.
The balance of the portfolio, comprising 4 investments, represent strategic equity investments in property projects that have the potential to experience meaningful capital growth via either asset repositioning, market re-rating or planning outcomes.
The portfolio has geographic diversity with investments in Queensland, Victoria and New South Wales.
For
per
sona
l use
onl
y

OUTLOOK AND STRATEGIC REVIEW
The property market continues to experience a degree of volatility, with a tightening of credit markets as well as falls in values across different segments. The tightening credit market has been created by banks shifting towards offering increasingly commoditised homogeneous products whose structure and pricing are not efficiently differentiated based on underlying risks of the transactions. This has meant that flexible lenders like Eildon Capital are able to achieve higher returns and improved security on loans.
The real estate lending market totals approximately $271 billion. Previously major Australian Banks have funded approximately 80% of this segment. With changes to security requirements imposed by APRA, Australian Banks have reduced this exposure to approximately 65%. This has seen a growing number of non-banks become active in this segment, providing approximately $28 billion of funding as at December 2018. Eildon Capital is part of this growing segment.
Investors are continuing to seek regular, stable and secure income as interest rates have been falling. Eildon Capital, with 96% of the existing portfolio delivering these types of returns has become an
For
per
sona
l use
onl
y

attractive option for these investors. With a track record of success and stable dividends, Eildon can continue to provide value for investors.
CAPITAL MANAGEMENT
Eildon Capital is considered to be fully invested but continues to review prospective opportunities to redeploy cash returned from investments.
A fully franked dividend of 1.925 cents per share for the June quarter was paid on 24 July 2019. It is expected that Eildon Capital will continue to pay dividends at this level. The anticipated dividend payment calendar for the next 12 months is as follows:
Quarter Anticipated Payment Date
September, 2019 24 October, 2019
December, 2019 24 January, 2020
March, 2020 24 April, 2020
June, 2020 24 July, 2020
Mark Avery Managing Director 26 August 2019
For
per
sona
l use
onl
y

Appendix 4E
Preliminary Final Report
Results for announcement to the market
Eildon Capital Limited
ABN Financial Year ended
(‘Reporting Period’)
Previous Financial Year ended
(‘Corresponding period’)
11 059 092 198 30 June 2019 30 June 2018
Results
Income from ordinary activities up/down 42% to $7,636,774 Profit after tax attributable to members up/down 46% to $4,386,508 Net profit for the period attributable to members up/down 46% to $4,386,508
Dividends (distributions)
Payment Date Amount per
security
Franked amount per security
June 2019 Ordinary Dividend 24 July 2019 1.925¢ 1.925¢
March 2019 Ordinary Dividend 24 April 2019 1.925¢ 1.925¢
December 2018 Ordinary Dividend 24 January 2019 1.925¢ 1.925¢
September 2018 Ordinary Dividend 24 October 2018 1.7875¢ 1.7875¢
Information on Dividends: A fully franked dividend in respect of the June 2019 quarter for the financial year ended 30 June 2019 of 1.925 cents per share was paid on 24 July 2019. The Dividend Reinvestment Plan has been suspended until such time as a there is a better correlation between the share price and the underlying net asset value of Eildon Capital Limited. As a result, the Dividend Reinvestment Plan is not in operation in relation of the payment of the dividend.
Net tangible asset per security
Year ended 30 June 2019
Year ended 30 June 2018
Net assets per share
Net tangible assets (“NTA”) per share
$1.06
$1.06
$1.04
$1.04
The preliminary final report is based on accounts that have been audited. Commentary
Brief explanation of any of the figures reported above: Please refer to the attached commentary for a detailed review.
For
per
sona
l use
onl
y

Eildon Capital Limited
ACN 059 092 198
2019 Annual Report
The financial report was authorised for issue by the Directors on 30 August 2019.
The Company has the power to amend and reissue the financial report.
For
per
sona
l use
onl
y

1
Eildon Capital Limited
Company Particulars
REGISTERED OFFICE: Level 25 360 Collins Street MELBOURNE VIC 3000 Tel: (03) 9691 5480
DIRECTORS: James R Davies - Chairman Mark A Avery Alexander D H Beard Michelle E Harpur
SECRETARY: John A Hunter
BANKERS: Westpac Banking Corporation Limited Bank of Western Australia Limited
AUDITORS: HLB Mann Judd Chartered Accountants Level 19 207 Kent Street Sydney NSW 2000
SHARE REGISTRY: Computershare Investor Services Pty Limited Level 4, 60 Carrington Street Sydney, NSW, 2000
DOMICILE: Australia
For
per
sona
l use
onl
y

2
Eildon Capital Limited
Directors’ Report For the Year Ended 30 June 2019
The Directors present their report together with the financial report of Eildon Capital Limited (the “Company”) for the year ended 30 June 2019 and the Auditors’ Report thereon. Directors The Directors in office at the date of this report and at all times during the year are: Mark Anthony Avery (Managing Director) B.Com.Pl.Ds. (UOM) Mr Avery began his professional career at Macquarie Group in 2002 in the property finance and residential development divisions. Mr Avery also worked for private and listed property development and investment groups. Mr Avery commenced at CVC Limited, the former parent of the Company, in 2010, and has been responsible for all of the group’s real estate investment activities, including appointed as Managing Director of the Company in 2015. He is managing director and Chief Executive Officer of CVC Limited and director of Eildon Funds Management Limited. Alexander Damien Harry Beard (Non-Executive Director) B.Com. (UNSW) FCA AICD Mr Beard is a Chartered Accountant with extensive experience in private equity investing. He is director of US Residential Fund, Probiotec Limited, Tasfoods Limited and Shellfish Culture Limited. He is also formerly a Chairman and non-executive director of Cellnet Group Limited, Managing Director and Chief Executive Officer of CVC Limited and Director of Eildon Funds Management Limited. Mr Beard is a member of the Audit Committee of the Company. James R Davies (Independent Director) Bachelor of Computing Science (University of New England) MBA (London Business School) Graduate of the Australian Institute of Company Directors and member of the audit committee of the Company. Mr Davies has over 30 years’ experience in investment management across real estate, private equity, infrastructure, natural resources and distressed asset management. Most recently he was Head of Funds Management at New Forests Asset Management. Prior to that he held Director roles at Hastings Funds Management Limited and Royal Bank of Scotland’s Strategic Investments Group. He has been appointed on numerous Investment Committees and Boards including as Chairman of Timberlink Australia, Forico and Airport Rail Link. Michelle E Harpur (Independent Director) B.A. (UNSW) L.L.B. (UNSW) Chairman of the audit committee of the Company. She completed and passed the Company Directors Course with the AICD in early 2016, and in 2010 also attended a Harvard Business School Executive Education Program “Managing Professional Services Firms”. Mrs Harpur has been a partner in mid-size, large and international law firms since 1992, and is principle of Harpur Phillips. She was admitted as a solicitor in 1986. Over many years, her clients have included listed public companies and private companies involved in property development, and in addition to governance and risk management. Company Secretary:
John Andrew Hunter B.Com. (ANU), MBA (MGSM), MAppFin (MAFC), CA Mr Hunter has experience in senior finance roles in the Financial Services industry in retail and wholesale funds management entities as well as holding senior finance roles in various other public and private companies.
For
per
sona
l use
onl
y

3
Eildon Capital Limited
Directors’ Report For the Year Ended 30 June 2019
Directors’ meetings The number of directors’ meetings attended, and the number of directors’ meetings eligible to attend during their period in office by each of the Directors of the Company during the financial year were as follows:
Number of meetings attended Number of meetings held
M A Avery 4 4 A D H Beard 4 4 J R Davies 4 4 M E Harpur 4 4 Audit Committee meetings The Company has an audit committee. The number of meetings and the number of meetings attended by each of the Directors on the audit committee during the financial year were: Number of meetings attended Number of meetings held
A D H Beard 2 2
J R Davies 2 2 M E Harpur 2 2 Directors’ benefits Information on Directors’ remuneration is included in the remuneration report in the financial statements. Directors’ interests in shares of the Company The relevant interest of each director in the ordinary share capital of the Company at the date of this report is included in the remuneration report. Principal activities The Company is an active property investment company which participates in retail, industrial, residential and commercial opportunities. Operating results The Company recorded an after tax profit of $4,386,508 (2018: $3,006,055).
For
per
sona
l use
onl
y

4
Eildon Capital Limited
Directors’ Report For the Year Ended 30 June 2019
Dividends Dividends proposed or paid during the year and included within the statement of changes in equity by the Company are:
Cents Per
Share
Total $
Date of Payment
Tax rate for Franking Credits
Percentage Franked
2019 June quarter dividend on ordinary shares 1.925 875,555 24-Jul-19 30% 100%
2019 March quarter dividend on ordinary shares 1.925 876,961 24-Apr-19 30% 100%
2018 December quarter dividend on ordinary shares 1.925 886,693 24-Jan-19 30% 100%
2018 September quarter dividend on ordinary shares 1.925 886,290 24-Oct-18 30% 100%
Review of Operations During the financial year, the Company generated $7.4 million (2018: $5.2 million) of interest income from property loans. The Company is currently holding loan investments totalling $37.8 million (2018: $35.3 million) with approximately 90% by value of the portfolio being made into debt related loan investments. Although the Company currently has current cash balances of $6.7 million (2018: $10.2 million) it has further commitments to fund existing loans of $6.8 million (2018: $5.8 million). The balance of the investment portfolio, comprising 4 investments, represents strategic equity investments in property projects that have the potential to experience meaningful capital growth via either asset repositioning, market re-rating or planning outcomes. The Company continues to redeploy loans repaid into new loan investments, repayments received during the financial year on four loans totalling $24.3 million, while five new loan investments were made during the year amounting to $25.2 million. Remuneration Report (Audited) This report outlines the remuneration arrangements in place for key management personnel of the Company in accordance with the requirements of the Corporations Act 2001 and its regulations. This information has been audited as required by s. 308(3C) of the Corporations Act 2001. The remuneration report details the remuneration arrangements for key management personnel who are defined as those persons having authority and responsibility for planning, directing and controlling the major activities of the Company. Remuneration philosophy The performance of the Company depends upon its ability to attract and retain quality people. The Company is committed to developing a remuneration philosophy of paying sufficient competitive ‘base’ rewards to attract and retain high calibre personnel in order to create value for shareholders. Remuneration structure Non-Executive Director’s remuneration is solely in the form of fees and has been set by shareholders at a maximum aggregate amount of $150,000, to be allocated amongst the Directors.
Other than the directors and company secretary there are no other key management personnel employed by the Company.
The Company does not have a remuneration committee with the remuneration of the non-executive directors determined by the Board of the Company.
For
per
sona
l use
onl
y

5
Eildon Capital Limited
Directors’ Report For the Year Ended 30 June 2019
Remuneration Report (Audited) (Continued) Remuneration of Key management personnel The Company has no employees and the only key management personnel of the Company are the Directors and company secretary. The total income paid or payable or otherwise made available, to all key management personnel of the Company directly or indirectly from the entity or any related party include:
Total $
Base % (a)
Base Salary
Fees $
Post-Employment Benefits
Superannuation $
Directors Mark Avery (b) 2019 - - - - (Managing Director) 2018 - - - -
James Davies 2019 45,662 4,338 50,000 100% (Non-Executive Chairman) 2018 45,662 4,338 50,000 100%
Alexander Beard (b) 2019 - - - - (Non-Executive Director) 2018 - - - -
Michelle Harpur 2019 45,662 4,338 50,000 100% (Non-Executive Director) 2018 15,000 25,000 40,000 100%
Other Key Management Personnel John Hunter (b) 2019 - - - - (Company Secretary) 2018 - - - -
────── ────── ──────
2019 91,324 8,676 100,000
────── ────── ──────
2018 60,662 29,338 90,000
────── ────── ──────
Notes:
(a) Base % reflects the amount of base level remuneration that is not dependent on individual or the Company’s performance.
(b) The remuneration of Messrs Avery, Beard, and Hunter are paid by an associate of the manager of the Company, Eildon Funds Management Limited.
Except as detailed above, no other amount of remuneration is paid to key management personnel in connection with the management of the affairs of the Company.
For
per
sona
l use
onl
y

6
Eildon Capital Limited
Directors’ Report For the Year Ended 30 June 2019
Key management personnel holding of shares The relevant shareholding interests of key management personnel in the share capital of the Company as at the date of this report is as follows: Ordinary shares Opening Purchases Sales Closing Mr A.D.H. Beard 664,285 45,285 - 709,570 Mr M. A. Avery 36,285 - - 36,285 Ms M. E. Harpur 19,523 - - 19,523 Mr J. R. Davies 25,984 1,032 - 27,016 Mr J.A.H. Hunter 6,000 - - 6,000
Consequences of performance on shareholder wealth In considering the Company’s performance and benefits for shareholder wealth, the Directors have regard to the following indicators in respect of the current financial year and previous financial year.
2019 $
2018 $
2017 $
Net profit after tax 4,386,508 3,006,055 3,659,218 ───────── ───────── ───────── Total comprehensive income 4,386,508 3,006,055 3,610,914 ───────── ───────── ───────── Dividends paid 3,525,499 3,197,311 2,012,822 Shares bought back on market 609,994 - - Share price 1.02 1.04 1.05 Net assets per share 1.06 1.04 1.05 Change in net assets per share 0.02 (0.01) 0.06
Significant changes in the state of affairs of the Company There were no significant changes in the state of affairs of the Company that occurred during the year not otherwise disclosed in this report or in the financial statements. Likely developments and future expectations The Company will continue to assess Australian investment opportunities. As an investment company, the results of the Company are dependent on the timing of and opportunities for the realisation of investments. Accordingly, it is not possible at this stage to predict the future results of the Company. Events subsequent to reporting date A fully franked dividend of 1.925 cents per share amounting to $875,555 was declared on 26 June 2019 and paid 24 July 2019. Other than as set out above, there are no matters or circumstances that have arisen since the end of the financial period which significantly affected or may significantly affect the operations of the Company, the results of those operations or the state of affairs of the Company in financial periods subsequent to 30 June 2019.
For
per
sona
l use
onl
y

For
per
sona
l use
onl
y

8
Eildon Capital Limited
Statement of Profit or Loss and Other Comprehensive Income For the Year Ended 30 June 2019
Notes 2019 2018 $ $
INCOME Interest income 7,355,087 5,185,636 Impairment recovery - 100,182 Fee income 208,602 187,556 Other income 2,858 - ──────── ──────── Total income 7,566,547 5,473,374 ──────── ──────── Share of net profit/(loss) of associate accounted for using the equity method
7 70,227 (81,920)
EXPENSES Accountancy 87,710 19,390 Audit fees 2 44,642 46,950 Insurance 62,416 72,802 Legal fees 75,233 2,796 Directors fees 17 100,000 90,000 Management fees 818,873 596,828 Net loss on sale of equity investments - 99,049 Share registry 64,752 64,297 Other expenses 116,707 104,978 ──────── ──────── Total expenses 1,370,333 1,097,090 ──────── ──────── Profit before income tax 6,266,441 4,294,364 Income tax expense 3 1,879,933 1,288,309 ──────── ──────── Net profit after tax 4,386,508 3,006,055 ──────── ──────── Total comprehensive income for the year 4,386,508 3,006,055 ════════ ════════ Basic and diluted earnings per share (cents) 11 9.56 7.90 ──────── ────────
The above statement of profit or loss and other comprehensive income should be read in conjunction with the notes to the financial statements set out on pages 12 to 30. F
or p
erso
nal u
se o
nly

9
Eildon Capital Limited
Statement of Financial Position As at 30 June 2019
Notes 2019 2018 $ $ CURRENT ASSETS
Cash and cash equivalents 5 6,936,845 10,209,431
Trade and other receivables 6 44,693 60,430
Loans and receivables 8 15,547,239 29,279,007
Financial assets at fair value through profit or loss 9 10,716,096 - ──────── ────────
Total current assets 33,244,873 39,548,868
──────── ────────
NON-CURRENT ASSETS Loans and receivables 8 11,514,784 5,987,361
Investments accounted for using the equity method 7 2,893,434 3,027,607
Financial assets at fair value through profit or loss 9 1,771,712 469,668
Deferred tax assets 3 356,718 391,041
──────── ──────── Total non-current assets 16,536,648 9,875,677
──────── ──────── TOTAL ASSETS 49,781,521 49,424,545 ──────── ────────
CURRENT LIABILITIES Trade and other payables 10 1,102,190 1,013,388 Current tax liabilities 3 493,761 538,803 ──────── ──────── Total current liabilities 1,595,951 1,552,191 ──────── ──────── TOTAL LIABILITIES 1,595,951 1,552,191 ──────── ──────── NET ASSETS 48,185,570 47,872,354 ════════ ════════ EQUITY Contributed equity 12 43,796,218 44,344,011 Retained earnings 13 (5,483,508) (5,483,508) Profit distribution reserve 14 9,872,860 9,011,851 ──────── ──────── TOTAL EQUITY 48,185,570 47,872,354 ════════ ════════
The above statement of financial position should be read in conjunction with the notes to the financial statements set out on pages 12 to 30.
For
per
sona
l use
onl
y

10
Eildon Capital Limited
Statement of Changes in Equity For the Year Ended 30 June 2019
Contributed equity
Retained earnings
Profit distribution
reserve Total $ $ $ $
At 1 July 2018 44,344,011 (5,483,508) 9,011,851 47,872,354 ════════ ════════ ════════ ════════ Profit for the year - 4,386,508 - 4,386,508 ──────── ──────── ──────── ──────── Total comprehensive income for the year - 4,386,508 - 4,386,508 ──────── ──────── ──────── ──────── Transactions with shareholders: Shares issued 62,201 - - 62,201 Shares bought back (608,121) - - (608,121) Transaction costs on share buyback (2,676) - - (2,676) Tax on share buyback transaction costs 803 - - 803 Dividends provided or paid - - (3,525,499) (3,525,499) Transfers (to)/from reserve - (4,386,508) 4,386,508 - ──────── ──────── ──────── ──────── At 30 June 2019 43,796,218 (5,483,508) 9,872,860 48,185,570 ════════ ════════ ════════ ════════
At 1 July 2017 28,107,339 (5,483,508) 9,203,107 31,826,938 ════════ ════════ ════════ ════════ Profit for the year - 3,006,055 - 3,006,055 ──────── ──────── ──────── ──────── Total comprehensive income for the year - 3,006,055 - 3,006,055 ──────── ──────── ──────── ──────── Transactions with shareholders: Shares issued 16,598,808 - - 16,598,808 Capital raising transaction costs (517,337) - - (517,337) Tax on transaction costs 155,201 - - 155,201 Dividends provided or paid - - (3,197,311) (3,197,311) Transfers (to)/from reserve - (3,006,055) 3,006,055 - ──────── ──────── ──────── ──────── At 30 June 2018 44,344,011 (5,483,508) 9,011,851 47,872,354 ════════ ════════ ════════ ════════
The above statement of changes in equity should be read in conjunction with the notes to the financial statements set out on pages 12 to 30. F
or p
erso
nal u
se o
nly

11
Eildon Capital Limited
Statement of Cash Flows
For the Year Ended 30 June 2019
Notes 2019 2018 $ $ Cash flows from operating activities Cash receipts in the course of operations 169,270 187,557 Cash payments in the course of operations (1,441,844) (933,978) Proceeds from disposal of financial assets at fair value through profit and loss
- 1,133
Loans repaid 24,413,444 11,407,785 Loans provided (25,308,143) (20,403,972) Interest and fee income received 5,813,974 2,843,855 Income tax paid (1,889,851) (2,045,069) ──────── ──────── Net cash provided by/(used in) operating activities 5(b) 1,756,850 (8,942,689) ──────── ──────── Cash flows from investing activities Payments for equity investments (1,302,043) (469,568) Proceeds from equity investments 204,400 250,950 ──────── ──────── Net cash used in investing activities (1,097,643) (218,618) ──────── ──────── Cash flows from financing activities Dividends paid (3,320,996) (2,841,774) Proceeds from issue of shares - 16,589,134 Payment for share issue transaction costs - (527,369) Payment for share buyback (608,121) - Payment for share buyback transaction costs (2,676) - ──────── ──────── Net cash (used in)/provided by financing activities (3,931,793) 13,219,991 ──────── ──────── Net (decrease)/increase in cash held (3,272,586) 4,058,684 Cash and cash equivalents at the beginning of the financial year
10,209,431 6,150,747
──────── ──────── Cash and cash equivalents at the end of the financial year 5(a) 6,936,845 10,209,431 ════════ ════════
The above statement of cash flows should be read in conjunction with the notes to the financial statements set out on pages 12 to 30.
For
per
sona
l use
onl
y

12
Eildon Capital Limited
Notes to the Financial Statements For the Year Ended 30 June 2019
Note 1: Statement of Accounting Policies
The significant policies which have been adopted in the preparation of this financial report are: a) Basis of Preparation The financial report is a general-purpose financial report, which has been prepared in accordance with the requirements of the Corporations Act 2001 and Australian Accounting Standards. The financial report has been prepared on a historical cost basis, except for the measurement at fair value of selected financial assets. The financial report is presented in Australian dollars. Management is required to make judgements, estimates and assumptions in relation to the carrying value of assets and liabilities, that have significant risk of material adjustments in the next year and these have been disclosed in the relevant notes to the financial statements. b) Statement of Compliance The financial report complies with Australian Accounting Standards, which include Australian equivalents to International Financial Reporting Standards (AIFRS). The financial report also complies with International Financial Reporting Standards (IFRS). The Company has adopted AASB 9 Financial Instruments and AASB 15 Revenue from contracts with customers for the first time for the annual reporting period commencing 1 July 2018. The impact of the adoption of the standard and the new accounting policy are disclosed in note 21. Certain new accounting standards and interpretations have been published that are not mandatory for the 30 June 2019 reporting period: AASB 16 Leases AASB 16 Leases was released in February 2016 and is mandatory for periods beginning on or after 1 January 2019. The new standard introduces a single lessee accounting model that will require a lessee to recognise right-of-use assets and lease liabilities for all leases with a term of more than 12 months, unless the underlying asset is of low value. Right-of-use assets are initially measured at their cost and lease liabilities are initially measured on a present value basis. Subsequent to initial recognition: • Right-of-use assets are accounted for on a similar basis to non-financial assets, whereby the right-of-use asset is accounted for in accordance with a cost model unless the underlying asset is accounted for on a revaluation basis; and • Lease liabilities are accounted for on a similar basis as other financial liabilities, whereby interest expense is recognised in respect of the liability and the carrying amount of the liability is reduced to reflect lease payments made. The Company does not expect the new standard to have any material impact on the financial statements. c) Cash and Cash Equivalents
For the statement of cash flows, cash includes cash on hand and short-term deposits with an original maturity of three months or less.
For
per
sona
l use
onl
y

13
Eildon Capital Limited
Notes to the Financial Statements (Continued) For the Year Ended 30 June 2019
Note 1: Statement of Accounting Policies (Cont.)
d) Revenue Recognition
Interest Income Revenue is recognised as interest accrues using the effective interest method. This is a method of calculating the amortised cost of a financial asset and allocating the interest income over the relevant period using the effective interest rate, which is the rate that exactly discounts estimated future cash receipts through the expected life of the financial asset to the net carrying amount as at the end of the financial year.
Fee Income The Company provides services to parties which is measured at the amount in accordance with the agreement. Revenue is recognised in the accounting period which the services provided are matched with the use of the benefits by the client. A receivable is recognised at the same time as this is the point in time that consideration is unconditional because only the passage of time is required before the payment is due. e) Trade and Other Payables
Trade payables and other payables are carried at amortised cost and represent liabilities for goods and services provided to the Company prior to the end of the financial year that are unpaid. The amounts are unsecured and are usually paid within 30 days of recognition.
f) Trade and Other Receivables
Trade and other receivables, which generally have 30 day terms, are recognised initially at fair value and subsequently measured at amortised cost using the effective interest method, with any difference between cost and recoverable value being recognised in net income over the period on an effective interest basis.
An allowance for doubtful debts is made when there is objective evidence that the Company will not be able to collect the debts. Bad debts are written off when identified. g) Investments and Other Financial Assets
Associates
Associates are those entities, other than partnerships, over which the Company exercises significant influence but not control. The Company generally deems it has significant influence if it has over 20% of the voting rights, but no more than 50%.
Investments in associates are carried in the statement of financial position at cost plus post-acquisition changes in the Company’s share of net assets in the associates. Following initial recognition the Company assesses whether it is necessary to recognise any impairment loss with respect to the investment in the associate.
The Company’s equity accounted share of the associates’ post-acquisition profits or losses is recognised in the statement of profit or loss and other comprehensive income, and its share of post-acquisition movements in reserves is recognised in reserves. The cumulative post-acquisition movements are adjusted against the carrying amount of the investment.
When the Company’s share of losses in an associate equals or exceeds its interest in the associate, including any unsecured long-term receivables and loans, the Company does not recognise further losses, unless it has incurred obligations or made payments on behalf of the associate.
The accounting policies for financial assets are explained in Note 21. For
per
sona
l use
onl
y

14
Eildon Capital Limited
Notes to the Financial Statements (Continued) For the Year Ended 30 June 2019
Note 1: Statement of Accounting Policies (Cont.) h) Income Tax and Other Taxes
Current tax assets and liabilities for the current and prior periods are measured at the amount expected to be recovered from or paid to the taxation authorities on the current period’s taxable income at the tax rates enacted by the reporting date. Deferred income tax assets and liabilities are measured at the tax rates that are expected to apply to the year when the asset is realised or the liability is settled, based on tax rates (and tax laws) that have been enacted or substantively enacted at the reporting date.
Deferred income tax is provided on all temporary differences at the reporting date between the tax bases of assets and liabilities and their carrying amounts for financial reporting purposes. Deferred income tax assets are recognised for all deductible temporary differences, carry-forward of unused tax credits and unused tax losses, to the extent that it is probable that taxable profits will be available against which deductible temporary differences and the carry-forward of unused tax credits and tax losses can be utilised. Unrecognised deferred income tax assets are reassessed at each reporting date and are recognised to the extent that it has become probable that future taxable profit will allow the deferred tax asset to be recovered.
The carrying amount of deferred income tax assets is reviewed at each reporting date and reduced to the extent that it is no longer probable that sufficient taxable profit will be available to allow all or part of the deferred income tax asset to be utilised.
Deferred tax assets and deferred tax liabilities are offset only if a legally enforceable right exists to set off current tax assets against current tax liabilities and the deferred tax assets and liabilities relate to the same taxable entity and the same taxation authority.
Income taxes relating to items recognised directly in equity are recognised in equity and not in comprehensive income.
Goods and Services Tax
Revenues, expenses and assets are recognised net of the amount of Goods and Services Tax (GST), except:
o when the GST incurred on a purchase of goods and services is not recoverable from the taxation authority, in which case the GST is recognised as part of the cost of acquisition of the asset or as part of an item of the expense item as applicable; and
o receivables and payables, which are stated with the amount of GST included.
The net amount of GST recoverable from, or payable to, the taxation authority is included as part of receivables or payables in the statement of financial position.
Cash flows are included in the statement of cash flows on a gross basis and the GST component of cash flows arising from investing and financing activities which are recoverable from, or payable to, the taxation authority are classified as operating cash flows.
i) Contributed Equity
Issued capital is recognised at the fair value of the consideration received by the Company. Incremental costs directly attributable to the issue or cancellation of shares are shown in equity as a deduction, net of tax, from proceeds.
j) Segment Reporting
A business segment is a distinguishable component of the entity that is engaged in providing differentiated products or services.
For
per
sona
l use
onl
y

15
Eildon Capital Limited
Notes to the Financial Statements (Continued) For the Year Ended 30 June 2019
Note 1: Statement of Accounting Policies (Cont.)
k) Impairment
Assets are tested for impairment whenever events or changes in circumstances indicate that the carrying amount may not be recoverable. An impairment loss is recognised for the amount by which the asset’s carrying amount exceeds its recoverable amount. Non-financial assets that suffered an impairment are tested for possible reversal of the impairment whenever events or changes in circumstances indicate that the impairment may have reversed.
l) Profit distribution reserve
Profits transferred to the profit distribution reserve are segregated to facilitate potential future dividend payments that may be declared by the directors. Note 2: Auditor’s Remuneration
The auditor of the Company is HLB Mann Judd NSW Partnership. 2019 2018 $ $ Amounts received or due and receivable by the auditors for:
Audit and review of financial report HLB Mann Judd NSW Partnership 44,642 46,950
════════ ════════
Note 3: Income Tax
(a) Income tax expense
Accounting profit before income tax 6,266,441 4,294,364 ════════ ════════
Income tax expense at the statutory income tax rate of 30% 1,879,933 1,288,309 ════════ ════════ The major components of income tax expense are:
- Current income tax charge 1,844,655 1,170,560 - Deferred income tax 35,278 117,749 ──────── ──────── Income tax expense reported in the statement of profit or loss and other comprehensive income 1,879,933 1,288,309 ════════ ════════ Deferred tax benefit relating to items credited directly to equity 803 88,900 ════════ ════════
For
per
sona
l use
onl
y
16
Eildon Capital Limited
Notes to the Financial Statements (Continued) For the Year Ended 30 June 2019
Note 3: Income Tax (Cont.)
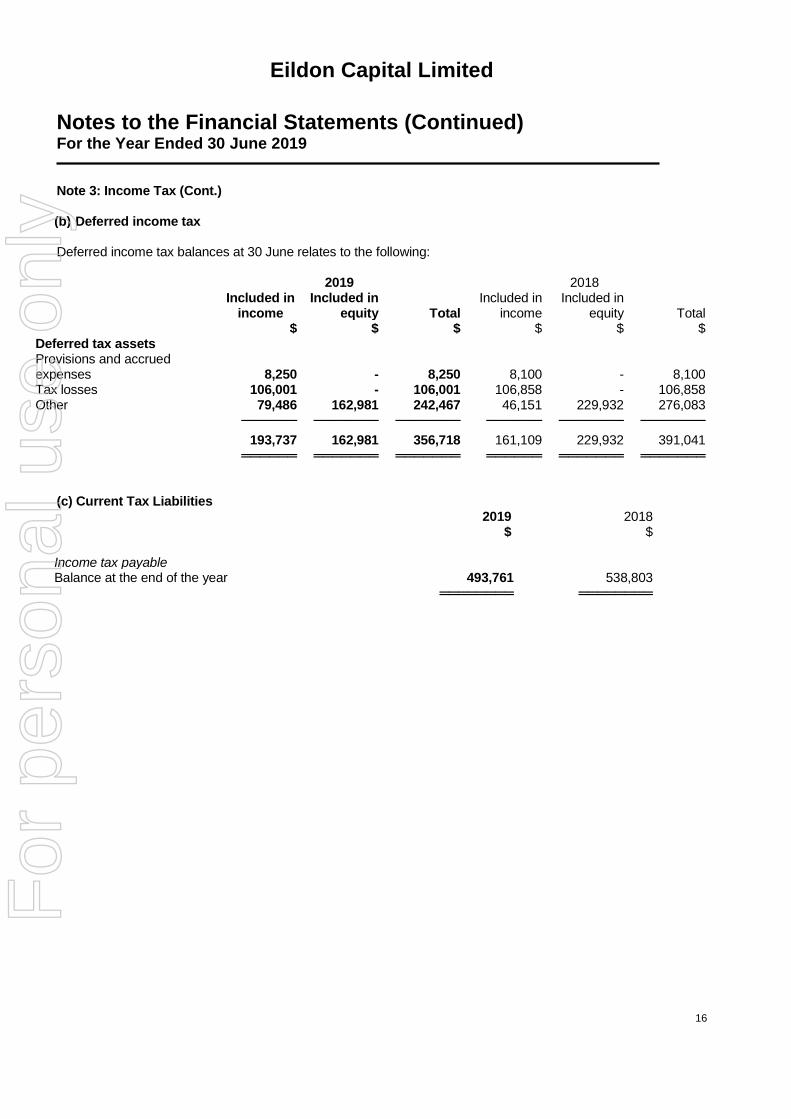
(b) Deferred income tax Deferred income tax balances at 30 June relates to the following:
2019 2018 Included in
income Included in
equity Total Included in
income Included in
equity Total $ $ $ $ $ $ Deferred tax assets Provisions and accrued expenses 8,250 - 8,250 8,100 - 8,100 Tax losses 106,001 - 106,001 106,858 - 106,858 Other 79,486 162,981 242,467 46,151 229,932 276,083 ────── ─────── ─────── ────── ─────── ─────── 193,737 162,981 356,718 161,109 229,932 391,041 ══════ ═══════ ═══════ ══════ ═══════ ═══════
(c) Current Tax Liabilities 2019 2018 $ $ Income tax payable Balance at the end of the year 493,761 538,803
════════ ════════
For
per
sona
l use
onl
y

17
Eildon Capital Limited
Notes to the Financial Statements (Continued) For the Year Ended 30 June 2019
Note 4: Dividends Dividends proposed or paid in previous years and included within the statement of changes in equity by the Company are:
Cents Per
Share
Total $
Date of Payment
Tax rate for Franking
Credit
Percentage Franked
2019 June quarter dividend on ordinary shares 1.925 875,555 24-Jul-19 30% 100%
2019 March quarter dividend on ordinary shares 1.925 876,961 24-Apr-19 30% 100%
2018 December quarter dividend on ordinary shares 1.925 886,693 24-Jan-19 30% 100%
2018 September quarter dividend on ordinary shares 1.925 886,290 24-Oct-18 30% 100%
2018 June quarter dividend on ordinary shares 1.925 885,887 24-Jul-18 30% 100%
2018 March quarter dividend on ordinary shares 1.925 885,699 24-Apr-18 30% 100%
2017 December quarter dividend on ordinary shares 1.925 885,699 5-Feb-18 30% 100%
2017 September quarter dividend on ordinary shares 1.7875 540,025 24-Oct-17 30% 100%
2019 2018 $ $ Dividend franking account: Franking credits available to shareholders for subsequent financial years 2,611,447 2,277,568 ════════ ════════ The franking account is stated on a tax paid basis. The balance comprises the franking account at year end adjusted for: (a) franking credits that will arise from the payment of the amount of the provision for income tax; (b) franking debits that will arise from the refund of overpaid tax instalments paid; (c) franking debits that will arise from the payment of dividends recognised as a liability at year end; (d) franking credits that will arise from the receipt of dividends recognised as receivables at the reporting date;
and (e) franking credits that the entity may be prevented from distributing in subsequent years. The ability to utilise the franking credits is dependent upon there being sufficient available equity to declare dividends. Note 5: Notes to the Statement of Cash Flows (a) Reconciliation of cash and cash equivalents For the purposes of the statement of cash flows, cash and cash equivalents comprise the following at the end of the financial year: Cash at bank 6,936,845 10,209,431 ════════ ════════
Cash at bank earns interest at floating rates based on daily bank deposit rates. The carrying amount of cash and cash equivalents represents fair value.
For
per
sona
l use
onl
y

18
Eildon Capital Limited
Notes to the Financial Statements (Continued) For the Year Ended 30 June 2019
Note 5: Notes to the Statement of Cash Flows (Cont.)
(b) Reconciliation of profit after income tax to net cash from operations
2019 $
2018 $
Net profit after tax 4,386,508 3,006,055 Adjustments for:
Share of equity accounted (profit)/loss (70,227) 81,920
Change in operating assets and liabilities: Decrease/(increase) in other assets 17,470 (5,110) Increase in loans and financial assets (2,511,752) (11,337,967) Increase in GST (1,731) (4,058) (Decrease)/increase in payables (61,815) 69,250 Increase in deferred tax assets and liabilities 35,126 145,913 Increase in sundry creditors and accruals 8,313 3,981 Decrease in tax payable (45,042) (902,673)
───────── ───────── Net cash provided by/(used in) operating activities 1,756,850 (8,942,689)
═════════ ═════════ Note 6: Trade and Other Receivables Current: Goods and services tax 15,262 13,530 Prepayments 29,431 46,900 ───────── ───────── 44,693 60,430 ═════════ ═════════
Trade and other receivables are generally on 30 day terms. Note 7: Investments Accounted for Using the Equity Method
Ownership Interest Investment Carrying Amount 2019 2018 2019 2018 % % $ $ Interest in ordinary shares of associate 79 Logan Road Trust (a) 35 35 2,893,399 3,027,572 79 Logan Road Pty Limited (b) 35 35 35 35 Kingsgrove (Vanessa Road) Unit Trust (c) 25 25 - - ──────── ────────
2,893,434 3,027,607 ════════ ════════
(a) 79 Logan Road Trust is a commercial property in Woolloongabba, Queensland with a long term lease to an ASX listed entity, with residential development approval. The carrying value of 79 Logan Road Trust has been calculated as $2,893,399 based on the net asset backing methodology, using the most recent reports provided by the company.
(b) 79 Logan Road Pty Limited is the trustee of 79 Logan Road Trust.
(c) Kingsgrove (Vanessa Road) Unit Trust is a residential property development in Kingsgrove, New South Wales.
For
per
sona
l use
onl
y

19
Eildon Capital Limited
Notes to the Financial Statements (Continued) For the Year Ended 30 June 2019
Note 7: Investments Accounted for Using the Equity Method (Cont.)
Summarised financial information The following table illustrates summarised financial information relating to the Company’s associates:
79 Logan Road Trust 2019 2018 $ $ Summarised balance sheet Current assets 123,417 55,692 Current liabilities 41,081 46,958
───────── ─────────
Current net assets 82,336 8,734 ───────── ─────────
Non-current assets 19,674,518 20,131,472 Non-current liabilities 11,490,000 11,490,000 ───────── ─────────
Non-current net assets 8,184,518 8,641,472 ───────── ─────────
Net assets 8,266,854 8,650,206 ───────── ─────────
Reconciliation to carrying amounts: Opening net assets 1 July 8,650,206 9,601,264 Profit for the period 200,648 (234,058) Return of capital (383,352) (700,501) Dividend paid (200,648) (16,499) ───────── ─────────
Closing net assets 8,266,854 8,650,206 ───────── ─────────
The Company’s share - percentage 35% 35% The Company’s share - dollars 2,893,399 3,027,572 ───────── ─────────
Carrying amount 2,893,399 3,027,572 ───────── ─────────
Summarised statement of comprehensive income Revenue 1,205,229 1,074,292 Net profit 200,648 (234,058) Other comprehensive income - - ───────── ─────────
Total comprehensive income 200,648 (234,058) ───────── ─────────
Dividends received 70,227 5,775 ───────── ─────────
For
per
sona
l use
onl
y

20
Eildon Capital Limited
Notes to the Financial Statements (Continued) For the Year Ended 30 June 2019
Note 7: Investments Accounted for Using the Equity Method (Cont.) Individually immaterial investments accounted for using the equity method
In addition to the interests in investments accounted for using the equity method disclosed above, the Company also has interests in a number of individually immaterial investments that are accounted for using the equity method. 2019 2018 $ $ Aggregate carrying amount of individually immaterial investments accounted for using the equity method 35 35 Aggregate amounts of the Company’s share of profit for the period - - ─────── ─────── Total comprehensive income - - ═══════ ═══════
Note 8: Loans and Receivables Current:
Secured loans to other corporations 15,394,144 29,279,007 Secured loans to related entity 153,095 -
─────── ─────── 15,547,239 29,279,007
═══════ ═══════ Non-Current:
Secured loans to other corporations 11,514,784 5,861,811 Unsecured loan to related entity - 125,550 ─────── ─────── 11,514,784 5,987,361
═══════ ═══════
Note 9: Financial Assets at Fair Value through Profit or Loss Current:
Unlisted investments in unlisted corporations: 10,716,096 - ═══════ ═══════ Non-Current:
Unlisted investments in unlisted corporations: 1,771,712 469,668 ═══════ ═══════ Note 10: Trade and Other Payables Current:
Sundry creditors and accruals 74,001 127,501 Dividend payable 1,028,189 885,887 ─────── ─────── 1,102,190 1,013,388 ═══════ ═══════
Trade and sundry creditors are non-interest bearing and are generally on 30 day terms.
For
per
sona
l use
onl
y

21
Eildon Capital Limited
Notes to the Financial Statements (Continued) For the Year Ended 30 June 2019
2019 2018 Note 11: Earnings per share
Cents Cents Basic and diluted earnings per share 9.56 7.90 $ $ Net profit attributable to shareholders used in calculation of basic and diluted earnings per share 4,386,508 3,006,055 ═══════ ═══════
Number Number Weighted average number of shares and potential ordinary shares used as the denominator in calculating diluted earnings per share 45,899,548 38,067,694 ═══════ ═══════
Note 12: Contributed Equity
2019 2018 Number of
shares $ Number of
shares $
Issued and paid up share capital: Ordinary shares fully paid 45,483,392 43,796,218 46,020,079 44,344,011 ═════════ ═════════ ═════════ ═════════ Ordinary shares: Balance at the beginning of the year 46,020,079 44,344,011 30,211,208 28,107,339 Issue of shares 63,372 62,201 15,808,871 16,598,808 Transaction costs of share issue - - - (517,337) Shares bought back (600,059) (608,121) - - Transaction costs on share buyback - (2,676) - - Income tax on share transaction costs - 803 - 155,201 ───────── ───────── ───────── ───────── Balance at the end of the year 45,483,392 43,796,218 46,020,079 44,344,011 ═════════ ═════════ ═════════ ═════════ Ordinary shares entitle the holder to participate in dividends and the proceeds on winding up the company in proportion to the number of shares held.
Total capital of the Company is as follows:
2019
$ 2018
$ Total equity 48,185,570 47,872,354 ════════ ════════ Net assets per share 1.06 1.04
════════ ════════ The Company is not subject to any externally imposed capital requirements. Management’s objective is to achieving returns for shareholders commensurate with the risks associated with making investments in Australia.
For
per
sona
l use
onl
y

22
Eildon Capital Limited
Notes to the Financial Statements (Continued) For the Year Ended 30 June 2019
2019
$ 2018
$ Note 13: Retained Earnings Retained earnings at the beginning of the year (5,483,508) (5,483,508) Net profit attributable to members 4,386,508 3,006,055 Transfers to profit distribution reserve (4,386,508) (3,006,055)
──────── ──────── Retained earnings at the end of the year (5,483,508) (5,483,508)
════════ ════════
Note 14: Profit Distribution Reserve Profit distribution reserve at the beginning of the year 9,011,851 9,203,107 Transfers from retained earnings 4,386,508 3,006,055 Dividends paid (3,525,499) (3,197,311) ──────── ──────── Profit distribution reserve at the end of the year 9,872,860 9,011,851 ════════ ════════
Profits transferred to the profit distribution reserve are segregated to facilitate potential future dividend payments that may be declared by the directors.
For
per
sona
l use
onl
y

23
Eildon Capital Limited
Notes to the Financial Statements (Continued) For the Year Ended 30 June 2019
Note 15: Financial Instruments The Company’s activities expose it to a variety of financial risks: market risk (including market price risk and interest rate risk), credit risk and liquidity risk. The Company’s overall risk management program focuses on the unpredictability of financial markets and seeks to minimise potential adverse effects on financial performance. The Company uses different methods to measure different types of risk to which it is exposed. These methods include sensitivity analysis in the case of interest rate, foreign exchange and price risk. The responsibility for operational risk management resides with the Board of Directors who seeks to manage the exposure of the Company. There have been no significant changes in the types of financial risks or the Company’s risk management program (including methods used to measure the risks) since the prior year. (a) Interest Rate Risk The Company’s exposure to interest rate risks and the effective interest rates of financial assets and liabilities both recognised and unrecognised at the reporting date are as follows:
Floating Fixed interest rate Non-
Note interest
rate 1 year or
less 1 to 5 years
interest bearing
Total
2019 $ $ $ $ $ Financial assets Cash and cash equivalents 5 6,936,845 - - - 6,936,845 Trade and other receivables 6 - - - 44,693 44,693 Loans and receivables 8 - 15,547,239 11,514,784 - 27,062,023 ──────── ─────── ─────── ─────── ──────── 6,936,845 15,547,239 11,514,784 44,693 34,043,561 ════════ ═══════ ═══════ ═══════ ════════ Financial liabilities Trade and other payables 10 - - - 1,102,190 1,102,190 ════════ ═══════ ═══════ ═══════ ════════ 2018 Financial assets Cash and cash equivalents 5 10,209,431 - - - 10,209,431 Trade and other receivables 6 - - - 60,430 60,430 Loans and receivables 8 - 29,279,007 5,987,361 - 35,266,368 ──────── ─────── ─────── ─────── ──────── 10,209,431 29,279,007 5,987,361 60,430 45,536,229 ════════ ═══════ ═══════ ═══════ ════════ Financial liabilities Trade and other payables 10 - - - 1,013,388 1,013,388 ════════ ═══════ ═══════ ═══════ ════════ The Company holds a significant amount of cash balances which are exposed to movements in interest rates. To reduce the risk the Company typically deposits uncommitted cash in high interest rate accounts with financial institutions. Interest bearing loans and receivables are made at a mix of fixed and floating rates.
For
per
sona
l use
onl
y
24
Eildon Capital Limited
Notes to the Financial Statements (Continued) For the Year Ended 30 June 2019 Note 15: Financial Instruments (Cont.)
(a) Interest Rate Risk (Cont.)
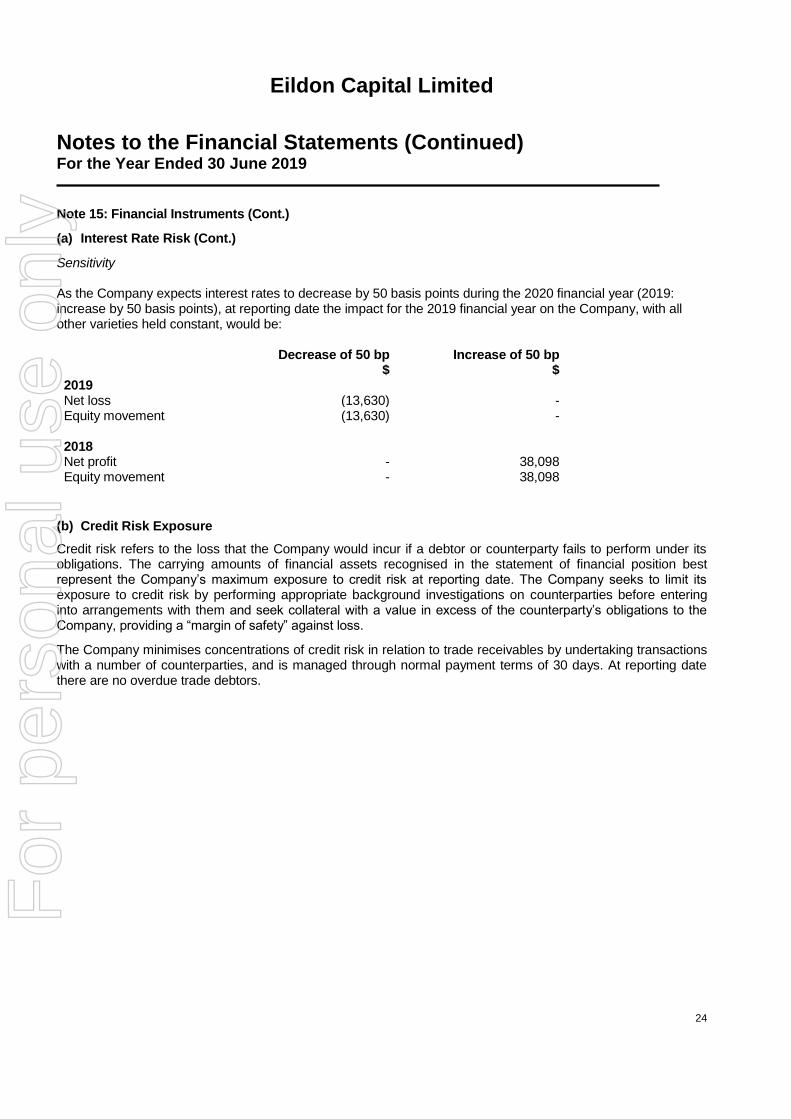
Sensitivity As the Company expects interest rates to decrease by 50 basis points during the 2020 financial year (2019: increase by 50 basis points), at reporting date the impact for the 2019 financial year on the Company, with all other varieties held constant, would be: Decrease of 50 bp Increase of 50 bp $ $ 2019 Net loss (13,630) - Equity movement (13,630) - 2018 Net profit - 38,098 Equity movement - 38,098
(b) Credit Risk Exposure
Credit risk refers to the loss that the Company would incur if a debtor or counterparty fails to perform under its obligations. The carrying amounts of financial assets recognised in the statement of financial position best represent the Company’s maximum exposure to credit risk at reporting date. The Company seeks to limit its exposure to credit risk by performing appropriate background investigations on counterparties before entering into arrangements with them and seek collateral with a value in excess of the counterparty’s obligations to the Company, providing a “margin of safety” against loss.
The Company minimises concentrations of credit risk in relation to trade receivables by undertaking transactions with a number of counterparties, and is managed through normal payment terms of 30 days. At reporting date there are no overdue trade debtors.
For
per
sona
l use
onl
y

25
Eildon Capital Limited
Notes to the Financial Statements (Continued) For the Year Ended 30 June 2019
Note 15: Financial Instruments (Cont.)
(b) Credit Risk Exposure (Cont.)
The credit quality of financial assets that are neither past due nor impaired is as follows:
2019
$ 2018
$
Cash and cash equivalents 6,936,845 10,209,431 ════════ ════════
Trade and other receivables Government 15,262 13,530 Other – unrated 29,431 46,900
──────── ──────── 44,693 60,430
════════ ════════ Loans and receivables Other – unrated 27,062,023 35,266,368
════════ ════════
(c) Liquidity Risk
The Company manages liquidity risk by maintaining sufficient cash balances and holding liquid investments that could be realised to meet commitments. The Company continuously monitors forecast and actual cash flows and matches the maturity profiles of financial assets and liabilities.
The following table details the Company’s contractual liabilities.
Less than 6 months Total $ $ 2019 Trade and other payables 1,102,190 1,102,190 ═══════ ═══════ 2018 Trade and other payables 1,013,388 1,013,388 ═══════ ═══════
For
per
sona
l use
onl
y

26
Eildon Capital Limited
Notes to the Financial Statements (Continued) For the Year Ended 30 June 2019
Note 15: Financial Instruments (Cont.)
(d) Fair Value of Financial Assets and Liabilities
The fair values of the financial assets and liabilities of the Company are approximately equal to their carrying values. No financial assets or financial liabilities are readily traded on organised markets in standardised form. Judgements and estimates were made in determining the fair values of the financial instruments and non-financial assets that are recognised and measured at fair value in the financial statements. To provide an indication about the reliability of the inputs used in determining fair value, the Company has classified its financial instruments and non-financial assets into three levels prescribed under the accounting standards. Level 1 – the fair value is calculated using quoted prices in active markets. Level 2 – the fair value is estimated using inputs other than quoted prices included in Level 1 that are observable for the asset, either directly (as prices) or indirectly (derived from prices). Level 3 – the fair value is estimated using inputs for the asset that are not based on observable market data. The fair value of the financial instruments as well as the methods used to estimate the fair value are summarised in the table below.
Valuation technique – non market observable inputs
(Level 3) $ Year ending 30 June 2019 Financial assets Financial assets at fair value through profit or loss Unlisted investments at market value 12,487,808
Loans and receivables Secured loans to related corporations 153,095 Secured loans to other corporations 26,908,928 ─────────────
Total financial assets 39,549,831 ─────────────
Year ending 30 June 2018 Financial assets Financial assets at fair value through profit or loss Unlisted shares at market value 469,668 Loans and receivables Secured loans to other corporations 35,266,368 ─────────────
Total financial assets 35,736,036 ════════════
For
per
sona
l use
onl
y
27
Eildon Capital Limited
Notes to the Financial Statements (Continued) For the Year Ended 30 June 2019
Note 15: Financial Instruments (Cont.)
(d) Fair Value of Financial Assets and Liabilities (Cont.)
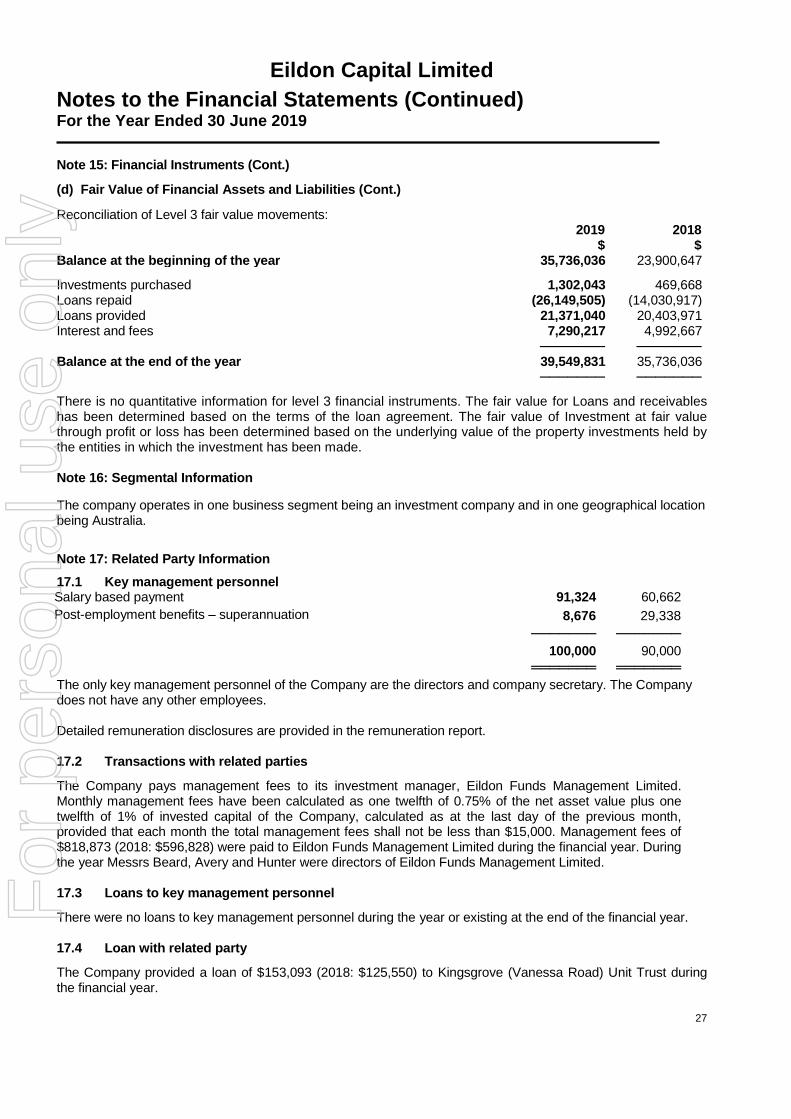
Reconciliation of Level 3 fair value movements: 2019 2018 $ $ Balance at the beginning of the year 35,736,036 23,900,647
Investments purchased 1,302,043 469,668 Loans repaid (26,149,505) (14,030,917) Loans provided 21,371,040 20,403,971 Interest and fees 7,290,217 4,992,667 ─────── ───────
Balance at the end of the year 39,549,831 35,736,036 ─────── ───────
There is no quantitative information for level 3 financial instruments. The fair value for Loans and receivables has been determined based on the terms of the loan agreement. The fair value of Investment at fair value through profit or loss has been determined based on the underlying value of the property investments held by the entities in which the investment has been made. Note 16: Segmental Information
The company operates in one business segment being an investment company and in one geographical location being Australia.
Note 17: Related Party Information
17.1 Key management personnel Salary based payment 91,324 60,662
Post-employment benefits – superannuation 8,676 29,338
─────── ───────
100,000 90,000
═══════ ═══════
The only key management personnel of the Company are the directors and company secretary. The Company does not have any other employees. Detailed remuneration disclosures are provided in the remuneration report. 17.2 Transactions with related parties
The Company pays management fees to its investment manager, Eildon Funds Management Limited. Monthly management fees have been calculated as one twelfth of 0.75% of the net asset value plus one twelfth of 1% of invested capital of the Company, calculated as at the last day of the previous month, provided that each month the total management fees shall not be less than $15,000. Management fees of $818,873 (2018: $596,828) were paid to Eildon Funds Management Limited during the financial year. During the year Messrs Beard, Avery and Hunter were directors of Eildon Funds Management Limited. 17.3 Loans to key management personnel
There were no loans to key management personnel during the year or existing at the end of the financial year. 17.4 Loan with related party
The Company provided a loan of $153,093 (2018: $125,550) to Kingsgrove (Vanessa Road) Unit Trust during the financial year.
For
per
sona
l use
onl
y

28
Eildon Capital Limited
Notes to the Financial Statements (Continued) For the Year Ended 30 June 2019
Note 18: Commitments and Contingent Liabilities 18.1 Loans and other investments Amounts available to be drawn by borrowers under existing loan facility agreements
2019 2018
$ $
Related entities 245,090 195,090
Unrelated entities 643,453 5,610,106
─────── ───────
888,543 5,805,196
═══════ ═══════
Amounts available to be called by investees for partially paid shares and units
Unrelated entities 7,246,014 -
═══════ ═══════
18.2 Contingent liabilities Commencing 1 January 2016, a performance fee is payable to Eildon Funds Management Limited where the Company achieves an annual return during the calculation period of greater than the hurdle rate of 9% per annum. The performance fee payable is calculated as 20% of the increase in the share price of the Company in excess of the 9% hurdle rate, after factoring in dividends and other distributions.
No performance fee is payable for the 2019 and 2018 financial years. 18.3 Financial Guarantees Guarantees The Directors are of the opinion that provisions are not required in respect of these matters, as it is not probable that a future sacrifice of economic benefits will be required or the amount is not capable of reliable measurement.
Guarantee (a) 869,400 -
═══════ ═══════
(a) The guarantee provided by the company to Australia and New Zealand Banking Group Limited is used
as security for a loan facility in relation to 33-45 Gibdon Street, Burnley, Victoria.
Note 19: Other Information
The Company was incorporated on 23 February 1993. The Company is registered and domiciled in Australia. Its registered office and principal place of business are at Level 25, 360 Collins Street, Melbourne Victoria 3000.
Note 20: Subsequent Events
A fully franked dividend of 1.925 cents per share amounting to $887,555 was declared on 26 June 2019 and paid 24 July 2019.
Other than as set out above, there are no matters or circumstances that have arisen since the end of the financial period which significantly affected or may significantly affect the operations of the Company, the results of those operations or the state of affairs of the Company in financial periods subsequent to 30 June 2019.
For
per
sona
l use
onl
y

29
Eildon Capital Limited
Notes to the Financial Statements (Continued) For the Year Ended 30 June 2019
Note 21: Changes in Accounting Policies
This note explains the impact of the adoption of AASB 9 Financial Instruments and AASB 15 Revenue from Contracts with Customers on the Company’s financial statements.
21.1 AASB 9 Financial Instruments AASB 9 Financial Instruments replaces the provisions of AASB 139 Financial Instruments: Recognition and Measurement that relate to the recognition, classification and measurement of financial assets and financial liabilities, derecognition of financial instruments, impairment of financial assets and hedge accounting. The changes in accounting policies and impact of adoption are set out below.
Accounting Policies (a) Classification The Company classifies its financial assets in the following measurement categories:
- those to be measured subsequently at fair value (either through other comprehensive income (OCI), or through profit or loss), and
- those to be measured at amortised cost.
The classification depends on the Company’s business model for managing the financial assets and the contractual terms of the cash flows.
For assets measured at fair value, gains and losses will either be recorded in financial performance or OCI. For investments in equity instruments that are not held for trading, this will depend on whether the Company has made an irrevocable election at the time of initial recognition to account for the equity investment at fair value through other comprehensive income (FVOCI).
The Company reclassifies debt investments when and only when its business model for managing those assets changes.
(b) Measurement At initial recognition, the Company measures a financial asset at its fair value plus, in the case of a financial asset not at fair value through profit or loss (FVPL), transaction costs that are directly attributable to the acquisition of the financial asset.
Financial assets at amortised cost Financial assets at amortised cost are held for collection of contractual cash flows where those cash flows represent solely payments of principal and interest. Interest income from these financial assets is included in finance income using the effective interest rate method. Any gain or loss arising on derecognition is recognised directly in financial performance and presented in other gains/(losses), together with foreign exchange gains and losses. Impairment losses are presented as separate line item in the Statement of Profit or Loss and Other Comprehensive Income.
Financial asset at fair value through other comprehensive income (FVOCI) - Debt instruments: Assets held for collection of contractual cash flows and for selling the financial assets,
where the assets’ cash flows represent solely payments of principal and interest. Movements in the carrying amount are taken through OCI, except for the recognition of impairment gains or losses, interest revenue and foreign exchange gains and losses which are recognised in financial performance. When the financial asset is derecognised, the cumulative gain or loss previously recognised in OCI is reclassified from equity to financial performance and recognised in other gains/(losses). Interest income from these financial assets is included in finance income using the effective interest rate method. Foreign exchange gains and losses are presented in other gains/(losses) and impairment expenses are presented as separate line item in the Statement of Profit or Loss and Other Comprehensive Income.
- Equity instruments: Where the Company’s management has elected to present fair value gains and losses on equity investments in OCI, there is no subsequent reclassification of fair value gains and losses to financial performance following the derecognition of the investment. Dividends from such investments continue to be recognised in financial performance as income when the Company’s right to receive payments is established. Impairment losses (and reversal of impairment losses) on equity investments measured at FVOCI are not reported separately from other changes in fair value.
For
per
sona
l use
onl
y
30
Eildon Capital Limited
Notes to the Financial Statements (Continued) For the Year Ended 30 June 2019 Note 21: Changes in Accounting Policies (Cont.) 21.1 AASB 9 Financial Instruments (Cont.) Accounting Policies (Cont.) (b) Measurement (Cont.) Financial asset at fair value through profit or loss (FVPL) Assets that do not meet the criteria for amortised cost or FVOCI are measured at FVPL. Changes in the fair value of financial assets at FVPL are recognised in other gains/(losses) in the Statement of Profit or Loss and Other Comprehensive Income as applicable. (c) Impairment The Company assesses on a forward looking basis the expected credit losses associated with its debt instruments carried at amortised cost and FVOCI. The impairment methodology applied depends on whether there has been a significant increase in credit risk. Impact of adoption (a) Classification and measurement The adoption of the accounting policies does not result in any reclassification of financial instrument or adjustments to the amounts recognised in the financial statements.
(b) Impairment of financial assets All of the Company’s financial assets recorded at amortised cost are considered to have low credit risk, and the loss allowance recognised during the period was therefore limited to 12 months expected losses. The instruments are considered to be low credit risk when they have a low risk of default and the issuer has a strong capacity to meet its contractual cash flow obligations in the near term. The Company’s financial assets at amortised cost include trade receivables, loans and other receivables. Applying the expected credit risk model didn’t result in recognition of any loss allowance. 21.2 AASB 15 Revenue from contracts with customers The Company has adopted AASB 15 Revenue from contracts with customers from 1 July 2018 which replaces AASB 118 Revenue, AASB 111 Construction Contracts and several revenue related Interpretations. The standard provides a single comprehensive model for revenue recognition. The core principle of the standard is that an entity shall recognise revenue to reflect the time frame over which services are performed to customers. The standard introduced a new contract-based revenue recognition model with a measurement approach that is based on an allocation of the transaction price. Credit risk is presented separately as an expense rather than adjusted against revenue. Contracts with customers are presented in an entity's statement of financial position as a contract liability, a contract asset, or a receivable, and is subject to recognition over the term of the service provided. Where costs are incurred in relation to the services provided these costs, subject to certain criteria, are capitalised as an asset and amortised over the contract period. The Company has adopted the new rules retrospectively. The Company’s revenue includes interest revenue and distribution income which are specifically excluded from the scope of AASB 15. Other revenues are set out in Note 1 d). The accounting policies are consistent with those of the previous financial year and corresponding interim reporting period. The adoption of AASB 15 has not had a material impact on the financial performance or position of the Company. No adjustment was required to be recognised to the opening balance of retained earnings at 1 July 2018 as a result of the adoption of AASB 15 and consequently no further disclosures have been included in this financial report.
For
per
sona
l use
onl
y

For
per
sona
l use
onl
y
KREYES�
Square
31�

32
To the directors of Eildon Capital Limited: As lead auditor for the audit of the financial report of Eildon Capital Limited for the year ended 30 June 2019, I declare that, to the best of my knowledge and belief, there have been no contraventions of: (a) the auditor independence requirements as set out in the Corporations Act 2001 in relation to the audit;
and
(b) any applicable code of professional conduct in relation to the audit.
Sydney, NSW N J Guest 30 August 2019 Partner
For
per
sona
l use
onl
y
33
Independent Auditor’s Report to the Members of Eildon Capital Limited REPORT ON THE AUDIT OF THE FINANCIAL REPORT Opinion We have audited the financial report of Eildon Capital Limited (“the Company”) which comprises the statement of financial position as at 30 June 2019, the statement of profit or loss and other comprehensive income, the statement of changes in equity and the statement of cash flows for the year then ended, and notes to the financial statements, including a statement of significant accounting policies, and the directors’ declaration. In our opinion, the accompanying financial report of the Company is in accordance with the Corporations Act 2001, including: (a) giving a true and fair view of the Company’s financial position as at 30 June 2019 and of its financial
performance for the year then ended; and
(b) complying with Australian Accounting Standards and the Corporations Regulations 2001. Basis for Opinion We conducted our audit in accordance with Australian Auditing Standards. Our responsibilities under those standards are further described in the Auditor’s Responsibilities for the Audit of the Financial Report section of our report. We are independent of the Company in accordance with the auditor independence requirements of the Corporations Act 2001 and the ethical requirements of the Accounting Professional and Ethical Standards Board’s APES 110 Code of Ethics for Professional Accountants (“the Code”) that are relevant to our audit of the financial report in Australia. We have also fulfilled our other ethical responsibilities in accordance with the Code. We believe that the audit evidence we have obtained is sufficient and appropriate to provide a basis for our opinion. Key Audit Matters Key audit matters are those matters that, in our professional judgement, were of most significance in our audit of the financial report of the current period. These matters were addressed in the context of our audit of the financial report as a whole, and in forming our opinion thereon, and we do not provide a separate opinion on these matters.
Key Audit Matter How our audit addressed the key audit matter
Existence and Valuation of Loans Receivable (Note 8)
The Company had a significant balance of loan and receivable assets at 30 June 2019. A large portion of the loans have been provided to property based investors or developers with real property assets provided as security for the loans. We have therefore identified loans and receivables as an area requiring particular audit attention.
We reviewed loan agreements and other supporting documentation. We obtained managements workings and assessed the reasonableness of recoverability assessments, including where relevant, the prospect of recovering the loan within the next 12 months.
We reviewed security of loans and assessed for reasonableness. We obtained loan confirmation from third parties. We have assessed the classification and adequacy of the disclosures within the financial statements as at 30 June 2019.
For
per
sona
l use
onl
y

34
Key Audit Matter How our audit addressed the key audit matter
Existence and Valuation of Financial Assets at fair value through profit or loss (Note 9)
During the year the Company invested capital into the newly established Eildon Debt Fund (EDF) via the subscription for units in EDF. At 30 June 2019 the Company recorded a carrying value of these units as $10.7 million.
The underlying assets held by EDF relate to loans that have been provided to property based investors or developers with real property assets provided as security for the loans.
Given the significance of this investment to the Company we have identified this as an area requiring particular audit attention.
We reviewed the EDF Trust deed and unit subscription certificates to support the existence of the asset held by the Company.
We obtained workings and supporting information, including property valuations from EDF to support the valuation and reasonableness of the assessed fair value of the units held in EDF.
We reviewed management’s assessment of the prospect of realising the investment within the next 12 months.
We have assessed the adequacy of the disclosures within the financial statements as at 30 June 2019.
Information Other than the Financial Report and Auditor’s Report Thereon The directors are responsible for the other information. The other information comprises the information included in the Company’s annual report for the year ended 30 June 2019, but does not include the financial report and our auditor’s report thereon. Our opinion on the financial report does not cover the other information and accordingly we do not express any form of assurance conclusion thereon. In connection with our audit of the financial report, our responsibility is to read the other information and, in doing so, consider whether the other information is materially inconsistent with the financial report or our knowledge obtained in the audit or otherwise appears to be materially misstated. If, based on the work we have performed, we conclude that there is a material misstatement of this other information, we are required to report that fact. We have nothing to report in this regard. Responsibilities of the Directors for the Financial Report The directors of the Company are responsible for the preparation of the financial report that gives a true and fair view in accordance with Australian Accounting Standards and the Corporations Act 2001 and for such internal control as the directors determine is necessary to enable the preparation of the financial report that gives a true and fair view and is free from material misstatement, whether due to fraud or error. In preparing the financial report, the directors are responsible for assessing the ability of the Company to continue as a going concern, disclosing, as applicable, matters related to going concern and using the going concern basis of accounting unless the directors either intend to liquidate the Company or to cease operations, or have no realistic alternative but to do so. F
or p
erso
nal u
se o
nly

35
Auditor’s Responsibilities for the Audit of the Financial Report Our objectives are to obtain reasonable assurance about whether the financial report as a whole is free from material misstatement, whether due to fraud or error, and to issue an auditor’s report that includes our opinion. Reasonable assurance is a high level of assurance, but is not a guarantee that an audit conducted in accordance with Australian Auditing Standards will always detect a material misstatement when it exists. Misstatements can arise from fraud or error and are considered material if, individually or in the aggregate, they could reasonably be expected to influence the economic decisions of users taken on the basis of this financial report. As part of an audit in accordance with the Australian Auditing Standards, we exercise professional judgement and maintain professional scepticism throughout the audit. We also: • Identify and assess the risks of material misstatement of the financial report, whether due to fraud or
error, design and perform audit procedures responsive to those risks, and obtain audit evidence that is sufficient and appropriate to provide a basis for our opinion. The risk of not detecting a material misstatement resulting from fraud is higher than for one resulting from error, as fraud may involve collusion, forgery, intentional omissions, misrepresentations, or the override of internal control.
• Obtain an understanding of internal control relevant to the audit in order to design audit procedures that are appropriate in the circumstances, but not for the purpose of expressing an opinion on the effectiveness of the Company’s internal control.
• Evaluate the appropriateness of accounting policies used and the reasonableness of accounting estimates and related disclosures made by the directors.
• Conclude on the appropriateness of the directors’ use of the going concern basis of accounting and, based on the audit evidence obtained, whether a material uncertainty exists related to events or conditions that may cast significant doubt on the Company’s ability to continue as a going concern. If we conclude that a material uncertainty exists, we are required to draw attention in our auditor’s report to the related disclosures in the financial report or, if such disclosures are inadequate, to modify our opinion. Our conclusions are based on the audit evidence obtained up to the date of our auditor’s report. However, future events or conditions may cause the Company to cease to continue as a going concern.
• Evaluate the overall presentation, structure and content of the financial report, including the disclosures, and whether the financial report represents the underlying transactions and events in a manner that achieves fair presentation.
We communicate with the directors regarding, among other matters, the planned scope and timing of the audit and significant audit findings, including any significant deficiencies in internal control that we identify during our audit. We also provide the directors with a statement that we have complied with relevant ethical requirements regarding independence, and to communicate with them all relationships and other matters that may reasonably be thought to bear on our independence, and where applicable, related safeguards. From the matters communicated with the directors, we determine those matters that were of most significance in the audit of the financial report of the current period and are therefore the key audit matters. We describe these matters in our auditor’s report unless law or regulation precludes public disclosure about the matter or when, in extremely rare circumstances, we determine that a matter should not be communicated in our report because the adverse consequences of doing so would reasonably be expected to outweigh the public interest benefits of such communication.
For
per
sona
l use
onl
y
36
REPORT ON THE REMUNERATION REPORT Opinion on the Remuneration Report We have audited the Remuneration Report included in the directors’ report for the year ended 30 June 2019. In our opinion, the Remuneration Report of Eildon Capital Limited for the year ended 30 June 2019 complies with section 300A of the Corporations Act 2001. Responsibilities The directors of the Company are responsible for the preparation and presentation of the Remuneration Report in accordance with section 300A of the Corporations Act 2001. Our responsibility is to express an opinion on the Remuneration Report, based on our audit conducted in accordance with Australian Auditing Standards. HLB Mann Judd N J Guest Chartered Accountants Partner Sydney, NSW 30 August 2019
For
per
sona
l use
onl
y

6
Eildon Capital Limited
Additional Information The following information was current as at 28 August 2019. Distribution schedule The distribution of shareholders and their shareholdings was as follows:
Category (size of holding)
Number of ordinary shareholders
1 - 1,000 20 1,001 - 5,000 107 5,001 - 10,000 75 10,001 - 100,000 182 100,001 - over 32
──────── Total 416 ════════
Unmarketable parcels
Minimum
parcel size Number of
shareholders
Minimum $500.00 parcel at $1.02 per share 491 10 Substantial holders The names of the Company’s substantial holders and the number of ordinary shares in which each has a relevant interest as disclosed in substantial holder notices given to the Company are as follows:
Shareholder
Number of ordinary shares in which
interest held CVC Limited 18,342,202 J P Morgan Nominees Australia Limited 3,834,523 J K M Securities Pty Limited 3,500,000 Chemical Trustee Limited 3,069,377
For
per
sona
l use
onl
y
KREYES�
Circle
KREYES�
Square
37�
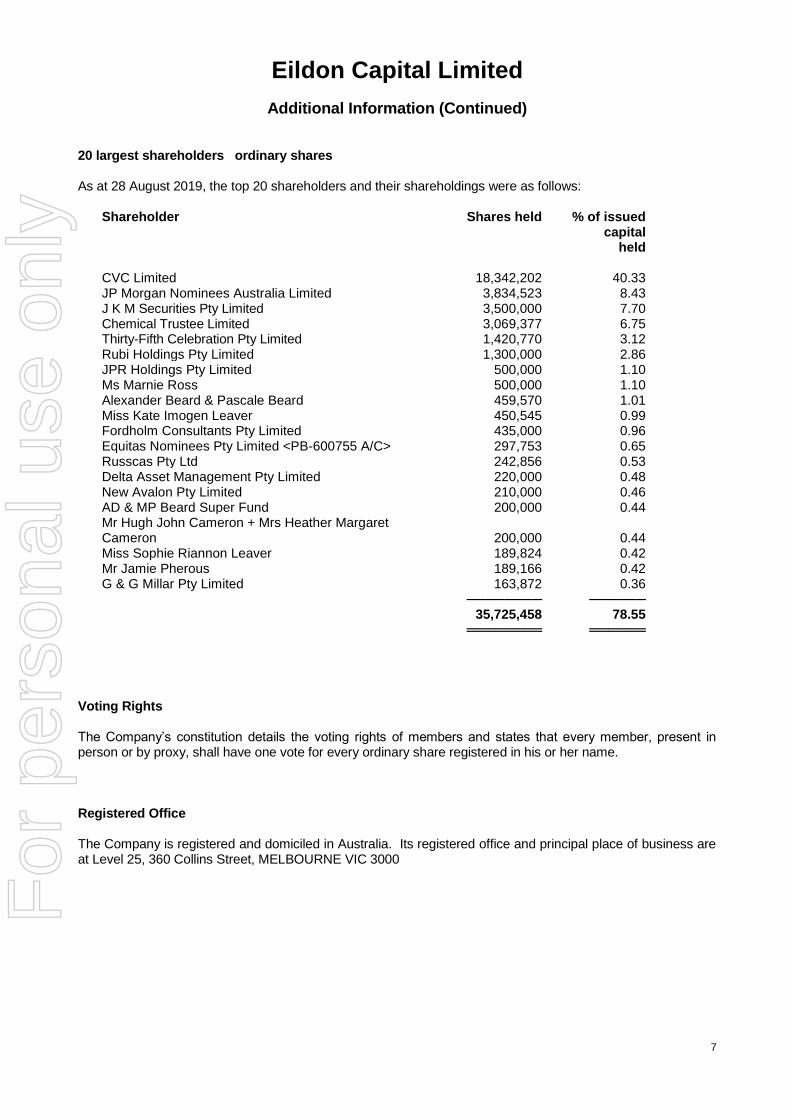
7
Eildon Capital Limited
Additional Information (Continued) 20 largest shareholders ordinary shares As at 28 August 2019, the top 20 shareholders and their shareholdings were as follows:
Shareholder Shares held % of issued capital
held CVC Limited 18,342,202 40.33 JP Morgan Nominees Australia Limited 3,834,523 8.43 J K M Securities Pty Limited 3,500,000 7.70 Chemical Trustee Limited 3,069,377 6.75 Thirty-Fifth Celebration Pty Limited 1,420,770 3.12 Rubi Holdings Pty Limited 1,300,000 2.86 JPR Holdings Pty Limited 500,000 1.10 Ms Marnie Ross 500,000 1.10 Alexander Beard & Pascale Beard 459,570 1.01 Miss Kate Imogen Leaver 450,545 0.99 Fordholm Consultants Pty Limited 435,000 0.96 Equitas Nominees Pty Limited <PB-600755 A/C> 297,753 0.65 Russcas Pty Ltd 242,856 0.53 Delta Asset Management Pty Limited 220,000 0.48 New Avalon Pty Limited 210,000 0.46 AD & MP Beard Super Fund 200,000 0.44 Mr Hugh John Cameron + Mrs Heather Margaret Cameron 200,000 0.44 Miss Sophie Riannon Leaver 189,824 0.42 Mr Jamie Pherous 189,166 0.42 G & G Millar Pty Limited 163,872 0.36 ──────── ────── 35,725,458 78.55 ════════ ══════
Voting Rights The Company’s constitution details the voting rights of members and states that every member, present in person or by proxy, shall have one vote for every ordinary share registered in his or her name. Registered Office The Company is registered and domiciled in Australia. Its registered office and principal place of business are at Level 25, 360 Collins Street, MELBOURNE VIC 3000
For
per
sona
l use
onl
y
KREYES�
Circle
KREYES�
Square
38�