Results and Outlook - total.com energy major Leadership on transparency and collective action...
38
Results and Outlook February 2018
Transcript of Results and Outlook - total.com energy major Leadership on transparency and collective action...
Results and OutlookFebruary 2018

Line 1
2017 Results and Outlook
Base for all bar charts
axis labels base
Line 1 Text under charts
Line 2 Text under charts
Line 2
1
2
1 fatality in 2017
Safety, a core valueCornerstone of operational efficiency
Total Recordable Injury Rate for Total and peers*Per million man-hours
Continuing to improve safety performance
across all segments
Strong focus on major industrial risks
Strengthening engagement with our main
suppliers on safety
* Group TRIR excl. Specialty Chemicals
Peers: BP, Chevron, ExxonMobil, Shell
0.9
2013 2017
2
Contractors
Staff

Line 1
2017 Results and Outlook
Base for all bar charts
axis labels base
Line 1 Text under charts
Line 2 Text under charts
Line 2
Support to TCFD,
reporting in 2017
UN SDG Pioneer driving
partnerships in
low-carbon investments
Guiding principles on reduction
of methane emissions along
gas value chain
Oil & Gas Climate Initiative and
Climate Investments fund
Responsible energy majorLeadership on transparency and collective action
Leadership and collective actionTransparency and engagement
Annual report since 2016
Integrating climate intoour strategy
Endorsement of CEO
guide on climate-related
financial disclosures
3

Line 1
2017 Results and Outlook
Base for all bar charts
axis labels base
Line 1 Text under charts
Line 2 Text under charts
Line 2
300
2016 2040
Integrating climate into strategyTaking into account anticipated market trends
Global energy demandMboe/d
IEA 2°Cscenario*
Solar / Wind
Bio-energy
Hydro
Nuclear
Coal
Oil
Natural gas
4
Focusing on
oil projects
with low
breakeven
Expanding
along the
gas value
chain
Growing
profitable
low-carbon
business
* IEA Sustainable Development Scenario

Line 1
2017 Results and Outlook
Base for all bar charts
axis labels base
Line 1 Text under charts
Line 2 Text under charts
Line 2
5
10
15
20
50
100
Oil demand increased by 1.6 Mb/d in 2017 LNG demand increased by 10% in 2017
Price recovery driven by robust demand and OPEC-NOPEC policyVolatility in energy markets
Gas prices ($/Mbtu)Brent ($/b)
2013 201720162014 2015 2013 201720162014 2015
Henry Hub
NBP
JKM (Far East LNG)
5
2017 results and 2018 objectives

Line 1
2017 Results and Outlook
Base for all bar charts
axis labels base
Line 1 Text under charts
Line 2 Text under charts
Line 2
10%
Strong 2017 resultsBest-in-class profitability with ROE > 10%
Return on Equity%
Adjusted net income B$
* Peers: BP, Chevron, ExxonMobil, Shell – based on public data
8.3 B$
10.6 B$
ERMI ($/t)
54
41
Brent ($/b) 44
34
2016 2017
Exploration & Production
Refining & Chemicals
Marketing & Services
Corporate
Gas, Renewables & Power
7
+28%
Line 1
2017 Results and Outlook
Base for all bar charts
axis labels base
Line 1 Text under charts
Line 2 Text under charts
Line 2
-5
0
5
10
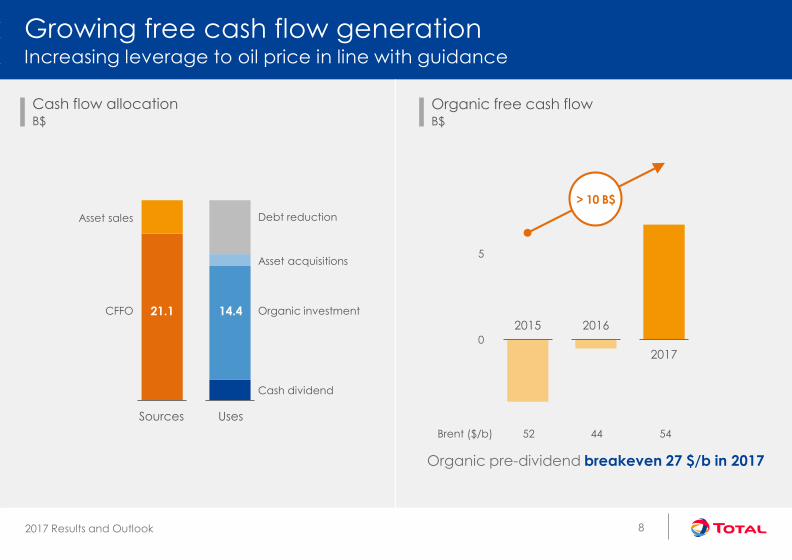
Growing free cash flow generationIncreasing leverage to oil price in line with guidance
Organic free cash flowB$
Cash flow allocationB$
Organic pre-dividend breakeven 27 $/b in 2017
Sources Uses
Asset sales
CFFO 14.4
> 10 B$
52 44 54Brent ($/b)
8
Organic investment
Cash dividend
Asset acquisitions
21.12015 2016
2017
Debt reduction
Line 1
2017 Results and Outlook
Base for all bar charts
axis labels base
Line 1 Text under charts
Line 2 Text under charts
Line 2
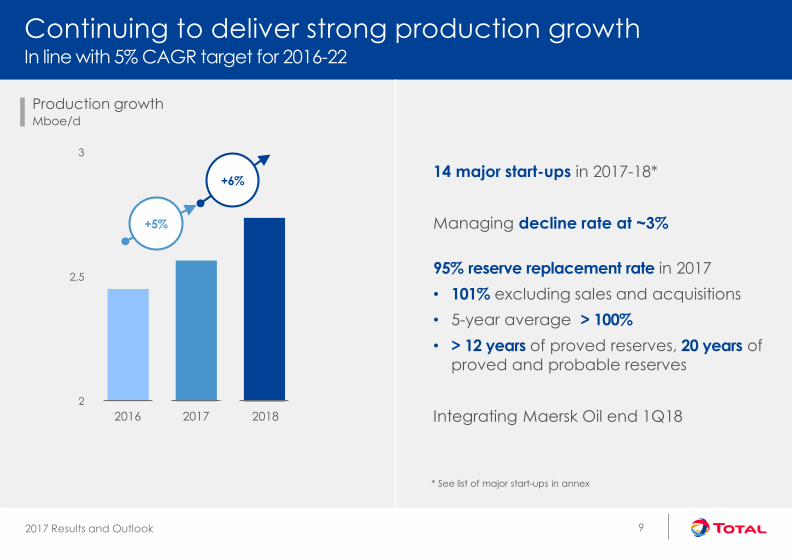
Continuing to deliver strong production growth
14 major start-ups in 2017-18*
Managing decline rate at ~3%
95% reserve replacement rate in 2017
• 101% excluding sales and acquisitions
• 5-year average > 100%
• > 12 years of proved reserves, 20 years of
proved and probable reserves
Integrating Maersk Oil end 1Q182
2,5
3
2016 2017 2018
Production growthMboe/d
2016 2017 2018
+5%
+6%
9
* See list of major start-ups in annex
In line with 5% CAGR target for 2016-22
Line 1
2017 Results and Outlook
Base for all bar charts
axis labels base
Line 1 Text under charts
Line 2 Text under charts
Line 2
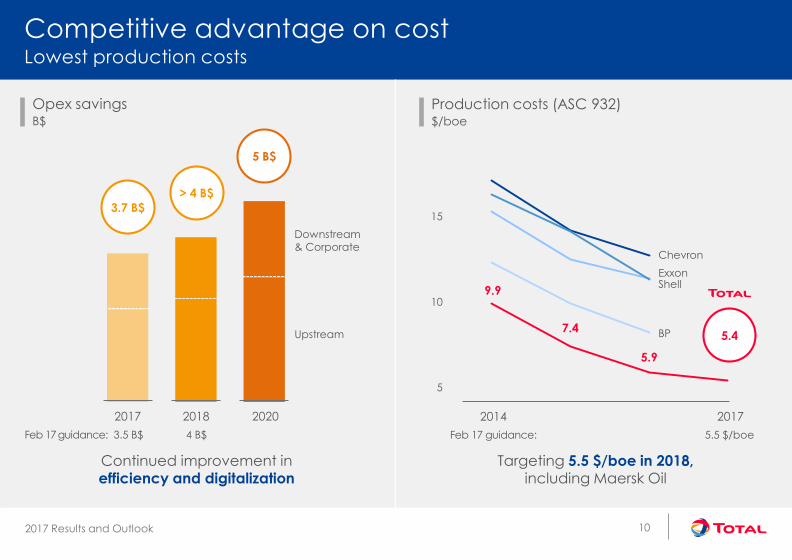
Continued improvement inefficiency and digitalization
Targeting 5.5 $/boe in 2018,including Maersk Oil
Competitive advantage on costLowest production costs
Production costs (ASC 932)$/boe
Opex savingsB$
10
5
10
15
4 B$Feb 17 guidance: 3.5 B$
5 B$
> 4 B$
3.7 B$
Downstream & Corporate
Upstream 5.4
Chevron
ShellExxon
BP
9.9
7.4
5.9
Feb 17 guidance:
2014 2017
5.5 $/boe
2017 2018 2020

Line 1
2017 Results and Outlook
Base for all bar charts
axis labels base
Line 1 Text under charts
Line 2 Text under charts
Line 2
2017 2018
13-15 B$ Organic Capex in 2018-20 Including 2 B$ net acquisitions
Investing with disciplineSustainable Capex underpinning legacy and growth projects
2018 Capital investment*B$
Organic CapexB$
13-15 B$Feb 17 guidance: 14-15 B$
~14 B$
14.4 B$E&P development projects
E&P producing assets
Exploration & resource renewal
Gas Renewables & Power
Downstream
11
* Organic Capex + net acquisitions
Line 1
2017 Results and Outlook
Base for all bar charts
axis labels base
Line 1 Text under charts
Line 2 Text under charts
Line 2
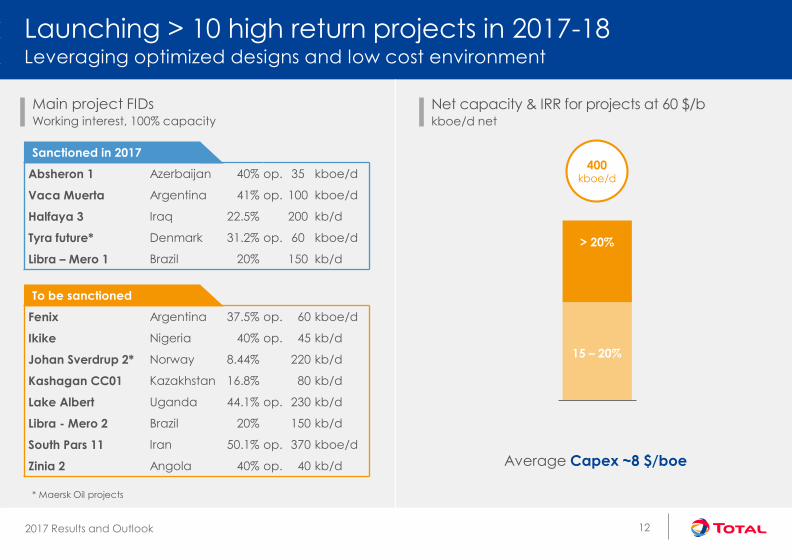
Launching > 10 high return projects in 2017-18Leveraging optimized designs and low cost environment
Net capacity & IRR for projects at 60 $/b kboe/d net
Main project FIDsWorking interest, 100% capacity
Average Capex ~8 $/boe
Sanctioned in 2017
Absheron 1 Azerbaijan 40% op. 35 kboe/d
Vaca Muerta Argentina 41% op. 100 kboe/d
Halfaya 3 Iraq 22.5% 200 kb/d
Tyra future* Denmark 31.2% op. 60 kboe/d
Libra – Mero 1 Brazil 20% 150 kb/d
> 20%
15 – 20%
400 kboe/d
12
To be sanctioned
Fenix Argentina 37.5% op. 60 kboe/d
Ikike Nigeria 40% op. 45 kb/d
Johan Sverdrup 2* Norway 8.44% 220 kb/d
Kashagan CC01 Kazakhstan 16.8% 80 kb/d
Lake Albert Uganda 44.1% op. 230 kb/d
Libra - Mero 2 Brazil 20% 150 kb/d
South Pars 11 Iran 50.1% op. 370 kboe/d
Zinia 2 Angola 40% op. 40 kb/d
* Maersk Oil projects

Line 1
2017 Results and Outlook
Base for all bar charts
axis labels base
Line 1 Text under charts
Line 2 Text under charts
Line 2
New exploration strategy beginning to deliver results2018 budget of 1.2 B$
Successful results in 2017
• Ballymore major oil discovery (US GoM)
• Proving commerciality of Preowei (Nigeria)
• Confirming Vaca Muerta world class oil & gas
resources (Argentina)
Entering key hotspots at competitive cost
• Senegal and Mauritania prolific areas
• Proven oil basin in Guyana
• Angola high potential Block 48
13
Line 1
2017 Results and Outlook
Base for all bar charts
axis labels base
Line 1 Text under charts
Line 2 Text under charts
Line 2
30%7
2015 2016 2017 2018
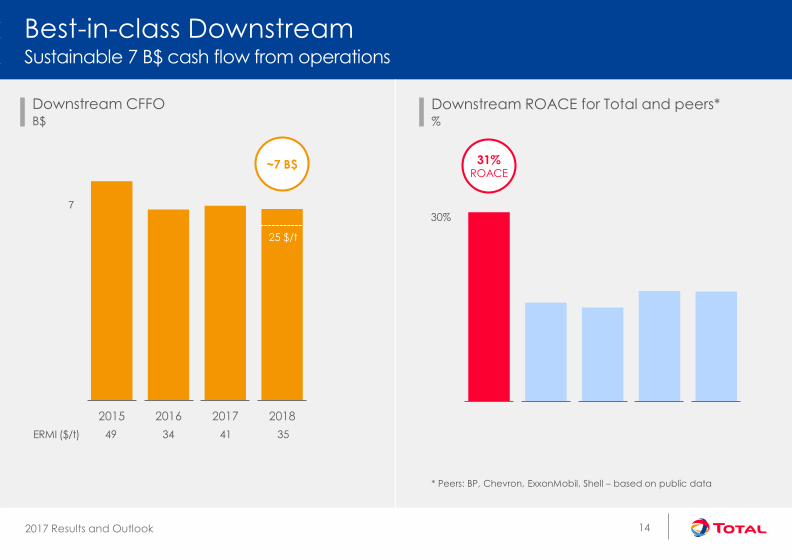
Best-in-class DownstreamSustainable 7 B$ cash flow from operations
Downstream ROACE for Total and peers*%
Downstream CFFOB$
* Peers: BP, Chevron, ExxonMobil, Shell – based on public data
31%ROACE
14
ERMI ($/t) 49 34 41 35
~7 B$
25 $/t

Line 1
2017 Results and Outlook
Base for all bar charts
axis labels base
Line 1 Text under charts
Line 2 Text under charts
Line 2
10%
20%
30%
1.9 B$ non-recurring items in 2017 Best-in-class gearing
Strengthening balance sheetLowering gearing through the cycle
Net-debt-to-capital for Total and peers**End-2017, %
Net-debt-to-equity%
** Peers: BP, Chevron, ExxonMobil, Shell – based on public data
Brent ($/b)
31%
28%27%
14%
99 52 44 54
15
Petrobras Alliance*
2014 2015 2016 2017
12%
* Closed January 12, 2018
Line 1
2017 Results and Outlook
Base for all bar charts
axis labels base
Line 1 Text under charts
Line 2 Text under charts
Line 2
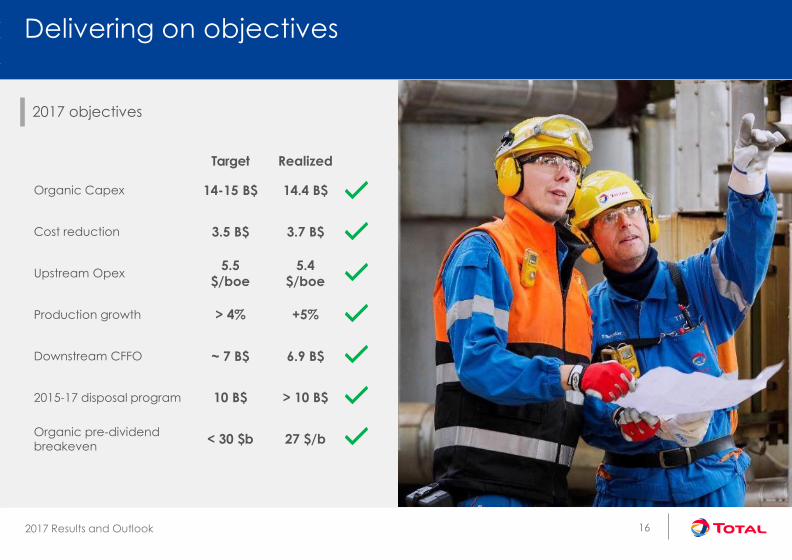
Delivering on objectives
2017 objectives
Target Realized
Organic Capex 14-15 B$ 14.4 B$
Cost reduction 3.5 B$ 3.7 B$
Upstream Opex5.5
$/boe
5.4
$/boe
Production growth > 4% +5%
Downstream CFFO ~ 7 B$ 6.9 B$
2015-17 disposal program 10 B$ > 10 B$
Organic pre-dividend
breakeven< 30 $b 27 $/b
16
Line 1
2017 Results and Outlook
Base for all bar charts
axis labels base
Line 1 Text under charts
Line 2 Text under charts
Line 2
20%
40%
10%
6 30%
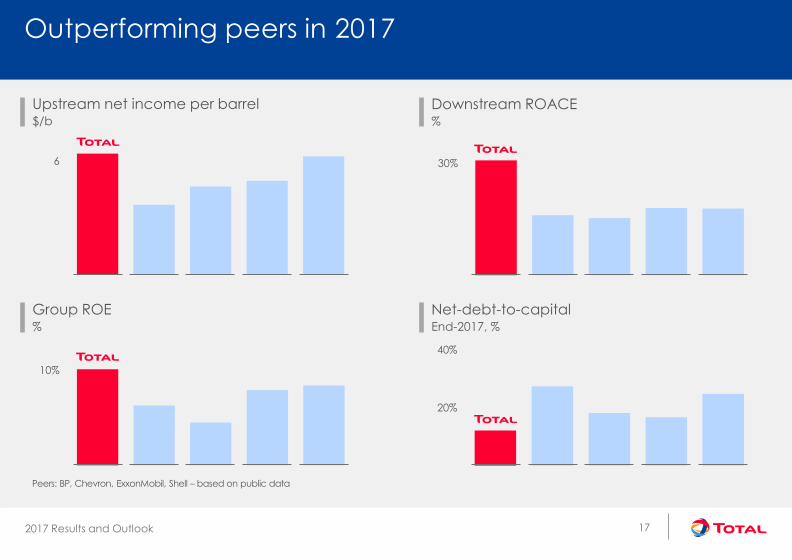
Outperforming peers in 2017
Group ROE%
Downstream ROACE%
Net-debt-to-capitalEnd-2017, %
Upstream net income per barrel$/b
Peers: BP, Chevron, ExxonMobil, Shell – based on public data
17

Outlook

Line 1
2017 Results and Outlook
Base for all bar charts
axis labels base
Line 1 Text under charts
Line 2 Text under charts
Line 2
Resetting the company through the cycleOperational excellence across all segments
Production cost (ASC932)$/boe
Organic free cash flowB$
Net-debt-to-equity%
ProductionMboe/d
2014 2017
2.15
2.57
31%
14%
9.9
5.4
-1.8
6.7
99 54Brent ($/b)
+20%
-45%
2014 2017
19
2014 2017
+8.5 B$
2014 2017
-17 pts

Line 1
2017 Results and Outlook
Base for all bar charts
axis labels base
Line 1 Text under charts
Line 2 Text under charts
Line 2
Taking advantage of the cycle to prepare the futureUpgrading portfolio and launching profitable projects
Downstream free cash flowB$
LNG growth Mt/y
Upstream CFFOB$
ProductionMboe/d
2017 2022
2.6
15
3.9
16
> 40
54 60Brent ($/b)
+5%CAGR
2017 2022 2017 2022
x2.5
2017 2022
~30%
+6 B$

Line 1
2017 Results and Outlook
Base for all bar charts
axis labels base
Line 1 Text under charts
Line 2 Text under charts
Line 2
10
Upgrading portfolioBuilding on our strengths
Acquisitions and divestments 2015-17B$
> 5 Bboe of resources added at < 2.5 $/boe
Middle East & North Africa
ADCO, Al-Shaheen, South Pars 11
North Sea
Maersk Oil acquisition
AfricaMoho Nord, Egina, Kaombostart-ups
Deep offshore
Brazil: Libra, Iara, Lapa
LNG
Engie LNG acquisition, Yamal and Ichthys start-ups
Asset sales
Maersk Oil(shares and debt)
10 B$ assetsale program completed
Acquisitions
21

Line 1
2017 Results and Outlook
Base for all bar charts
axis labels base
Line 1 Text under charts
Line 2 Text under charts
Line 2
Expanding legacy position in Middle East – North AfricaAdding giant long plateau, low cost resources
Enhancing core positions
• ADNOC partnership, Sonatrach partnership
• Launching Halfaya 3
Entering attractive assets
• Al-Shaheen, Berkine basin assets,
South Pars 11
Improving profitability
• ROACE > 20%
22
800kboe/d
production
in 2020
3 B$CFFO
in 2020
at 60 $/b
South Pars 11 50.1%,op.
Iran
ADCO extension 10%
UAE
Sonatrach Partnership(TFT 35%, Timimoun 37.7%)
El Merk/Ourhoud/Hassi Berkine 12.25%
Algeria
FID Halfaya 3 22.5%
Iraq
Entry in Al-Shaheen30%, op.
Qatar

Line 1
2017 Results and Outlook
Base for all bar charts
axis labels base
Line 1 Text under charts
Line 2 Text under charts
Line 2
Rejuvenating North Sea portfolioCombining operational skills of Total and Maersk Oil
Highgrading the portfolio
• Acquiring large low breakeven assets
• Divesting high cost assets
Maersk Oil integration
• Cash accretive from 2018, CFFO of ~30 $/b
• > 400 M$/y synergies
Streamlining operations
• Leveraging scale as 2nd largest operator
On track to close Maersk Oil deal in 1Q18
23
Elgin-Franklin
Alwyn
Johan Sverdrup
Tyra, op.
Martin Linge
Gina Krog
Ekofisk
West of Shetland
Culzean, op.
Main acquisitions Main divestments Key existing assets
500kboe/d
production
in 2020
~ 3.5 B$CFFO
in 2020
at 60$/b
Line 1
2017 Results and Outlook
Base for all bar charts
axis labels base
Line 1 Text under charts
Line 2 Text under charts
Line 2
EginaOwowo
Block 48
C9
ROP
Brulpadda
Kaombo Zinia 2
Lake AlbertPreowei
Lokichar
Ikike
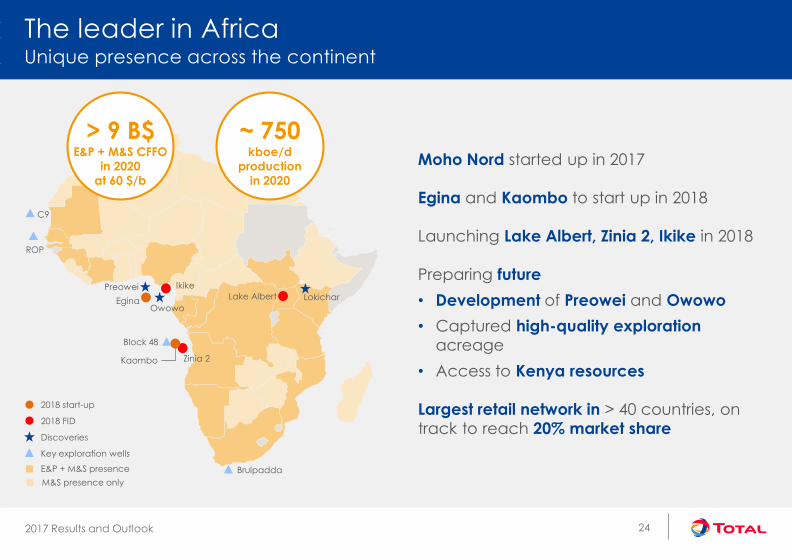
The leader in AfricaUnique presence across the continent
Moho Nord started up in 2017
Egina and Kaombo to start up in 2018
Launching Lake Albert, Zinia 2, Ikike in 2018
Preparing future
• Development of Preowei and Owowo
• Captured high-quality exploration
acreage
• Access to Kenya resources
Largest retail network in > 40 countries, on
track to reach 20% market shareDiscoveries
Key exploration wells
2018 FID
2018 start-up
E&P + M&S presence
24
> 9 B$E&P + M&S CFFO
in 2020
at 60 $/b
~ 750kboe/d
production
in 2020
M&S presence only

Line 1
2017 Results and Outlook
Base for all bar charts
axis labels base
Line 1 Text under charts
Line 2 Text under charts
Line 2
Building new core area at competitive cost in BrazilLeveraging deep offshore expertise to prepare future growth
> 1 Bboe pre-salt resources being developed
Developing giant low-breakeven Libra field
• Libra Pioneiro started up
• Mero 1 FPSO FID taken
• Mero 2 FPSO FID planned in 2018
Strategic Alliance with Petrobras
• Lapa, first IOC operator in pre-salt
• Iara to start up end-2018
Gato do Mato, 20%
Itaipu, 27%
Lapa, 35%, op.Iara, 22.5%
Producing ResourcesUnder development Pre-FID
Libra, 20%
Rio de Janeiro
São Paulo
BRAZIL
25
Wahoo, 20%
> 100kboe/d
production
in 2022
> 1 B$CFFO
in 2022
at 60 $/b

Line 1
2017 Results and Outlook
Base for all bar charts
axis labels base
Line 1 Text under charts
Line 2 Text under charts
Line 2
Engie LNG acquisition, step change in fast growing market#2 LNG player managing > 10% of worldwide market
Taking advantage of strong LNG demand
• +7% in 2016, +10 % in 2017
• 5%/y 2018-25 driven by Asia, notably China
Leveraging size and flexibility
in increasingly commoditized market
Building integrated position in the US
with Barnett shale and Cameron LNG
3 B$/y CFFO from integrated LNG by 2020
• Integrated Gas, Renewables & Power
reporting from 2019
40
2020 LNG portfolio Mt/y for Total*, BP, Chevron, ExxonMobil and Shell
+
26
* Subject to closing of the Engie LNG acquisition

Line 1
2017 Results and Outlook
Base for all bar charts
axis labels base
Line 1 Text under charts
Line 2 Text under charts
Line 2
Snøhvit Yamal
Cameron Driftwood
Nigeria
Angola
Qatargas
Adgas
Yemen
Qalhat
Oman
Idku
IchthysGLNG
Papua
Dunkirk
Fos
Isle of Grain
MontoirZeebruggeSouth Hook
Altamira Hazira
Leading LNG player with global reachLeveraging size and flexibility in increasingly commoditized market
2020 portfolio*Mt/y
40
Supply Demand
Regas in operation & projectLiquefaction in operation & project Long term sales
liquefaction
3rd party
purchase
Long term
sales
Regas
access
spot
* Subject to closing of the Engie LNG acquisition
27
80% of supply with Asian or flexible destination

Line 1
2017 Results and Outlook
Base for all bar charts
axis labels base
Line 1 Text under charts
Line 2 Text under charts
Line 2
Expanding high return petrochemicalsBuilding on worldclass integrated platforms
2 B$/y CFFO by 2020*
Adding value from low cost gas feedstock
Leveraging integrated platformsto maximize synergies and minimize Capex
Differentiated polymer technology
Petrochemical projects
28
* In 2017 petchem environment
Growing US petrochemicalsBorealis Nova JV
New ethane cracker
New polyethylene unitExpanding worldclass
Daesan platformCracker expansion
Polyethylene expansion
Maturing future petrochemicals projects in Middle East – North Africa
Saudi Arabia
Qatar
Algeria
Port ArthurSatorp
QatarDaesan
NormandyAntwerp
Worldclass integrated platforms

Line 1
2017 Results and Outlook
Base for all bar charts
axis labels base
Line 1 Text under charts
Line 2 Text under charts
Line 2
2
2014 2017 2020
Continuing to grow Marketing & ServicesDiversified, non-cyclical source of sustainable cash flow
Marketing & Services CFFOB$
Expanding retail and lubricantsin large, fast growing markets
First Total service station in Mexico
29
+ 100M$per year
+ 100M$per year

Committed to shareholder return

Line 1
2017 Results and Outlook
Base for all bar charts
axis labels base
Line 1 Text under charts
Line 2 Text under charts
Line 2
10
30Cash-accretive production growth
• +2 B$ from Maersk and Brazil
• +2.5 B$ from Ichthys, Egina and Kaombo
• CFFO from major start-ups > 30 $/boe
Increasing leverage to oil price
• 2.8 B$ in 2018 for 10 $/b change
• ~3.3 B$ by 2019
12% net-debt-to-capital end-2017
• Flexibility to maintain gearing < 20%*
Visibility on growing cash flowStrong balance sheet
Debt adjusted cash flow (DACF)*B$
50 $/b
54 $/b
60 $/b
2017 2018 2020
31
2019
+6 B$
22.2
* Excluding IFRS16 impact (under evaluation)* ERMI = 35 $/t

Line 1
2017 Results and Outlook
Base for all bar charts
axis labels base
Line 1 Text under charts
Line 2 Text under charts
Line 2
Increasing dividendFree cash flow yield significantly above dividend yield
Organic free cash flow and dividend per share$/share
Growing dividend by 10% over 3 years
• From 2.48 €/share in 2017 to 2.72 €/share in
2020
Increasing first 2018 interim dividend by 3.2%
• From 0.62 €/share to 0.64 €/share
Full cash dividend equivalent
• From 1Q18, buy back all new scrip sharesissued with no discount
32
5
2017 2018
FCF per share Dividend per share
2020
54 $/b
50 $/b
60 $/b
2.7
Line 1
2017 Results and Outlook
Base for all bar charts
axis labels base
Line 1 Text under charts
Line 2 Text under charts
Line 2
Shareholders to benefit from oil price upside throughshare buyback
Up to 5 B$ share buyback over 2018-20
• Subject to oil price recovery
• In addition to scrip shares buy back
33

Line 1
2017 Results and Outlook
Base for all bar charts
axis labels base
Line 1 Text under charts
Line 2 Text under charts
Line 2
Clear priorities for cash flow allocation for next 3 years
15-17 B$/y Capex
Capital investment
1
10% increaseover 3 years
No scrip dilution
Dividend
2
Maintain gearing < 20%
grade A credit rating
Balance sheet
3
Up to 5 B$ over 2018-20 subject to oil price recovery
Sharebuyback
4
34

Line 1
2017 Results and Outlook
Base for all bar charts
axis labels base
Line 1 Text under charts
Line 2 Text under charts
Line 2
Growing cash and increasing return to shareholdersMaintaining discipline while pursuing an ambitious strategy
Delivering growth
• Operational excellence
• Leadership on costs
• Cash-accretive production growth
Preparing the future
• Upgrading portfolio and launching profitable
projects
• Integrated gas and low carbon business
• Growing petrochemicals, retail and lubricants
Committed to shareholder return
35

Appendix

Line 1
2017 Results and Outlook
Base for all bar charts
axis labels base
Line 1 Text under charts
Line 2 Text under charts
Line 2
2017-19 major start-ups
kboe/d Share Country
Kashagan 370 16.8% Kazakhstan
Moho Nord 100 54% Op. Rep. of Congo
Edradour-Glenlivet 35 60% Op. UK
Libra Pioneiro 50 20% Brazil
Yamal LNG 450 20% Russia
Fort Hills 180 26% Canada
Tempa Rossa 55 50% Op. Italy
Ichthys LNG 340 30% Australia
Vaca Muerta 100 41% Op. Argentina
Halfaya 3 200 22.5% Iraq
Timimoun 30 38% Algeria
Kaombo North 115 30% Op. Angola
Egina 200 24% Op. Nigeria
Iara 1 150 22.5% Brazil
Kaombo South 115 30% Op. Angola
Culzean* 100 49.99% Op. UK
Johan Sverdrup 1* 440 8.44% Norway
Iara 2 150 22.5% Brazil
2017
2018
2019
* Maersk Oil projects
37

Line 1
2017 Results and Outlook
Base for all bar charts
axis labels base
Line 1 Text under charts
Line 2 Text under charts
Line 2
Disclaimer
This document may contain forward-looking information on the Group (including objectives and trends), as well as forward-looking statements within the meaning of the Private Securities Litigation Reform Act of 1995, notably with respect to the financial condition, results of operations, business, strategy and plans of TOTAL. These data do not represent forecasts within the meaning of European Regulation No. 809/2004.
Such forward-looking information and statements included in this document are based on a number of economic data and assumptions made in a given economic, competitive and regulatory environment. They may prove to be inaccurate in the future, and are subject to a number of risk factors that could lead to a significant difference between actual results and those anticipated, including currency fluctuations, the price of petroleum products, the ability to realize cost reductions and operating efficiencies without unduly disrupting business operations, environmental regulatory considerations and general economic and business conditions. Certain financial information is based on estimates particularly in the assessment of the recoverable value of assets and potential impairments of assets relating thereto.
Neither TOTAL nor any of its subsidiaries assumes any obligation to update publicly any forward-looking information or statement, objectives or trends contained in this document whether as a result of new information, future events or otherwise. Further information on factors, risks and uncertainties that could affect the Company’s financial results or the Group’s activities is provided in the most recent Registration Document filed by the Company with the French Autorité des Marchés Financiers and annual report on Form 20-F filed with the United States Securities and Exchange Commission (“SEC”).
Financial information by business segment is reported in accordance with the internal reporting system and shows internal segment information that is used to manage and measure the performance of TOTAL. Performance indicators excluding the adjustment items, such as adjusted operating income, adjusted net operating income, and adjusted net income are meant to facilitate the analysis of the financial performance and the comparison of income between periods. These adjustment items include:
(i) Special itemsDue to their unusual nature or particular significance, certain transactions qualified as "special items" are excluded from the business segment figures. In general, special items relate to transactions that are significant, infrequent or unusual. However, in certain instances, transactions such as restructuring costs or asset disposals, which are not considered to be representative of the normal course of business, may be qualified as special items although they may have occurred within prior years or are likely to occur again within the coming years.
(ii) Inventory valuation effectThe adjusted results of the Refining & Chemicals and Marketing & Services segmentsare presented according to the replacement cost method. This method is used to assess the segments’ performance and facilitate the comparability of the segments’ performance with those of its competitors.
In the replacement cost method, which approximates the LIFO (Last-In, First-Out) method, the variation of inventory values in the statement of income is, depending on the nature of the inventory, determined using either the month-end price differentials between one period and another or the average prices of the period rather than the historical value. The inventory valuation effect is the difference between the results according to the FIFO (First-In, First-Out) and the replacement cost.
(iii) Effect of changes in fair value The effect of changes in fair value presented as an adjustment item reflects for some transactions differences between internal measures of performance used by TOTAL’s management and the accounting for these transactions under IFRS.
IFRS requires that trading inventories be recorded at their fair value using period-end spot prices. In order to best reflect the management of economic exposure through derivative transactions, internal indicators used to measure performance include valuations of trading inventories based on forward prices.
Furthermore, TOTAL, in its trading activities, enters into storage contracts, which future effects are recorded at fair value in Group’s internal economic performance. IFRS precludes recognition of this fair value effect.
The adjusted results (adjusted operating income, adjusted net operating income, adjusted net income) are defined as replacement cost results, adjusted for special items, excluding the effect of changes in fair value.
Cautionary Note to U.S. Investors – The SEC permits oil and gas companies, in their filings with the SEC, to separately disclose proved, probable and possible reserves that a company has determined in accordance with SEC rules. We may use certain terms in this presentation, such as resources, that the SEC’s guidelines strictly prohibit us from including in filings with the SEC. U.S. investors are urged to consider closely the disclosure in our Form 20-F, File N° 1-10888, available from us at 2, Place Jean Millier – Arche Nord Coupole/Regnault- 92078 Paris-La Défense Cedex, France, or at our website: total.com. You can also obtain this form from the SEC by calling 1-800-SEC-0330 or on the SEC’s website: sec.gov.
38