(Results and Action plan for Biodiversity, Protected Areas ...
35
1 IUCN- ROWA Programme 2020-2025 (Results and Action plan for Biodiversity, Protected Areas & World Heritage Programme)
Transcript of (Results and Action plan for Biodiversity, Protected Areas ...

1
IUCN-ROWA Programme 2020-2025
(Results and Action plan for Biodiversity, Protected Areas & World
Heritage Programme)

2
Table of Content
TABLE OF CONTENT 2
INTRODUCTION 4
SITUATION ANALYSIS IN WEST ASIA 6
A. BIODIVERSITY 6
B. PROTECTED AREAS 10
IUCN MISSION, NICHE AND PROGRAMMES 14
PROGRESS TOWARD ACHIEVING IUCN PROGRAMMES 15
I. Valuing and conserving nature: 15 A. IUCN Red List: 16 B. Measuring risks to conserve natural and human communities 17 C. Natural World Heritage sites 18 D. Planet of Protected Areas 22
II. Effective and equitable governance of nature’s use 23 A. Important sites for biodiversity 23 B. Integration of the knowledge products 23
III. Deploying nature-based solutions to climate, food and development 23 A. Unlocking the Water, Energy, Food Nexus 23
ACTION PLAN FOR BIODIVERSITY, PROTECTED AREAS AND WORLD HERITAGE
PROGRAMME IN WESTASIA ACCORDING TO IUCN GLOBAL PROGRAMME 24
I. Programme Area 1: Valuing and Conserving Nature 24
II. Programme Area 2: Effective and equitable governance of nature’s use 27
III. Programme Area 3: Deploying nature-based solutions to global challenges in climate, food and
development 29
REFERENCES 30

3
APPENDIX I: TOTAL ENDEMIC AND THREATENED ENDEMIC SPECIES IN WEST
ASIA (TOTALS BY TAXONOMIC GROUP) 33
APPENDIX 2: HUMAN DEVELOPMENT INDEX TRENDS IN WEST ASIA, 1980-2013 34
APPENDIX 3: STATUS OF WEST ASIA COUNTRIES REGARDING INTERNATIONAL
ENVIRONMENTAL AGREEMENTS AND ITS INSTRUMENTS 35

4
INTRODUCTION
Biodiversity is the foundation of life on Earth. It is crucial for the functioning of ecosystems which
provide us with products and services without which we couldn’t live. Oxygen, food, fresh water,
fertile soil, medicines, shelter, protection from storms and floods, stable climate and recreation - all
have their source in nature and healthy ecosystems. Biodiversity is extremely complex, dynamic and
varied like no other feature of the Earth. Its innumerable plants, animals and microbes physically and
chemically unite the atmosphere (the mixture of gases around the Earth), geosphere (the solid part of
the Earth), and hydrosphere (the Earth's water, ice and water vapor) into one environmental system
which makes it possible for millions of species, including people, to exist. By changing biodiversity,
we strongly affect human well-being and the well-being of every other living creature. In response
to the urgent need to address the issue of biodiversity loss, nearly 200 governments adopted the
Strategic Plan for Biodiversity 2011-2020 (Aichi Targets) at the Convention on Biological diversity
meeting in Nagoya, Japan, in October 2010. The strategic plan includes a shared vision, a mission,
and 20 targets organized under five strategic goals, to inspire broad-based action by all Parties and
stakeholders.
In IUCN’s view the Strategic Plan for Biodiversity 2011-2020 (Aichi Targets) represents an
unparalleled opportunity to galvanize all parts of society to work to tackle the crisis of ongoing
biodiversity loss, on which the life on this planet depends. IUCN (its Members, Commission
Members and Secretariat) played a significant role in the development and adoption of the Strategic
Plan. In response to a request from the Scientific Authorities of the Biodiversity – related
Conventions (CSAB), IUCN has mapped the Aichi Targets to the programmes, plans and action
plans of these conventions. This is promoting greater synergy and cohesion between the conventions
as well as a more streamlined approach to achieving the targets. IUCN has signed an agreement with
the SCBD that aims at establishing areas of specific cooperation with the Convention.
Helping countries and communities designate and manage systems of protected areas on land and in
the oceans, is one of IUCN’s main areas of expertise. Together with species conservation, this has
been a key focus of attention of IUCN’s work and of a vast majority of IUCN Member organizations.
Effectively managed systems of protected areas have been recognized as critical instruments in
achieving the objectives of the Convention on Biological Diversity and the Millennium Development
Goals. The World Commission on Protected Areas (WCPA) is the world's premier network of
protected area expertise. It is administered by IUCN's Global Programme on Protected Areas. WCPA
works by helping governments and others plan protected areas and integrate them into all sectors; by
providing strategic advice to policy makers; by strengthening capacity and investment in protected
areas; and by convening the diverse constituency of protected area stakeholders to address
challenging issues. For more than 50 years, IUCN and WCPA have been at the forefront of global
action on protected areas.
IUCN is the advisory body on nature to the UNESCO World Heritage Committee. Working closely
with IUCN Members, Commissions and Partners, and especially the World Commission on
Protected Areas (WCPA), and with a range of partners, IUCN’s World Heritage Programme
evaluates new sites nominated to the World Heritage List, monitors the conservation of listed sites,
promotes the World Heritage Convention as a leading global instrument for conservation, and
provides support, advice and training to site managers, governments, scientists and local
communities. The IUCN World Heritage Programme also initiates innovative ways to enhance the
role of the World Heritage Convention in protecting the planet’s biodiversity and natural heritage

5
and positioning the worlds’ most iconic places as exemplars of nature-based solutions to global
challenges.
The Western Asia region is geographically not clearly defined and various institutions use the term
to designate different geographical areas, depending on the scope of their operations. In its broadest
geographic sense, the Western Asia region can comprise countries located from the eastern shores of
the Red Sea and the Mediterranean Sea to the Gulf coast in the east, up to the Caucasus Mountains
in the north. The United Nations Statistics Division defines Western Asia as a geographic sub-region
of Asia that encompasses Armenia, Azerbaijan, Bahrain, Cyprus, Georgia, Iraq, Israel, Jordan,
Kuwait, Lebanon, Oman, Palestine, Qatar, Saudi Arabia, Syria, Turkey, United Arab Emirates and
Yemen. However, some organizations, even within the UN system, refer only to a sub-section of this
wider geographic definition, based on regional, cultural or political identities. For instance, the
membership of the United Nations Economic and Social Commission of Western Asia (ESCWA)
comprises only the Arab countries of Western Asia, sometimes also referred to as Arab Western Asia
or the Arab Mashrek, plus most Arab countries situated in North Africa (Egypt, Libya, Morocco,
Tunisia and Sudan); as such, it excludes Cyprus, Iran, Israel, Turkey and other countries located
further north towards the Caspian Sea. Within the UN and other international organizations, Western
Asia has also often come to replace the narrower terms “Middle East” and “Near East”, which are
regarded as Eurocentric as they designate the region in relation to Europe. Other institutions use
Middle East in combination with “North Africa”, resulting in the term “MENA region”, which also
includes non-Arab countries. The Western Asia region as defined in this report thus extends from the
Red Sea in the west to the Gulf coast in the east, and from the north-eastern shore of the
Mediterranean Sea to the Gulf of Aden in the south.
West Asia is part of three eco-regions that incorporate a variety of ecosystems, including
Mediterranean forests, deserts, plains, rangelands, savannas, oases, mountains, rivers, lakes, springs,
mudflats, swamps, marshes, mangroves, seagrass beds and coral reefs, all of which provide a wide
array of ecosystem services and ecological corridors for migratory species through the region. On
the other hand, West Asia is plagued by political instability and conflict, which are having drastic
impacts on people’s security, livelihoods and conservation, while it will be affected by climate
change that will threaten livelihoods further through disasters. West Asia has recently undergone
profound ecological changes. According to fragmented assessments, the region has suffered a
substantial loss of biodiversity and a degradation of habitats as a result of human activities. The
environment is dominated by limited water resources, a scarcity of arable land, fragile ecosystems
and episodic droughts.
The IUCN West Asian region comprises of 13 countries including Iraq, Jordan, Lebanon, the
Occupied Palestinian Territory, the Syrian Arab Republic, Yemen and Iran in addition to the Gulf
countries including Bahrain, Oman, Kuwait, Qatar, Saudi Arabia, and United Arab Emirates. The
International Union for Conservation of Nature’s involvement in West Asia region is being
coordinated by IUCN Regional Office for West Asia (ROWA) which is based in Amman-Jordan and
responsible for managing IUCN business at the regional and national levels. IUCN ROWA is
working in cooperation with its members, partners, commissions and donors to shape and define
future sustainable development agenda in the region. IUCN ROWA also focuses on a multi-
stakeholder decision process involving governments, civil society and research institutions.
Environmental awareness is a key issue for making a difference, thus the office facilitates
communication, coordination, and information exchange among different actors in the region. In
2005, the IUCN ROWA was granted an observer status in the Arab League after a decision made by
the Council of the Arab Ministers Responsible for the Environment (CAMRE). During 2006 and

6
2007, IUCN ROWA has been an active participant in the technical committee for environmental
conventions in the Arab League by taking the lead on activating the RAMSAR convention in the
Region.
SITUATION ANALYSIS IN WEST ASIA
A. BIODIVERSITY The Arab region is a meeting place and a transitional area between various phytogeographic and
zoogeographic regions of the world. Floristic elements of five floral provinces exist in the region
representing the Mediterranean, Irano-Turanian, Saharo-Sindian, and the Sudano-Deccanian (Zohary
1973). The spectacular terrain and various climatic conditions that prevail in the Arab region, along
with the diverse biogeographic origins of the species, contribute to the diversity of flora and fauna at
the species level, particularly to the endemism of these taxa. The number of plant species varies
among the sub-regions of the Arab region, reaching up to 4,000 species in some countries. A large
number of endemic taxa also occur in the region; the total number of known endemic flora is about
3,397 (Boulos and others 1994; Ghabbour 1997). Of the six major faunal realms, three are
represented in the region: the Palaearctic, the Ethiopian and the Oriental (Ghabbour 1997). There are
approximately 1,700 mammals, of which 39 (or 3 percent) are endemic (WRI 2002; Animal Info.
database 2005; SCBD 2010). In addition, 30 species of birds are endemic to the region along with
132 species of reptiles and eight amphibians (FAO 1997; WRI 2002; SCBD 2010). Endemism is
highly exceptional in some localities like Socotra archipelago where more than 30 percent of the
biota is endemic. For the Arab region, mammal species diversity is fairly low and ranges from 0.002
to 0.005 km2 (Mackay 2009).
West Asia countries have a number of global Key Biodiversity Areas (KBA). One of this KBA is the
Irano-Anatolian Hotspot located in part of the mountains of northern Iraq and northeast Syria, the
climate is continental with an annual rainfall ranging from less than 100 to over 1000 mm. The
ecosystem type consists of forest steppe, which supports oak-dominant deciduous forests on the
southwestern slopes of the Anatolia and Zagros mountains. This hotspot includes four endemic and
threatened species of vipers (Vipera sp.). The other KBA in the region is the Mediterranean Basin
Hotspot. In this KBA, the region supports diverse forms of vegetation “ecoregions”, most notably:
Eastern Mediterranean conifer-sclerophyllous-broadleaf forests, Mediterranean acacia-argania dry
woodlands and succulent thickets, Mediterranean dry woodlands and steppe, and the true
Mediterranean woodlands and forests (WWF 2001).
With an original area that covered 15,000 to 20,000 km2, the Mesopotamian marshlands complex,
centered at the confluence of the Tigris and Euphrates rivers in southern Iraq, was the largest wetland
in the Mashreq sub-region of the Arab region. Aside from their importance to the Arab Marsh people
who settled there, the marshlands are home to many resident and migratory birds. Upstream dam
building coupled with water diversion and land reclamation projects in southern Iraq reduced water
inflow into these swamps, which have reduced their surface area significantly, converting them to
bare land and salt crusts (UNEP 2001). Less than 7 percent of their original extent remained in 2002
(UNEP 2004). By 2004, with re-flooding efforts, nearly 40 percent of the marshlands were inundated
(The Eden Again Project 2004). A UNEP assessment of the marshlands restoration in 2006
concluded that about 58 percent of the marsh areas are present, though there is fragmentation of the
wetland areas. Signs of biodiversity were documented in terms of the abundance of vegetation and
the number of bird species; however, frequent droughts and demand for irrigation water are still the
main threats to this marshland ecosystem. In 2007, Haur Al-Hawizeh, an area of 137,700 ha of

7
marshland in the Mesopotamian complex, was declared a Wetland of International Importance
(Ramsar 2009), and in 2016 the Mesopotamian Marshlands (al-Ahwar) have been inscribed on the
World Heritage List during the 40th session of the World Heritage Committee (UNESCO 2016).
The 3rd KBA in the region is the Coastal Forests. This hotspot contains the forests of southeastern
Somalia. The climate is tropical to subtropical with complex vegetation composed mainly of moist
and dry forests, coastal thickets, fire-climax savannah woodlands, seasonal and permanent swamps,
and littoral habitats that include mangrove vegetation along parts of the coast. This hotspot is home
to a variety of primate species. Of particular ecological interest, in this KBA, are the patchy mangrove
forests (Avicennia marina) that grow along the coasts of the Gulf countries and the Red Sea.
Ecologically, mangrove communities attenuate wave action, halt coastal erosion and shelter native
species of flora and fauna, especially avifauna. Nearly 45 species of waterfowl were recorded in
mangrove areas of Bahrain (Mohammed 1994). Mangrove forests along the coasts of the ROPME
Sea Area and the Red Sea are experiencing pressures due to the combined effects of grazing and
cutting, commercial shrimp farming, pollution and large-scale development along the coasts of
Arabia and Egypt (PERSGA 2004). The coastal zone in Bahrain was increased by 40 km2 in less
than 20 years due to reclamation projects (UNEP 2004). In Saudi Arabia, more than 40 percent of
the ROPME Sea Area coastline was reclaimed and almost 50 percent of the mangroves were lost
(Sheppard and others 1992). Similarly, the Palm Islands on the coast of Dubai (UAE) will increase
Dubai’s shoreline by 120 km.
Map (1): Total number of birds in West Asia
This map developed by the expert & based on literatures
The Arab region sits at the intersection of several flyways of waders/shorebirds, including: the West

8
Asia/East Africa Flyway, the Mediterranean/Black Sea Flyway and the East Atlantic Flyway. The
islands of the southern Red Sea, specifically the Farasan Islands, are used by many hundreds of
thousands of birds during their spring and autumn migrations (PERSGA 2003). A total of 391 sites
covering more than 300,000 km2, or about 5 percent of the land area of West Asia (including Iran
and Afghanistan), has been identified as Important Bird Areas (IBAs) (BLI 2008). Half of these areas
are wetlands, 30 percent of which are coastal and marine habitats. Over 20 percent of these are under
high to moderate threat (Evans 1994, BLI 2008).
Map (2): Total number of endemic birds in West Asia
This map developed by the expert & based on literatures
Map (3): Number of Important Bird Areas (IBAs) in
West Asia

9
This map developed by the expert & based on
literatures
Map (4): Number of Marine Important Bird Areas (MIBAs) in West Asia
This map developed by the expert & based on literatures
The total number of known threatened species in the Arab region is 1,746, thirteen percent of which
are mammals, 12 percent birds, 5 percent reptiles, 0.5 percent amphibians, 25 percent fish, and 12
percent plants (IUCN 2009). A majority of these species are critically endangered (69 percent of
animals and 39 percent of plants). The number of birds and reptiles threatened with extinction in the
region doubled between 2002 and 2006, and the number of threatened fish species increased 14 times
over this same period (IUCN 2009). In the Mediterranean, out of the nine species groups
(amphibians, birds, cartilaginous fish, cetaceans, crabs and crayfish, endemic freshwater fish,
mammals, dragonflies and reptiles) one-fifth are threatened with extinction - 5 percent are critically
endangered, 7 percent endangered and 7 percent vulnerable (Cuttelod and others 2008).
Captive breeding programmes for threatened species began in the region in the 1980s, with the
Arabian oryx, houbara bustard and some gazelle species in Jordan, Oman, Saudi Arabia and Syria
(GCEP 2000). The number of Ramsar protected sites in the region is 109 with a total area of
12,410,436 ha, 44 percent of which are in West Asia countries (Ramsar 2007); the number of World
Heritage Sites totals 65 and covers an area of 1,063,259 (8 percent) in the Arab region (UNESCO
2010). On the marine side, the protected and managed areas in the Mediterranean are 4 percent of its
total area (Abdulla and others 2008); by contrast, the amount of protected area in the Red Sea is 12
percent (Wood 2007).
The driving forces and pressures of this biodiversity loss can be attributed to urban, agricultural and
industrial development, specifically, overgrazing by domestic animals, over-utilization of land and
water resources, commercial exploitation of biodiversity resources and overpopulation. Invasive

10
alien species are another threat to biodiversity and native fauna and flora. Alien species are species,
sub-species, or lower taxon occurring outside of their natural range and dispersal potential, and
includes any part, gametes or propagule of such species that might survive and subsequently
reproduce (IUCN 2000). A total of 554 invasive species have been reported in the Arab region.
Thirty-six percent of them are classified as aliens, whereas 51 percent are native and the bio-status
of 75 species is yet to be determined. Nearly 15 per cent of reported invasive species are marine
species introduced mostly by migration and ballast water from ships (GISD, 2012).
B. PROTECTED AREAS There are ongoing schemes to establish protected areas all over the Arab region. Many of these
schemes have already proven successful as the countries of the region currently have over 150
protected terrestrial areas and 24 biosphere reserves, according to the Classification of the World
Nature Conservation Federation. These reserves exist in 11 Arab countries and cover a total area of
12,733,710 ha, (UNESCO-MAP 1987). In West Asia, a total of 534 protected areas have been
designated—Saudi Arabia leads the other West Asian countries in the number of designated areas
(existing & future PAs), followed by Jordan and Kuwait. In 2019, the amount of protected areas in
West Asia amounted to 28,912,000 ha, or less than 10 percent of the total land area (protected planet
2019). West Asia lags behind the world average in proportion of protected areas but is expanding
efforts to increase the amount of lands under protection to reach 10 to 15 per cent of overall land
cover by 2020 (UNEP 2010).
Map (5): Number of Terrestrial Protected Areas within West Asia
This map developed by the expert & based on literatures
11
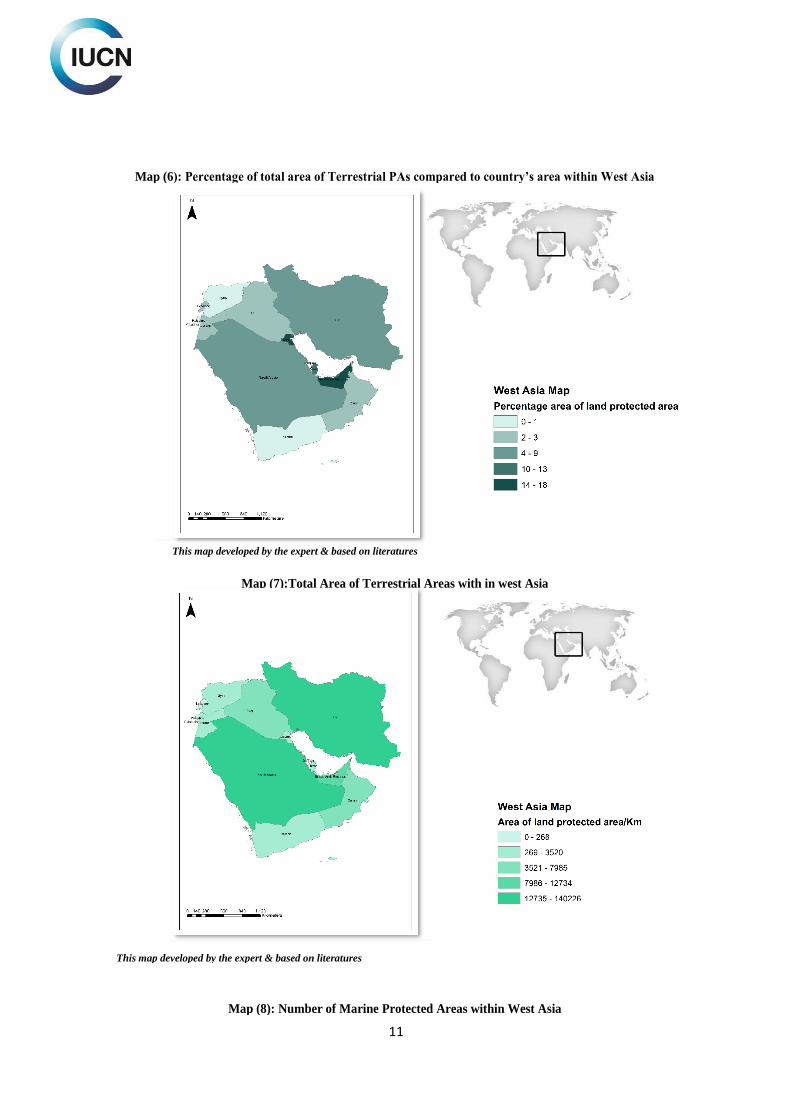
Map (6): Percentage of total area of Terrestrial PAs compared to country’s area within West Asia
This map developed by the expert & based on literatures
Map (7):Total Area of Terrestrial Areas with in west Asia
This map developed by the expert & based on literatures
Map (8): Number of Marine Protected Areas within West Asia

12
This map developed by the expert & based on literatures
Map (9): Total area of Marine Protected Areas within West Asia (km2)
This map developed by the expert & based on literatures
Map (10): Percentage of total area of Marine PAs compared to country’s EEZ within West Asia

13
This map developed by the expert & based on literatures
Map (11): Ramsar sites within West Asia
This map developed by the expert & based on literatures
At the country level, Saudi Arabia announced the presence of 70 between declared and suggested

14
protectorates with a total area of 92,064 km2 whereas the total protected land area barely exceeds 6
percent in Jordan, Oman and Sudan. Certain Arab countries comprise other forms of protected sites,
which fall under the category of nationally-declared protected areas or ecosystems. However, in the
Arab region as a whole, less than 5 percent of the total land area has been officially protected, which
is below the world standard of 10 per cent (UNEP 2008). Among the most significant achievements
regarding biodiversity conservation is the restoration of the Mesopotamian Marshlands of Iraq after
being almost dried off (despite the shortage of water in the area as a result of the scarcity of the river
water that feeds it) and declaring them as world heritage site, Furthermore, the creation of large water
impoundments in Iraq, Jordan and Syria have provided new habitat opportunities for resident and
migrating species, especially avian, off- setting the negative impacts of natural wetland destruction.
IUCN MISSION, NICHE AND PROGRAMMES
“A just world that values and conserves nature”, this is IUCN’s Vision. Nature is our life support
system. The diversity of life and nature must be conserved for its own sake and also for development
to be sustainable. This requires fundamental change in all dimensions of life and society, including
politics and economics, far beyond IUCN’s mandate and capacities. IUCN advances nature-based
solutions to halt the destruction of biodiversity and to sustain development for all, especially the
poorest people and communities who depend directly on nature for their livelihoods. A just world
must guarantee equitable rights of access to biodiversity and nature’s benefits across generations,
gender, and economic, social and geopolitical lines. This vision echoes the principles and values
embodied in IUCN Resolutions on the Earth Charter and on the Intergenerational Partnership for
Sustainability.
IUCN’s mission is “To influence, encourage and assist societies throughout the world to conserve
the integrity and diversity of nature and to ensure that any use of natural resources is equitable and
ecologically sustainable” The world needs IUCN’s leadership to address the growing crisis in
biodiversity loss and to show how nature can provide solutions to the world’s most pressing issues –
and how environmental governance can be improved for biodiversity conservation. IUCN is the
leading provider of biodiversity knowledge, tools and standards used to influence policy, undertake
conservation planning and guide action on the ground. As a Union, IUCN is well placed to bring
together the key actors at all levels.
IUCN Niche is “To provide the knowledge-based platform to connect practice to policy at global
and local levels and to influence decisions and actions relating to the sustainability of the earth
and its people”.
The IUCN Charter: “This Charter calls upon the Secretariat, Commissions, and National and
Regional Committees to work together to develop and implement the IUCN Programme
collaboratively. It invites Members, where their priorities and capacities align with the Programme,
to participate in its implementation.”
The IUCN Programme provides the framework for planning, implementing, monitoring and
evaluating the conservation work undertaken by the Commissions and the Secretariat with and on

15
behalf of IUCN Members. The IUCN Programme 2017-2020 was approved by Member
organizations at IUCN’s World Conservation Congress in September 2016 in Hawai’i, United States
of America. The 2017-2020 Programme was developed as a result of a six-month consultation
process across IUCN Members and Commissions.
The IUCN Programme 2017–2020 aims “to mobilize communities working for biodiversity
conservation, sustainable development and poverty reduction in common efforts to halt biodiversity
loss and apply nature-based solutions to conserve biodiversity, enhance resilience, strengthen equity,
reduce poverty and so improve the wellbeing of people on this planet”. The Programme builds upon
IUCN’s niche as the world’s authority on biodiversity conservation, nature-based solutions and
related environmental governance. It has three Programme Areas:
1. Valuing and Conserving Nature enhances IUCN’s heartland work on biodiversity conservation,
emphasizing both tangible and intangible values of nature.
2. Effective and Equitable Governance of Nature’s Use consolidates IUCN’s work on people-nature
relations, rights and responsibilities, and the political economy of nature.
3. Deploying Nature-based Solutions to Global Challenges in Climate, Food and Development
expands IUCN’s work on nature’s contribution to tackling problems of sustainable development,
particularly in climate change, food security and social and economic development.
PROGRESS TOWARD ACHIEVING IUCN PROGRAMMES
IUCN works under the principle that nature conservation and human progress are not mutually
exclusive. Facing tremendous forces of transformation such as climate change and dramatic
socioeconomic inequality across the world, there are credible and accessible political, economic,
cultural and technological choices that can promote general welfare in ways that support and even
enhance our planet’s natural assets.
To inform these choices, IUCN has been aligning conservation efforts all over the world around
three solid lines of work: valuing and conserving nature’s diversity, advancing effective and
equitable governance of the use of nature, and deploying nature-based solutions to climate,
food and development challenges. The approach that is emerging from its collective efforts
demonstrates that nature is not an obstacle to human aspirations, but rather an essential partner,
offering valuable
Contributions towards all our endeavors.
On 2017 IUCN’s work Programme upended the litany of human threats to ecosystems by asking,
and answering, what nature can do for humanity. In addition to documenting the increasingly
degraded and unstable condition of the atmosphere, IUCN expanded its nature-based efforts for
results within the sustainable use of nature.
I. Valuing and conserving nature:

16
A. IUCN Red List:
IUCN’s 2017 portfolio is strong on knowledge products (IUCN Red Lists and Protected Areas) and
related policy influencing, and is moving more into results on the ground with programmes such as
SOS (Save Our Species) and BIOPAMA (Biodiversity and Protected Areas Management), which
were scaled up with existing donor contacts. New Programme development in 2013 focused on
spatial data integration of the flagship knowledge products, including work on Key Biodiversity
Areas (KBAs). Regarding the West Asia region the following activities done as follows:
• Regional Red List Status of Carnivores in the Arabian Peninsula:
Thirty species of terrestrial carnivores have been reported to occur within the Arabian region and 20
of these have been recorded within the Arabian Peninsula. Out of the 20 species, one was assessed
as Regionally Extinct, one as Critically Endangered, two as Endangered, one Vulnerable, four Near
Threatened, five Least Concern and two Data Deficient. The four remaining species were deemed
Not Applicable for regional assessment, according to the IUCN guidelines. Eight (50%) species are
more threatened at a regional level than they are globally, the three largest species (wolf – leopard -
cheeta) by 2-3 categories of threat. Populations of 12 species are considered to be declining, two are
increasing and trends in two are unknown. The main threat to all carnivores is indiscriminate and
sustained persecution through hunting, trapping and poisoning. Other threats include habitat
destruction and degradation through overgrazing, expansion of roads and settlements and
commercial and industrial development.
• The Conservation Status and Distribution of Reptiles of the Arabian Peninsula:
Reptile species richness is high, with 172 species currently recognized. Among these, 89 species
(52%) are endemic to the Arabian Peninsula. Overall, reptile species richness is highest around the
edge of the Peninsula, especially the south-western mountains and Dhofar, with the least diverse area
being the Rub’ al Khali (or Empty Quarter) and the areas of high endemism largely follow the same
pattern. The island of Socotra has an especially high number of endemic species (26). Encouragingly,
only six of the Arabian Peninsula’s 172 reptiles are considered to be globally threatened, and only
10 are of regional concern. Habitat loss remains the overriding threat to reptiles within the region,
particularly the conversion of land to agricultural use. Notably, 144 of the 172 species are represented
in protected areas. The dataset provides a valuable baseline to inform the conservation and
development planning process.

17
Total recorded species within West Asia according to
IUCN Database
IUCN Red List Categories within West Asia
according to IUCN Red List Database
Total No. of Threatened Species in West Asia
according to IUCN Red List
Threatened Species in West Asia according to IUCN
Red List
Source: IUCN Red List (Last accessed April 2015)
As indicated in the previous figures a lot of efforts done by IUCN Red List to provide such statistics
summary about the recorded numbers of each country in West Asia region. Yemen comes on the top
of the list that needs more conservation efforts in the future (Socotra Island is the major reason for
this). No systematic assessment to develop a national Red List for each country. The current national
assessments for threatened species are ad hoc ones. It is recommended to concentrate in the future to
develop a regional assessment for plants and birds in West Asia region to be reflected in 6th National
Report of CBD.
B. Measuring risks to conserve natural and human communities
By assessing twenty ecosystem case studies on six continents by May 2013, IUCN had developed
and tested a new environmental risk method to discover which ecosystems are tracking well and
which are in trouble. A joint effort led by the Commission for Ecosystem Management and the Global
Ecosystem Management Programme, the IUCN Red List of Ecosystems will identify an ecosystem
as vulnerable, endangered or critically endangered in a method that is applicable worldwide across
terrestrial, freshwater and marine ecosystems.
In order to reduce impacts of disasters and to be better prepared, a number of achievements have
been attained in the Arab region:
• Political commitment has increased. In 2012, Heads of Arab States adopted the Arab Strategy
for Disaster Risk Reduction 2020, under the auspices of the League of Arab States. The
Strategy had been adopted by the Council of Arab Ministers Responsible for the Environment
(CAMRE) and the Socio-Economic Council of the League of Arab States in 2011. This blue
print is currently being translated into a framework of action to facilitate regional and national
implementation. In early 2013, the Gulf Cooperation Council (GCC) committed itself to take
steps to develop a risk reduction road map. The Secretary-General of the Cooperation Council

18
for the Arab States of the Gulf has called for strong regional commitment towards development
of a disaster risk reduction strategy to strengthen the resilience of nations and individuals to
natural hazards.
• Awareness raised: UNISDR has continued to promote the “Making Cities Resilient” campaign
to support urban areas to become more resilient to disasters. Almost 300 cities and
municipalities in the Arab region have joined the campaign (20% of all cities worldwide). The
Mayors Handbook on “How to Make Cities More Resilient” was translated to Arabic and has
been disseminated widely in the region. UNISDR provided a self-monitoring tool to all
participating cities; the Local Government Self-Assessment Tool (LGSAT) assists local
governments to assess DRR progress, and aids them in addressing gaps and challenges.
• Databases to account for disaster losses have been established. A number of Arab countries
have started to report on their disaster losses. This will provide a practical basis for informed
risk analysis and the development of disaster risk reduction policies. The UNISDR supported
disaster inventories that enable countries to analyse disaster trends and their impacts in a
systematic manner through the collection of historical disaster data.
• Reporting: A number of national partners drafted national progress reports on the
implementation of the Hyogo Framework for Action (HFA). Bahrain, Jordan, Lebanon,
Palestine, Syria, and Yemen have provided progress reports in this regard.
C. Natural World Heritage sites
West Asia region is home to a wealth and diversity of natural heritage, with desert landscapes and
marine sites being particularly noteworthy. There are currently (UNESCO 2019) Twenty Eight
natural World Heritage sites and eleven mixed World Heritage sites in West Asia. At present, a total
of 39 natural and mixed sites appear on the Tentative Lists of 13 West Asia Parties. UNESCO, in its
report on the First Periodic Reporting Cycle3 for the Arab States 2000-2003, called for a better
representation of the wealth and diversity of cultural and particularly natural heritage of the Arab
region on the World Heritage List. Map (12): Tentative Natural World Heritage Sites within West Asia
This map developed by the expert & based on literatures

19
Map (13): Inscribed Natural World Heritage Sites within West Asia
This map developed by the expert & based on literatures
Map (14): Number of Tentative Marine World Heritage Sites within West Asia
This map developed by the expert & based on literatures
Map (15): Number of Tentative Mixed World Heritage Sites within West Asia

20
This map developed by the expert & based on literatures
Map (16): Number of UNESCO-MAP Biosphere Reserve within West Asia
This map developed by the expert & based on literatures

21
There have been marked improvements in the recognition and management of natural and mixed
heritage sites between the first and the second cycle of periodic reporting in the Arab States, but
significant challenges remain. The 2010 Report on the Second Cycle of Periodic Reporting (WHC-
10/34.COM/10A) states that the Arab States “…remain largely under-represented in terms of natural
properties and trans-boundary nominations thereby not adequately reflecting the diversity of heritage
in the Arab region on the World Heritage List… the need to focus more actively on presenting
nominations of natural sites in the Arab region was considered a priority.” Six State Parties had
finalized inventories of natural heritage at the national or sub-national level as a step to informing
Tentative List entries of such sites by 2010. These general statements on natural and mixed World
Heritage sites in Arab States from the second cycle of Periodic Reporting show that a more in-depth
analysis of the current status of their values, pressures and potential threats as well as protection and
management – on a site by site basis – could contribute significantly to an improved understanding
and, ultimately, management of these sites.
Currently, there are 35 natural and mixed sites included in the Tentative Lists of 12 Arab States. The
number of sites on the Tentative Lists has grown steadily over the last 15 years, the number of
inscribed sites has remained almost constant. It thus appears that the Tentative List process has not
been fully effective in supporting new nominations from the Arab States.
Map (17): Country’s natural criteria usage in the tentative WHS within West Asia
This map developed by the expert & based on literatures

22
Map (18): Country’s natural criteria usage in the tentative marine WHS within West Asia
This map developed by the expert & based on literatures
D. Planet of Protected Areas
Over the last months of 2013, IUCN hosted, elevated, clarified and accelerated goals of Biodiversity
and Protected Areas Management (BIOPAMA), an ambitious programme which aims to improve
the long-term conservation and sustainable use of natural resources in African, Caribbean and Pacific
(ACP) countries, in protected areas and surrounding communities. It is an initiative of the ACP Group
of States financed by the European Union’s 11th European Development Fund (EDF), jointly
implemented by the International Union for Conservation of Nature (IUCN) and the Joint Research
Centre of the European Commission (JRC).
BIOPAMA will enhance existing institutions and networks by making the best science and
knowledge available for building capacity to improve policies and better decision making on
biodiversity conservation and protected area management. Another important tool is Protected Planet
it is the most up to date and complete source of information on protected areas, updated monthly with
submissions from governments, non-governmental organizations, landowners and communities. It is
managed by the United Nations Environment World Conservation Monitoring Centre (UNEP-
WCMC) with support from IUCN and its World Commission on Protected Areas (WCPA). It is a
publicly available online platform where users can discover terrestrial and marine protected areas,
access related statistics and download data from the World Database on Protected Areas (WDPA).
The goals of Protected Planet are that:
• The Protected Planet Initiative informs decision-making and enhances action;
• The Protected Planet Initiative is the global platform for the communication, exchange,
acquisition and analysis of knowledge and data on the status and trends of protected
areas;
• The Protected Planet Initiative provides the world's policy-makers with the best
possible information on protected areas and their value for conserving biodiversity and
ecosystem services, and supporting human communities.
In 2018 and during COP14 14 countries joined global ‘Green List of Protected Areas’ 4 of which are
from west Asia. IUCN Green List of Protected and Conserved Areas is the first global standard of
best practice for area-based conservation. It is a programme of certification for protected and
conserved areas – national parks, natural World Heritage sites, community conserved areas, nature
reserves and so on – that are effectively managed and fairly governed. .

23
II. Effective and equitable governance of nature’s use
Governance of protected and conserved areas is now clearly understood as a main element in the
legal, policy, institutional and practical framework of conservation around the world. No longer a
novelty, the concept and its application remain however a challenge for most countries and agencies.
Fortunately, in line with the vision of the promise of Sydney, countries are committed to foster
governance diversity, equity and vitality for their systems of protected and conserved areas, and to
strengthen their relevant policies, practices and capacities. Technical tools such as the IUCN/WCPA
Best Practice Guidelines on Governance of Protected Areas and the Primer on Governance for
Protected and Conserved Areas are also available to offer guidance.
A. Important sites for biodiversity
The World Database of Key Biodiversity Areas hosts data on Key Biodiversity Areas (KBAs). This
database can support strategic decisions on protected areas by governments or civil society towards
achieving Aichi Biodiversity Targets. It also guides the identification of sites under international
conventions and in the setting of private sector policies and standards. The database is managed by
the KBA Partnership, which comprises 11 founding partners and is served by the KBA secretariat
hosted jointly by BirdLife International and IUCN. This work aims to provide the foundation for the
creation of a representative Protected Areas network for freshwater species.
B. Integration of the knowledge products
Over the period 2013 till 2018, IUCN began to integrate the six flagship knowledge products
mobilized through the Union, with a goal of making information both accessible and useful to guide
decision making. This will focus on supporting conservation and sustainability in four decision
contexts: international policy (for example, in tracking progress towards the Convention on
Biological Diversity’s Aichi Targets); investment standards and safeguards for the private sector and
financial institutions; conservation agencies; and land-and seascape planning. The integration of
knowledge products is well advanced in the second of these, through the Integrated Biodiversity
Assessment Tool, and with publication of: Biodiversity for Business: A guide to using knowledge
products delivered through IUCN, which have set an example for the others.
III. Deploying nature-based solutions to climate, food and development
A. Unlocking the Water, Energy, Food Nexus
In January 2013, IUCN and the International Water Association (IWA) launched a “Nexus Dialogue
on Water Infrastructure Solutions” to build partnerships and open the doors to innovation in water,
food and energy security. The silent, invisible but measurable interdependence of water, energy and
food has led to new demands for solutions that value water’s “natural infrastructure,” such as
wetlands, watersheds, aquifers, rivers and floodplains. The Nexus Dialogue sought transformations
in water infrastructure planning, financing and operation through a forum where water, energy and
food professionals in each sector could share experiences and ideas for how water infrastructure
portfolios and technologies can provide resources for the future. Innovative professionals in farming,
energy production, natural resource management and engineering have the expertise and practical
knowledge to address this challenge, but all too often cannot share their wisdom. Working across
sectors, the Nexus Dialogue will let all sectors share solutions as they emerge around the world.

24
ACTION PLAN FOR BIODIVERSITY, PROTECTED AREAS AND WORLD HERITAGE
PROGRAMME IN WESTASIA ACCORDING TO IUCN GLOBAL PROGRAMME
I. Programme Area 1: Valuing and Conserving Nature
Programme Area 1: Valuing and Conserving Nature.
Global result 1.1: Credible and trusted knowledge for valuing and conserving biodiversity leads to better policy and action on the ground.
Impact: The conservation status of species and ecosystems is improved.
Common impact indicators: The proportion of the most important areas for biodiversity effectively managed for the conservation of species, ecosystems and genetic diversity
Result indicators: (1) Extent, representativeness and connectivity of effectively managed protected areas; (2) Proportion of identified key biodiversity areas within and outside protected areas; (3)
Number of exports of data from the IUCN Red List; (4) Extent to which IUCN advice and positions are followed in CBD, CITES and WHC.
ROWA results Sub-results Delivery time Indicators Frequency Budget
($ 1000) CBD (Aichi targets) GEF Programs
Regional information
platform about the values
of biodiversity established
and awareness of the
people of the region is
double increased as steps to
conserve biodiversity and
use it sustainably.
Target groups in the region analyzed and
identified and their levels of
understanding biodiversity values
assessed.
By October
2020 • Trends in awareness
levels related to
biodiversity.
• Trends in
communication
programmes and
actions promoting
social corporate
responsibility toward
biodiversity.
Annually 50
All targets All BD programs
Key partners that will help
IUCN/ROWA to improve the
effectiveness of the awareness programs
involved.
By December
2020 Annually 40
Key messages and implementing tools
for each target group developed and
transmitted to them.
By December
2021 Annually 2
Annual regional awareness campaigns in
the region implemented effectively.
By December
2022 Annually 280
Rate of ecosystems
degradation and habitats
fragmentation in the
region, reduced by 50% at
Major habitats in the region assessed and
identified using GIS based mapping.
By December
2021 • Trends in proportion
of
Annually 350 Targets
6,7,8,11,12,13,14,15,16
BD Programs
1, 2, 9 Size of degraded and fragmented
habitats in the region identified their
By December
2021 annually 100

25
Programme Area 1: Valuing and Conserving Nature.
Global result 1.1: Credible and trusted knowledge for valuing and conserving biodiversity leads to better policy and action on the ground.
Impact: The conservation status of species and ecosystems is improved.
Common impact indicators: The proportion of the most important areas for biodiversity effectively managed for the conservation of species, ecosystems and genetic diversity
Result indicators: (1) Extent, representativeness and connectivity of effectively managed protected areas; (2) Proportion of identified key biodiversity areas within and outside protected areas; (3)
Number of exports of data from the IUCN Red List; (4) Extent to which IUCN advice and positions are followed in CBD, CITES and WHC.
ROWA results Sub-results Delivery time Indicators Frequency Budget
($ 1000) CBD (Aichi targets) GEF Programs
least to the current
situation.
rates of degradation reported and their
tipping points clearly stated.
degraded/threatened
habitats
• Trends in condition
and vulnerability of
ecosystems
• Trends in
fragmentation of
natural habitats
Institutional capacities to restore the
degraded habitats enhanced by 50% to
what exist now.
By December
2022 Annually 500
Financial, human and technical
resources to restore the degraded habitats
secured and effectively used.
By December
2022 Annually 30
Regional programme on
invasive alien species
(IAS) well established with
their pathways identified
and managed and their
priority species controlled.
All invasive alien species in the region
and their pathways identified and
prioritized at both national and regional
levels.
By April
2021
• Trends in number of
invasive alien
species
• Trends in the impact
of invasive alien
species on extinction
risk trends
• Trends in the
economic impacts of
selected invasive
alien species
Annually 25
Targets
5,6,7,9,10,11,12,13,14
, 15
BD Program 4
Regional measures and guidelines to
control and eradicate invasive alien
species and their pathways developed
and well implemented.
By December
2022 Annually 200
Pilot projects for at least 3 countries
(within the region) to control invasive
alien species successfully implemented
By December
2022 Annually 2500
Ecologically representative
and well-connected
regional system of
protected areas established
and integrated into the
wider landscape and
Country based gap analysis for the
national protected areas network
assessed and gaps in habitats
representativeness identified.
By June 2021 • Trends in extent of
marine protected
areas, coverage of
key biodiversity
areas.
Annually 100 Targets
1,2,5,6,7,8,10,12,14,15
BD Programs
1,2,7,9
Key Biodiversity Areas in the region
identified and well documented.
By December
2021 Annually 400

26
Programme Area 1: Valuing and Conserving Nature.
Global result 1.1: Credible and trusted knowledge for valuing and conserving biodiversity leads to better policy and action on the ground.
Impact: The conservation status of species and ecosystems is improved.
Common impact indicators: The proportion of the most important areas for biodiversity effectively managed for the conservation of species, ecosystems and genetic diversity
Result indicators: (1) Extent, representativeness and connectivity of effectively managed protected areas; (2) Proportion of identified key biodiversity areas within and outside protected areas; (3)
Number of exports of data from the IUCN Red List; (4) Extent to which IUCN advice and positions are followed in CBD, CITES and WHC.
ROWA results Sub-results Delivery time Indicators Frequency Budget
($ 1000) CBD (Aichi targets) GEF Programs
seascape according to the
CBD/PoWPA as well as
IUCN management
effectiveness standards and
guidelines.
Technical support to the proposed Arab
Union of Protected Areas secured with
close collaboration with Arab League.
By December
2022
• Trends in protected
area management
plans and/or
management
effectiveness.
• Trends in
representative
coverage of
protected areas.
Bi-annually 50
The management effectiveness of 70%
of the existing protected areas networks
in the region assessed and evaluated
according to the IUCN management
effectiveness standards and guidelines.
By December
2022 Bi-annually 600
Regionally specific approaches for
collaborative community-based
management of protected areas
demonstrated and documented in at least
5 countries of the region.
By December
2022 Bi-annually 120
The role of IUCN/ROWA
to support the UNESCO’s
world heritage convention
(WHC) recognized at
regional and global levels.
National Tentative Lists in the region
updated with specific attention to deeper
analysis of the potential Outstanding
Universal Value (OUV) of sites on the
Tentative Lists.
By June 2021
• Trends in extent of
WH sites coverage.
• Trends in WHS
management
effectiveness.
• Trends in WHS
inscribed.
Bi-annually
150
Targets
1,2,5,6,7,8,10,12,14,15
BD Programs
1,2,7,9
At least one natural WH site in the region
managed effectively and recognized
globally with strong involvement of
stakeholders in the management of the
WHS.
By December
2022 Bi-annually 200
Capacity of at least 5 WH site
management teams enhanced to
undertake Management Effectiveness
By December
2023 Bi-annually 150

27
Programme Area 1: Valuing and Conserving Nature.
Global result 1.1: Credible and trusted knowledge for valuing and conserving biodiversity leads to better policy and action on the ground.
Impact: The conservation status of species and ecosystems is improved.
Common impact indicators: The proportion of the most important areas for biodiversity effectively managed for the conservation of species, ecosystems and genetic diversity
Result indicators: (1) Extent, representativeness and connectivity of effectively managed protected areas; (2) Proportion of identified key biodiversity areas within and outside protected areas; (3)
Number of exports of data from the IUCN Red List; (4) Extent to which IUCN advice and positions are followed in CBD, CITES and WHC.
ROWA results Sub-results Delivery time Indicators Frequency Budget
($ 1000) CBD (Aichi targets) GEF Programs
Assessments and use them as a tool to
address threats to sites.
The conservation status of
the threatened species in
the region improved and
sustained according to the
IUCN Red List criteria and
guidelines.
Threatened species within at least 4
countries in the region assessed against
the IUCN criteria.
By December
2023
• Number of exports
of data from the
IUCN Red List
Bi-annually 600
Targets
5,11,12,13
BD Programs
1,2,3,4,5,9 Capacity to undertake Red Listing and
conservation action enhanced in relation
to the identified species.
By December
2022 Annually 200
II. Programme Area 2: Effective and equitable governance of nature’s use
Programme Area 2: Effective and equitable governance of nature’s use.
Global result 2.1: Improved governance arrangements over natural resources deliver rights-based and equitable conservation with tangible livelihoods benefits.
Impact: Effective, just, gender responsive and equitable conservation yields tangible livelihoods benefits.
Common impact indicators: Increased contribution from sustainably managed natural resources to household members.
Result indicators: (1) Enhancement of institutional and governance arrangements based on a new IUCN natural resource governance framework; (2) Extent of protected areas managed in accordance
with the IUCN’s natural resource governance framework; (3) 3. Area (in ha.) of agriculture, fisheries and forestry managed according to IUCN’s natural resource governance framework; (4) Extent of
high seas administered in accordance with the ecosystem approach and IUCN’s natural resource governance framework
ROWA results Sub-results Delivery time Indicators Frequency Budget
($ 1000) CBD (Aichi targets) GEF Programs
Valuation of ecosystems’
services well reported and
25% or these services
Ecosystems that are particularly
important for human wellbeing in the
region identified.
By December
2020 • Trends in benefits
that humans derive Annually 20
Targets
5,10,11,12,13,14 BD Programs 2,9

28
Programme Area 2: Effective and equitable governance of nature’s use.
Global result 2.1: Improved governance arrangements over natural resources deliver rights-based and equitable conservation with tangible livelihoods benefits.
Impact: Effective, just, gender responsive and equitable conservation yields tangible livelihoods benefits.
Common impact indicators: Increased contribution from sustainably managed natural resources to household members.
Result indicators: (1) Enhancement of institutional and governance arrangements based on a new IUCN natural resource governance framework; (2) Extent of protected areas managed in accordance
with the IUCN’s natural resource governance framework; (3) 3. Area (in ha.) of agriculture, fisheries and forestry managed according to IUCN’s natural resource governance framework; (4) Extent of
high seas administered in accordance with the ecosystem approach and IUCN’s natural resource governance framework
ROWA results Sub-results Delivery time Indicators Frequency Budget
($ 1000) CBD (Aichi targets) GEF Programs
(including services contribute
to health, livelihoods and
well-being) restored and
safeguarded.
Valuation of ecosystems’ services
within at least 3 countries in the region
assessed and reported.
By December
2023
from selected
ecosystem services Annually 550
Capacity to restore ecosystems’ services
enhanced in the region. By December
2022 Annually 200
Traditional knowledge,
innovations and practices of
indigenous and local
communities relevant for the
conservation and sustainable
use of biodiversity reported
and respected.
Indigenous, local or traditional
communities in the region identified. By June 2021
• Trends in degree to
which traditional
knowledge and
practices are
respected
Annually 30
Targets
7,13,14,15,16,18,19 All BD programs
Traditional knowledge of the targeted
communities and groups collected and
documented in a regional database. By December
2022 Annually 120

29
III. Programme Area 3: Deploying nature-based solutions to global challenges in climate, food and development
Programme Area 3: Deploying nature-based solutions to global challenges in climate, food and development.
Global result 2.1: Healthy and restored ecosystems make cost-effective contributions to meeting global challenges of climate change, food security and economic and social development.
Impact: Global challenges (climate, food, development) are addressed through the use of nature based solutions.
Common impact indicators: Trends in benefits that people derive from selected ecosystem services (e.g. gender-differentiated changes in security of water access and food security).
Result indicators: (1) Extent of incorporation of nature-based solutions in policies on climate change, food security and economic and social development at international, national and corporate levels; (2)
Extent (in ha.) of resilient and diverse landscapes sustainably managed, protected or restored for food, climate change or economic benefit; (3) Number of governments and public/private companies that
have incorporated biodiversity values into planning and/or accounting systems
ROWA results Sub-results Delivery time Indicators Frequency Budget
($ 1000) CBD (Aichi targets) GEF Programs
Sustainable management
practices of marine living
resources in the region
implemented effectively.
Harvested fish, invertebrates and
aquatic plants stocks in the region
assessed and reported.
By December
2021
• Trends in area,
frequency, and/or
intensity of
destructive fishing
practices.
• Trends in catch per
unit effort.
• Trends in extinction
risk of target and by
catch aquatic species
• Trends in fishing
effort capacity.
Annually 60
Targets
6,10,12,13 BD Program 2,6
Modern and traditional fishing
techniques in the region recorded.
By December
2016 Annually 150
Management plans for sustainable
management of fisheries in the region
developed and implemented.
By December
2022 Annually 350

30
REFERENCES Abdulla, A., Gomei, M., Maison, E. and Piante, C. (2008). Status of Marine Protected Areas in the Mediterranean
Sea. World Wildlife Fund and International Union for Conservation of Nature, Malaga
BLI (2008). Middle Eastern Important Bird Areas. Birdlife International.
http://www.birdlife.org/action/science/sites/mideast_ibas/index.html.
Boulos, L., Miller, A.G. and Mill, R.R. (1994). Regional overview: southwest Asia and the Middle East. In Centres
of Plant Diversity: A Guide and Strategy for their Conservation: Europe, Africa and the Middle East (ed. S.D.
Davis) volume 1. Blackwell Publishers Ltd, Michigan.
UNESCO (2016). UNESCO News: The Marshlands of Iraq Inscribed on UNESCO’s World Heritage List.
http://www.unesco.org/new/en/member-states/single-
view/news/the_marshlands_of_iraq_inscribed_on_unescos_world_heritag/
PROTECTED PLANET (2019). West Asia Data. https://www.protectedplanet.net/region/WA
Cuttelod, A., García, N., Abdul Malak, D., Temple, H. and Katariya, V. (2008). The Mediterranean: a biodiversity
hotspot under threat. In The 2008 Review of the IUCN Red List of Threatened Species (eds. J.C. Vié, C. Hilton-
Taylor and S.N. Stuart). IUCN, Gland, Switzerland
Evans, M.I. (1994). Important Bird Areas in the Middle East. Birdlife International, Cambridge
FAO (1997). Irrigation Potential in Africa: a Basin Approach, version 4. Food and Agriculture Organisation Land
and Water Bulletin. http://www.fao.org/docrep/W4347E/w4347e0h.htm.
GCEP (2000). Jordan Ecology, Ecosystems and Habitats. Jordan Country Study on Biological Diversity. United
Nations Environment Programme, Nairobi
Ghabbour, S. I. (1997). Identification of all natural heritages in Arab Countries. Department of Natural Resources,
Cairo University. whc.unesco.org/archive/97-gs-arab-nat.pdf.
GISD (n.d.). Global Invasive Species Database. http://www.issg.org/database.
ICARDA (2004). ICARDA News: Women Trained in Producing Dehydrated Fruits. Press release, 30 September
2004, International Center for Agricultural
Research in the Dry Areas. http://www.icarda.org/News/2004News/30Sep04.htm
IUCN (2000). Guidelines for the Prevention of Biodiversity Loss caused by Alien Invasive Species. International
Union for Conservation of Nature, Gland, Switzerland.
http://intranet.iucn.org/webfiles/doc/SSC/SSCwebsite/Policy_statements/IUCN_Guidelines_for_the_Prevention
_of_Biodiversity_Loss_caused_by_Alien_Invasive_ Species.pdf.
IUCN (2009). IUCN Red List of Threatened Species, version 2009. International Union for Conservation of
Nature. http://www.iucnredlist.org.
PERSGA (2003). Regional Status of Breeding Seabirds in the Red Sea and Gulf of Aden. The Regional
Organization for the Conservation of the Environment of the Red Sea and Gulf of Aden.
http://www.persga.org/Files// Common/Sea_Birds/Reginal_Status_of_Seabirds.pdf.
PERSGA (2004). Status of Mangroves in the Red Sea and Gulf of Aden, PERSGA technical series No. 11. The
Regional Organization for the Conservation of the Environment of the Red Sea and Gulf of Aden.
persga.org/Files/Publications/Technical/TS/TS11_Status_of_Mangroves_in_RSGA.pdf.
31
RAMSAR (2007). Ramsar sites information service. Wetlands International, Ramsar.
http://ramsar.wetlands.org/Database/Searchforsites/tabid/765/language/en-US/Default.aspx.
RAMSAR (2009). The Ramsar list of wetlands of international importance.
http://www.ramsar.org/pdf/sitelist.pdf.
SCBD (2004). Biodiversity Issues for Consideration in the Planning, Establishment and Management of Protected
Area Sites and Networks, technical series no. 15. Center on Biological Diversity, Montreal
SCBD (2010). Country profiles. Convention on Biological Diversity. http://www.cbd.int/countries/.
Sheppard, C., Price, A. and Roberts, C. (1992). Marine Ecology of the Arabian Region: Patterns and Processes in
Extreme Tropical Environments. Academic Press, London.
UNEP (2001). The Mesopotamian Marshlands: Demise of an Ecosystem, technical report, UNEP/DEWA/TR.01-
3 Rev. Division of Early Warning and Assessment, United Nations Environment Programme, Nairobi.
UNEP (2003). Environment in Iraq: UNEP Progress Report. United Nations Environment Programme, Geneva.
http://postconflict.unep.ch/publications/Iraq_PR.pdf
UNEP (2004). State of the marine environment report, 2003. In Global Assessment of the State of the Marine
Environment, 26-27 May 2003 Hague. United Nations Development Programme.
UNEP (2007). Global Environment Outlook 4. United Nations Environment Programme, Nairobi.
UNEP (2008). GEO Data Portal. United Nations Environment Programme. http://geodata.grid.unep.ch/
UNEP (2010). State of Biodiversity in West Asia- 2010. Regional Office for West Asia, United Nations
Environment Programme, Nairobi
UNEP-WCMC (2006). World database on protected areas. United Nations Environment Programme and World
Conservation Monitoring Centre. http://earthtrends.wri.org/text/biodiversity-protected/variable-171.html.
UNESCO (2010). World heritage list statistics. United Nations Educational, Scientific and Cultural Organization.
http://whc.unesco.org/en/list/stat.
UNESCO MAB (1987). Tassili N’Ajjer. Info MAB, 8. United Nations Educational, Scientific and Cultural
Organization Programme on Man and the Biosphere. United Nations Educational, Scientific and Cultural
Organization, Paris
Wood, L.J. (2007). MPA global: a database of the world’s marine protected areas. Sea around US Project, NEP-
WCMC & WWF. www.mpaglobal.org.
WRI (2002). World Resources 2002-2004: Decisions for the Earth: Balance, Voice, and Power. World Resources
Institute. http://pdf.wri.org/wr2002fulltxt_230-283_datatables.pdf.
WSSD (2002). Johannesburg Plan of Implementation. World Summit on Sustainable Development.
http://www.un.org/esa/sustdev/documents/WSSD_POI_PD/English/POIToc.htm
WWF (2001). Ecoregions. World Wildlife Fund. http://www.worldwildlife.org/wildworld/profiles/terrestrial_
pa.html.
Zohary, M. (1973). Geobotanical Foundations of the Middle East, volumes 1 and 2. Gustav Fisher Verlag,
Stuttgart.

32

33
Appendix I: Total endemic and threatened endemic species in West Asia (totals by taxonomic group)
Total endemic and threatened endemic species in West Asia (totals by taxonomic group) Species BHR IRN IRQ JOR KWT LBN OMN QAT Palestine SAU SYR UAE YEM Total Mammals Total endemics 0 8 0 0 0 0 0 0 0 0 1 0 3 12
Threatened endemics 0 0 0 0 0 0 0 0 0 0 0 0 1 1 Birds Total endemics 0 1 0 0 0 0 1 0 0 1 0 0 10 13
Threatened endemics 0 0 0 0 0 0 0 0 0 1 0 0 2 3 Amphibians Total endemics 0 4 0 0 0 0 0 0 0 0 0 0 1 5
Threatened endemics 0 2 0 0 0 0 0 0 0 0 0 0 1 2 Sturgeons Total endemics 0 0 0 0 0 0 0 0 0 0 0 0 0 0
Threatened endemics 0 0 0 0 0 0 0 0 0 0 0 0 0 0 FW Crabs Total endemics 0 3 0 0 0 0 0 0 0 0 0 0 3 6
Threatened endemics 0 0 0 0 0 0 0 0 0 0 0 0 0 0 Reef-forming Corals Total endemics 0 0 0 0 0 0 2 0 0 0 0 0 0 2
Threatened endemics 0 0 0 0 0 0 0 0 0 0 0 0 0 0 Seahorses & Pipefishes
Total endemics 0 0 0 1 0 0 1 0 0 0 0 0 0 2 Threatened endemics 0 0 0 0 0 0 0 0 0 0 0 0 0 0
Wrasses & Parrotfishes
Total endemics 0 0 0 0 0 0 4 0 0 0 0 0 0 4 Threatened endemics 0 0 0 0 0 0 0 0 0 0 0 0 0 0
Sharks and Rays Total endemics 0 0 0 0 0 0 1 0 0 0 0 0 5 6 Threatened endemics 0 0 0 0 0 0 0 0 0 0 0 0 2 2
Total 0 18 0 1 0 0 9 0 0 2 1 0 28
Source: IUCN Red List Database (Last Updated: 21 February 2018)

34
Appendix 2: Human Development Index trends in West Asia, 1980-2013
HDI
rank Country
Human Development Index (HDI) Average annual HDI growth (%)
2014 2015 2016 2017
Change
(2012 –
2017)
1990-2000 2000-2010 2010-2017
37 Qatar 0.853 0.854 0.855 0.856 -1 0.72 0.19 0.52
39 Saudi Arabia 0.852 0.854 0.854 0.853 0 0.64 0.84 0.78
43 Bahrain 0.810 0.832 0.846 0.846 7 0.60 0.06 0.87
48 Oman 0.815 0.822 0.822 0.821 0 .. 1.19 0.50
56 Kuwait 0.799 0.802 0.804 0.803 -3 0.99 0.07 0.20
40 United Arab Emirates 0.824 0.824 0.825 0.827 -5 1.25 0.95 0.28
60 Iran (Islamic Republic of) 0.788 0.789 0.796 0.798 -2 1.52 1.20 0.79
80 Lebanon 0.751 0.752 0.753 0.757 -4 .. .. -0.03
95 Jordan 0.730 0.733 0.735 0.735 -5 1.31 0.36 0.14
119 Palestine, State of 0.679 0.687 0.689 0.686 -12 .. .. 0.30
120 Iraq 0.666 0.668 0.672 0.685 0.685 0.60 0.67 0.77
178 Yemen 0.505 0.483 0.462 0.452 -20 1.03 1.18 -1.37
Arab States 0.690 0.694 0.697 0.699 — 0.95 0.96 0.51
World 0.718 0.722 0.726 0.728 — 0.72 0.84 0.60

35
Appendix 3: Status of West Asia countries regarding International Environmental Agreements and its Instruments Countries (years) BHR IRN IRQ JOR KWT LBN OMN QAT Palestine SAU SYR UAE YEM
CBD convention 1996 1996 2009 1994 2002 1995 1995 1996 No 2002 1996 2000 1996
Cartagena Protocol 2012 2004 2014 2004 2017 2013 2003 2007 No 2007 2004 2014 2006
Nagoya Protocol on Access and Benefit-sharing No No No 2015 2017 2012 No 2017 No 2013 2014 2014 No
Nagoya – Kuala Lumpur Protocol No No No No No No No No No No 2018 2018 No
Updated NBSAP 2016 2016 2016 2015 2019 2016 No 2016 No Yes No 2014 2017
Action Plan for Programme of Work on Protected
Areas (PoWPA) No Yes Yes Yes Yes Yes Yes Yes No No No Yes No
Climate Change Convention 1995 1996 2009 1993 1994 1994 1995 1996 No 1994 1996 1995 1996
Kyoto Protocol 2006 2005 2009 2005 2005 2007 2005 2005 No 2005 2006 2005 2005
Convention to Combat Desertification 1997 1997 2010 1997 1997 1996 1996 1999 No 1997 1997 1999 1997
UNESCO 1991 1975 1974 1975 2002 1983 1981 1984 2011 1978 1975 2001 1980
Ramsar Convention 1998 1975 2008 1977 No 1999 2013 No No No 1998 2007 2008
Convention on the Conservation of Migratory
Species of Wild Animals (CMS) RS 2008 2016 2001 RS RS RS RS RS 1991 2003 2016 2006
CMS Instrument (Marine Turtles) 2007 2001 RS 2004 RS No 2004 RS No 2005 No 2007 2008
CMS Instrument (Dugong) 2010 RS RS No RS No RS RS No 2013 No 2007 2010
CMS Instrument (Bird of Prey) RS 2015 RS RS RS 2014 RS RS No RS 2014 2008 2008
CMS Instrument (AWEA) RS RS RS 1999 RS 2002 RS RS No RS 2003 RS RS
CMS Instrument (Sharks) RS RS RS 2014 RS RS RS RS No RS 2014 2014 2014
Convention on International Trade in Endangered
Species of Wild Fauna and Flora (CITES) 2012 1976 2014 1979 2002 2013 2008 2001 No 1996 2003 1990 1997
CITES (Amendment to Article XI) 2012 1988 2014 1987 2002 2013 2008 2001 No 1996 2003 1990 1997
CITES (Amendment to Article XXI) No No 2014 No No No No No No No No No No
UN Convention on the Law of the Sea 1985 1998 1985 1995 1986 1995 2008 2002 2015 1996 No No 1987
Total no. of agreements and instruments signed
(out of 21) 12 13 9 16 8 14 11 9 2 13 14 16 16
RS = Range State
Source: Conventions’ websites (last accessed on March 2019)