Results 2016 and Outlook 2017 - Komax · 21 March 2017 / Results 2016 and Outlook 2017 / 7 THE WAY...
45
THE WAY TO MAKE IT Results 2016 and Outlook 2017 21 March 2017
Transcript of Results 2016 and Outlook 2017 - Komax · 21 March 2017 / Results 2016 and Outlook 2017 / 7 THE WAY...

THE WAY TO MAKE IT
Results 2016 and Outlook 201721 March 2017

21 March 2017 / Results 2016 and Outlook 2017 / 2
THE WAY TO MAKE IT
2016 in brief
Sale of Medtech business unit to GIMA
Four acquisitions• Thonauer Group• SLE Electronics USA• Ondal Tape Processing• Kabatec
Development of 2017–2021 strategy
Launch of various new products
Establishment of new site in Mexico
Restructuring in Porta Westfalica (exit from the module testing business)
Summary 2016 was an intensive year. We coped well with the various challenges and delivered a very pleasing result.
21 March 2017 / Results 2016 and Outlook 2017 / 3
THE WAY TO MAKE IT
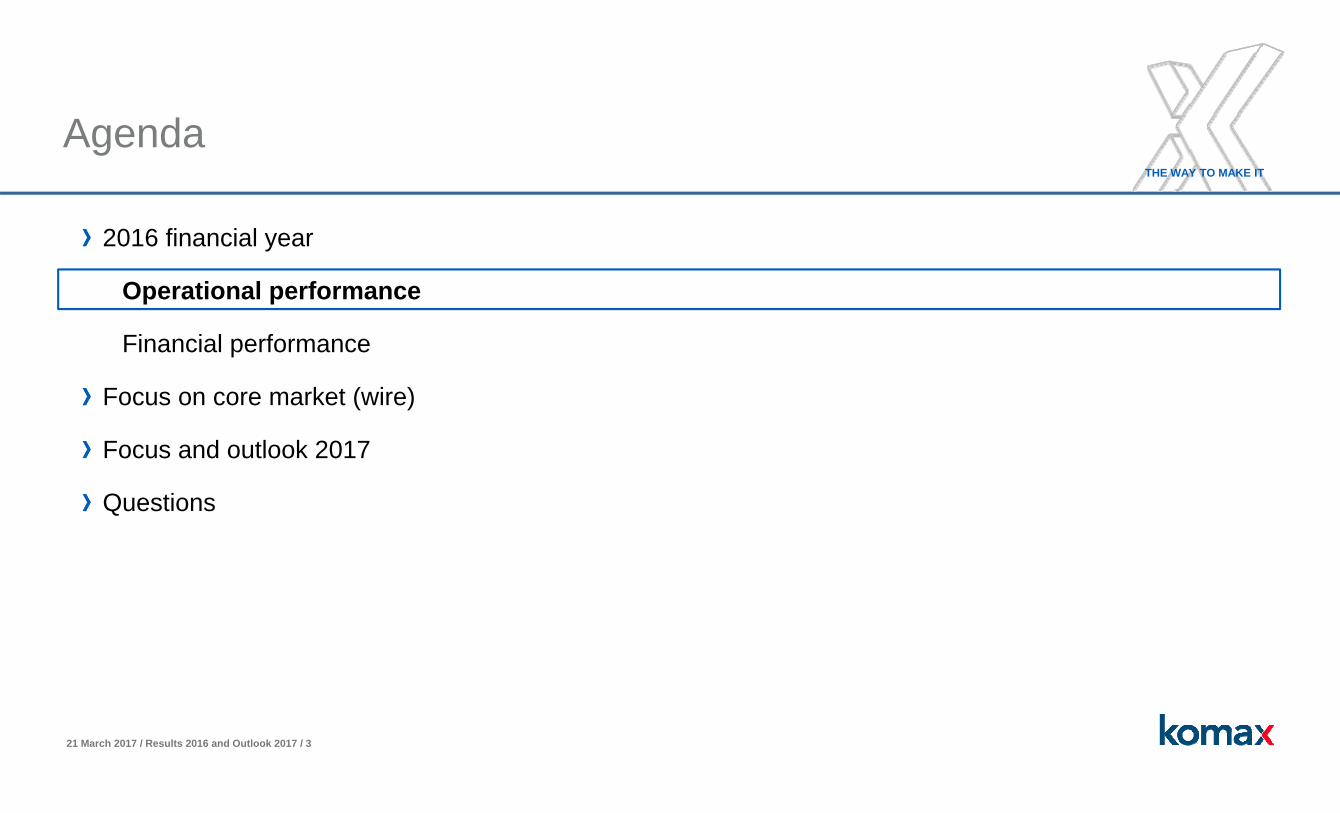
Agenda
2016 financial year
Operational performance
Financial performance
Focus on core market (wire)
Focus and outlook 2017
Questions

21 March 2017 / Results 2016 and Outlook 2017 / 5
THE WAY TO MAKE IT
Significant rise in revenues
315.1
373.0
2015 2016
in CHF millionRevenue growth 18.4%, internal growth 8.8%• Europe CHF 190.1 million (2015: CHF 156.5 million) • North/South America CHF 77.9 million (2015: CHF 64.3 million)• Asia CHF 73.5 million (2015: CHF 61.8 million)
1
1 As a result of the sale of Komax Medtech, the 2015 figures have been restated in accordance to IFRS 5.
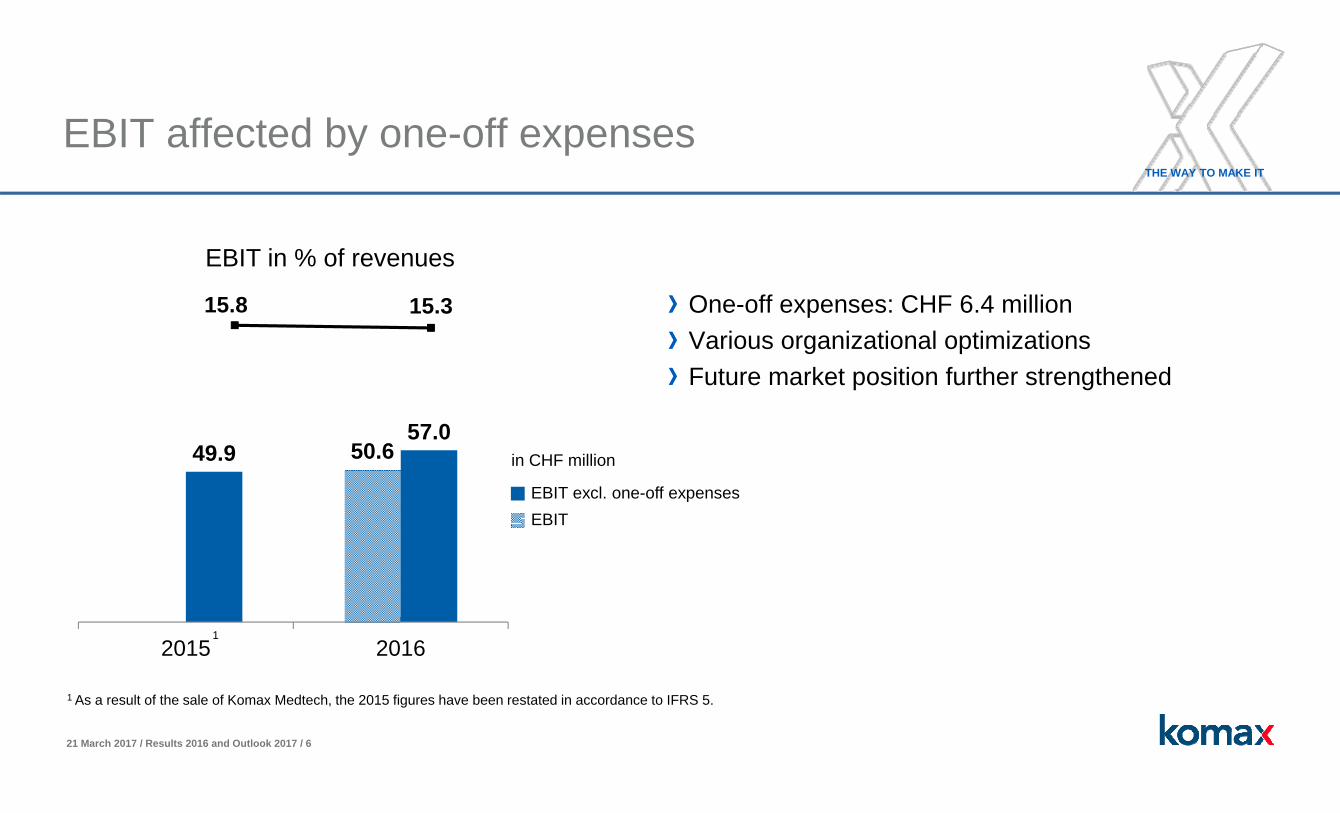
21 March 2017 / Results 2016 and Outlook 2017 / 6
THE WAY TO MAKE IT
15.8 15.3
50.649.957.0
2015 2016
EBIT affected by one-off expenses
EBIT excl. one-off expensesEBIT
in CHF million
One-off expenses: CHF 6.4 millionVarious organizational optimizationsFuture market position further strengthened
1
1 As a result of the sale of Komax Medtech, the 2015 figures have been restated in accordance to IFRS 5.
EBIT in % of revenues

21 March 2017 / Results 2016 and Outlook 2017 / 7
THE WAY TO MAKE IT
Komax Medtech: Key figures of the sale
28.3
1.74.1 2.0
Signing(March 2016)
NWC/ND Adj.(Closing
April 2016)
Earn-Out(2017)
KSM 24%(2018)
in CHF million
1
1 Komax Systems Malaysia
Strategic buyer: GIMA
Contingent consideration of CHF 6.1 million in total• Earn-out: CHF 4.1 million • Sale of residual stake (24%): CHF 2.0 million
Optimal timing for divestment of BU Medtechthanks to record-high order intake prior to the sale
75% of goodwill credited
Komax Medtech transaction value

21 March 2017 / Results 2016 and Outlook 2017 / 8
THE WAY TO MAKE IT
Agenda
2016 financial year
Operational performance
Financial performance
Focus on core market (wire)
Focus and outlook 2017
Questions

21 March 2017 / Results 2016 and Outlook 2017 / 9
THE WAY TO MAKE IT
Sales growth with broad-based regional spread
Net sales by region
Change from previous year
-10% 0% 10% 20% 30%
Revenues: CHF 373.0 million
Revenue growth: 18.4%
Internal growth: 8.8%
SwitzerlandEuropeAfricaNorth/South AmericaAsia
As a result of the sale of Komax Medtech, the 2015 figures have been restated in accordance to IFRS 5.
49%Europe
8%Africa
21%North/
South America
20%Asia 2%
Switzerland

21 March 2017 / Results 2016 and Outlook 2017 / 10
THE WAY TO MAKE IT
32.5
–19.7–5.7
-6.4
EBIT 2015 Material/revenues Personnel Operating expenses EBIT 2016 excl.one-off expenses
One-off expenses EBIT 2016
Positive EBIT development
in CHF million
49.9
Gross profit margin2016: 63.9% • Product mix• Volume effect
Gross profit margin2015: 65.4%
~ 57 50.6
Personnel expensesin % of revenues2016: 33.8%
Personnel expensesin % of revenues2015: 33.7%
• Higher volumes • Higher variable
costs• Influenced by
acquisitions
• Porta Westfalicarestructuring
• Mexico set-up• Turkey
21 March 2017 / Results 2016 and Outlook 2017 / 11
THE WAY TO MAKE IT
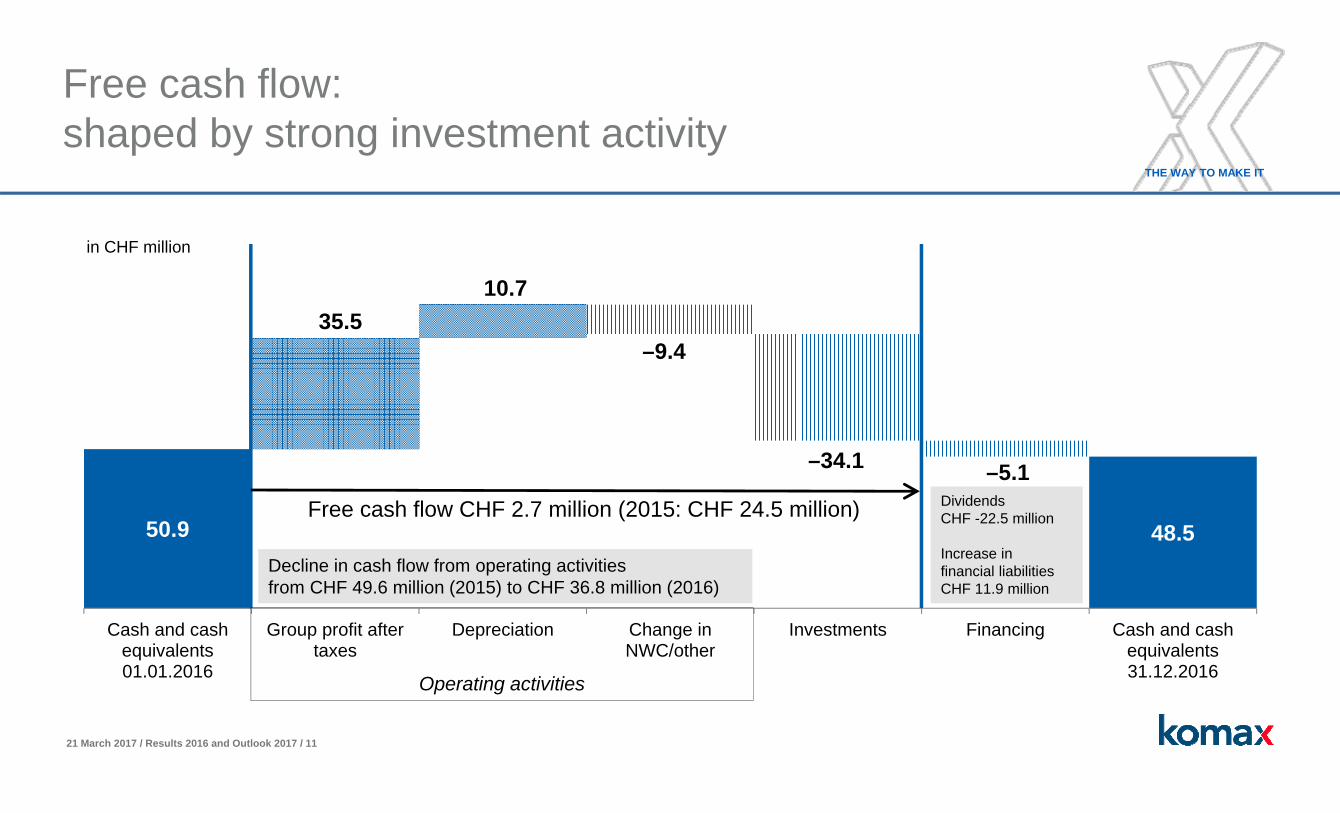
Free cash flow: shaped by strong investment activity
50.9 48.5
35.510.7
–9.4
–34.1 –5.1
Cash and cashequivalents01.01.2016
Group profit aftertaxes
Depreciation Change inNWC/other
Investments Financing Cash and cashequivalents31.12.2016
Free cash flow CHF 2.7 million (2015: CHF 24.5 million)
in CHF million
Operating activities
Decline in cash flow from operating activities from CHF 49.6 million (2015) to CHF 36.8 million (2016)
DividendsCHF -22.5 million
Increase in financial liabilitiesCHF 11.9 million

21 March 2017 / Results 2016 and Outlook 2017 / 12
THE WAY TO MAKE IT
High investment volume in 2016
Net investment (excl. acquisition and sale of companies)
45%Land, buildings
24%IT software,
hardware
31%Tangible assets
Net investment (excl. acquisition and sale of companies): CHF 21.4 million(2015: CHF 25.1 million)• Property, plant and equipment (CHF 17.1 million)• Intangible assets (CHF 4.7 million)
Investment volume over the next five years: CHF 16–20 million p.a. on average
Investment sum in 2016 for acquisitions:CHF 36.2 million (2015: CHF 0).
Cash outflow from divestment of Komax Medtech: CHF 23.6 million

21 March 2017 / Results 2016 and Outlook 2017 / 13
THE WAY TO MAKE IT
Positive currency effect
14%CHF
18%USD
45%EUR
11%Others
12%CNY
60
70
80
90
100
110
120
Dec
13
Feb
14
Apr
14
Jun
14
Aug
14
Oct
14
Dec
14
Feb
15
Apr
15
Jun
15
Aug
15
Oct
15
Dec
15
Feb
17
EUR (Basis: 1.21) USD (Basis: 1.00) BRL (Basis: .3763) CNY (Basis: .1610)
Change in currency breakdown due to acquisitions and divestments• Significant rise in other currencies
(from 5% to 11%)
Net sales by currency
Currency impact• Net sales +0.8%• Gross profit margin +0.6 percentage points• EBIT margin +0.2 percentage points

21 March 2017 / Results 2016 and Outlook 2017 / 14
THE WAY TO MAKE IT
–6.1
–2.2
2015 2016
29.235.5
2015 2016
17.6 18.3
Tax rate in % of EBT
Group profit after taxes (EAT) rises by 21.5%
in CHF million
Financial result
Absolute increase in EAT of CHF 6.3 million Improvement in financial result by CHF 3.9 million to CHF –2.2 million; prior year influenced by abandonment of minimum EUR/CHF exchange rate (2015: CHF –6.1 million)
Expected medium-term tax rate approx. 21%
1
1 As a result of the sale of Komax Medtech, the 2015 figures have been restated in accordance to IFRS 5.
EAT
in CHF million

21 March 2017 / Results 2016 and Outlook 2017 / 15
THE WAY TO MAKE IT
Financial base remains strong
71.072.6
Equity ratio in % of total assetsEquity ratio 72.6%
Net cash of CHF 17.4 million (31.12.2015: CHF 34.4 million)
Intangible assets CHF 69.9 million (31.12.2015: CHF 49.5 million), of which goodwillCHF 45.9 Mio. (31.12.2015: CHF 29.2 million)
Technology assets of CHF 9.7 million(31.12.2015: CHF 8.2 million)
399.0429.6
283.1311.9
31.12.2015 31.12.2016
Total assetsShareholders' equity
in CHF million
21 March 2017 / Results 2016 and Outlook 2017 / 16
THE WAY TO MAKE IT
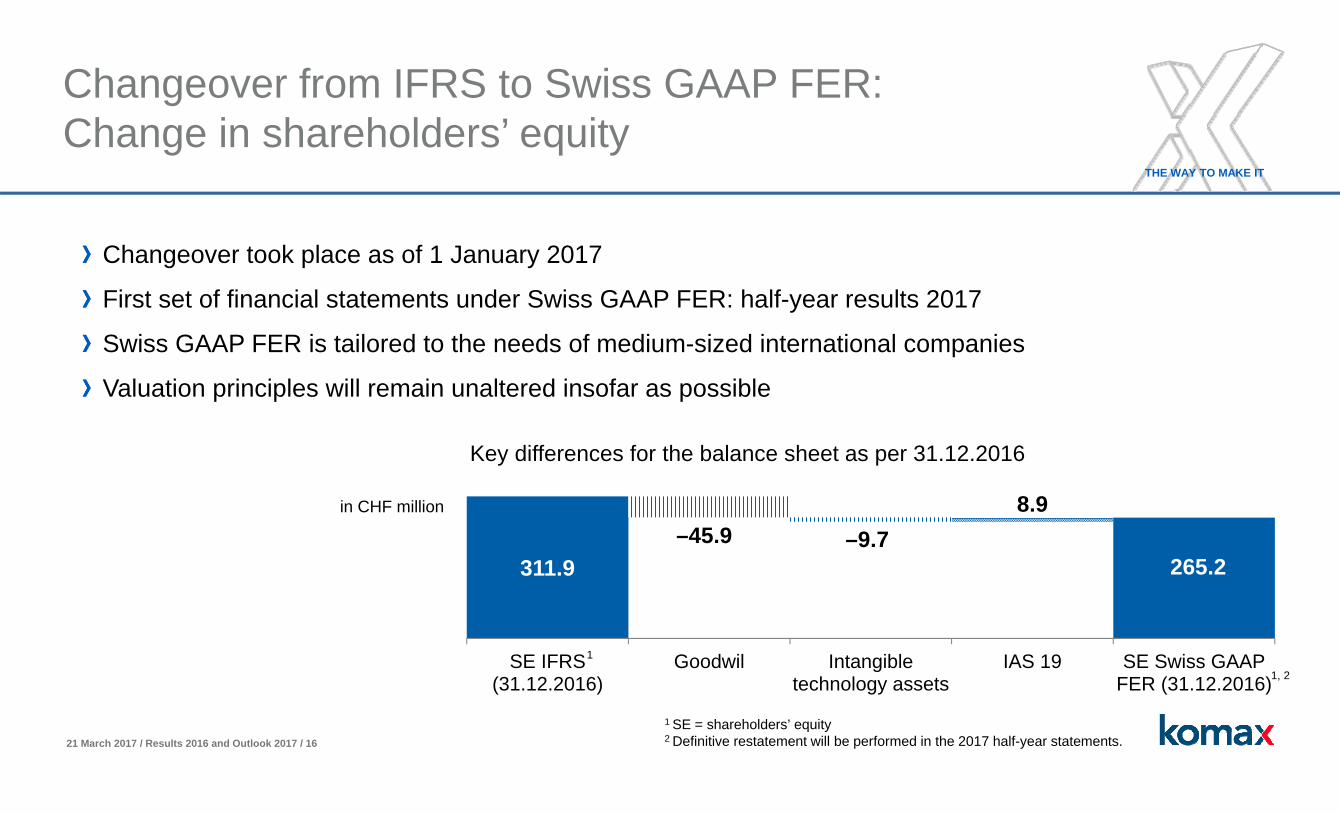
Changeover from IFRS to Swiss GAAP FER:Change in shareholders’ equity
Changeover took place as of 1 January 2017
First set of financial statements under Swiss GAAP FER: half-year results 2017
Swiss GAAP FER is tailored to the needs of medium-sized international companies
Valuation principles will remain unaltered insofar as possible
311.9–45.9 –9.7
8.9
SE IFRS(31.12.2016)
Goodwil Intangibletechnology assets
IAS 19 SE Swiss GAAPFER (31.12.2016)
in CHF million
265.2
Key differences for the balance sheet as per 31.12.2016
1, 2
1 SE = shareholders’ equity2 Definitive restatement will be performed in the 2017 half-year statements.
1

21 March 2017 / Results 2016 and Outlook 2017 / 17
THE WAY TO MAKE IT
120.0100.0
26.2
40.0
27.6
2015 2016
New syndicated loan
0.81 0.91
Average interest rate in %New syndicated loan of CHF 100 million with an option of an additional CHF 40 million
Duration: until January 2022
Average rate of interest on financial loans: 0.91% (2015: 0.81%) Credit line
thereof utilized
in CHF million
Credit option
without external basket
21 March 2017 / Results 2016 and Outlook 2017 / 18
THE WAY TO MAKE IT
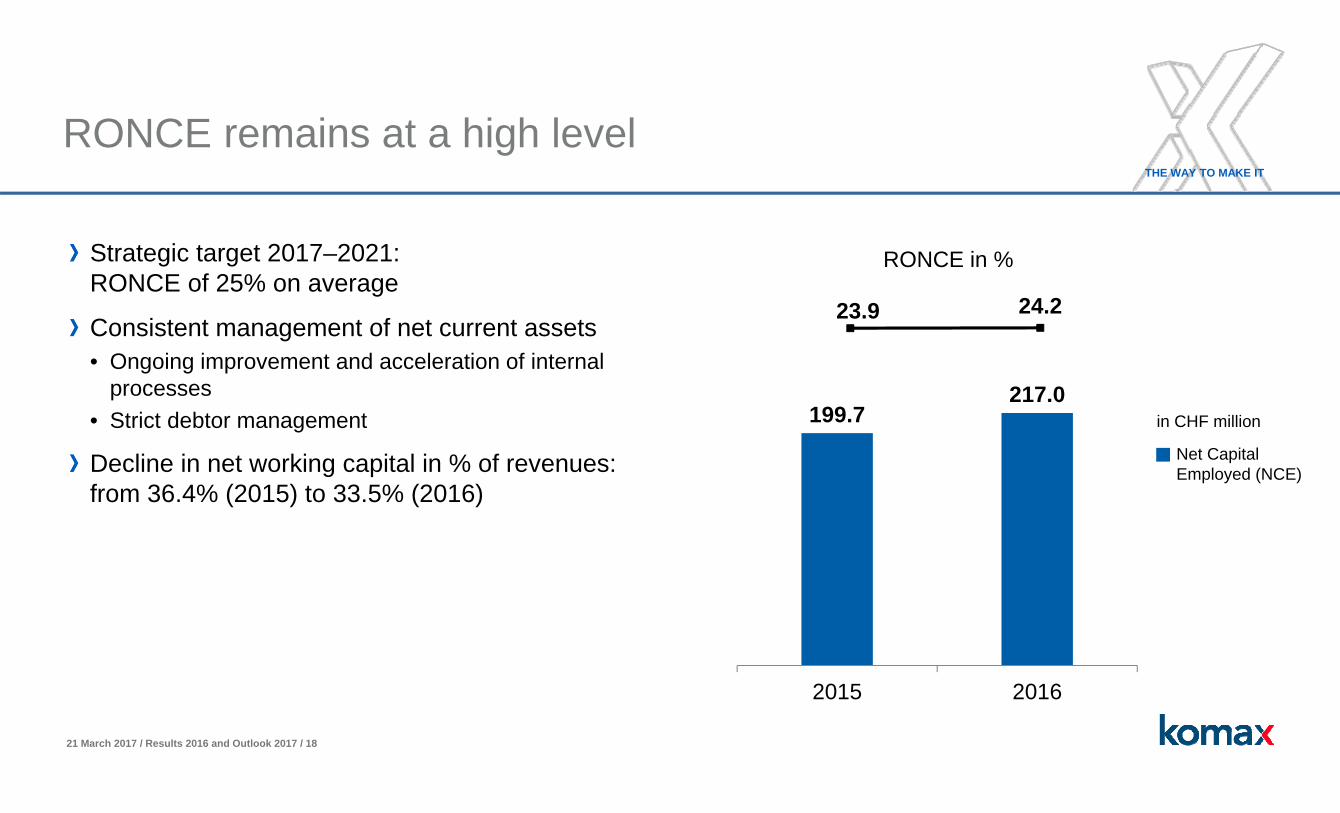
RONCE remains at a high level
Strategic target 2017–2021: RONCE of 25% on average
Consistent management of net current assets• Ongoing improvement and acceleration of internal
processes• Strict debtor management
Decline in net working capital in % of revenues: from 36.4% (2015) to 33.5% (2016)
RONCE in %
23.9 24.2
199.7217.0
2015 2016
Net Capital Employed (NCE)
in CHF million
21 March 2017 / Results 2016 and Outlook 2017 / 19
THE WAY TO MAKE IT
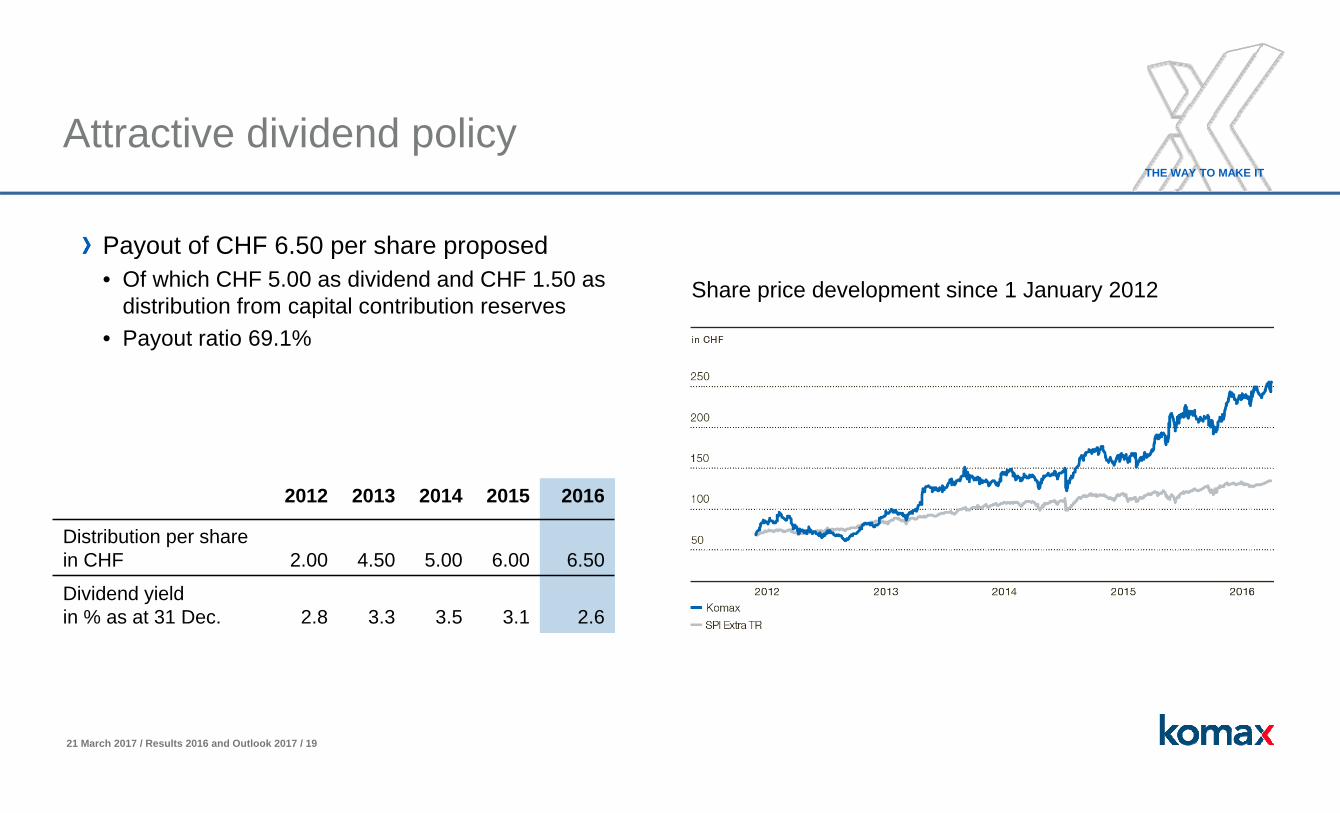
Attractive dividend policy
Payout of CHF 6.50 per share proposed• Of which CHF 5.00 as dividend and CHF 1.50 as
distribution from capital contribution reserves • Payout ratio 69.1%
Share price development since 1 January 2012
2012 2013 2014 2015 2016
Distribution per sharein CHF 2.00 4.50 5.00 6.00 6.50
Dividend yieldin % as at 31 Dec. 2.8 3.3 3.5 3.1 2.6

21 March 2017 / Results 2016 and Outlook 2017 / 20
THE WAY TO MAKE IT
Agenda
2016 financial year
Operational performance
Financial performance
Focus on core market (wire)
Focus and outlook 2017
Questions

21 March 2017 / Results 2016 and Outlook 2017 / 21
THE WAY TO MAKE IT
Impressive facts about vehicle wiring systems
Compact Full-size
Wires approx. 1300(approx. 25% twisted)
approx. 1800(approx. 30% twisted)
Crimp contacts approx. 2300 approx. 3200Plug housings approx. 250 approx. 300Wire length (total) approx. 2000 m approx. 4000 mWire length (maximum) approx. 7 m approx. 8 mWeight of wire harness approx. 30 kg approx. 38 kgCost of wire harness CHF 350 – 500 CHF 600 – 800
The wires have a cross-section of between 0.13 mm2 and 70 mm2 and are made of copper and aluminium.

21 March 2017 / Results 2016 and Outlook 2017 / 22
THE WAY TO MAKE IT
Megatrends
The benefits for Komax
SafetyFrom accident protection to accident avoidance thanks to additional sensors
Affordable vehiclesIncrease in cost efficiency through platform strategies and automation
Continuous growth number of vehicles produced and sold“Electrification” marked increase in amount of cabling per vehicleIncreasing complexity of vehicle power supply systems processing increasingly automatedGreater quality and efficiency demands can only be met by automated solutionsNew types of wire innovations offer opportunity for USPs
Environmental awareness / climate changeElectro-mobility: emission-free vehicles as objective
Integrated automobileComplex integrated information systems form the basis for autonomous driving; comprehensive infotainment systems

21 March 2017 / Results 2016 and Outlook 2017 / 23
THE WAY TO MAKE IT
Strong growth in wires requiring processing
Source: IHS 2015, Light Vehicle Production Forecast, Komax Market Research
2015 2016 2017 2018 2019 2020 2021
Rising number of vehicles producedCAGR 2015 – 2021: approx. 3%
In addition:2 – 3% CAGR over 5 years
Two additional factors are doubling the volume growth that comes from the increase in vehicle production:• Rise in number of wires in vehicles• Pressure for automation

21 March 2017 / Results 2016 and Outlook 2017 / 24
THE WAY TO MAKE IT
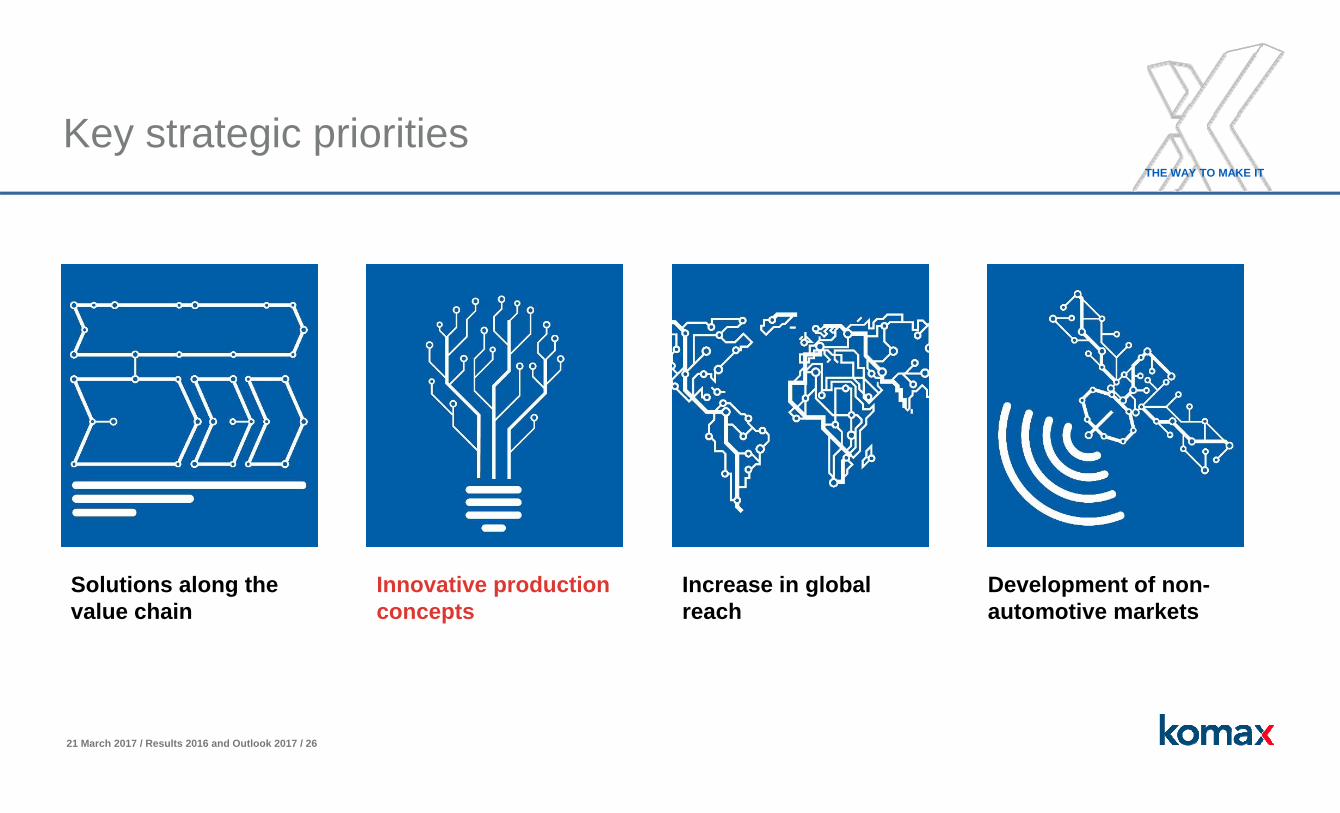
Key strategic priorities
Innovative production concepts
Solutions along the value chain
Increase in global reach
Development of non-automotive markets
21 March 2017 / Results 2016 and Outlook 2017 / 25
THE WAY TO MAKE IT
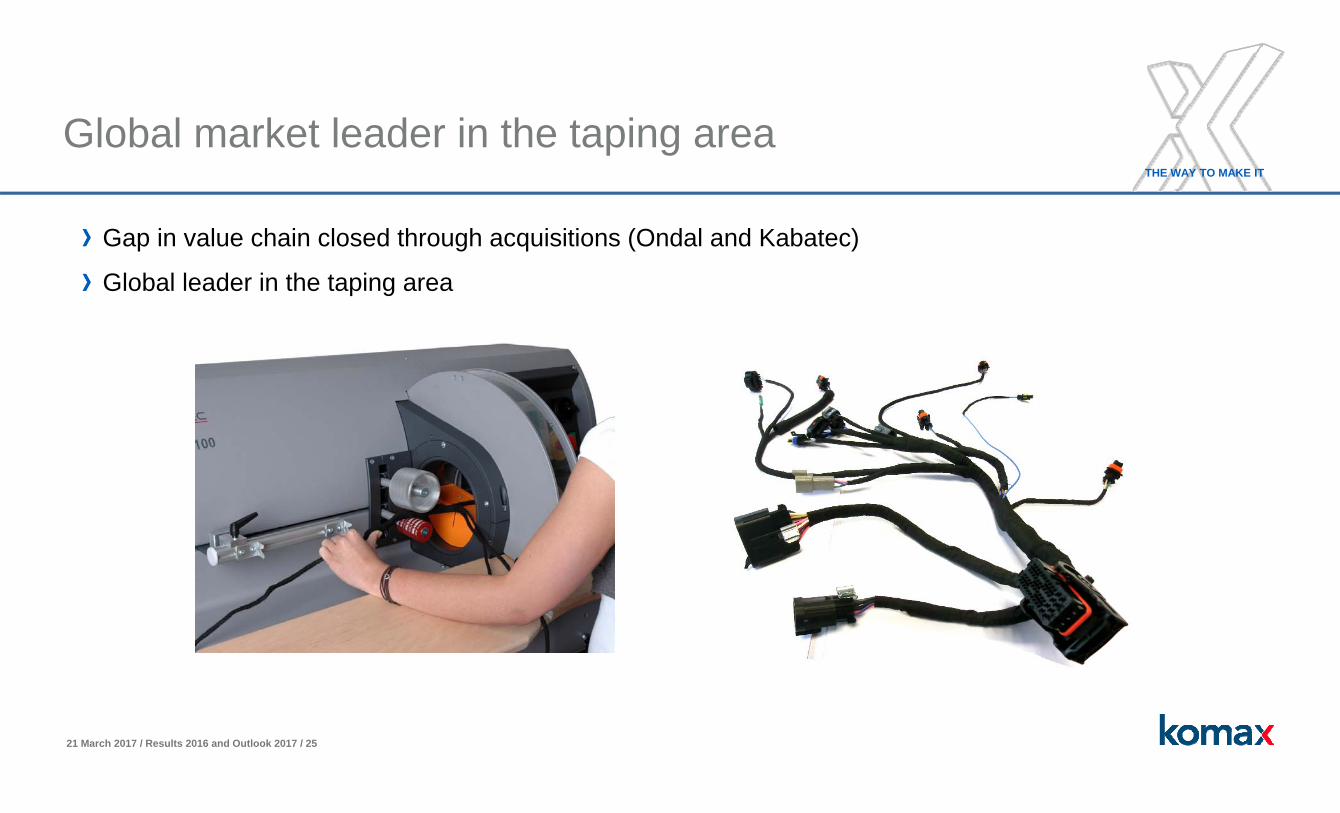
Global market leader in the taping area
Gap in value chain closed through acquisitions (Ondal and Kabatec)
Global leader in the taping area
21 March 2017 / Results 2016 and Outlook 2017 / 26
THE WAY TO MAKE IT
Key strategic priorities
Innovative production concepts
Solutions along the value chain
Increase in global reach
Development of non-automotive markets

21 March 2017 / Results 2016 and Outlook 2017 / 27
THE WAY TO MAKE IT
Special circuit solutions
Antennae Infotainment
Data transmission / sensors / airbags
E-mobility

21 March 2017 / Results 2016 and Outlook 2017 / 28
THE WAY TO MAKE IT
Key strategic priorities
Innovative production concepts
Solutions along the value chain
Increase in global reach
Development of non-automotive markets

21 March 2017 / Results 2016 and Outlook 2017 / 29
THE WAY TO MAKE IT
Global production: vehicles and harnesses
Vehicle production
Harnessproduction
21 March 2017 / Results 2016 and Outlook 2017 / 30
THE WAY TO MAKE IT
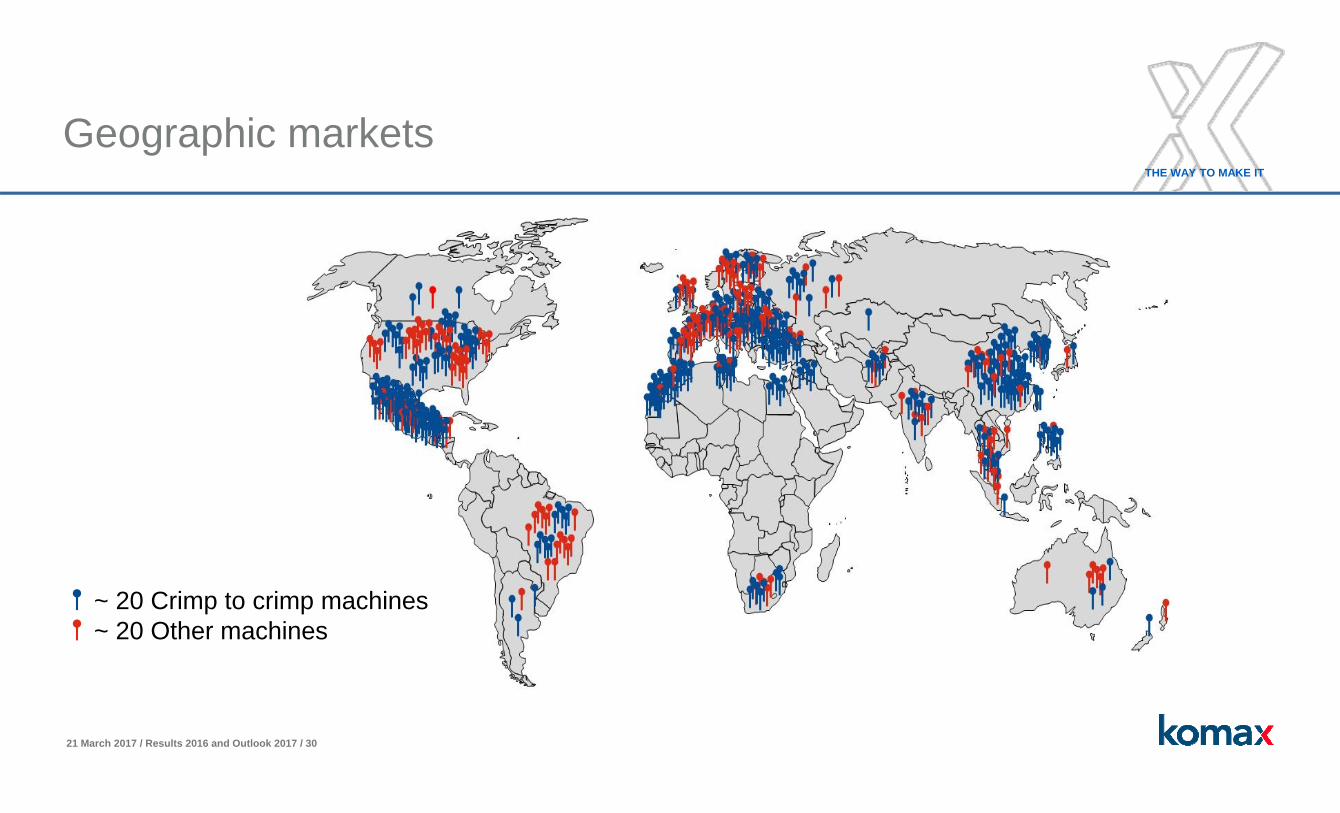
Geographic markets
~ 20 Crimp to crimp machines~ 20 Other machines
21 March 2017 / Results 2016 and Outlook 2017 / 31
THE WAY TO MAKE IT
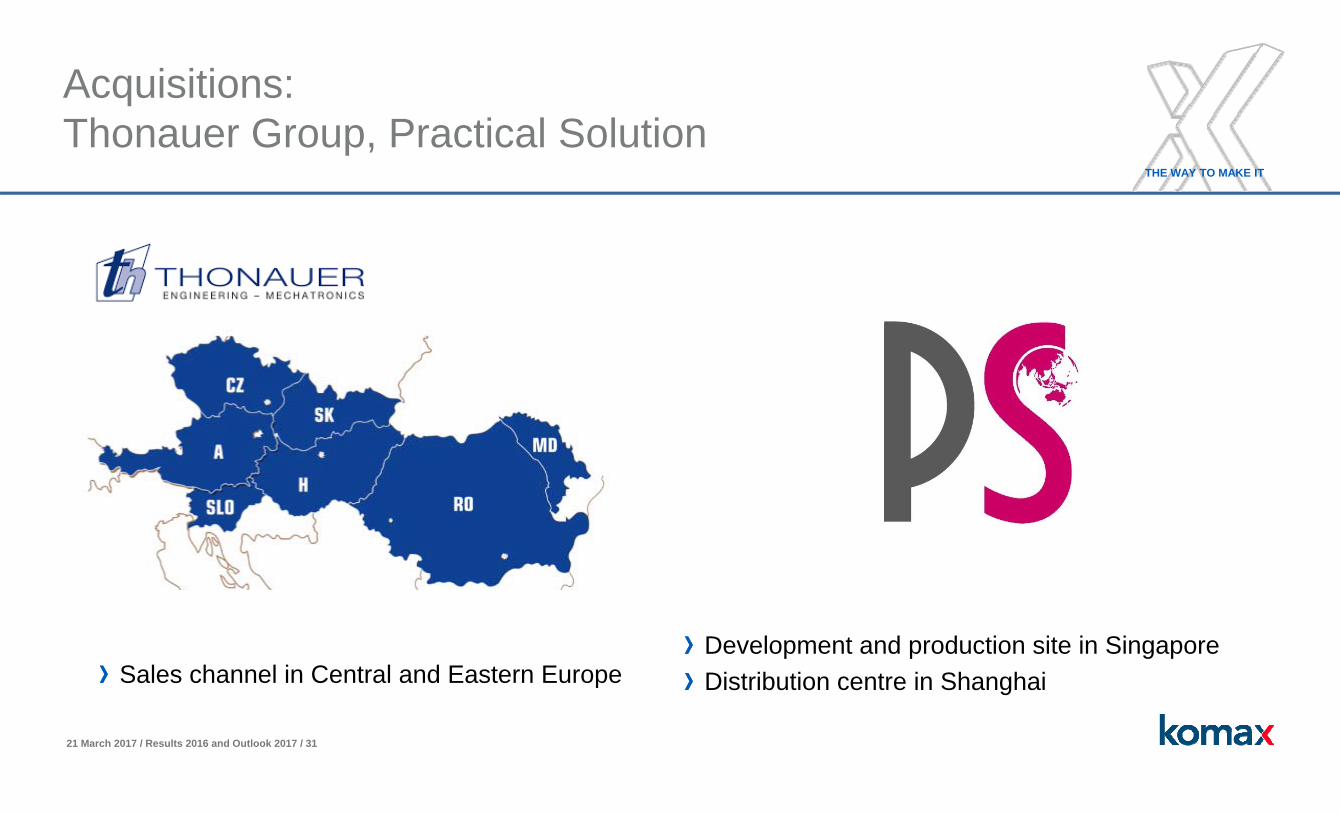
Acquisitions: Thonauer Group, Practical Solution
Development and production site in SingaporeDistribution centre in ShanghaiSales channel in Central and Eastern Europe

21 March 2017 / Results 2016 and Outlook 2017 / 32
THE WAY TO MAKE IT
Key strategic priorities
Innovative production concepts
Solutions along the value chain
Increase in global reach
Development of non-automotive markets

21 March 2017 / Results 2016 and Outlook 2017 / 33
THE WAY TO MAKE IT
Development of non-automotive markets
MultimediaConnected carsAutonomous driving
SafetyLightweight constructionReduction of emissions
Small batchesE-mobilityIntegrated production / industry 4.0
Aerospace Telecom/Datacom Industrial
Selective and complementary build-up of competencies in non-automotive areas supports success of core business
21 March 2017 / Results 2016 and Outlook 2017 / 35
THE WAY TO MAKE IT
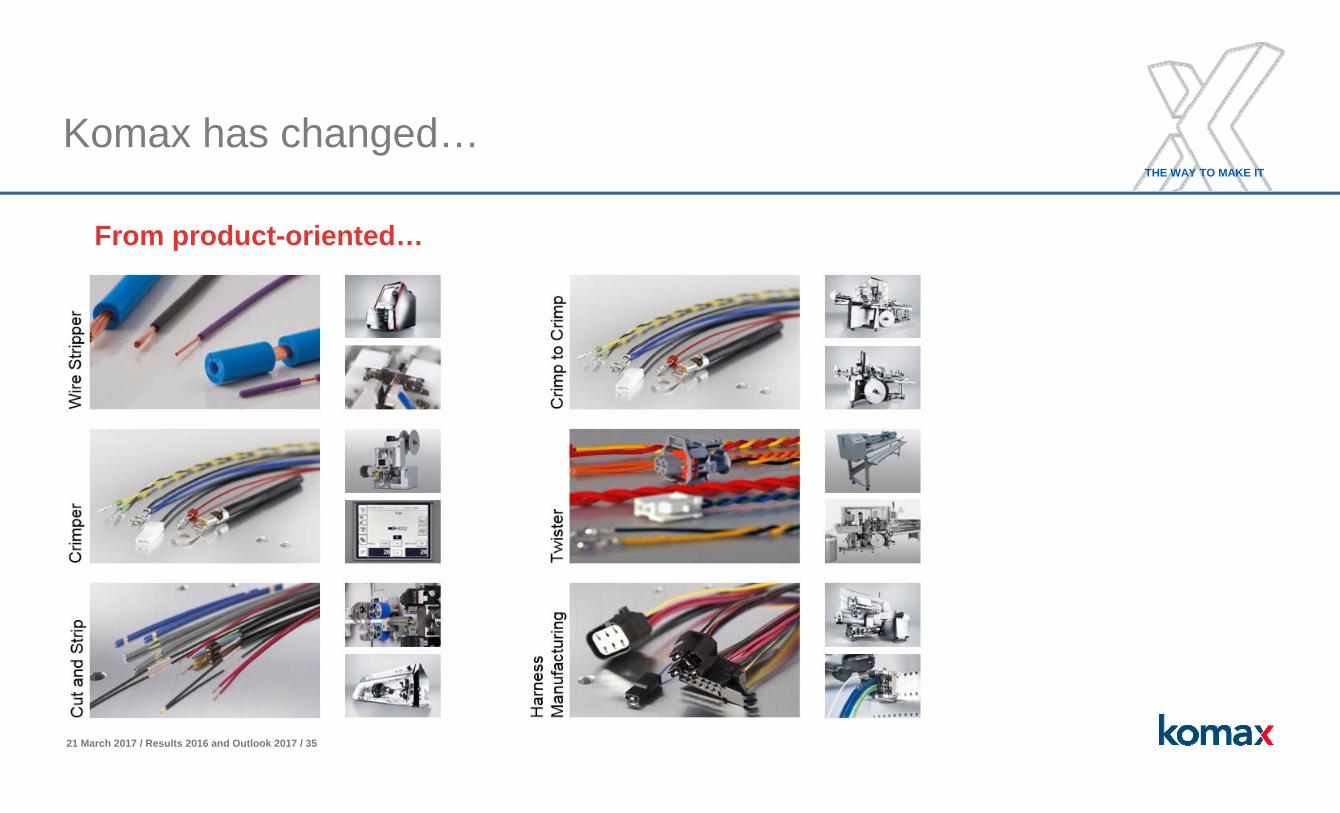
From product-oriented…
Komax has changed…
21 March 2017 / Results 2016 and Outlook 2017 / 36
THE WAY TO MAKE IT
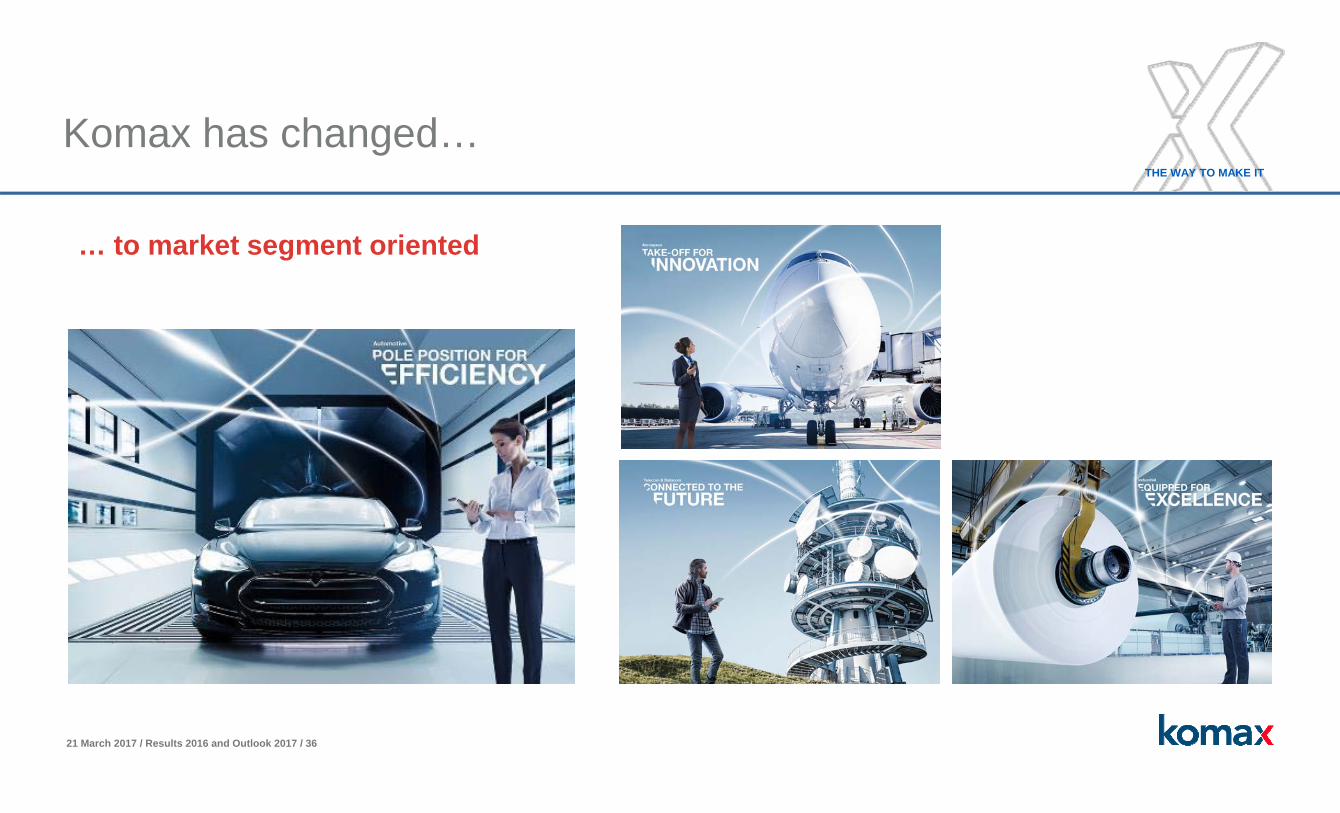
Komax has changed…
… to market segment oriented
21 March 2017 / Results 2016 and Outlook 2017 / 37
THE WAY TO MAKE IT
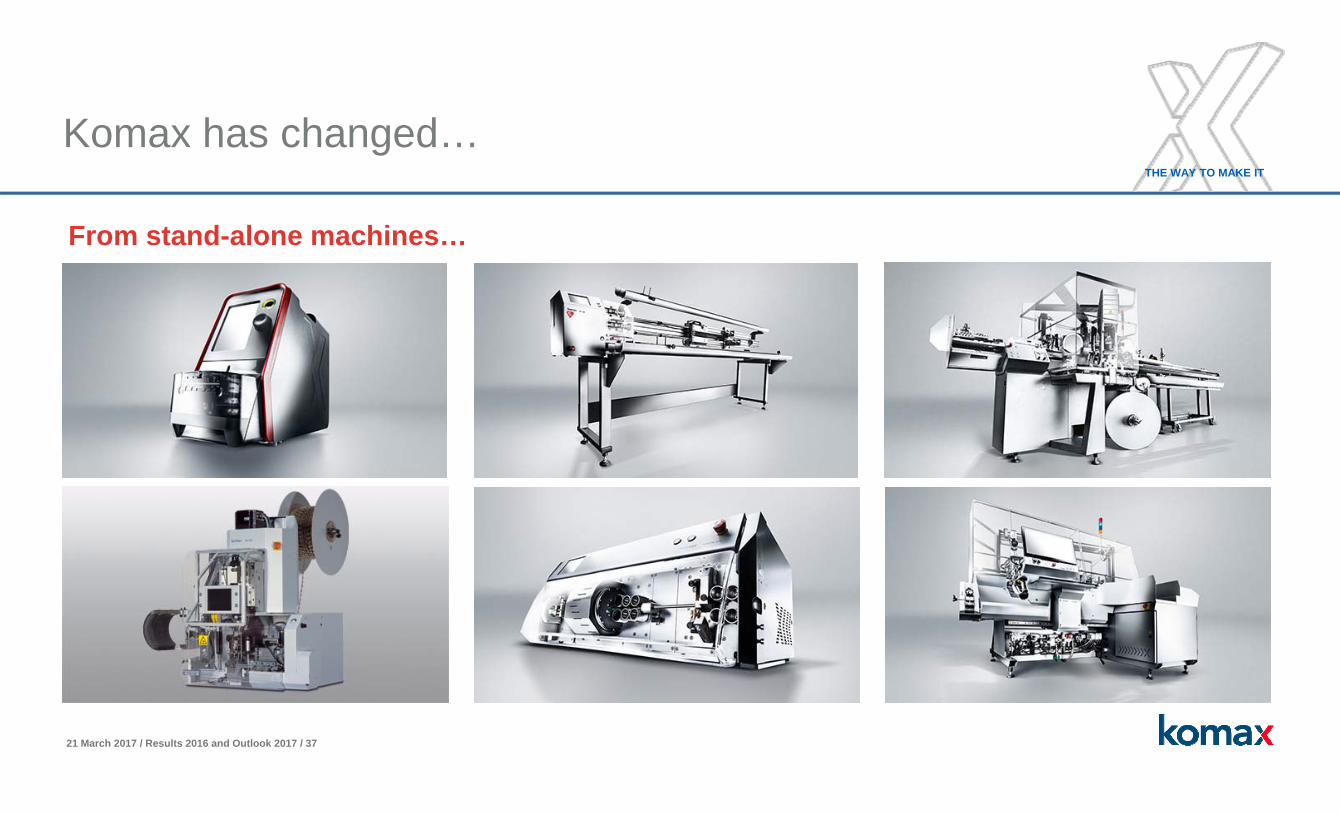
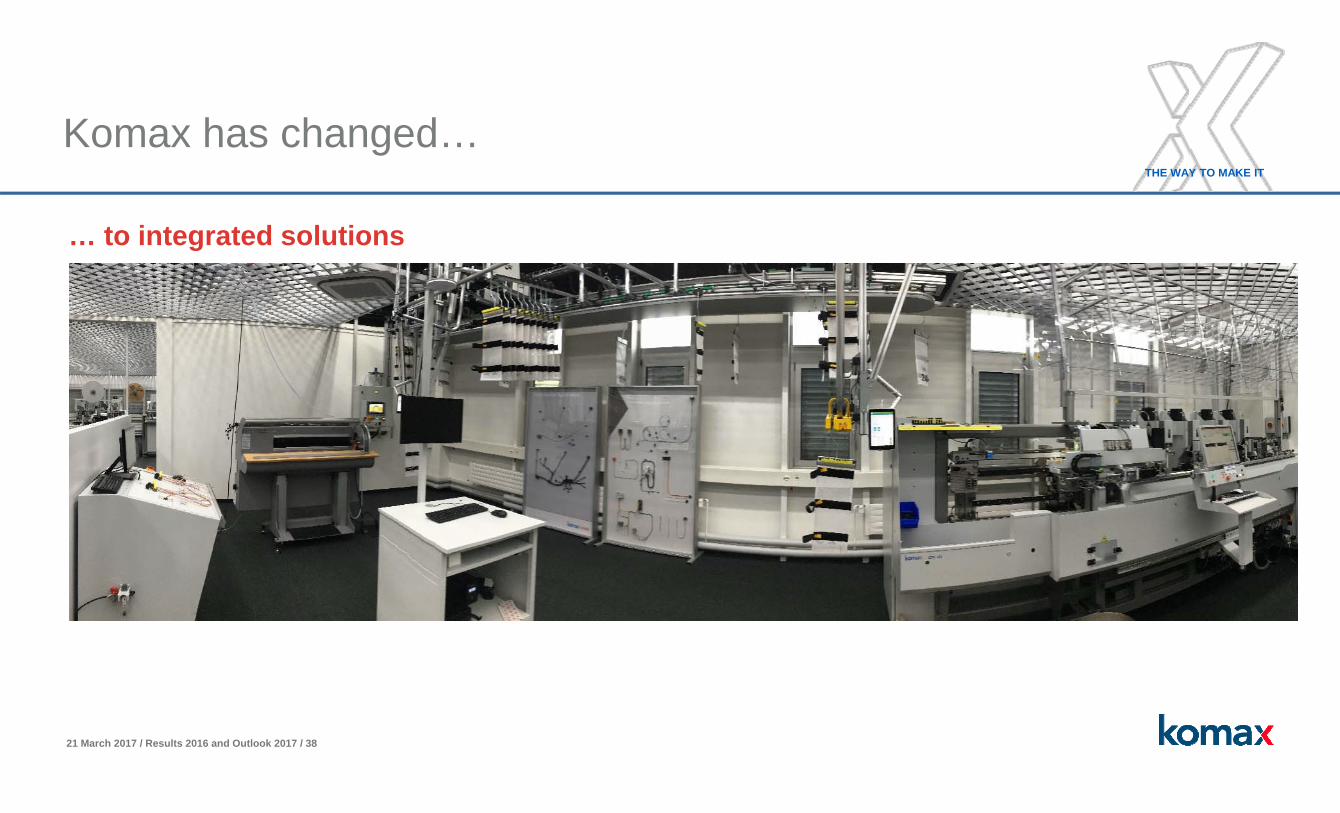
Komax has changed…
From stand-alone machines…
21 March 2017 / Results 2016 and Outlook 2017 / 38
THE WAY TO MAKE IT
Komax has changed…
… to integrated solutions

21 March 2017 / Results 2016 and Outlook 2017 / 39
THE WAY TO MAKE IT
Komax has changed…
From capital goods…

21 March 2017 / Results 2016 and Outlook 2017 / 40
THE WAY TO MAKE IT
Komax has changed…
… to services
21 March 2017 / Results 2016 and Outlook 2017 / 41
THE WAY TO MAKE IT
Agenda
2016 financial year
Operational performance
Financial performance
Focus on core market (wire)
Focus and outlook 2017
Questions
21 March 2017 / Results 2016 and Outlook 2017 / 42
THE WAY TO MAKE IT
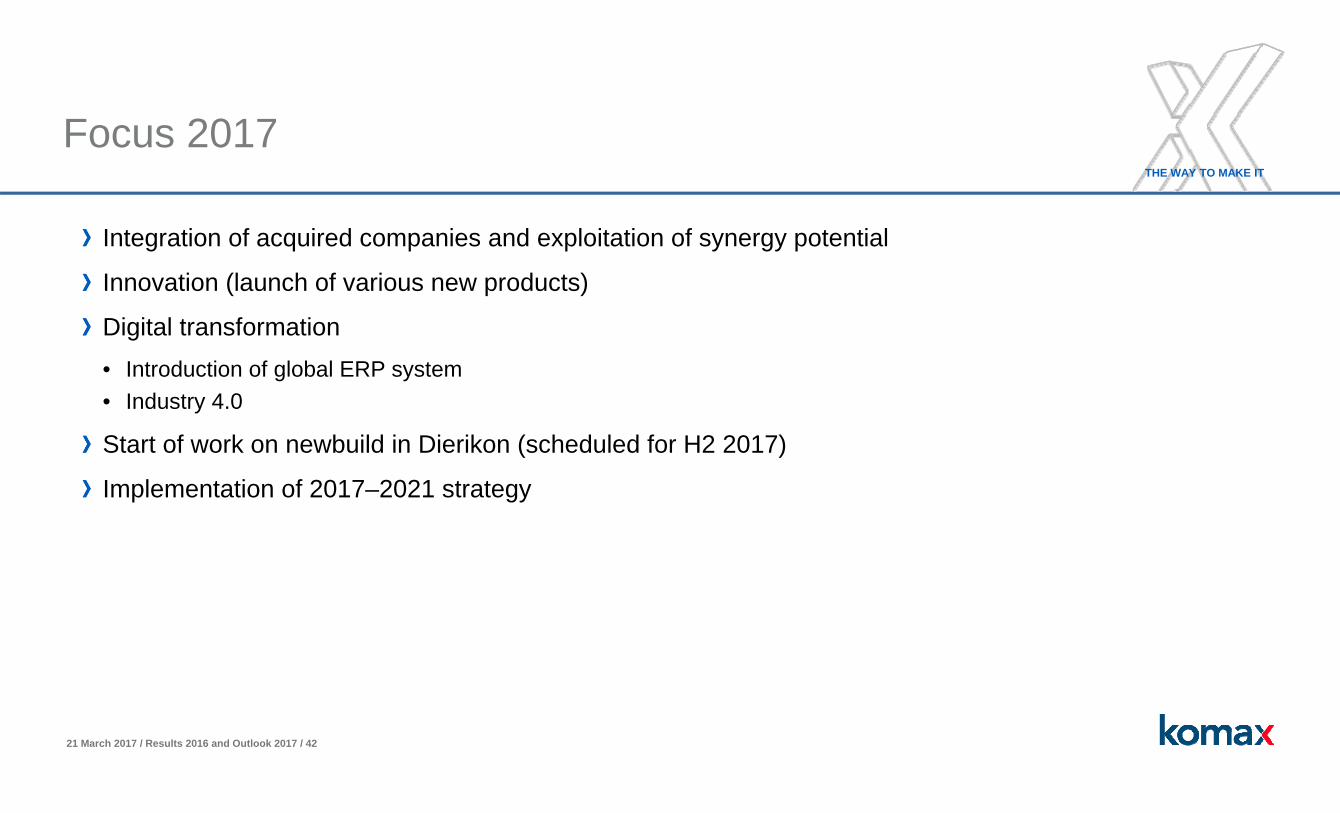
Focus 2017
Integration of acquired companies and exploitation of synergy potential
Innovation (launch of various new products)
Digital transformation • Introduction of global ERP system• Industry 4.0
Start of work on newbuild in Dierikon (scheduled for H2 2017)
Implementation of 2017–2021 strategy

21 March 2017 / Results 2016 and Outlook 2017 / 43
THE WAY TO MAKE IT
2017–2021:Ambitious targets, attractive dividend policy
CHF
500–600million
CHF
80–100million
Avg. 25% 50–60%of EAT
Revenues EBIT RONCE Payout
2021 2021 2017–2021 2017–2021
21 March 2017 / Results 2016 and Outlook 2017 / 44
THE WAY TO MAKE IT
Outlook Komax Group
The Komax Group is very well positioned, and is confident of achieving a result in the 2017 financial year that is in line with its strategic targets for 2017–2021.
After the first two months of 2017, we expect momentum in the automotive industry to remain strong, and anticipate that demand for automation solutions for wire processing will remain high. The above applies only if the political and global economic framework remains stable.

21 March 2017 / Results 2016 and Outlook 2017 / 45
THE WAY TO MAKE IT
Contact / Financial calendar
Financial calendarContact
Roger MüllerIndustriestrasse 66036 DierikonSwitzerlandPhone +41 41 455 06 [email protected]
www.komaxgroup.com
Annual General Meeting 12 May 2017Dividend payment 18 May 2017Half-year results 2017 24 August 2017First Information on the year 2017 23 January 2018Annual media andanalyst conference on the2017 financial results 20 March 2018Annual General Meeting 19 April 2018

21 March 2017 / Results 2016 and Outlook 2017 / 46
THE WAY TO MAKE IT
Disclaimer
This presentation contains forward-looking statements in relation to Komax which are based on current assumptions and expectations. Unforeseeable events and developments could cause actual results to differ materially from those anticipated. Examples include: changes in the economic and legal environment, the outcome of legal disputes, exchange rate fluctuations, unexpected market behaviour on the part of our competitors, negative publicity and the departure of members of management. The forward-looking statements are pure assumptions, made on the basis of information that is currently available.
THE WAY TO MAKE IT
Results 2016 and Outlook 201721 March 2017