Restructuring Debt and Equity - New York...
20
Ian H. Giddy/NYU Restructuring Debt & Equity-1 Prof. Ian Giddy New York University Restructuring Debt and Equity Copyright ©2004 Ian H. Giddy Corporate Financial Restructuring 2 Corporate Financial Restructuring Corporate restructuring – business and financial Structured financing techniques Distress-induced restructuring Mergers, divestitures and LBOs
Transcript of Restructuring Debt and Equity - New York...

Ian H. Giddy/NYU Restructuring Debt & Equity-1
Prof. Ian GiddyNew York University
RestructuringDebt and Equity
Copyright ©2004 Ian H. Giddy Corporate Financial Restructuring 2
Corporate Financial Restructuring
Corporate restructuring –business and financial Structured financing techniquesDistress-induced restructuringMergers, divestitures and LBOs
Ian H. Giddy/NYU Restructuring Debt & Equity-2
Copyright ©2004 Ian H. Giddy Corporate Financial Restructuring 3
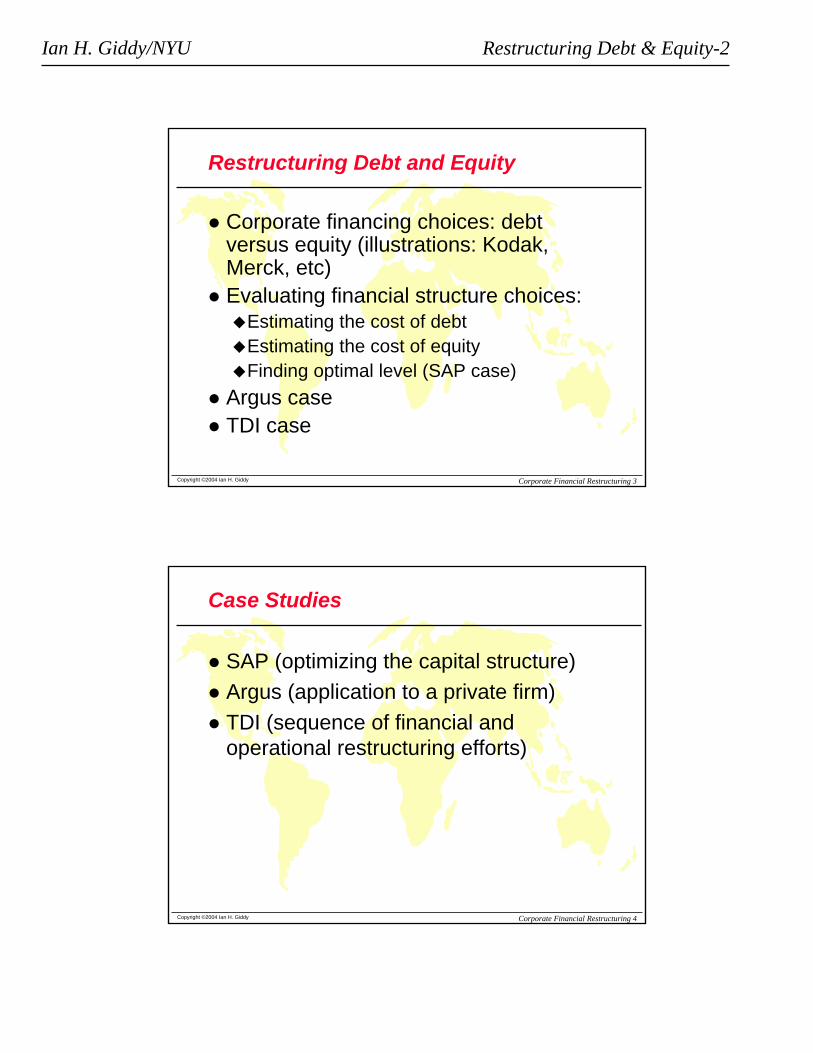
Restructuring Debt and Equity
Corporate financing choices: debt versus equity (illustrations: Kodak, Merck, etc)Evaluating financial structure choices:
Estimating the cost of debtEstimating the cost of equityFinding optimal level (SAP case)
Argus caseTDI case
Copyright ©2004 Ian H. Giddy Corporate Financial Restructuring 4
Case Studies
SAP (optimizing the capital structure)Argus (application to a private firm)TDI (sequence of financial and operational restructuring efforts)

Ian H. Giddy/NYU Restructuring Debt & Equity-3
Copyright ©2004 Ian H. Giddy Corporate Financial Restructuring 5
Restructuring Debt and Equity
Corporate financing choices: debt versus equity (illustrations: Kodak, Merck, Nokia, ABB, TDI)Evaluating financial structure choices
Estimating the cost capitalFinding the right capital structure
Copyright ©2004 Ian H. Giddy Corporate Financial Restructuring 6
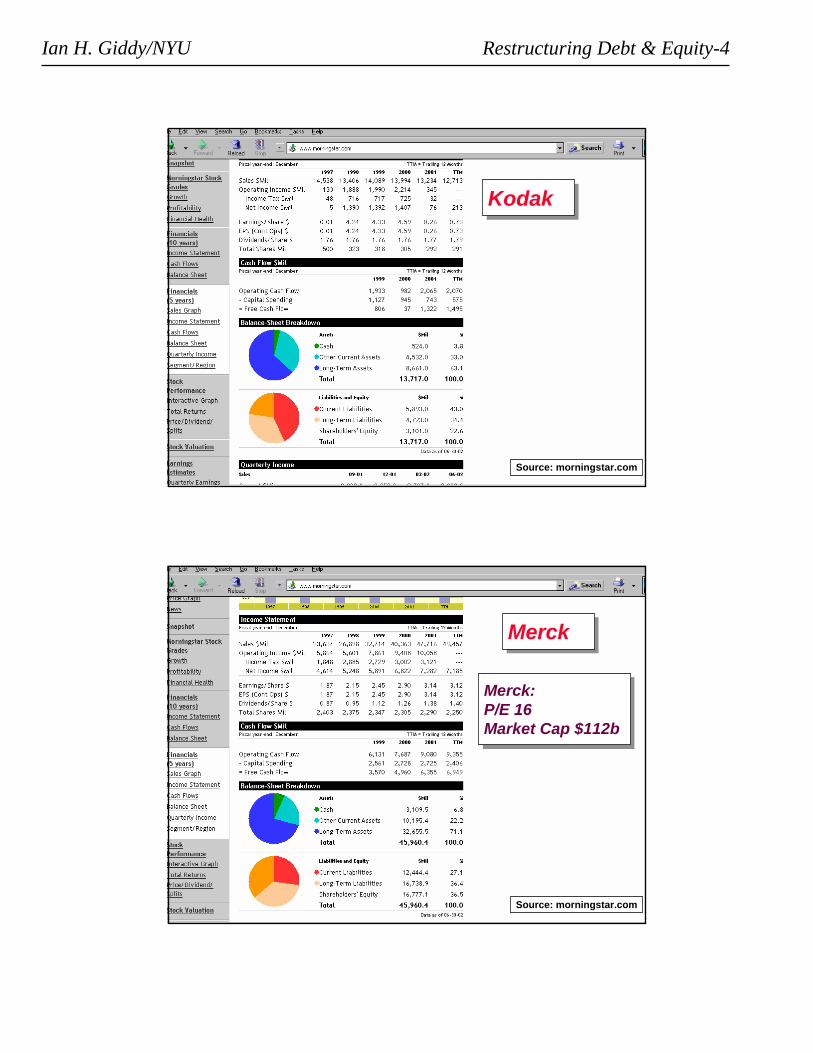
KodakKodak
Source: Bloomberg.com
Ian H. Giddy/NYU Restructuring Debt & Equity-4
Copyright ©2004 Ian H. Giddy Corporate Financial Restructuring 7
KodakKodak
Source: morningstar.com
Copyright ©2004 Ian H. Giddy Corporate Financial Restructuring 8
MerckMerck
Merck:P/E 16Market Cap $112b
Merck:P/E 16Market Cap $112b
Source: morningstar.com
Ian H. Giddy/NYU Restructuring Debt & Equity-5
Copyright ©2004 Ian H. Giddy Corporate Financial Restructuring 9
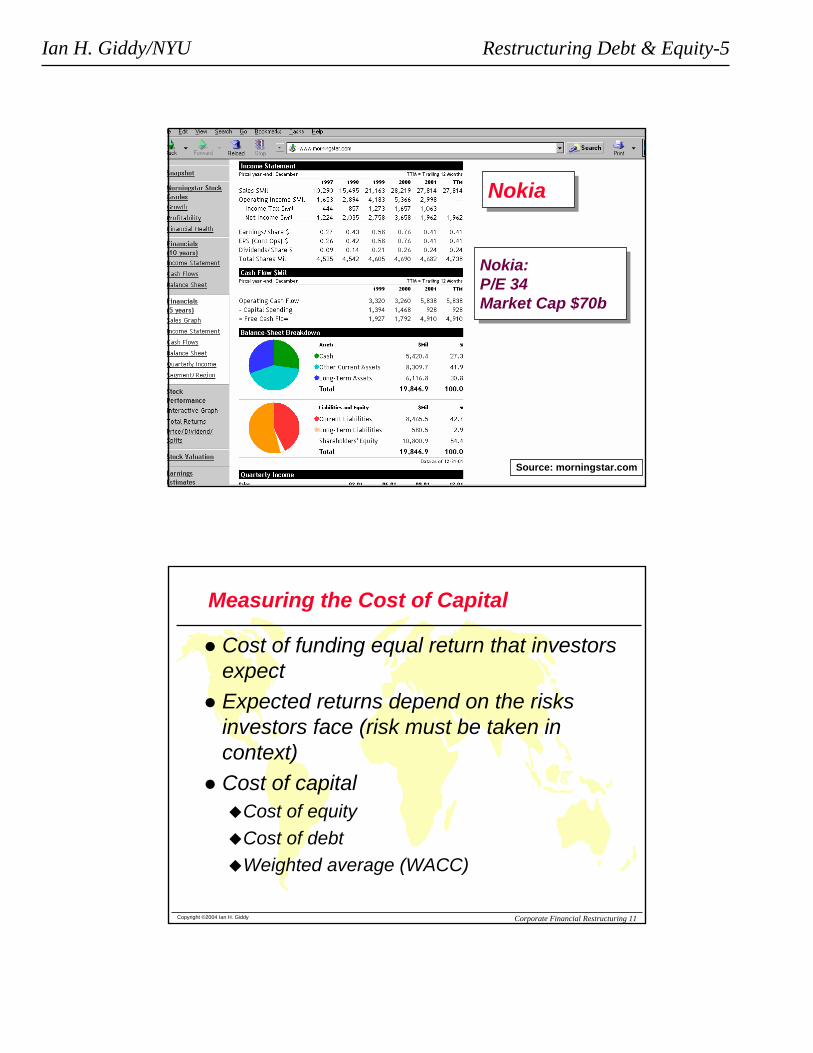
Nokia:P/E 34Market Cap $70b
Nokia:P/E 34Market Cap $70b
NokiaNokia
Source: morningstar.com
Copyright ©2004 Ian H. Giddy Corporate Financial Restructuring 11
Measuring the Cost of Capital
Cost of funding equal return that investors expectExpected returns depend on the risks investors face (risk must be taken in context) Cost of capital
Cost of equityCost of debtWeighted average (WACC)
Ian H. Giddy/NYU Restructuring Debt & Equity-6
Copyright ©2004 Ian H. Giddy Corporate Financial Restructuring 12
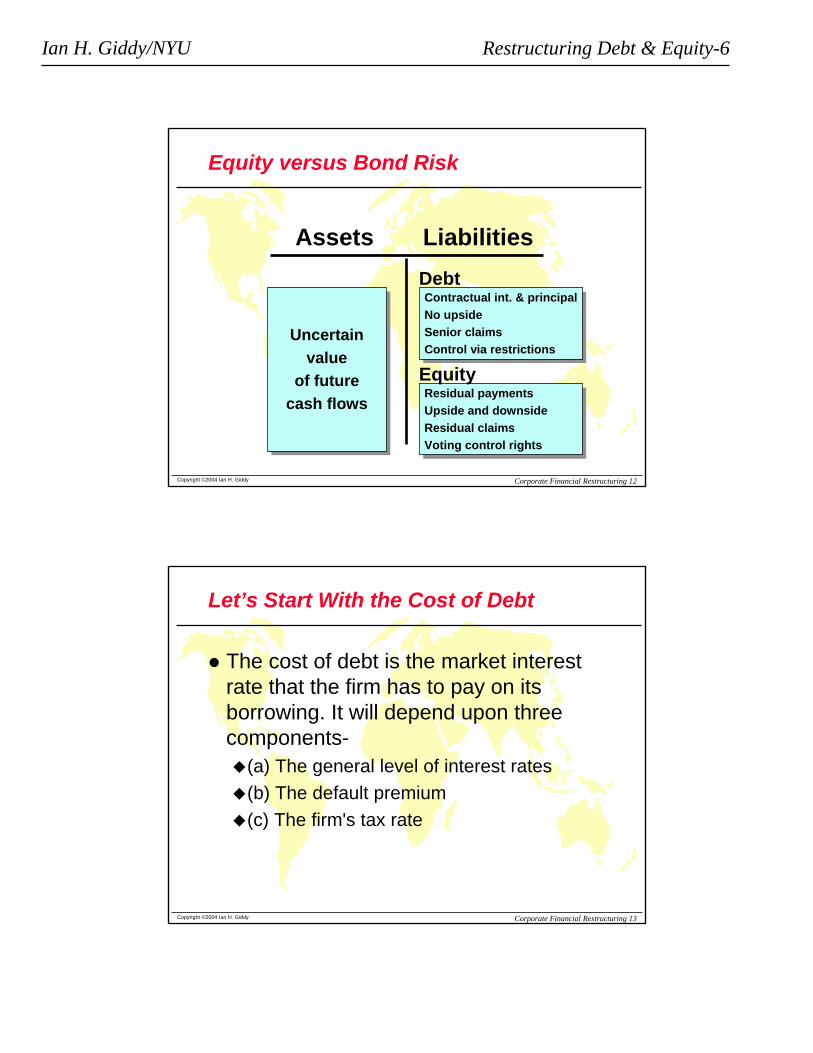
Equity versus Bond Risk
Uncertainvalue
of futurecash flows
Uncertainvalue
of futurecash flows
Contractual int. & principalNo upsideSenior claimsControl via restrictions
Contractual int. & principalNo upsideSenior claimsControl via restrictions
Assets LiabilitiesDebt
Residual paymentsUpside and downsideResidual claimsVoting control rights
Residual paymentsUpside and downsideResidual claimsVoting control rights
Equity
Copyright ©2004 Ian H. Giddy Corporate Financial Restructuring 13
Let’s Start With the Cost of Debt
The cost of debt is the market interest rate that the firm has to pay on its borrowing. It will depend upon three components-
(a) The general level of interest rates(b) The default premium(c) The firm's tax rate
Ian H. Giddy/NYU Restructuring Debt & Equity-7
Copyright ©2004 Ian H. Giddy Corporate Financial Restructuring 14
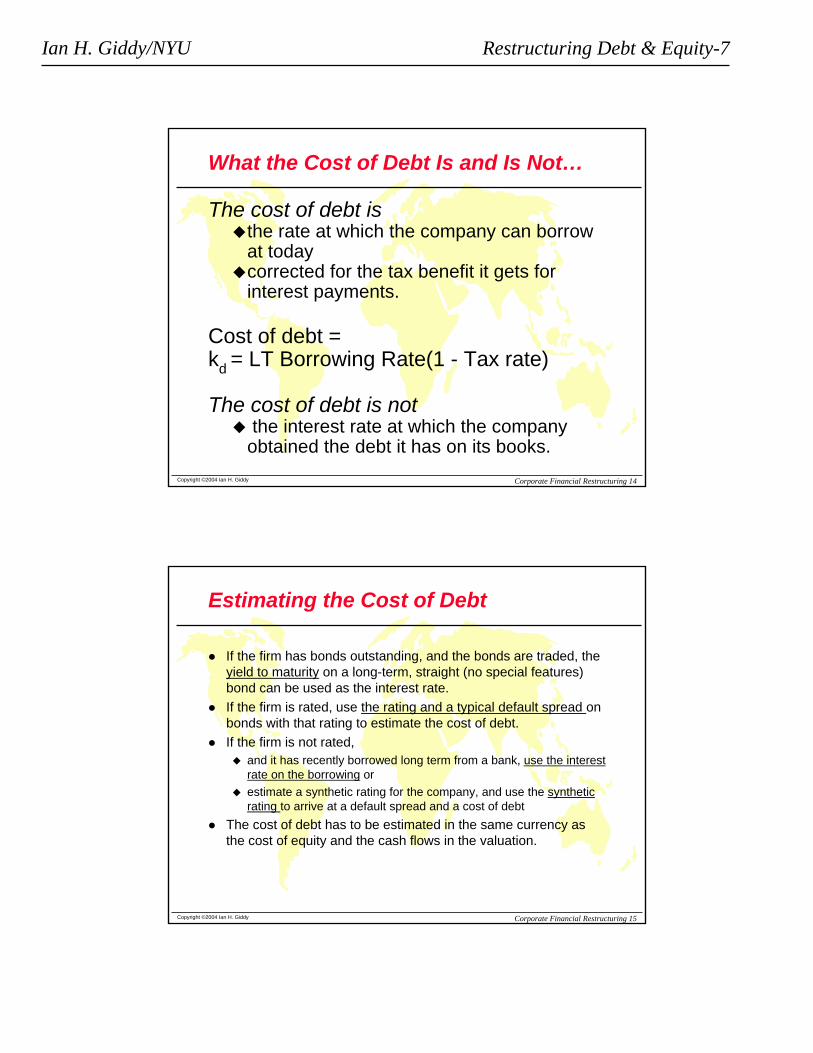
What the Cost of Debt Is and Is Not…
The cost of debt isthe rate at which the company can borrow at todaycorrected for the tax benefit it gets for interest payments.
Cost of debt =kd = LT Borrowing Rate(1 - Tax rate)
The cost of debt is notthe interest rate at which the company
obtained the debt it has on its books.
Copyright ©2004 Ian H. Giddy Corporate Financial Restructuring 15
Estimating the Cost of Debt
If the firm has bonds outstanding, and the bonds are traded, theyield to maturity on a long-term, straight (no special features) bond can be used as the interest rate.If the firm is rated, use the rating and a typical default spread on bonds with that rating to estimate the cost of debt.If the firm is not rated,
and it has recently borrowed long term from a bank, use the interest rate on the borrowing orestimate a synthetic rating for the company, and use the synthetic rating to arrive at a default spread and a cost of debt
The cost of debt has to be estimated in the same currency as the cost of equity and the cash flows in the valuation.
Ian H. Giddy/NYU Restructuring Debt & Equity-8
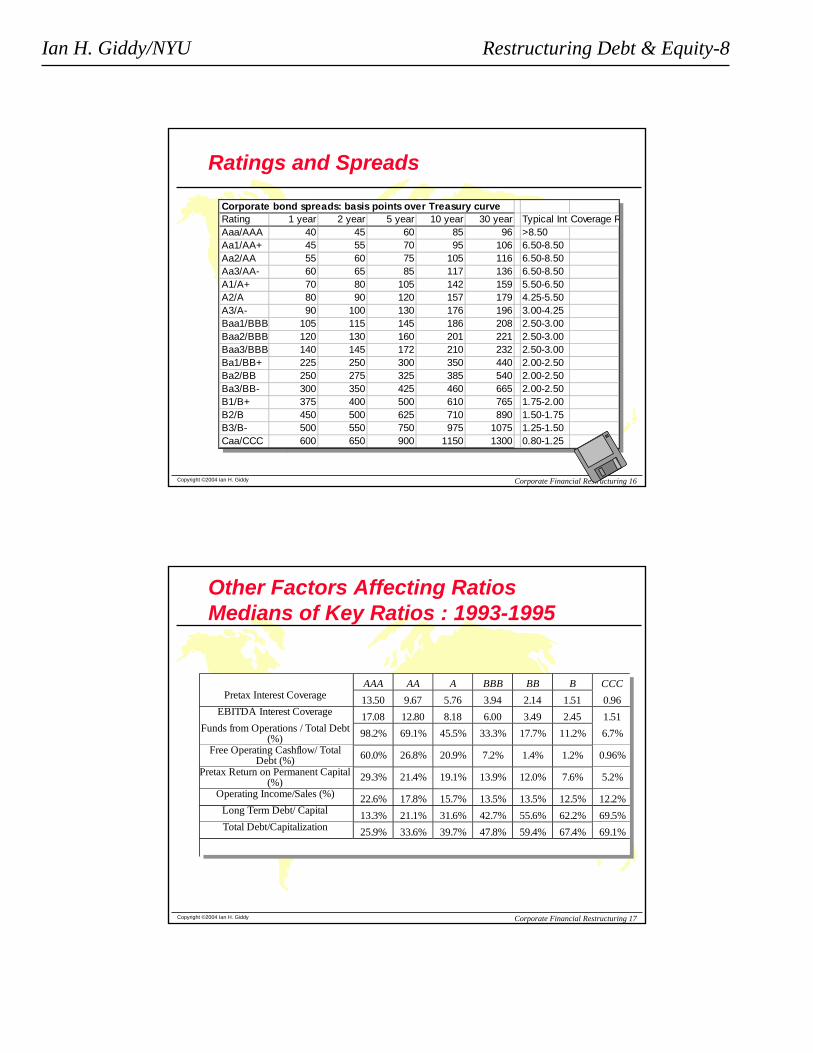
Copyright ©2004 Ian H. Giddy Corporate Financial Restructuring 16
Ratings and Spreads
Corporate bond spreads: basis points over Treasury curveRating 1 year 2 year 5 year 10 year 30 year Typical Int Coverage RAaa/AAA 40 45 60 85 96 >8.50Aa1/AA+ 45 55 70 95 106 6.50-8.50Aa2/AA 55 60 75 105 116 6.50-8.50Aa3/AA- 60 65 85 117 136 6.50-8.50A1/A+ 70 80 105 142 159 5.50-6.50A2/A 80 90 120 157 179 4.25-5.50A3/A- 90 100 130 176 196 3.00-4.25Baa1/BBB 105 115 145 186 208 2.50-3.00Baa2/BBB 120 130 160 201 221 2.50-3.00Baa3/BBB 140 145 172 210 232 2.50-3.00Ba1/BB+ 225 250 300 350 440 2.00-2.50Ba2/BB 250 275 325 385 540 2.00-2.50Ba3/BB- 300 350 425 460 665 2.00-2.50B1/B+ 375 400 500 610 765 1.75-2.00B2/B 450 500 625 710 890 1.50-1.75B3/B- 500 550 750 975 1075 1.25-1.50Caa/CCC 600 650 900 1150 1300 0.80-1.25
Copyright ©2004 Ian H. Giddy Corporate Financial Restructuring 17
Other Factors Affecting RatiosMedians of Key Ratios : 1993-1995
AAA AA A BBB BB B CCCPretax Interest Coverage 13.50 9.67 5.76 3.94 2.14 1.51 0.96
EBITDA Interest Coverage 17.08 12.80 8.18 6.00 3.49 2.45 1.51Funds from Operations / Total Debt
(%) 98.2% 69.1% 45.5% 33.3% 17.7% 11.2% 6.7%Free Operating Cashflow/ Total
Debt (%) 60.0% 26.8% 20.9% 7.2% 1.4% 1.2% 0.96%Pretax Return on Permanent Capital
(%) 29.3% 21.4% 19.1% 13.9% 12.0% 7.6% 5.2%Operating Income/Sales (%) 22.6% 17.8% 15.7% 13.5% 13.5% 12.5% 12.2%
Long Term Debt/ Capital 13.3% 21.1% 31.6% 42.7% 55.6% 62.2% 69.5%Total Debt/Capitalization 25.9% 33.6% 39.7% 47.8% 59.4% 67.4% 69.1%
Ian H. Giddy/NYU Restructuring Debt & Equity-9
Copyright ©2004 Ian H. Giddy Corporate Financial Restructuring 18
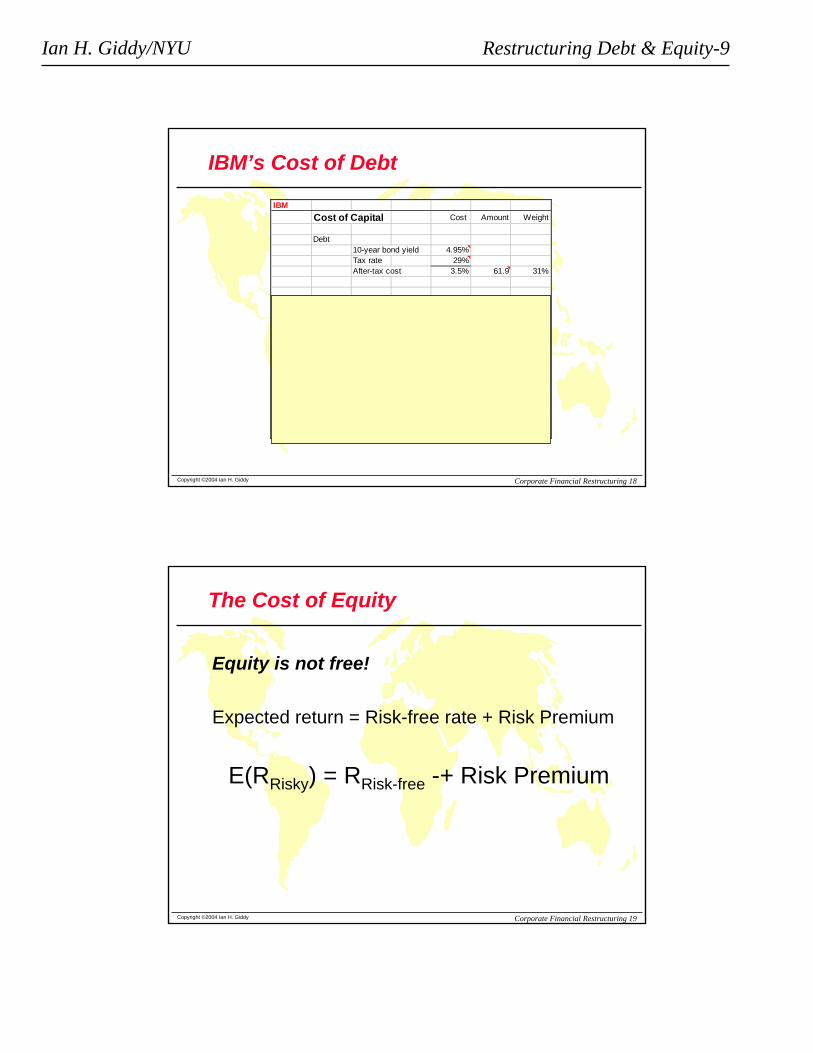
IBM’s Cost of Debt
IBMCost of Capital Cost Amount Weight
Debt10-year bond yield 4.95%Tax rate 29%After-tax cost 3.5% 61.9 31%
EquityRisk-free Treasury 4.50%Beta 1.47Market Risk Premium 5.50%From CAPM 12.6% 137.4 69%
Total 9.77% 199.3
Source: IBMfinancing.xls
Copyright ©2004 Ian H. Giddy Corporate Financial Restructuring 19
The Cost of Equity
Equity is not free!
Expected return = Risk-free rate + Risk Premium
E(RRisky) = RRisk-free -+ Risk Premium

Ian H. Giddy/NYU Restructuring Debt & Equity-10
Copyright ©2004 Ian H. Giddy Corporate Financial Restructuring 20
The Cost of Equity
Standard approach to estimating cost of equity:Cost of Equity = Rf + Equity Beta * (E(Rm) - Rf)
where, Rf = Riskfree rateE(Rm) = Expected Return on the Market Index (Diversified Portfolio)In practice,
Long term government bond rates are used as risk free ratesHistorical risk premiums are used for the risk premiumBetas are estimated by regressing stock returns against market returns
Copyright ©2004 Ian H. Giddy Corporate Financial Restructuring 22
•Equity Betas and Leverage
The beta of equity alone can be written as a function of the unlevered beta and the debt-equity ratio
βL = βu (1+ ((1-t)D/E)where
βL = Levered or Equity Betaβu = Unlevered Betat = Corporate marginal tax rateD = Market Value of DebtE = Market Value of Equity
While this beta is estimated on the assumption that debt carries no market risk (and has a beta of zero), you can have a modified version:
βL = βu (1+ ((1-t)D/E) - βdebt (1-t) D/(D+E)

Ian H. Giddy/NYU Restructuring Debt & Equity-11
Copyright ©2004 Ian H. Giddy Corporate Financial Restructuring 23
Cost of Capital and Leverage: Method
Estimated BetaWith current leverage
From regression
Unlevered BetaWith no leverage
Bu=Bl/(1+D/E(1-T))
Levered BetaWith different leverage
Bl=Bu(1+D/E(1-T))
Cost of equityWith different leverage
E(R)=Rf+Bl(Rm-Rf)
Equity
Leverage, EBITDAAnd interest cost
Interest CoverageEBITDA/Interest
Rating(other factors too!)
Cost of debtWith different leverage
Rate=Rf+Spread+?
Debt
Copyright ©2004 Ian H. Giddy Corporate Financial Restructuring 24
The Cost of Capital
Choice Cost1. Equity Cost of equity- Retained earnings - depends upon riskiness of the stock- New stock issues - will be affected by level of interest rates- WarrantsCost of equity = riskless rate + beta * risk premium
2. Debt Cost of debt- Bank borrowing - depends upon default risk of the firm- Bond issues - will be affected by level of interest rates
- provides a tax advantage because interest is tax-deductibleCost of debt = Borrowing rate (1 - tax rate)
Debt + equity = Cost of capital = Weighted average of cost of equity andCapital cost of debt; weights based upon market value.Cost of capital = kd [D/(D+E)] + ke [E/(D+E)]
Ian H. Giddy/NYU Restructuring Debt & Equity-12
Copyright ©2004 Ian H. Giddy Corporate Financial Restructuring 25
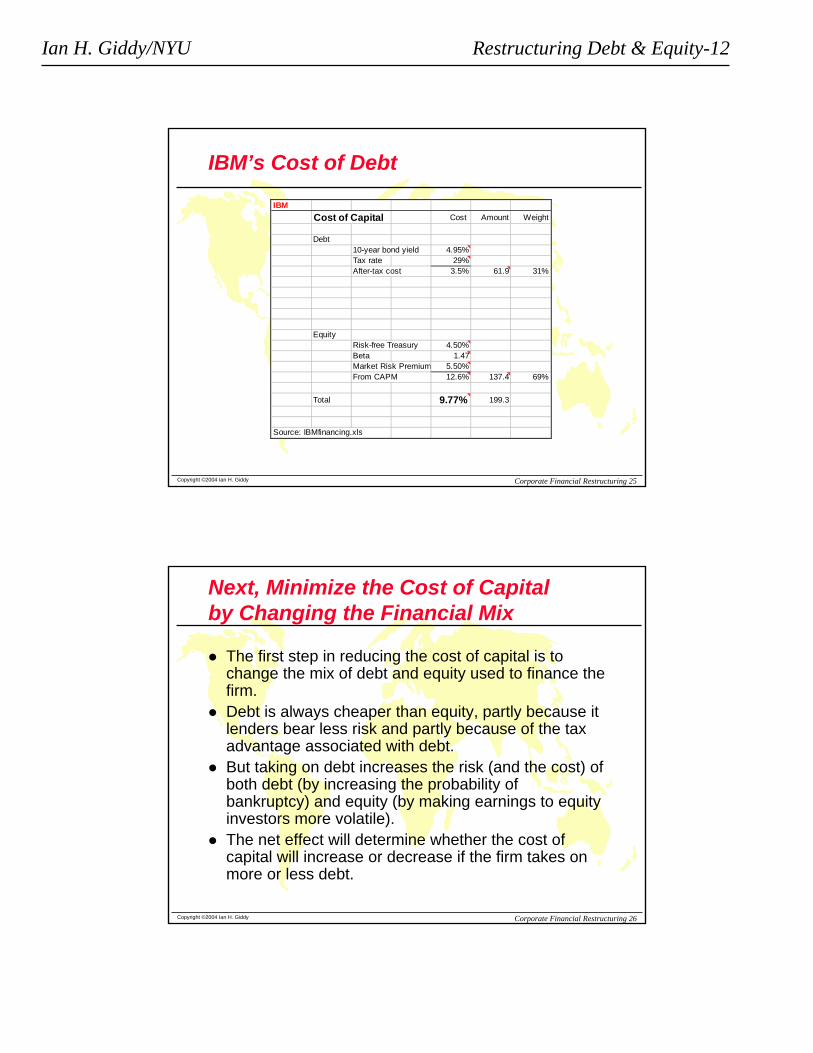
IBM’s Cost of Debt
IBMCost of Capital Cost Amount Weight
Debt10-year bond yield 4.95%Tax rate 29%After-tax cost 3.5% 61.9 31%
EquityRisk-free Treasury 4.50%Beta 1.47Market Risk Premium 5.50%From CAPM 12.6% 137.4 69%
Total 9.77% 199.3
Source: IBMfinancing.xls
Copyright ©2004 Ian H. Giddy Corporate Financial Restructuring 26
Next, Minimize the Cost of Capital by Changing the Financial Mix
The first step in reducing the cost of capital is to change the mix of debt and equity used to finance the firm.Debt is always cheaper than equity, partly because it lenders bear less risk and partly because of the tax advantage associated with debt.But taking on debt increases the risk (and the cost) of both debt (by increasing the probability of bankruptcy) and equity (by making earnings to equity investors more volatile). The net effect will determine whether the cost of capital will increase or decrease if the firm takes on more or less debt.
Ian H. Giddy/NYU Restructuring Debt & Equity-13
Copyright ©2004 Ian H. Giddy Corporate Financial Restructuring 27
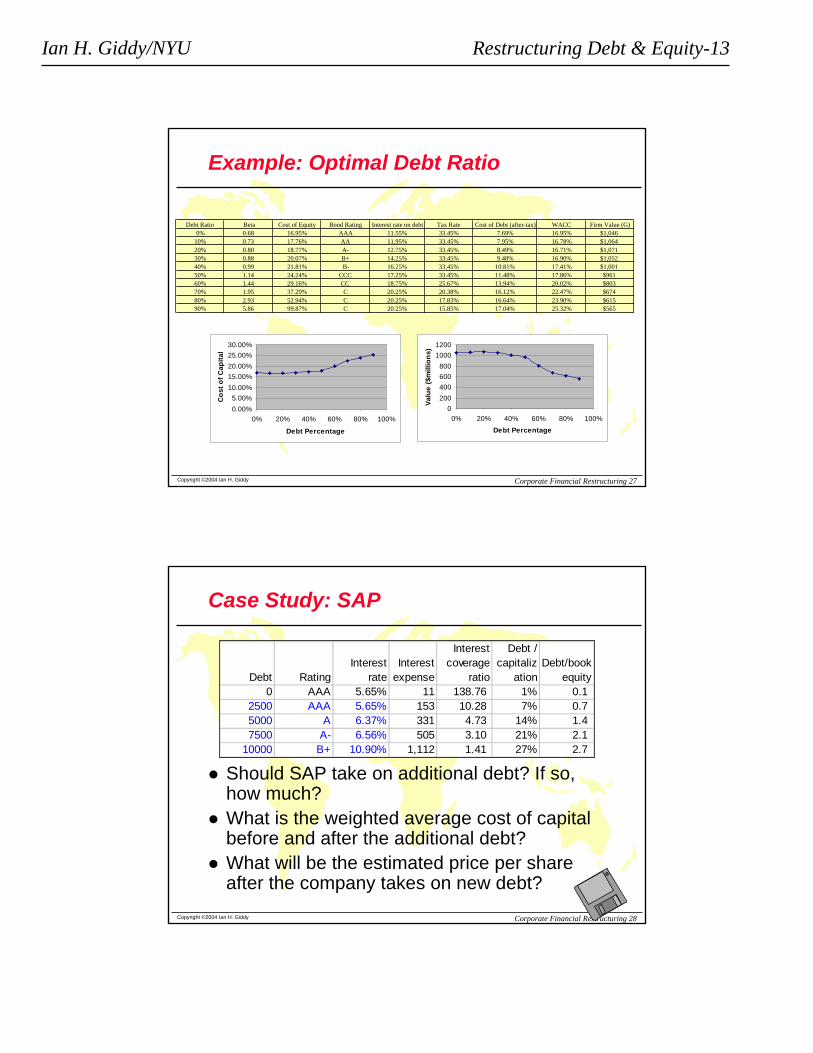
Example: Optimal Debt Ratio
Debt Ratio Beta Cost of Equity Bond Rating Interest rate on debt Tax Rate Cost of Debt (after-tax) WACC Firm Value (G)0% 0.68 16.95% AAA 11.55% 33.45% 7.69% 16.95% $1,046
10% 0.73 17.76% AA 11.95% 33.45% 7.95% 16.78% $1,06420% 0.80 18.77% A- 12.75% 33.45% 8.49% 16.71% $1,07130% 0.88 20.07% B+ 14.25% 33.45% 9.48% 16.90% $1,05240% 0.99 21.81% B- 16.25% 33.45% 10.81% 17.41% $1,00150% 1.14 24.24% CCC 17.25% 33.45% 11.48% 17.86% $96160% 1.44 29.16% CC 18.75% 25.67% 13.94% 20.02% $80370% 1.95 37.29% C 20.25% 20.38% 16.12% 22.47% $67480% 2.93 52.94% C 20.25% 17.83% 16.64% 23.90% $61590% 5.86 99.87% C 20.25% 15.85% 17.04% 25.32% $565
0200400600800
10001200
0% 20% 40% 60% 80% 100%
Debt PercentageVa
lue
($m
illio
ns)
0.00%5.00%
10.00%15.00%20.00%25.00%30.00%
0% 20% 40% 60% 80% 100%
Debt Percentage
Cos
t of C
apita
l
Copyright ©2004 Ian H. Giddy Corporate Financial Restructuring 28
Case Study: SAP
Debt RatingInterest
rateInterest
expense
Interest coverage
ratio
Debt / capitaliz
ationDebt/book
equity0 AAA 5.65% 11 138.76 1% 0.1
2500 AAA 5.65% 153 10.28 7% 0.7 5000 A 6.37% 331 4.73 14% 1.4 7500 A- 6.56% 505 3.10 21% 2.1
10000 B+ 10.90% 1,112 1.41 27% 2.7
Should SAP take on additional debt? If so, how much?What is the weighted average cost of capital before and after the additional debt?What will be the estimated price per share after the company takes on new debt?
Ian H. Giddy/NYU Restructuring Debt & Equity-14
Copyright ©2004 Ian H. Giddy Corporate Financial Restructuring 29
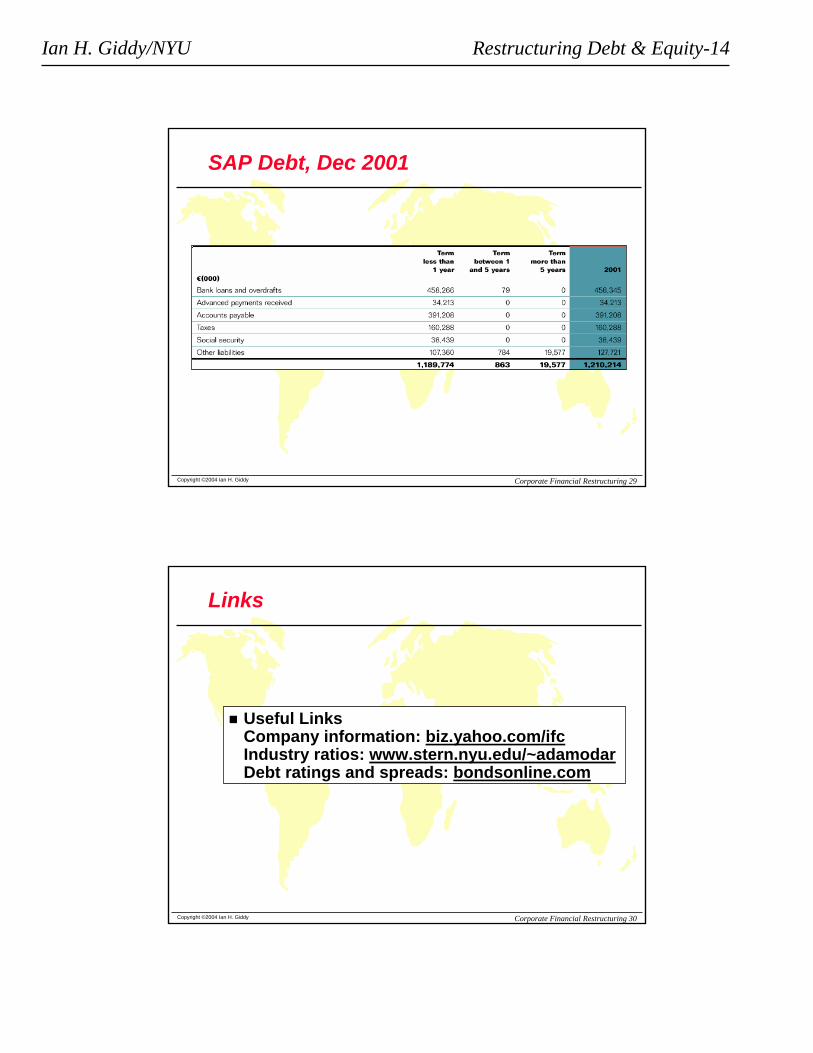
SAP Debt, Dec 2001
Copyright ©2004 Ian H. Giddy Corporate Financial Restructuring 30
Links
Useful Links Company information: biz.yahoo.com/ifcIndustry ratios: www.stern.nyu.edu/~adamodarDebt ratings and spreads: bondsonline.com
Ian H. Giddy/NYU Restructuring Debt & Equity-15
Copyright ©2004 Ian H. Giddy Corporate Financial Restructuring 31
Application to a Private Firm: “Argus”
1. The company is in the advertising and public relations business. It is privately owned, but the other major competitors are publicly traded.
2. It has grown rapidly but growth is leveling off
3. What percentage of debt financing makes sense to this company?
Copyright ©2004 Ian H. Giddy Corporate Financial Restructuring 32
Analyzing a Private Firm
The approach remains the same with important caveats
It is more difficult estimating firm value, since the equity and the debt of private firms do not trade; we use comparablesMost private firms are not rated; we have to estimate a ratingIf the cost of equity is based upon the market beta, it is possible that we might be underestimating the cost of equity, since private firm owners often consider all risk.
Ian H. Giddy/NYU Restructuring Debt & Equity-16
Copyright ©2004 Ian H. Giddy Corporate Financial Restructuring 33
Estimating the Optimal Debt Ratio for Argus
Adjusted EBIT = EBIT + Operating Lease Expenses = EUR 2,000,000 + EUR 500,000 = EUR 2,500,000
While Argus has no debt outstanding, the present value of the operating lease expenses of EUR 3.36 million is considered as debt.To estimate the market value of equity, we use a multiple of 22.41 times of net income. This multiple is the average multiple at which comparable firms which are publicly traded are valued.
Estimated Market Value of Equity = Net Income * Average PE= 1,160,000* 22.41 = 26,000,000
The interest rates at different levels of debt will be estimated based upon a “synthetic” bond rating. This rating will be assessed using interest coverage ratios for small firms which are rated by S&P.
Copyright ©2004 Ian H. Giddy Corporate Financial Restructuring 34
Interest Coverage Ratios, Spreads and Ratings: Small Firms
Int. Coverage Ratio Rating Spread over T Bond Rate> 12.5 AAA 0.20%9.50-12.50 AA 0.50%7.5 - 9.5 A+ 0.80%6.0 - 7.5 A 1.00%4.5 - 6.0 A- 1.25%3.5 - 4.5 BBB 1.50%3.0 - 3.5 BB 2.00%2.5 - 3.0 B+ 2.50%2.0 - 2.5 B 3.25%1.5 - 2.0 B- 4.25%1.25 - 1.5 CCC 5.00%0.8 - 1.25 CC 6.00%0.5 - 0.8 C 7.50%< 0.5 D 10.00%
Ian H. Giddy/NYU Restructuring Debt & Equity-17
Copyright ©2004 Ian H. Giddy Corporate Financial Restructuring 35
Copyright ©2004 Ian H. Giddy Corporate Financial Restructuring 36
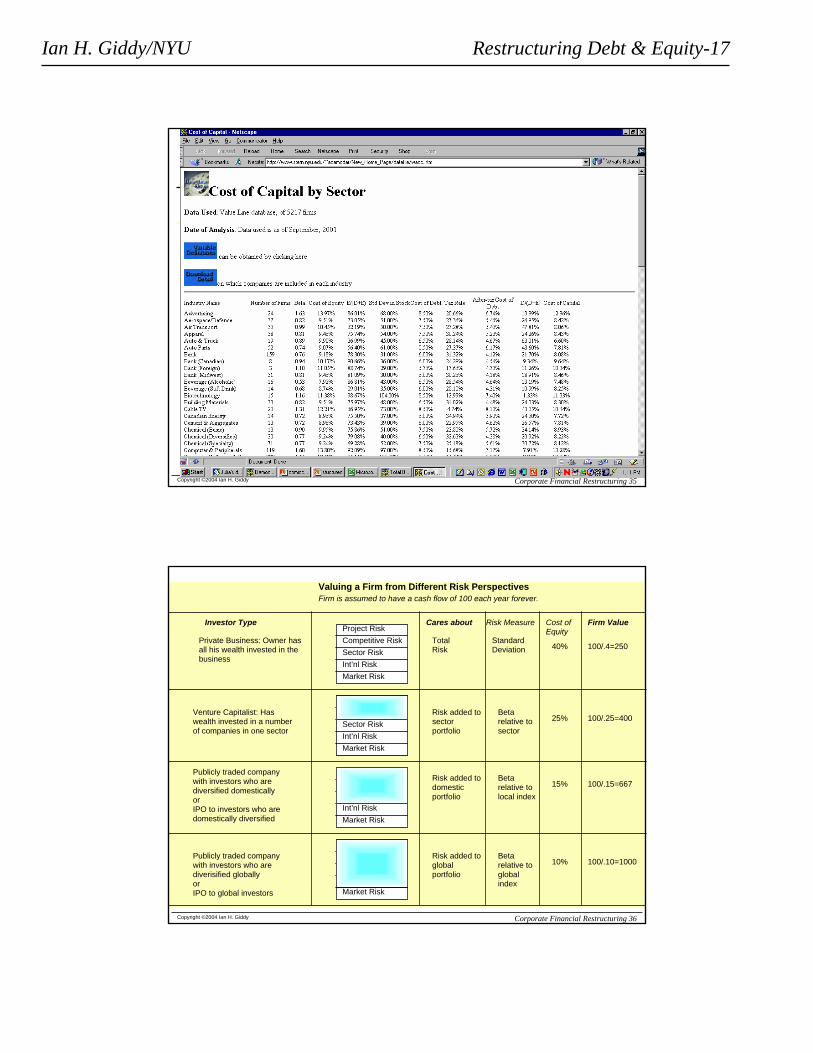
Private Business: Owner hasall his wealth invested in thebusiness
Venture Capitalist: Haswealth invested in a numberof companies in one sector
Publicly traded companywith investors who are diversified domesticallyorIPO to investors who aredomestically diversified
Publicly traded companywith investors who are diverisified globallyorIPO to global investors
Market RiskInt’nl RiskSector RiskCompetitive RiskProject Risk
Market RiskInt’nl RiskSector RiskCompetitive RiskProject Risk
Market RiskInt’nl RiskSector RiskCompetitive RiskProject Risk
Market RiskInt’nl RiskSector RiskCompetitive RiskProject Risk
TotalRisk
Risk added to sectorportfolio
Risk added to domestic portfolio
Risk added to global portfolio
StandardDeviation
Beta relative to sector
Beta relative to local index
Beta relative to global index
40%
25%
15%
10%
100/.4=250
100/.25=400
100/.15=667
100/.10=1000
Investor Type Cares about Risk Measure Cost ofEquity
Firm Value
Valuing a Firm from Different Risk PerspectivesFirm is assumed to have a cash flow of 100 each year forever.
Ian H. Giddy/NYU Restructuring Debt & Equity-18
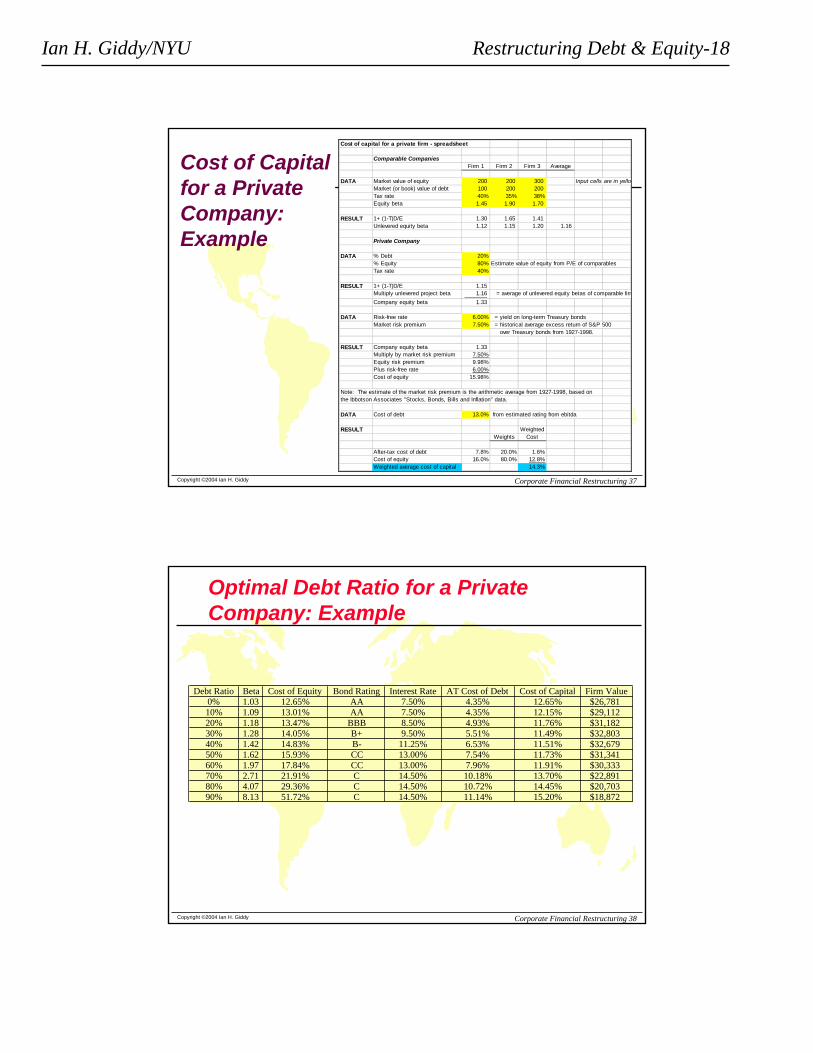
Copyright ©2004 Ian H. Giddy Corporate Financial Restructuring 37
Cost of capital for a private firm - spreadsheet
Comparable CompaniesFirm 1 Firm 2 Firm 3 Average
DATA Market value of equity 200 200 300 Input cells are in yelloMarket (or book) value of debt 100 200 200 Tax rate 40% 35% 38%Equity beta 1.45 1.90 1.70
RESULT 1+ (1-T)D/E 1.30 1.65 1.41 Unlevered equity beta 1.12 1.15 1.20 1.16
Private Company
DATA % Debt 20%% Equity 80% Estimate value of equity from P/E of comparablesTax rate 40%
RESULT 1+ (1-T)D/E 1.15 Multiply unlevered project beta 1.16 = average of unlevered equity betas of comparable firmCompany equity beta 1.33
DATA Risk-free rate 6.00% = yield on long-term Treasury bondsMarket risk premium 7.50% = historical average excess return of S&P 500
over Treasury bonds from 1927-1998.
RESULT Company equity beta 1.33 Multiply by market risk premium 7.50%Equity risk premium 9.98%Plus risk-free rate 6.00%Cost of equity 15.98%
Note: The estimate of the market risk premium is the arithmetic average from 1927-1998, based onthe Ibbotson Associates "Stocks, Bonds, Bills and Inflation" data.
DATA Cost of debt 13.0% from estimated rating from ebitda
RESULT WeightedWeights Cost
After-tax cost of debt 7.8% 20.0% 1.6%Cost of equity 16.0% 80.0% 12.8%Weighted average cost of capital 14.3%
Cost of Capital for a Private Company: Example
Copyright ©2004 Ian H. Giddy Corporate Financial Restructuring 38
Optimal Debt Ratio for a Private Company: Example
Debt Ratio Beta Cost of Equity Bond Rating Interest Rate AT Cost of Debt Cost of Capital Firm Value0% 1.03 12.65% AA 7.50% 4.35% 12.65% $26,78110% 1.09 13.01% AA 7.50% 4.35% 12.15% $29,11220% 1.18 13.47% BBB 8.50% 4.93% 11.76% $31,18230% 1.28 14.05% B+ 9.50% 5.51% 11.49% $32,80340% 1.42 14.83% B- 11.25% 6.53% 11.51% $32,67950% 1.62 15.93% CC 13.00% 7.54% 11.73% $31,34160% 1.97 17.84% CC 13.00% 7.96% 11.91% $30,33370% 2.71 21.91% C 14.50% 10.18% 13.70% $22,89180% 4.07 29.36% C 14.50% 10.72% 14.45% $20,70390% 8.13 51.72% C 14.50% 11.14% 15.20% $18,872
Ian H. Giddy/NYU Restructuring Debt & Equity-19
Copyright ©2004 Ian H. Giddy Corporate Financial Restructuring 39
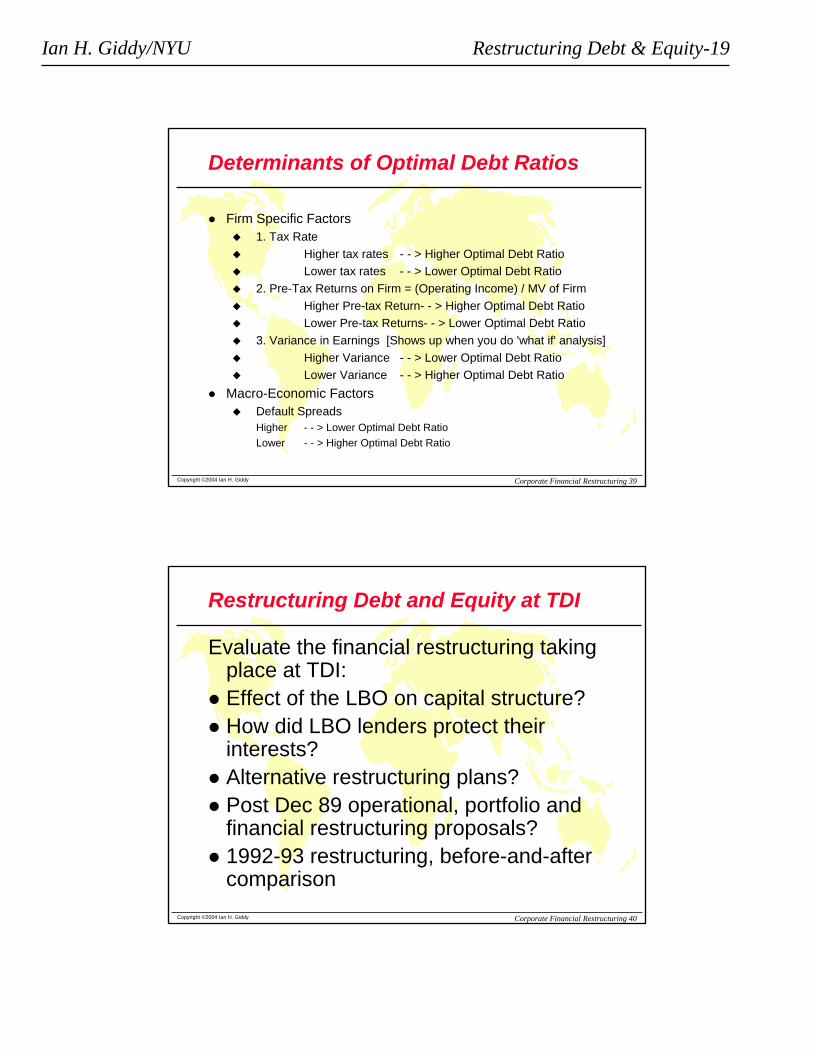
Determinants of Optimal Debt Ratios
Firm Specific Factors1. Tax Rate
Higher tax rates - - > Higher Optimal Debt RatioLower tax rates - - > Lower Optimal Debt Ratio
2. Pre-Tax Returns on Firm = (Operating Income) / MV of FirmHigher Pre-tax Return- - > Higher Optimal Debt RatioLower Pre-tax Returns- - > Lower Optimal Debt Ratio
3. Variance in Earnings [Shows up when you do 'what if' analysis]Higher Variance - - > Lower Optimal Debt RatioLower Variance - - > Higher Optimal Debt Ratio
Macro-Economic FactorsDefault Spreads Higher - - > Lower Optimal Debt RatioLower - - > Higher Optimal Debt Ratio
Copyright ©2004 Ian H. Giddy Corporate Financial Restructuring 40
Restructuring Debt and Equity at TDI
Evaluate the financial restructuring taking place at TDI:Effect of the LBO on capital structure?How did LBO lenders protect their interests?Alternative restructuring plans?Post Dec 89 operational, portfolio and financial restructuring proposals?1992-93 restructuring, before-and-after comparison
Ian H. Giddy/NYU Restructuring Debt & Equity-20
Copyright ©2004 Ian H. Giddy Corporate Financial Restructuring 41
“Nexus of Contracts”
Shareholders
Senior lenders
Subordinated lenders
Franchisors
Salespeople
Management
Copyright ©2004 Ian H. Giddy Corporate Financial Restructuring 45
Contact Info
Ian H. GiddyNYU Stern School of BusinessTel 212-998-0426; Fax [email protected]://giddy.org