Restore Louisiana Homeowner Assistance Program Situation & Pipeline...
21
Restore Louisiana Homeowner Assistance Program Situation & Pipeline Report #18 December 2, 2017 – December 8, 2017 December 9, 2017
Transcript of Restore Louisiana Homeowner Assistance Program Situation & Pipeline...

Restore Louisiana Homeowner Assistance Program Situation & Pipeline Report #18
December 2, 2017 – December 8, 2017
December 9, 2017

i
Situation & Pipeline Report # 18
December 2 – December 8, 2017
Table of Contents Program Overview .......................................................................................................... 1 Executive Summary ........................................................................................................ 4 Key Program Statistics .................................................................................................... 6 Submitted Surveys: Not Currently In A Phase and Undetermined Phase Reasons ......... 7 Low to Moderate Income (LMI), Senior Adults and Disabled Reported ............................ 8 Demographics for Submitted Applications ....................................................................... 9 Housing Assistance Center Activity (HAC) .................................................................... 10 Call Center Activity ........................................................................................................ 11 APPENDIX A ................................................................................................................ 12 APPENDIX B ................................................................................................................ 14 APPENDIX C ................................................................................................................ 15 APPENDIX D ................................................................................................................ 16 APPENDIX E ................................................................................................................ 17 APPENDIX F ................................................................................................................. 18 Glossary ........................................................................................................................ 19
List of Tables Table 1: Outreach Events ................................................................................................ 4 Table 2: Homeowner Program Snapshot ........................................................................ 5 Table 3: Key Program Statistics ...................................................................................... 6 Table 4: Not In Phase and Undetermined Reasons ......................................................... 7 Table 5 & 6: Surveys with LMI and Urgent Need Data .................................................... 8 Table 7: Submitted Surveys with Senior Adult or Disabled Reported ............................... 8 Table 8: Submitted Applications by Race ........................................................................ 9 Table 9: Housing Assistance Center Activity ................................................................. 10 Table 10: Call Center Activity ........................................................................................ 11 Table 11: Submitted Surveys and Submitted Applications by Louisiana House Districts .............................................................................................................. 12 Table 12: Submitted Surveys and Submitted Applications by Louisiana Senate Districts ............................................................................................................. 13 Table 13: FEMA Verified Loss (FVL), Submitted Surveys and Submitted Applications by Parish ................................................................................................... 14 Table 14: Grant Awards by Parish ................................................................................. 15
List of Figures Figure 1: Not Currently In A Phase Reasons ................................................................... 7 Figure 2: Submitted Applications by Race ....................................................................... 9 Figure 3: Requested Assistance .................................................................................... 16 Figure 4: Phase and Tiers ............................................................................................. 17 Figure 5: Housing Assistance Centers .......................................................................... 18

1
Situation & Pipeline Report # 18
December 2 – December 8, 2017
Program Overview
The Restore Louisiana Homeowner Assistance Program is dedicated to helping homeowners affected by the March and/or August 2016 floods repair and restore their damaged homes, or get reimbursed for work already completed. The funding for The Restore Louisiana Homeowner Assistance Program is allocated out of the Department of Housing and Urban Development’s (HUD) Community Development Block Grant Disaster Recovery (CDBG-DR) Program. There is currently $1.3 billion available for this program. The Restore Louisiana Homeowner Assistance Program has been designed to serve homeowners in six phases. The State of Louisiana’s Office of Community Development – Disaster Recovery Unit (OCD-DRU) structured the program in this manner in order to ensure that the limited federal funding is provided to homeowners in the greatest need. It also ensures that the rebuilding process is not slowed by federal environmental requirements. The first step in the process is a brief survey that all homeowners affected by the 2016 floods must complete. The purpose of this survey is to gather information about unmet needs related to the repair or reconstruction of flooded homes and responses to the survey will be used to determine which phase of the program the homeowner will be invited to apply for. Below is a brief explanation of the six phases that are currently funded.

2
Situation & Pipeline Report # 18
December 2 – December 8, 2017
In addition, in order to be eligible for the Program, homeowners must meet all of the eligibility criteria listed below:
Owner occupant at time of disaster event
Damaged address was the applicant’s primary residence at the time of disaster event
Suffered damage as a result of the March or August 2016 Severe Storms and Flooding events
Eligible structure as determined by program, including single family homes, duplexes, mobile homes and condominiums
Located in one of 51 disaster declared parishes
For homeowners that do qualify and are eligible for assistance, they can choose one of three solutions based on their progress in the rebuilding process and their capacity to complete the work.
3
Situation & Pipeline Report # 18
December 2 – December 8, 2017
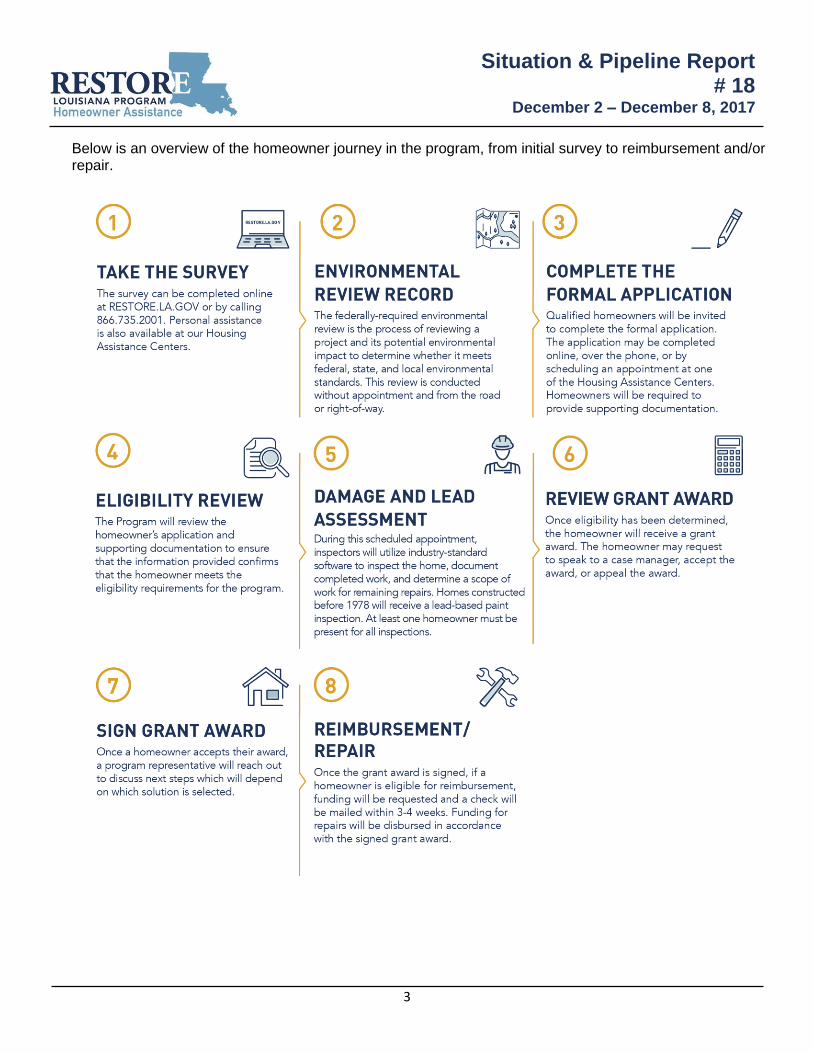
Below is an overview of the homeowner journey in the program, from initial survey to reimbursement and/or repair.

4
Situation & Pipeline Report # 18
December 2 – December 8, 2017
Executive Summary
As of December 8, 2017, survey submissions increased by 136 from the previous week, making the total submissions 46,124. 38,509 homeowners were determined to be in Phases I – VI.
38,075 environmental reviews have been completed, representing 99% of the 38,509 homeowners in Phases I – VI.
32,856 homeowners have been invited to complete applications from Phase I - VI. 17,055 (52%) homeowners have submitted their applications.
8,518 scopes of work have been completed, representing 50% of the 17,055 homeowners that have submitted their application.
There have been a total of 3,707 Grant Awards offered to homeowners, amounting to $108,324,197.40. Of those, 1,260 homeowners have acknowledged their grant agreements, obligating $36,506,364.66.
As of December 8, 2017, there were a total of 25,028 appointments held.
112,152 calls were completed by the call center. 83,777 of the completed calls were inbound calls and 28,375 of the completed calls were outbound calls.
The Program has completed 1 outreach event for this reporting period. The following events are scheduled for the week of December 11, 2017 – December 17, 2017:
o 12/11: EBR LTRC Full Committee Meeting o 12/12: Sen. Barrow/Rep. James Town Hall – Greenwell Springs Library
Table 1: Outreach Events
Month # of Events Hosted/
Participated In
May 2017 17
June 2017 15
July 2017 38
August 2017 26
September 2017 8
October 2017 15
November 8
Total 127

5
Situation & Pipeline Report # 18
December 2 – December 8, 2017
Table 2: Homeowner Program Snapshot
Activity As of
12/1/17 Weekly Activity
As of 12/8/17
Surveys Recorded Percentage
Total Number of Recorded Surveys 54,482 257 54,739 Non-Submitted Surveys 8,494 121 8,615
Submitted Surveys 45,988 136 46,124
Phase I - VI Subtotal 38,439 70 38,509 83.49%
Phase I 6,029 19 6,048 13.11%
Phase II 5,606 8 5,614 12.17%
Phase III 9,572 10 9,582 20.77%
Phase IV 9,233 16 9,249 20.05%
Phase V 1,326 4 1,330 2.88%
Phase VI 6,673 13 6,686 14.50%
Duplicate Address 2,302 48 2,350 5.09%
Undetermined 206 11 217 0.47%
Not Currently In A Phase 5,041 7 5,048 10.94%
Environmental Reviews
Environmental Reviews Available to Work 550 -116 434
Environmental Reviews Completed 37,889 186 38,075
Applications Invited
Total Number of Invited Applications 30,700 2,156 32,856
Applications Submitted 16,370 685 17,055
Zero Award 1,117 45 1,162
Ineligible 815 21 836
Scope of Work: Prospective/Completed
Scope of Work Available to Work 8,621 -84 8,537
Total Scope of Work Completed 7,749 769 8,518
Grant Awards Total Dollars
Grant Awards Offered 3,478 229 3,707 108,324,197.40
Grant Awards Obligated 1,080 180 1,260 36,506,364.66 Solution 1 Only 17 3 20 589,898.87
Solution 2 Only 44 12 56 1,944,852.90
Solution 3 Only 252 36 288 6,440,135.60
Solution 3 and 1 191 16 207 6,806,994.04
Solution 3 and 2 576 113 689 20,724,483.25
Disbursements
Total Disbursements 773 0 773 14,582,523.81 Solution 1 1 0 1 21,685.61
Solution 1 - Progress Payment 1 0 1 21,685.61
Solution 1 - Final Payment 0 0 0 0.00
Solution 2 28 0 28 212,561.47
Solution 2 - Progress Payment 12 0 12 138,210.27
Solution 2 - Final Payment 16 0 16 74,351.20
Solution 3 744 0 744 14,348,276.73

6
Situation & Pipeline Report # 18
December 2 – December 8, 2017
Key Program Statistics
Table 3: Key Program Statistics
38,509 of the 46,124 meet requirements
for Phases I – VI.
Invited 32,856 Homeowners to complete Applications.
45,400
45,500
45,600
45,700
45,800
45,900
46,000
46,100
46,200
17-Nov 24-Nov 1-Dec 8-Dec
45,655
45,810
45,988
46,124
Submitted Surveys
1,000
3,000
5,000
7,000
9,000
11,000
13,000
15,000
17,000
19,000
17-Nov 24-Nov 1-Dec 8-Dec
12,984 13,528
16,37017,055
Submitted Applications
0
500
1,000
1,500
2,000
2,500
3,000
3,500
4,000
17-Nov 24-Nov 1-Dec 8-Dec
3,075 3,2183,478
3,707
Grant Awards Offered
$0.00
$20,000,000.00
$40,000,000.00
$60,000,000.00
$80,000,000.00
$100,000,000.00
$120,000,000.00
17-Nov 24-Nov 1-Dec 8-Dec
$89,743,686.41$93,583,690.13
$101,586,696.92$108,324,197.40
Grant Award Dollars Offered

7
Situation & Pipeline Report # 18
December 2 – December 8, 2017
Submitted Surveys: Not Currently In A Phase and Undetermined Phase Reasons
Table 4: Not In Phase and Undetermined Reasons
Activity As of
12/1/17 Weekly Activity
As of 12/8/17
Submitted Surveys
Total Submitted Surveys Not Currently In A Phase 5,041 7 5,048
Total Submitted Surveys Undetermined 206 11 217
Not Currently In A Phase Details
Total Number of Not Currently In A Phase Reasons 5,371 10 5,381 Insufficient Damage 4,600 11 4,611
Structure Type 278 -4 274
Prior Federal Assistance No Insurance 249 0 249
Neither Storm 122 3 125
Not in 51 Parishes 122 0 122
Undetermined Phase Details
Total Number of Undetermined Phase Reasons 206 11 217 Flood Plain (Not determined) 206 11 217
Figure 1: Not Currently In A Phase Reasons
0
500
1,000
1,500
2,000
2,500
3,000
3,500
4,000
4,500
5,000
InsufficientDamage
Structure Type Prior FederalAssistance No
Insurance
Neither Storm Not in 51Parishes
4,611
274 249125 122

8
Situation & Pipeline Report # 18
December 2 – December 8, 2017
Low to Moderate Income (LMI), Senior Adults and Disabled Reported
As of December 8, 2017, there are 24,463 homeowners, 53.04% of the homeowners who submitted surveys, that reported their income as low to moderate. There are 16,764 homeowners, 36.35% of the homeowners who submitted surveys, that reported they were 62 years of age or older.
Table 5 & 6: Surveys with LMI and Urgent Need Data
Phase
Submitted Surveys with LMI Reported
% LMI of Submitted Surveys by Phase
Total Submitted Surveys
Phase One (I) 6,048 100.00% 6,048
Phase Two (II) 5,614 100.00% 5,614
Phase Three (III) 3,315 34.60% 9,582
Phase Four (IV) 2,883 31.17% 9,249
Phase Five (V) 683 51.35% 1,330
Phase Six (VI) 1,160 17.35% 6,686
Duplicate Address 1,380 58.72% 2,350
Undetermined 167 76.96% 217
Not In Phase 3,213 63.65% 5,048
Total 24,463 53.04% 46,124
Table 7: Submitted Surveys with Senior Adult or Disabled Reported
Phase
Submitted Surveys with
Senior Adults
Reported
% Senior Adults of
Submitted Surveys by
Phase
Submitted Surveys
with Disabled Reported
% Disabled of Submitted Surveys by
Phase
Total Submitted Surveys
Phase One (I) 4,238 70.07% 3,885 64.24% 6,048
Phase Two (II) 4,278 76.20% 3,264 58.14% 5,614
Phase Three (III) 1,821 19.00% 971 10.13% 9,582
Phase Four (IV) 1,934 20.91% 951 10.28% 9,249
Phase Five (V) 203 15.26% 126 9.47% 1,330
Phase Six (VI) 1,670 24.98% 635 9.50% 6,686
Duplicate Address 813 34.60% 686 29.19% 2,350
Undetermined 82 37.79% 81 37.33% 217
Not In Phase 1,725 34.17% 1,619 32.07% 5,048
Total 16,764 36.35% 12,218 26.49% 46,124
*A Senior Adult is anyone 62 years of age or older.
Submitted Surveys
Percentage
Most Impacted LMI 21,036 45.61%
Most Impacted Urgent Need 20,369 44.16%
LMI 3,427 7.43%
Urgent Need 1,292 2.80%
Total 46,124 100.00%

9
Situation & Pipeline Report # 18
December 2 – December 8, 2017
Demographics for Submitted Applications
Table 8: Submitted Applications by Race
Race (Self-Reported) Submitted
Applications Percentage
American Indian/Alaska Native 20 0.12%
American Indian/Alaska Native and White 48 0.28%
American Indian/Alaskan Native/Black-African American 37 0.22%
Asian 250 1.47%
Asian and White 16 0.09%
Black/African American 7,640 44.80%
Black/African American and White 137 0.80%
Native Hawaiian/Other Pacific Islander 18 0.10%
Other Multi-Racial 270 1.58%
White 8,572 50.26%
A Race was not provided 47 0.28%
Total 17,055 100.00%
Figure 2: Submitted Applications by Race
-
1,000
2,000
3,000
4,000
5,000
6,000
7,000
8,000
9,000
20 48 37 250 16
7,640
137 18 270
8,572
47
Sub
mit
ted
Ap
plic
atio
ns

10
Situation & Pipeline Report # 18
December 2 – December 8, 2017
Housing Assistance Center Activity (HAC)
Table 9: Housing Assistance Center Activity
Activity As of
12/1/2017 Weekly Activity
As of 12/8/2017
Appointments
Total Number of Appointments 25,904 1,181 27,085
Walk-ins 12,043 520 12,563
Scheduled 13,861 661 14,522
Held at office 11,520 580 12,100
Home visit 362 3 365
Cancelled 1,389 61 1,450
No Show 590 17 607
Housing Assistance Center Details
Baton Rouge
Total Number of Appointments 16,904 782 17,686
Walk-ins 8,281 364 8,645
Scheduled 8,623 418 9,041
Held at office 7,350 367 7,717
Home visit 116 1 117
Cancelled 988 45 1,033
No Show 169 5 174
Hammond
Total Number of Appointments 4,797 183 4,980
Walk-ins 2,428 100 2,528
Scheduled 2,369 83 2,452
Held at office 1,702 64 1,766
Home visit 229 2 231
Cancelled 238 10 248
No Show 200 7 207
Lafayette
Total Number of Appointments 1,977 127 2,104
Walk-ins 439 23 462
Scheduled 1,538 104 1,642
Held at office 1,367 99 1,466
Home visit 6 0 6
Cancelled 97 1 98
No Show 68 4 72
Monroe
Total Number of Appointments 2,226 89 2,315
Walk-ins 895 33 928
Scheduled 1,331 56 1,387
Held at office 1,101 50 1,151
Home visit 11 0 11
Cancelled 66 5 71
No Show 153 1 154

11
Situation & Pipeline Report # 18
December 2 – December 8, 2017
Call Center Activity
Table 10: Call Center Activity
Activity As of
12/1/2017 Weekly Activity
As of 12/8/2017
Call Center
Total Calls 111,688 4,085 115,773
Total Calls Abandoned 3,439 182 3,621
Abandoned % 3.08% 0.05% 3.13%
Total Calls Processed 108,249 3,903 112,152
Inbound 80,780 2,997 83,777
Outbound 27,469 906 28,375
Completed Inbound Calls Details
Total Inbound Calls Completed 80,780 2,997 83,777
Average Wait Time 1.21 min 1.21 min
Average Call Time 6.09 min 6.08 min
Program Inquiry 26,009 656 26,665
Surveys Status Update 2,212 63 2,275
Surveys Completed 7,217 36 7,253
Case Manager Request 3,866 341 4,207
Application Status Update 31,169 1,571 32,740
Applications Completed 116 15 131
Damage Assessment Inquiry 2,099 11 2,110
Award Acknowledgement Inquiry 1,002 52 1,054
Construction Inquiry 523 66 589
Appeals 142 22 164
Outbound Project 13 0 13
Invalid Number/ No Answer / Busy / Left Message 4,258 140 4,398
Call Transferred 2,154 24 2,178
Completed Outbound Calls Details
Total Outbound Calls Completed 27,469 906 28,375
Average Call Time 2.09 min 2.05 min
Program Inquiry 4,290 14 4,304
Survey Status Update 40 1 41
Surveys Completed 645 1 646
Case Manager Request 60 2 62
Application Status Update 3,557 196 3,753
Applications Completed 11 2 13
Damage Assessment Inquiry 6 0 6
Award Acknowledgement Inquiry 27 0 27
Construction Inquiry 257 3 260
Appeals 0 0 0
Outbound Project 344 0 344
Invalid Number/ No Answer / Busy / Left Message 10,138 227 10,365
Call Transferred 8,094 460 8,554

12
Situation & Pipeline Report # 18
December 2 – December 8, 2017
APPENDIX A
Table 11: Submitted Surveys and Submitted Applications by Louisiana House Districts
House District
Survey Count
Application Count
House District
Survey Count
Application Count
House District
Survey Count
Application Count
1 68 19
36 3 0
72 1,589 622
2 50 15
37 114 24
73 1,225 388
3 35 7
38 151 33
74 311 94
4 76 21
39 178 36
75 334 110
5 20 8
40 170 52
76 33 6
6 4 0
41 229 55
77 226 37
7 54 13
42 282 91
78 2 0
8 24 6
43 479 110
80 1 0
9 158 26
44 104 28
81 1,904 689
10 164 34
45 148 24
83 3 0
11 64 12
46 229 71
84 2 0
12 90 27
47 536 157
85 1 0
13 94 22
48 539 181
86 707 233
14 374 79
49 336 83
88 2,593 714
15 69 22
50 38 1
89 3 0
16 502 159
51 2 0
90 22 3
17 1,094 455
53 4 0
91 4 0
18 156 43
54 2 0
92 3 0
19 277 101
55 4 0
93 6 0
20 80 26
56 4 0
95 2,008 781
21 86 28
57 11 0
96 475 150
22 132 38
58 210 60
97 7 0
23 122 24
59 599 178
98 1 0
24 111 28
60 77 18
99 4 0
25 10 3
61 1,390 583
100 7 0
26 46 7
62 517 195
101 5,185 2,914
27 24 13
63 892 362
102 6 0
28 120 19
64 2,991 1,168
103 2 0
29 1,587 802
65 5,311 2,095
104 9 2
30 20 1
66 1,542 408
105 3 0
31 1,097 358
67 154 50
Unknown 0 0
32 43 9
68 68 9
Total 46,124 17,055
33 56 17
69 210 52
34 19 4
70 93 15
35 5 1
71 4,900 1,726

13
Situation & Pipeline Report # 18
December 2 – December 8, 2017
Table 12: Submitted Surveys and Submitted Applications by Louisiana Senate Districts
Senate District
Survey Count
Application Count
Senate District
Survey Count
Application Count
1 64 13 22 825 249
2 317 89 23 1,663 482
3 11 0 24 530 134
4 12 0 25 329 84
5 8 0 26 1,385 420
6 7,835 2,940 27 27 5
7 7 0 28 369 86
8 8 0 29 182 53
9 1 0 30 206 51
10 2 0 31 217 46
11 861 211 32 251 90
12 2,001 696 33 648 174
13 8,356 2,992 34 1,539 607
14 1,759 721 35 271 63
15 9,276 4,738 36 316 65
16 487 122 37 101 22
17 858 296 38 119 33
18 4,994 1,520 39 188 45
19 11 0 Unknown 0 0
20 4 0 Total 46,124 17,055
21 86 8

14
Situation & Pipeline Report # 18
December 2 – December 8, 2017
APPENDIX B
Table 13: FEMA Verified Loss (FVL), Submitted Surveys and Submitted Applications by Parish
Parish FVL
Count Survey Count
Application Count
Parish FVL
Count Survey Count
Application Count
Acadia 1,531 393 105 Livingston 15,892 9,385 3,430
Allen 75 18 5 Madison 85 51 17
Ascension 6,353 3,639 1,019 Morehouse 1,005 229 84
Avoyelles 274 125 19 Natchitoches 598 138 29
Beauregard 113 34 6 Ouachita 3,418 1,914 677
Bienville 209 45 12 Pointe Coupee 444 130 38
Bossier 607 238 49 Rapides 145 80 23
Caddo 589 275 71 Red River 46 13 1
Calcasieu 266 141 37 Richland 445 110 40
Caldwell 154 37 13 Sabine 100 57 12
Catahoula 72 17 6 St. Helena 976 312 123
Claiborne 208 43 6 St. James 162 68 15
De Soto 141 47 12 St. Landry 1,615 341 97
East Baton Rouge 24,248 18,750 8,222 St. Martin 1,301 414 125
East Carroll 237 41 16 St. Tammany 1,057 392 78
East Feliciana 617 226 83 Tangipahoa 6,183 3,356 1,166
Evangeline 522 103 23 Union 399 83 26
Franklin 58 18 4 Vermilion 1,786 816 238
Grant 280 68 22 Vernon 306 62 14
Iberia 1,478 465 126 Washington 1,222 380 126
Iberville 357 105 29 Webster 525 114 23
Jackson 74 11 1 West Baton Rouge 110 32 7
Jefferson Davis 508 111 23 West Carroll 336 59 13
Lafayette 4,753 2,372 699 West Feliciana 154 51 20
LaSalle 73 21 7 Winn 181 45 12
Lincoln 152 25 5 Total 82,440 46,000 17,054
Ineligible Parishes
Parish Survey Count
Application Count
Assumption 6 0
Cameron 0 0
Concordia 3 0
Jefferson 16 0
Lafourche 4 0
Orleans 35 0
Plaquemines 2 0
St. Bernard 1 0
St. Charles 3 0
St. John the Baptist 12 0
St. Mary 37 1
Tensas 2 0
Terrebonne 3 0
Total 124 1

15
Situation & Pipeline Report # 18
December 2 – December 8, 2017
APPENDIX C
Table 14: Grant Awards by Parish
Parish
Grant Awards Offered Count
Grant Awards Offered Amount
Grant Awards Obligated
Count
Grant Awards Obligated Amount
Disbursed Count
Disbursed Amount
Acadia 17 $474,885.58 4 $96,059.06 1 $1,617.30
Ascension 181 $5,703,847.90 56 $1,791,879.62 32 $860,395.84
Bienville 1 $27,322.54 0 $0.00 0 $0.00
Bossier 6 $238,164.10 0 $0.00 0 $0.00
Caddo 4 $105,935.94 1 $8,158.09 0 $0.00
Calcasieu 4 $145,515.82 0 $0.00 0 $0.00
Caldwell 1 $7,707.58 1 $7,707.58 0 $0.00
East Baton Rouge 2,169 $61,569,057.47 851 $25,076,633.19 529 $9,579,997.23
East Carroll 1 $7,496.41 1 $7,496.41 0 $0.00
East Feliciana 10 $355,052.92 2 $59,807.02 2 $58,457.15
Evangeline 2 $81,449.35 0 $0.00 0 $0.00
Franklin 1 $45,000.00 1 $45,000.00 0 $0.00
Grant 1 $24,525.79 0 $0.00 0 $0.00
Iberia 20 $651,592.28 1 $7,180.42 1 $7,180.42
Iberville 5 $185,407.07 1 $19,622.94 0 $0.00
Lafayette 177 $4,069,303.54 57 $1,296,323.02 27 $554,153.76
Livingston 752 $22,955,376.12 220 $6,272,949.52 138 $2,984,777.63
Madison 1 $31,984.43 0 $0.00 0 $0.00
Morehouse 5 $153,190.79 0 $0.00 0 $0.00
Natchitoches 2 $194,226.58 0 $0.00 0 $0.00
Ouachita 54 $1,680,490.16 11 $322,330.81 2 $57,750.28
Pointe Coupee 5 $155,292.11 0 $0.00 0 $0.00
Rapides 2 $74,996.79 0 $0.00 0 $0.00
Richland 1 $37,308.50 0 $0.00 0 $0.00
Sabine 1 $34,202.65 0 $0.00 0 $0.00
St. Helena 8 $279,313.92 1 $26,454.24 1 $4,019.44
St. James 1 $39,445.54 0 $0.00 0 $0.00
St. Landry 3 $68,743.36 1 $14,725.72 0 $0.00
St. Martin 11 $427,137.54 1 $40,274.11 1 $30,113.29
St. Tammany 11 $282,735.91 1 $16,907.03 0 $0.00
Tangipahoa 198 $6,568,719.93 40 $1,156,952.86 21 $392,434.42
Union 2 $52,770.25 0 $0.00 0 $0.00
Vermilion 32 $919,180.23 7 $168,209.36 3 $51,627.05
Vernon 2 $47,240.70 0 $0.00 0 $0.00
Washington 9 $319,109.64 2 $71,693.66 0 $0.00
Webster 1 $14,588.41 0 $0.00 0 $0.00
West Baton Rouge 2 $103,233.43 0 $0.00 0 $0.00
West Carroll 3 $147,646.12 0 $0.00 0 $0.00
West Feliciana 1 $45,000.00 0 $0.00 0 $0.00
Total 3,707 $108,324,197.40 1,260 $36,506,364.66 758 $14,582,523.81

16
Situation & Pipeline Report # 18
December 2 – December 8, 2017
APPENDIX D
In 2016, after Gov. John Bel Edwards sought federal flood recovery funding for Louisiana, Congress provided three appropriations of Community Development Block Grant-Disaster Recovery funds for nationwide recovery from several disasters. These funds were allocated by the U.S. Department of Housing and Urban Development to various states. HUD allocated $437.8 million from the first appropriation, $1.2 billion from the second appropriation and $51 million from the third appropriation to Louisiana. Below is a summary of the funding requested, appropriated, and allocation across Restore Louisiana programs.
Figure 3: Requested Assistance

17
Situation & Pipeline Report # 18
December 2 – December 8, 2017
APPENDIX E
The table below should help give you an idea of your potential for program eligibility, as well as the application phase in which you are most likely to be included and which tier of funding would most likely apply to you. Please note that to be eligible for a certain application phase, you must meet all of the checked criteria for that phase. Your survey and application results will ultimately determine your specific eligibility.
Figure 4: Phase and Tiers

18
Situation & Pipeline Report # 18
December 2 – December 8, 2017
APPENDIX F
The Housing Assistance Centers will be open 8 a.m. - 5 p.m. Monday through Friday to help homeowners respond to surveys or fill out program applications. They also help homeowners connect with a case manager and offer a view of their options for repairs, reconstruction or reimbursement. If you would like assistance in any of these areas, please visit a Housing Assistance Center.
Figure 5: Housing Assistance Centers

19
Situation & Pipeline Report # 18
December 2 – December 8, 2017
Glossary
Act of Donation: A form of property transfer without exchange of payment. Applicant: All homeowners who are owner-occupants of a damaged property are applicants. All owner-occupants must sign program documents. CDBG-DR: Community Development Block Grant – Disaster Recovery Program Common Area Under Roof: The total area under the common roof is primarily interior, conditioned spaces, and for single-story homes, equal to the footprint of the house. The term is also synonymous with the eligible area. In addition, exterior spaces such as detached porches and garages are not considered in the eligible area. Duplication of Benefits: A duplication of benefit is the receipt of funding from multiple sources for the same purpose. The Robert T. Stafford Disaster Assistance and Emergency Relief Act (Stafford Act) prohibits any person, business concern or other entity from receiving financial assistance from CDBG Disaster Recovery funding with respect to any part of the loss resulting from a major disaster as to which he/she has already received financial assistance under any other program or from insurance or any other sources. It is an amount determined by the program that may result in the reduction of an award value. HCDA: Housing and Community Development Act of 1974 Housing Assistance Center (HAC): A location where applicants meet with case managers and schedule appointments. HUD: Department of Housing and Urban Development Low to Moderate Income (LMI) Household: A household is considered to be of low or moderate income if the household income (including income derived from assets) is at or below 80 percent of an area’s median income. All income is based on the Area Median Income limits set annually by HUD for each parish or metropolitan statistical area. Major/Severe Damages: $8,000 or more of FEMA inspected real property damage or 1 foot or more of flood damage on the first floor. New Construction: A replacement home that substantially exceeds the original footprint by 20% or more on the existing lot (if permitted) or the construction of a new home in a new location. NFIP: National Flood Insurance Program. When the Program refers to NFIP in the context of eligibility or duplication of benefits, the Program is referring to private and public flood insurance programs that cover structural repairs resulting from flood damages. Reconstruction: Demolition and rebuilding of an existing structure based on the program’s building standards. Reconstructed property is built on the same footprint as the original structure and will not substantially exceed (limited to an increase of 20% or less) the square footage of the current or demolished structure. This requirement will subordinate to the local jurisdiction’s building code requirements. Rehabilitation: Repairs made to an existing structure based on the program’s building standards.