Restaurant Industry Update - Piper Sandler Companies...RESTAURANT INDUSTRY UPDATE | 1 Restaurant...
14
Investment Banking | Monthly Newsletter February 2016 | 1 RESTAURANT INDUSTRY UPDATE | 1 Restaurant Industry Update Impacts of COVID-19 Week of April 20, 2020 In these unprecedented times, Piper Sandler hopes you and your families are healthy and safe. We have compiled this industry update to assist operators, investors and industry participants in this time of tremendous upheaval. We look forward to better times and continuing our relationship with you all. CARES Act Funding … but Not to All Disruption Continues to be Widespread Large Companies Beef up Balance Sheets Restaurant Industry Rallies To Support Employees • Restaurant companies of all sizes received CARES Act funding of up to $10 million • However funding for the program ran out on April 16th leaving many operators out in the cold and the industry advocating for additional funding, in particular for independent restaurants • Large restaurant companies have gone on the offensive to strengthen balance sheets through drawdowns of revolver and new debt and equity issuances • Notable financings announced from Landry’s, YUM!, Dave & Buster’s, Shake Shack, Cheesecake Factory and Darden • Investor focus on liquidity likely indicates more public company financings to come • Massive unemployment across the industry impacting lives and broader economy • Bankruptcies and permanent closures begin spreading • M&A markets meaningfully disrupted including terminated TGI Fridays merger into a SPAC • The restaurant industry has come together like never before to offer support and assistance to industry employees experiencing extraordinary hardship in the wake of the coronavirus outbreak. The following are just a few of many initiatives providing immediate relief to restaurant workers: James Beard foundation food & beverage industry relief fund, #restaurantrescue , #saverestaurants , ROAR (relief opportunities for all restaurants) on change.org, CARES Act, Restaurant relief America
Transcript of Restaurant Industry Update - Piper Sandler Companies...RESTAURANT INDUSTRY UPDATE | 1 Restaurant...
Investment Banking | Monthly Newsletter February 2016 | 1RESTAURANT INDUSTRY UPDATE | 1
Restaurant Industry Update
Impacts of COVID-19
Week of April 20, 2020
In these unprecedented times, Piper Sandler hopes you and your families are healthy and safe. We have compiled thisindustry update to assist operators, investors and industry participants in this time of tremendous upheaval. We look forwardto better times and continuing our relationship with you all.
CARES Act Funding …
but Not to All
Disruption Continues to be
Widespread
Large Companies Beef up Balance
Sheets
Restaurant Industry Rallies
To Support Employees
• Restaurant companies of all sizes received CARES Act funding of up to$10 million
• However funding for the program ran out on April 16th leaving manyoperators out in the cold and the industry advocating for additionalfunding, in particular for independent restaurants
• Large restaurant companies have gone on the offensive to strengthenbalance sheets through drawdowns of revolver and new debt and equityissuances
• Notable financings announced from Landry’s, YUM!, Dave & Buster’s,Shake Shack, Cheesecake Factory and Darden
• Investor focus on liquidity likely indicates more public company financingsto come
• Massive unemployment across the industry impacting lives and broadereconomy
• Bankruptcies and permanent closures begin spreading
• M&A markets meaningfully disrupted including terminated TGI Fridaysmerger into a SPAC
• The restaurant industry has come together like never before to offersupport and assistance to industry employees experiencing extraordinaryhardship in the wake of the coronavirus outbreak. The following are just afew of many initiatives providing immediate relief to restaurant workers:James Beard foundation food & beverage industry relief fund,#restaurantrescue, #saverestaurants, ROAR (relief opportunities for allrestaurants) on change.org, CARES Act, Restaurant relief America
Investment Banking | Monthly Newsletter February 2016 | 1RESTAURANT INDUSTRY UPDATE | 2
Restaurant Industry Update
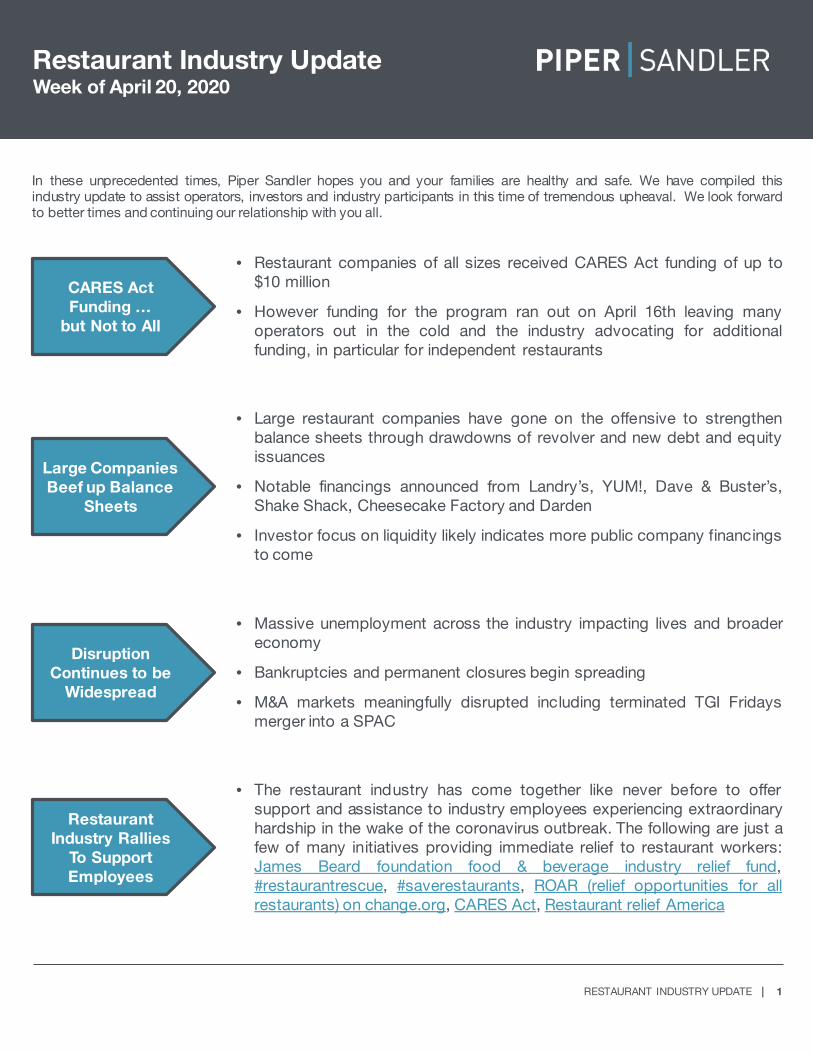
11.5% 10.0%
8.6% 9.9%
7.1%
4.7% 4.0% 5.1%
3.6%
0.2% 0.8% 1.5%
P1 P2 P3 Q1 20WING PZZA DPZ
(20% - 40%)
(40% - 50%)
(~80%)(80% - 90%)
Quick Service Fast Casual Casual Dining Fine Dining
(1) Wall Street equity research
Week of April 20, 2020
COVID-19’s Unprecedented Impact to the Restaurant Industry
Pizza and Wing Concepts SSS Performance (Franchise Q1 2020 SSS)
While the sales impact to Restaurants is severe, consumers are embracing off-premise in a bigway including Full Service and Fine Dining restaurants that may create a positive long-term saleslayer for these concepts
Estimated SSS Impact by Segment through May (1)
Pizza and Wing brands benefitting from delivery focus with closures of dining rooms
Casual Dining Concepts Growing Off-Premise Sales: AUV Off-Premise Sales Mix
18% 16% 10%
47%
30% 35%
Outback CAKE Chili's
Pre-COVID-19 Post-COVID-19
Investment Banking | Monthly Newsletter February 2016 | 1RESTAURANT INDUSTRY UPDATE | 3
Restaurant Industry Update
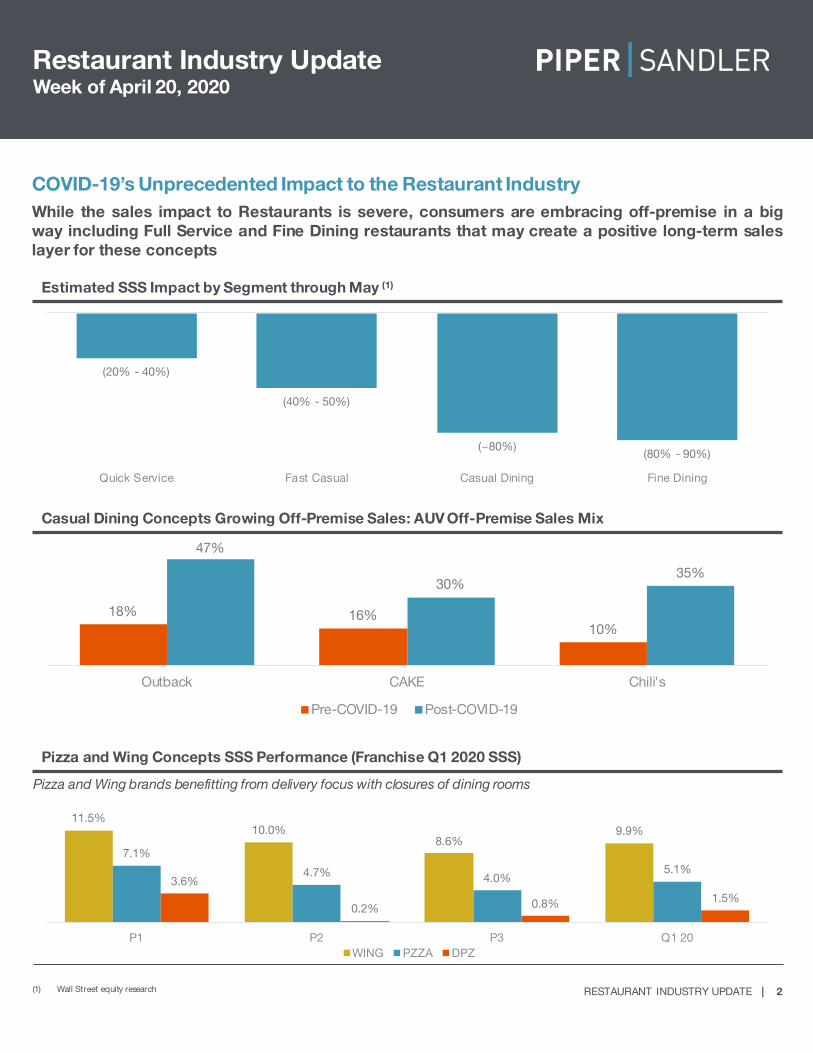
Source: Capital IQ as of 04/17/20(1) Quick Service Index includes: DPZ, DNKN, JACK, LOCO, MCD, PZZA, QSR, TACO, TAST, WEN, YUM(2) Fast Casual Index includes: CMG, FAT, FRGI, NDLS, PBPB, SBUX, SHAK, WING(3) Full Service Index includes: ARKR, BBQ, BJRI, BLMN, CAKE, CBRL, CHUY, DENN, DIN, DRI, EAT, JAX, KRUS, LUB, PLAY, RRGB, RUTH, STKS, TXRH(4) Per Wall Street consensus estimates; represents EBITDA after pre-opening and share-based compensation expense
COVID-19’s Unprecedented Impact to the Restaurant Industry (Cont.)
Relative Price Chart: 02/14/20 – 04/17/20 (1)(2)(3)
Median EV / EBITDA (1)(2)(3)(4)
Week of April 20, 2020
Investor reaction to public restaurant companies has been severe and well beyond the broader market despite a recentrebound in the past few days
COVID-19 impact on forward multiples by segment
25.3x
17.0x 15.1x 15.9x 15.2x
5.5x
Fast Casual Quick Service Full Service
CY2020 CY2021
25
50
75
100
125
2/14 2/23 3/3 3/12 3/21 3/30 4/8 4/17
Rel
ativ
e P
rice
S&P 500 Quick Service Fast Casual Full Service
(22.3%)
Full Service
(55.3%)
S&P 500
(15.0%)
Fast Casual
Quick Service
(20.2%)
Investment Banking | Monthly Newsletter February 2016 | 1RESTAURANT INDUSTRY UPDATE | 4
Restaurant Industry Update
Source: Capital IQ as of 02/14/20 and 04/17/20(1) Quick Service Index includes: DNKN, DPZ, JACK, LOCO, MCD, PZZA, QSR, TACO, TAST, WEN, YUM(2) Fast Casual Index includes: CMG, FAT, FRGI, NDLS, PBPB, SBUX, SHAK, WING(3) Per Wall Street consensus estimates; represents EBITDA after pre-opening and share-based compensation expense
Week of April 20, 2020
COVID-19’s Unprecedented Impact to the Restaurant Industry (Cont.)
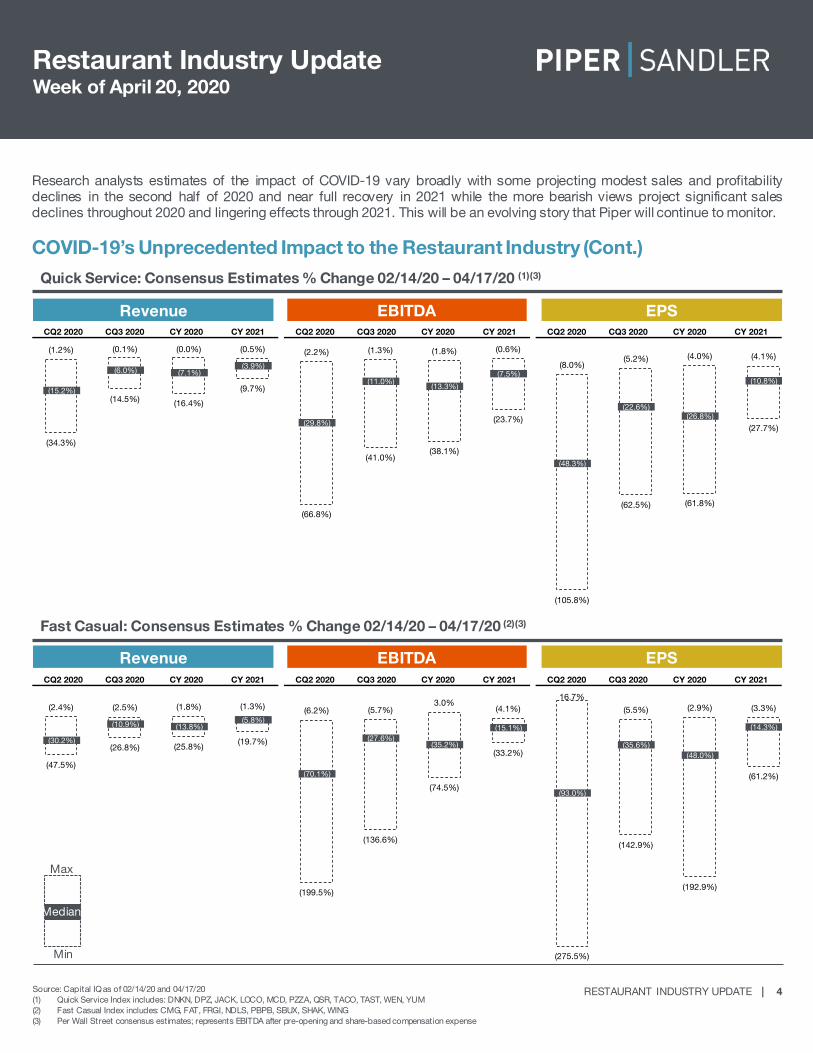
Research analysts estimates of the impact of COVID-19 vary broadly with some projecting modest sales and profitabilitydeclines in the second half of 2020 and near full recovery in 2021 while the more bearish views project significant salesdeclines throughout 2020 and lingering effects through 2021. This will be an evolving story that Piper will continue to monitor.
Quick Service: Consensus Estimates % Change 02/14/20 – 04/17/20 (1)(3)
Fast Casual: Consensus Estimates % Change 02/14/20 – 04/17/20 (2)(3)
Revenue EBITDA EPS
Revenue EBITDA EPS
Min
Max
Median
CQ2 2020 CQ3 2020 CY 2020 CY 2021 CQ2 2020 CQ3 2020 CY 2020 CY 2021 CQ2 2020 CQ3 2020 CY 2020 CY 2021
(1.2%) (0.1%) (0.0%) (0.5%) (2.2%) (1.3%) (1.8%) (0.6%)
(8.0%)(5.2%) (4.0%) (4.1%)
(34.3%)
(14.5%) (16.4%)
(9.7%)
(66.8%)
(41.0%)(38.1%)
(23.7%)
(105.8%)
(62.5%) (61.8%)
(27.7%)
(15.2%)
(6.0%) (7.1%)(3.9%)
(29.8%)
(11.0%)(13.3%)
(7.5%)
(48.3%)
(22.6%)(26.8%)
(10.8%)
CQ2 2020 CQ3 2020 CY 2020 CY 2021 CQ2 2020 CQ3 2020 CY 2020 CY 2021 CQ2 2020 CQ3 2020 CY 2020 CY 2021
(2.4%) (2.5%) (1.8%) (1.3%) (6.2%) (5.7%)3.0%
(4.1%)16.7%
(5.5%) (2.9%) (3.3%)
(47.5%)
(26.8%) (25.8%)(19.7%)
(199.5%)
(136.6%)
(74.5%)
(33.2%)
(275.5%)
(142.9%)
(192.9%)
(61.2%)
(30.2%)
(10.9%) (13.8%)(5.8%)
(70.1%)
(27.6%)(35.2%)
(15.1%)
(93.0%)
(35.6%)(48.0%)
(14.3%)

Investment Banking | Monthly Newsletter February 2016 | 1RESTAURANT INDUSTRY UPDATE | 5
Restaurant Industry Update
Source: Capital IQ as of 02/14/20 and 04/17/20(1) Casual Dining Index includes: BBQ, BJRI, BLMN, CAKE, CBRL, CHUY, DENN, DIN, DRI, EAT, JAX, KRUS, LUB, PLAY, RRGB, TXRH(2) Fine Dining Index includes: ARKR, RUTH, STKS(3) Per Wall Street consensus estimates; represents EBITDA after pre-opening and share-based compensation expense
Week of April 20, 2020
COVID-19’s Unprecedented Impact to the Restaurant Industry (Cont.)
Research analysts estimates of the impact of COVID-19 vary broadly with some projecting modest sales and profitabilitydeclines in the second half of 2020 and near full recovery in 2021 while the more bearish views project significant salesdeclines throughout 2020 and lingering effects through 2021. This will be an evolving story that Piper will continue to monitor.
Casual Dining: Consensus Estimates % Change 02/14/20 – 04/17/20 (1)(3)
Fine Dining: Consensus Estimates % Change 02/14/20 – 04/17/20 (2)(3)
Min
Max
Median
Revenue EBITDA EPS
Revenue EBITDA EPS
CQ2 2020 CQ3 2020 CY 2020 CY 2021 CQ2 2020 CQ3 2020 CY 2020 CY 2021 CQ2 2020 CQ3 2020 CY 2020 CY 2021
(7.0%) (3.3%) (1.9%) (1.2%)(19.8%) (16.6%) (8.5%) (1.4%)
(32.3%)
106.2%
(20.5%) (8.2%)
(80.6%)(49.8%) (52.3%)
(24.9%)
(309.5%)
(134.8%)(162.5%)
(32.5%)
(611.3%)(591.6%) (597.5%)
(149.4%)
(50.9%)(17.2%) (23.7%)
(7.4%)
(131.9%)
(58.5%) (68.9%)
(16.7%)
(227.3%)
(102.6%)(125.0%)
(28.1%)
CQ2 2020 CQ3 2020 CY 2020 CY 2021 CQ2 2020 CQ3 2020 CY 2020 CY 2021 CQ2 2020 CQ3 2020 CY 2020 CY 2021
(13.2%) (7.2%) (5.9%) (4.0%)
(37.0%) (31.9%)(16.2%) (9.1%)
(40.5%)(52.7%)
(19.4%) (13.3%)
(73.9%)
(39.2%) (41.1%)
(16.6%)
(112.3%)
(59.0%)(45.9%)
(34.5%)
(366.7%)
(261.9%)
(131.5%)
(94.2%)
(43.5%)
(23.2%) (23.5%)(10.3%)
(74.6%)
(45.4%)(31.1%)
(21.8%)
(203.6%)
(157.3%)
(75.5%)
(53.8%)
Investment Banking | Monthly Newsletter February 2016 | 1RESTAURANT INDUSTRY UPDATE | 6
Restaurant Industry Update
Source: Capital IQ as of 02/14/20 and 04/17/20(1) Quick Service Index includes: DNKN, DPZ, JACK, LOCO, MCD, PZZA, QSR, TACO, TAST, WEN, YUM(2) Fast Casual Index includes: CMG, FAT, FRGI, NDLS, PBPB, SBUX, SHAK, WING(3) Casual Dining Index includes: BBQ, BJRI, BLMN, CAKE, CBRL, CHUY, DENN, DIN, DRI, EAT, JAX, KRUS, LUB, PLAY, RRGB, TXRH(4) Fine Dining Index includes: ARKR, RUTH, STKS(5) Per Wall Street consensus estimates; represents EBITDA after pre-opening and share-based compensation expense
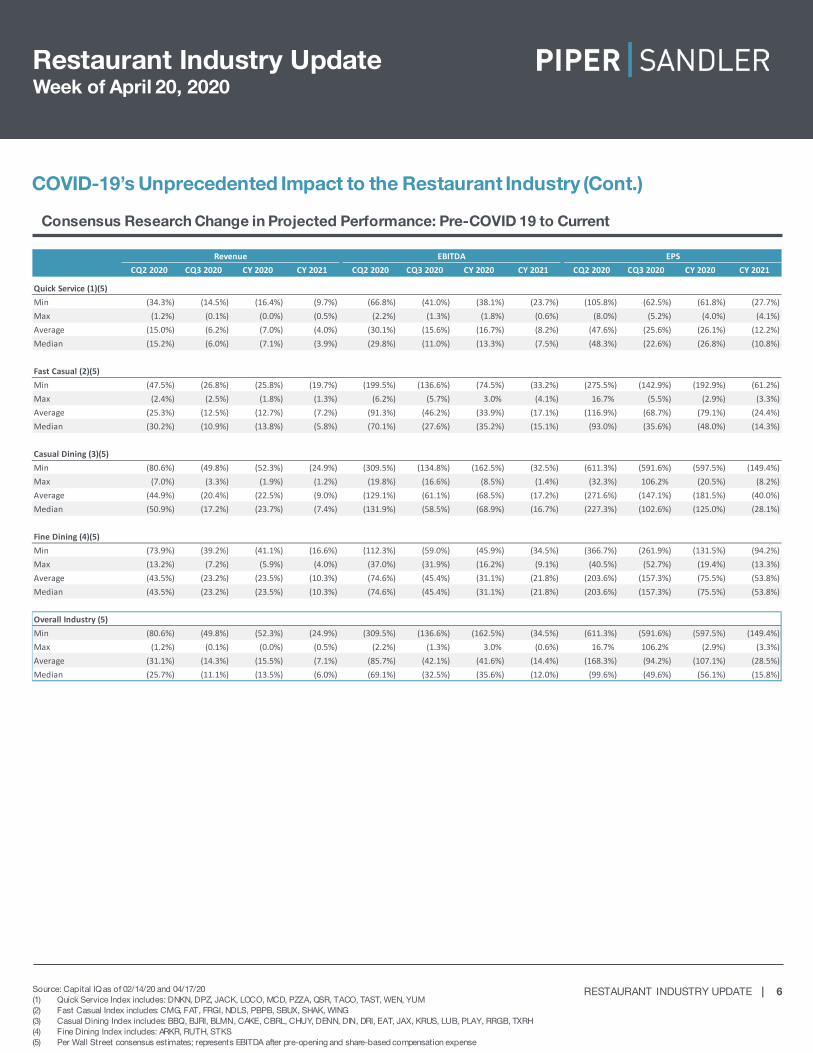
COVID-19’s Unprecedented Impact to the Restaurant Industry (Cont.)
Week of April 20, 2020
Consensus Research Change in Projected Performance: Pre-COVID 19 to Current
Revenue EBITDA EPSCQ2 2020 CQ3 2020 CY 2020 CY 2021 CQ2 2020 CQ3 2020 CY 2020 CY 2021 CQ2 2020 CQ3 2020 CY 2020 CY 2021
Quick Service (1)(5)Min (34.3%) (14.5%) (16.4%) (9.7%) (66.8%) (41.0%) (38.1%) (23.7%) (105.8%) (62.5%) (61.8%) (27.7%)Max (1.2%) (0.1%) (0.0%) (0.5%) (2.2%) (1.3%) (1.8%) (0.6%) (8.0%) (5.2%) (4.0%) (4.1%)Average (15.0%) (6.2%) (7.0%) (4.0%) (30.1%) (15.6%) (16.7%) (8.2%) (47.6%) (25.6%) (26.1%) (12.2%)Median (15.2%) (6.0%) (7.1%) (3.9%) (29.8%) (11.0%) (13.3%) (7.5%) (48.3%) (22.6%) (26.8%) (10.8%)
Fast Casual (2)(5)Min (47.5%) (26.8%) (25.8%) (19.7%) (199.5%) (136.6%) (74.5%) (33.2%) (275.5%) (142.9%) (192.9%) (61.2%)Max (2.4%) (2.5%) (1.8%) (1.3%) (6.2%) (5.7%) 3.0% (4.1%) 16.7% (5.5%) (2.9%) (3.3%)Average (25.3%) (12.5%) (12.7%) (7.2%) (91.3%) (46.2%) (33.9%) (17.1%) (116.9%) (68.7%) (79.1%) (24.4%)Median (30.2%) (10.9%) (13.8%) (5.8%) (70.1%) (27.6%) (35.2%) (15.1%) (93.0%) (35.6%) (48.0%) (14.3%)
Casual Dining (3)(5)Min (80.6%) (49.8%) (52.3%) (24.9%) (309.5%) (134.8%) (162.5%) (32.5%) (611.3%) (591.6%) (597.5%) (149.4%)Max (7.0%) (3.3%) (1.9%) (1.2%) (19.8%) (16.6%) (8.5%) (1.4%) (32.3%) 106.2% (20.5%) (8.2%)Average (44.9%) (20.4%) (22.5%) (9.0%) (129.1%) (61.1%) (68.5%) (17.2%) (271.6%) (147.1%) (181.5%) (40.0%)Median (50.9%) (17.2%) (23.7%) (7.4%) (131.9%) (58.5%) (68.9%) (16.7%) (227.3%) (102.6%) (125.0%) (28.1%)
Fine Dining (4)(5)Min (73.9%) (39.2%) (41.1%) (16.6%) (112.3%) (59.0%) (45.9%) (34.5%) (366.7%) (261.9%) (131.5%) (94.2%)Max (13.2%) (7.2%) (5.9%) (4.0%) (37.0%) (31.9%) (16.2%) (9.1%) (40.5%) (52.7%) (19.4%) (13.3%)Average (43.5%) (23.2%) (23.5%) (10.3%) (74.6%) (45.4%) (31.1%) (21.8%) (203.6%) (157.3%) (75.5%) (53.8%)Median (43.5%) (23.2%) (23.5%) (10.3%) (74.6%) (45.4%) (31.1%) (21.8%) (203.6%) (157.3%) (75.5%) (53.8%)
Overall Industry (5)Min (80.6%) (49.8%) (52.3%) (24.9%) (309.5%) (136.6%) (162.5%) (34.5%) (611.3%) (591.6%) (597.5%) (149.4%)Max (1.2%) (0.1%) (0.0%) (0.5%) (2.2%) (1.3%) 3.0% (0.6%) 16.7% 106.2% (2.9%) (3.3%)Average (31.1%) (14.3%) (15.5%) (7.1%) (85.7%) (42.1%) (41.6%) (14.4%) (168.3%) (94.2%) (107.1%) (28.5%)Median (25.7%) (11.1%) (13.5%) (6.0%) (69.1%) (32.5%) (35.6%) (12.0%) (99.6%) (49.6%) (56.1%) (15.8%)
Investment Banking | Monthly Newsletter February 2016 | 1RESTAURANT INDUSTRY UPDATE | 7
Restaurant Industry Update
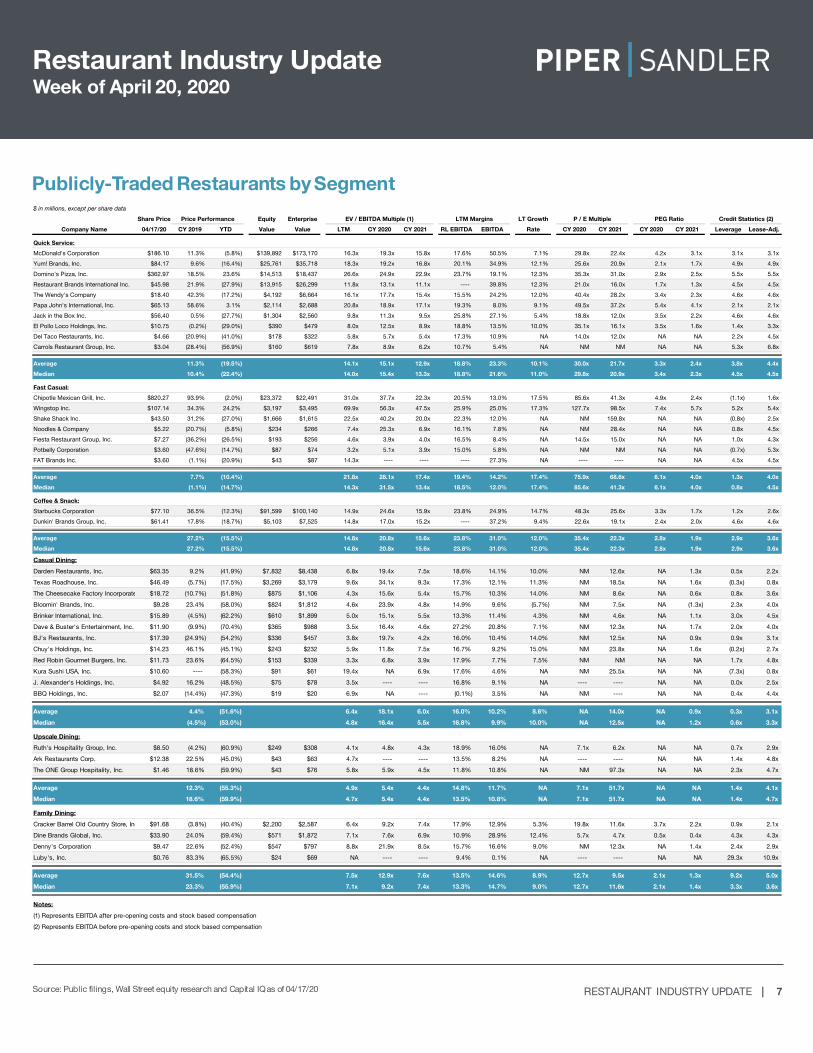
Publicly-Traded Restaurants by Segment
Source: Public filings, Wall Street equity research and Capital IQ as of 04/17/20
Week of April 20, 2020
$ in millions, except per share data
Share Price Price Performance Equity Enterprise EV / EBITDA Multiple (1) LTM Margins LT Growth P / E Multiple PEG Ratio Credit Statistics (2)
Company Name 04/17/20 CY 2019 YTD Value Value LTM CY 2020 CY 2021 RL EBITDA EBITDA Rate CY 2020 CY 2021 CY 2020 CY 2021 Leverage Lease-Adj.
Quick Service:
McDonald's Corporation $186.10 11.3% (5.8%) $139,892 $173,170 16.3x 19.3x 15.8x 17.6% 50.5% 7.1% 29.8x 22.4x 4.2x 3.1x 3.1x 3.1x
Yum! Brands, Inc. $84.17 9.6% (16.4%) $25,761 $35,718 18.3x 19.2x 16.8x 20.1% 34.9% 12.1% 25.6x 20.9x 2.1x 1.7x 4.9x 4.9x
Domino's Pizza, Inc. $362.97 18.5% 23.6% $14,513 $18,437 26.6x 24.9x 22.9x 23.7% 19.1% 12.3% 35.3x 31.0x 2.9x 2.5x 5.5x 5.5x
Restaurant Brands International Inc. $45.98 21.9% (27.9%) $13,915 $26,299 11.8x 13.1x 11.1x ---- 39.8% 12.3% 21.0x 16.0x 1.7x 1.3x 4.5x 4.5x
The Wendy's Company $18.40 42.3% (17.2%) $4,192 $6,664 16.1x 17.7x 15.4x 15.5% 24.2% 12.0% 40.4x 28.2x 3.4x 2.3x 4.6x 4.6x
Papa John's International, Inc. $65.13 58.6% 3.1% $2,114 $2,688 20.8x 18.9x 17.1x 19.3% 8.0% 9.1% 49.5x 37.2x 5.4x 4.1x 2.1x 2.1x
Jack in the Box Inc. $56.40 0.5% (27.7%) $1,304 $2,560 9.8x 11.3x 9.5x 25.8% 27.1% 5.4% 18.8x 12.0x 3.5x 2.2x 4.6x 4.6x
El Pollo Loco Holdings, Inc. $10.75 (0.2%) (29.0%) $390 $479 8.0x 12.5x 8.9x 18.8% 13.5% 10.0% 35.1x 16.1x 3.5x 1.6x 1.4x 3.3x
Del Taco Restaurants, Inc. $4.66 (20.9%) (41.0%) $178 $322 5.8x 5.7x 5.4x 17.3% 10.9% NA 14.0x 12.0x NA NA 2.2x 4.5x
Carrols Restaurant Group, Inc. $3.04 (28.4%) (56.9%) $160 $619 7.8x 8.9x 6.2x 10.7% 5.4% NA NM NM NA NA 5.3x 6.8x
Average 11.3% (19.5%) 14.1x 15.1x 12.9x 18.8% 23.3% 10.1% 30.0x 21.7x 3.3x 2.4x 3.8x 4.4x
Median 10.4% (22.4%) 14.0x 15.4x 13.3x 18.8% 21.6% 11.0% 29.8x 20.9x 3.4x 2.3x 4.5x 4.5x
Fast Casual:
Chipotle Mexican Grill, Inc. $820.27 93.9% (2.0%) $23,372 $22,491 31.0x 37.7x 22.3x 20.5% 13.0% 17.5% 85.6x 41.3x 4.9x 2.4x (1.1x) 1.6x
Wingstop Inc. $107.14 34.3% 24.2% $3,197 $3,495 69.9x 56.3x 47.5x 25.9% 25.0% 17.3% 127.7x 98.5x 7.4x 5.7x 5.2x 5.4x
Shake Shack Inc. $43.50 31.2% (27.0%) $1,666 $1,615 22.5x 40.2x 20.0x 22.3% 12.0% NA NM 159.8x NA NA (0.8x) 2.5x
Noodles & Company $5.22 (20.7%) (5.8%) $234 $266 7.4x 25.3x 6.9x 16.1% 7.8% NA NM 28.4x NA NA 0.8x 4.5x
Fiesta Restaurant Group, Inc. $7.27 (36.2%) (26.5%) $193 $256 4.6x 3.9x 4.0x 16.5% 8.4% NA 14.5x 15.0x NA NA 1.0x 4.3x
Potbelly Corporation $3.60 (47.6%) (14.7%) $87 $74 3.2x 5.1x 3.9x 15.0% 5.8% NA NM NM NA NA (0.7x) 5.3x
FAT Brands Inc. $3.60 (1.1%) (20.9%) $43 $87 14.3x ---- ---- ---- 27.3% NA ---- ---- NA NA 4.5x 4.5x
Average 7.7% (10.4%) 21.8x 28.1x 17.4x 19.4% 14.2% 17.4% 75.9x 68.6x 6.1x 4.0x 1.3x 4.0x
Median (1.1%) (14.7%) 14.3x 31.5x 13.4x 18.5% 12.0% 17.4% 85.6x 41.3x 6.1x 4.0x 0.8x 4.5x
Coffee & Snack:
Starbucks Corporation $77.10 36.5% (12.3%) $91,599 $100,140 14.9x 24.6x 15.9x 23.8% 24.9% 14.7% 48.3x 25.6x 3.3x 1.7x 1.2x 2.6x
Dunkin' Brands Group, Inc. $61.41 17.8% (18.7%) $5,103 $7,525 14.8x 17.0x 15.2x ---- 37.2% 9.4% 22.6x 19.1x 2.4x 2.0x 4.6x 4.6x
Average 27.2% (15.5%) 14.8x 20.8x 15.6x 23.8% 31.0% 12.0% 35.4x 22.3x 2.8x 1.9x 2.9x 3.6x
Median 27.2% (15.5%) 14.8x 20.8x 15.6x 23.8% 31.0% 12.0% 35.4x 22.3x 2.8x 1.9x 2.9x 3.6x
Casual Dining:
Darden Restaurants, Inc. $63.35 9.2% (41.9%) $7,832 $8,438 6.8x 19.4x 7.5x 18.6% 14.1% 10.0% NM 12.6x NA 1.3x 0.5x 2.2x
Texas Roadhouse, Inc. $46.49 (5.7%) (17.5%) $3,269 $3,179 9.6x 34.1x 9.3x 17.3% 12.1% 11.3% NM 18.5x NA 1.6x (0.3x) 0.8x
The Cheesecake Factory Incorporate $18.72 (10.7%) (51.8%) $875 $1,106 4.3x 15.6x 5.4x 15.7% 10.3% 14.0% NM 8.6x NA 0.6x 0.8x 3.6x
Bloomin' Brands, Inc. $9.28 23.4% (58.0%) $824 $1,812 4.6x 23.9x 4.8x 14.9% 9.6% (5.7%) NM 7.5x NA (1.3x) 2.3x 4.0x
Brinker International, Inc. $15.89 (4.5%) (62.2%) $610 $1,899 5.0x 15.1x 5.5x 13.3% 11.4% 4.3% NM 4.6x NA 1.1x 3.0x 4.5x
Dave & Buster's Entertainment, Inc. $11.90 (9.9%) (70.4%) $365 $988 3.5x 16.4x 4.6x 27.2% 20.8% 7.1% NM 12.3x NA 1.7x 2.0x 4.0x
BJ's Restaurants, Inc. $17.39 (24.9%) (54.2%) $336 $457 3.8x 19.7x 4.2x 16.0% 10.4% 14.0% NM 12.5x NA 0.9x 0.9x 3.1x
Chuy's Holdings, Inc. $14.23 46.1% (45.1%) $243 $232 5.9x 11.8x 7.5x 16.7% 9.2% 15.0% NM 23.8x NA 1.6x (0.2x) 2.7x
Red Robin Gourmet Burgers, Inc. $11.73 23.6% (64.5%) $153 $339 3.3x 6.8x 3.9x 17.9% 7.7% 7.5% NM NM NA NA 1.7x 4.8x
Kura Sushi USA, Inc. $10.60 ---- (58.3%) $91 $61 19.4x NA 6.9x 17.6% 4.6% NA NM 25.5x NA NA (7.3x) 0.8x
J. Alexander's Holdings, Inc. $4.92 16.2% (48.5%) $75 $78 3.5x ---- ---- 16.8% 9.1% NA ---- ---- NA NA 0.0x 2.5x
BBQ Holdings, Inc. $2.07 (14.4%) (47.3%) $19 $20 6.9x NA ---- (0.1%) 3.5% NA NM ---- NA NA 0.4x 4.4x
Average 4.4% (51.6%) 6.4x 18.1x 6.0x 16.0% 10.2% 8.6% NA 14.0x NA 0.9x 0.3x 3.1x
Median (4.5%) (53.0%) 4.8x 16.4x 5.5x 16.8% 9.9% 10.0% NA 12.5x NA 1.2x 0.6x 3.3x
Upscale Dining:
Ruth's Hospitality Group, Inc. $8.50 (4.2%) (60.9%) $249 $308 4.1x 4.8x 4.3x 18.9% 16.0% NA 7.1x 6.2x NA NA 0.7x 2.9x
Ark Restaurants Corp. $12.38 22.5% (45.0%) $43 $63 4.7x ---- ---- 13.5% 8.2% NA ---- ---- NA NA 1.4x 4.8x
The ONE Group Hospitality, Inc. $1.46 18.6% (59.9%) $43 $76 5.8x 5.9x 4.5x 11.8% 10.8% NA NM 97.3x NA NA 2.3x 4.7x
Average 12.3% (55.3%) 4.9x 5.4x 4.4x 14.8% 11.7% NA 7.1x 51.7x NA NA 1.4x 4.1x
Median 18.6% (59.9%) 4.7x 5.4x 4.4x 13.5% 10.8% NA 7.1x 51.7x NA NA 1.4x 4.7x
Family Dining:
Cracker Barrel Old Country Store, Inc $91.68 (3.8%) (40.4%) $2,200 $2,587 6.4x 9.2x 7.4x 17.9% 12.9% 5.3% 19.8x 11.6x 3.7x 2.2x 0.9x 2.1x
Dine Brands Global, Inc. $33.90 24.0% (59.4%) $571 $1,872 7.1x 7.6x 6.9x 10.9% 28.9% 12.4% 5.7x 4.7x 0.5x 0.4x 4.3x 4.3x
Denny's Corporation $9.47 22.6% (52.4%) $547 $797 8.8x 21.9x 8.5x 15.7% 16.6% 9.0% NM 12.3x NA 1.4x 2.4x 2.9x
Luby's, Inc. $0.76 83.3% (65.5%) $24 $69 NA ---- ---- 9.4% 0.1% NA ---- ---- NA NA 29.3x 10.9x
Average 31.5% (54.4%) 7.5x 12.9x 7.6x 13.5% 14.6% 8.9% 12.7x 9.5x 2.1x 1.3x 9.2x 5.0x
Median 23.3% (55.9%) 7.1x 9.2x 7.4x 13.3% 14.7% 9.0% 12.7x 11.6x 2.1x 1.4x 3.3x 3.6x
Notes:
(1) Represents EBITDA after pre-opening costs and stock based compensation
(2) Represents EBITDA before pre-opening costs and stock based compensation
Investment Banking | Monthly Newsletter February 2016 | 1RESTAURANT INDUSTRY UPDATE | 8
Restaurant Industry Update
0
1,000
2,000
3,000
4,000
Jan-05 May-06 Oct-07 Mar-09 Jul-10 Dec-11 May-13 Sep-14 Feb-16 Jun-17 Nov-18 Apr-20
S&P 500
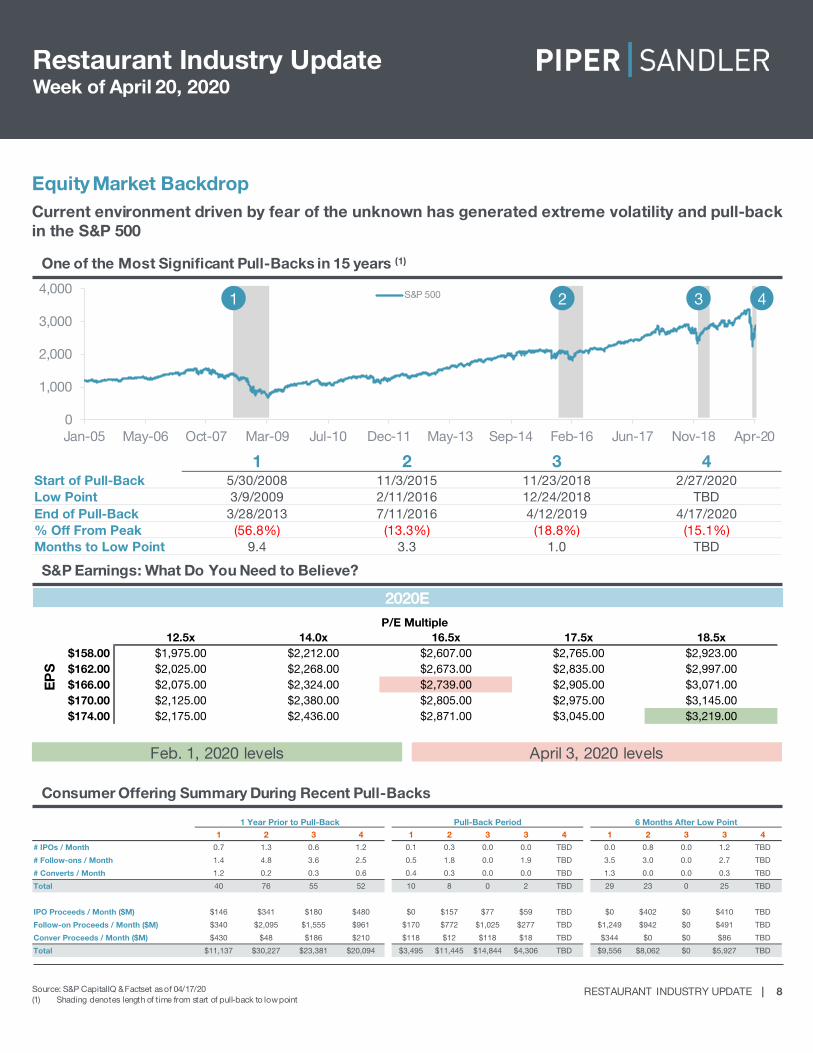
Current environment driven by fear of the unknown has generated extreme volatility and pull-backin the S&P 500
Source: S&P CapitalIQ & Factset as of 04/17/20(1) Shading denotes length of time from start of pull-back to low point
Week of April 20, 2020
Equity Market Backdrop
One of the Most Significant Pull-Backs in 15 years (1)
S&P Earnings: What Do You Need to Believe?
1 2 3 4
EP
S
2020E
April 3, 2020 levelsFeb. 1, 2020 levels
P/E Multiple12.5x 14.0x 16.5x 17.5x 18.5x
$158.00 $1,975.00 $2,212.00 $2,607.00 $2,765.00 $2,923.00$162.00 $2,025.00 $2,268.00 $2,673.00 $2,835.00 $2,997.00$166.00 $2,075.00 $2,324.00 $2,739.00 $2,905.00 $3,071.00$170.00 $2,125.00 $2,380.00 $2,805.00 $2,975.00 $3,145.00$174.00 $2,175.00 $2,436.00 $2,871.00 $3,045.00 $3,219.00
Consumer Offering Summary During Recent Pull-Backs
1 Year Prior to Pull-Back Pull-Back Period 6 Months After Low Point1 2 3 4 1 2 3 3 4 1 2 3 3 4
# IPOs / Month 0.7 1.3 0.6 1.2 0.1 0.3 0.0 0.0 TBD 0.0 0.8 0.0 1.2 TBD
# Follow-ons / Month 1.4 4.8 3.6 2.5 0.5 1.8 0.0 1.9 TBD 3.5 3.0 0.0 2.7 TBD
# Converts / Month 1.2 0.2 0.3 0.6 0.4 0.3 0.0 0.0 TBD 1.3 0.0 0.0 0.3 TBD
Total 40 76 55 52 10 8 0 2 TBD 29 23 0 25 TBD
IPO Proceeds / Month ($M) $146 $341 $180 $480 $0 $157 $77 $59 TBD $0 $402 $0 $410 TBD
Follow-on Proceeds / Month ($M) $340 $2,095 $1,555 $961 $170 $772 $1,025 $277 TBD $1,249 $942 $0 $491 TBD
Conver Proceeds / Month ($M) $430 $48 $186 $210 $118 $12 $118 $18 TBD $344 $0 $0 $86 TBD
Total $11,137 $30,227 $23,381 $20,094 $3,495 $11,445 $14,844 $4,306 TBD $9,556 $8,062 $0 $5,927 TBD
1 2 3 4Start of Pull-Back 5/30/2008 11/3/2015 11/23/2018 2/27/2020Low Point 3/9/2009 2/11/2016 12/24/2018 TBDEnd of Pull-Back 3/28/2013 7/11/2016 4/12/2019 4/17/2020% Off From Peak (56.8%) (13.3%) (18.8%) (15.1%)Months to Low Point 9.4 3.3 1.0 TBD
Investment Banking | Monthly Newsletter February 2016 | 1RESTAURANT INDUSTRY UPDATE | 9
Restaurant Industry Update
0
1,000
2,000
3,000
4,000
5,000
6,000
7,000
8,000
Jan-67 Nov-75 Sep-84 Aug-93 Jun-02 May-11 Mar-20
$0.00
$40.00
$80.00
$120.00
$160.00
Jan-08 Jan-10 Jan-12 Feb-14 Feb-16 Mar-18 Mar-20
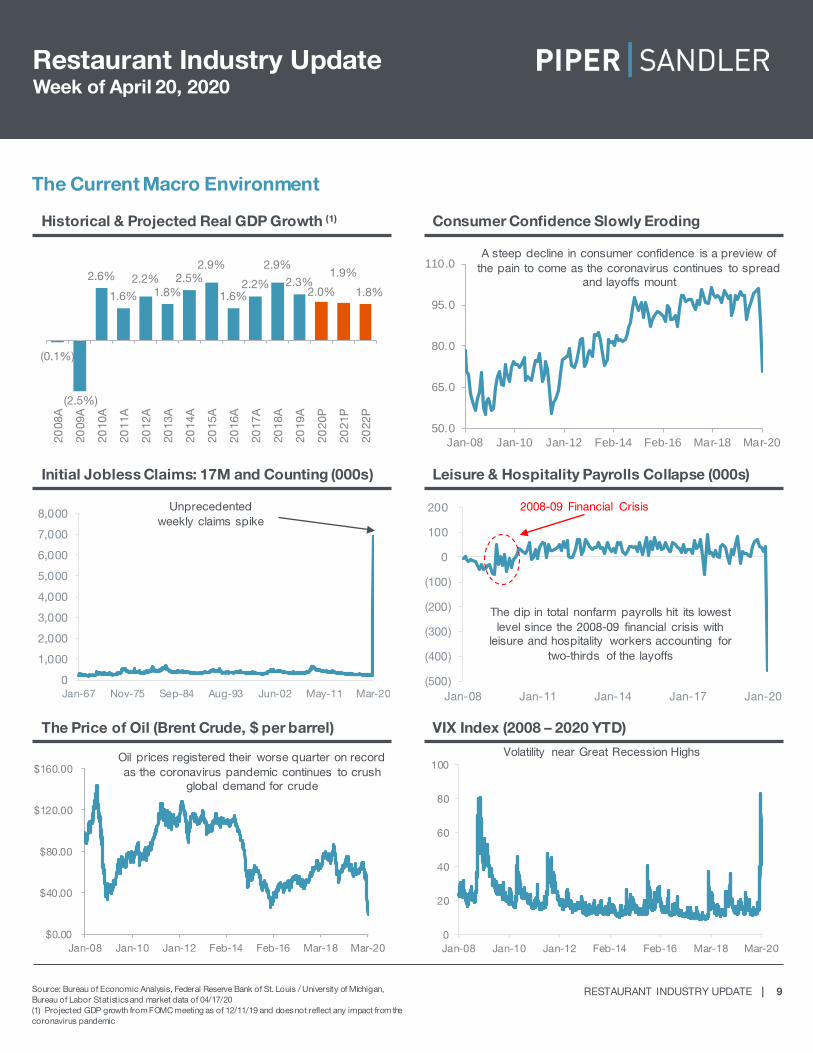
Source: Bureau of Economic Analysis, Federal Reserve Bank of St. Louis / University of Michigan, Bureau of Labor Statistics and market data of 04/17/20(1) Projected GDP growth from FOMC meeting as of 12/11/19 and does not reflect any impact from the coronavirus pandemic
Week of April 20, 2020
The Current Macro Environment
Historical & Projected Real GDP Growth (1) Consumer Confidence Slowly Eroding
Initial Jobless Claims: 17M and Counting (000s) Leisure & Hospitality Payrolls Collapse (000s)
The Price of Oil (Brent Crude, $ per barrel) VIX Index (2008 – 2020 YTD)
(0.1%)
(2.5%)
2.6%
1.6%
2.2% 1.8%
2.5% 2.9%
1.6% 2.2%
2.9%
2.3% 2.0%
1.9%
1.8%
2008
A
2009
A
2010
A
2011
A
2012
A
2013
A
2014
A
2015
A
2016
A
2017
A
2018
A
2019
A
2020
P
2021
P
2022
P
Unprecedentedweekly claims spike
Volatility near Great Recession HighsOil prices registered their worse quarter on record as the coronavirus pandemic continues to crush
global demand for crude
50.0
65.0
80.0
95.0
110.0
Jan-08 Jan-10 Jan-12 Feb-14 Feb-16 Mar-18 Mar-20
A steep decline in consumer confidence is a preview of the pain to come as the coronavirus continues to spread
and layoffs mount
(500)
(400)
(300)
(200)
(100)
0
100
200
Jan-08 Jan-11 Jan-14 Jan-17 Jan-20
The dip in total nonfarm payrolls hit its lowest level since the 2008-09 financial crisis with
leisure and hospitality workers accounting for two-thirds of the layoffs
2008-09 Financial Crisis
0
20
40
60
80
100
Jan-08 Jan-10 Jan-12 Feb-14 Feb-16 Mar-18 Mar-20
Investment Banking | Monthly Newsletter February 2016 | 1RESTAURANT INDUSTRY UPDATE | 10
Restaurant Industry Update
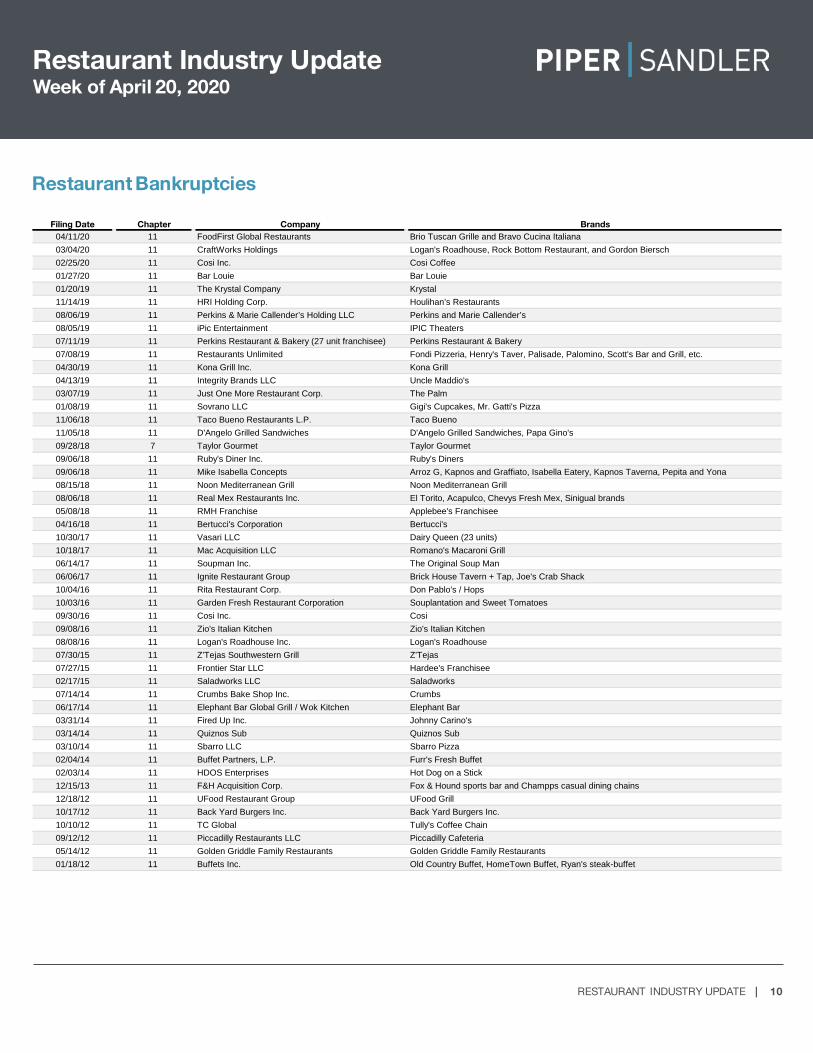
Restaurant Bankruptcies
Week of April 20, 2020
Filing Date Chapter Company Brands04/11/20 11 FoodFirst Global Restaurants Brio Tuscan Grille and Bravo Cucina Italiana03/04/20 11 CraftWorks Holdings Logan's Roadhouse, Rock Bottom Restaurant, and Gordon Biersch02/25/20 11 Cosi Inc. Cosi Coffee01/27/20 11 Bar Louie Bar Louie01/20/19 11 The Krystal Company Krystal11/14/19 11 HRI Holding Corp. Houlihan’s Restaurants08/06/19 11 Perkins & Marie Callender’s Holding LLC Perkins and Marie Callender’s08/05/19 11 iPic Entertainment IPIC Theaters07/11/19 11 Perkins Restaurant & Bakery (27 unit franchisee) Perkins Restaurant & Bakery07/08/19 11 Restaurants Unlimited Fondi Pizzeria, Henry's Taver, Palisade, Palomino, Scott's Bar and Grill, etc.04/30/19 11 Kona Grill Inc. Kona Grill04/13/19 11 Integrity Brands LLC Uncle Maddio's03/07/19 11 Just One More Restaurant Corp. The Palm01/08/19 11 Sovrano LLC Gigi's Cupcakes, Mr. Gatti's Pizza11/06/18 11 Taco Bueno Restaurants L.P. Taco Bueno11/05/18 11 D'Angelo Grilled Sandwiches D'Angelo Grilled Sandwiches, Papa Gino's09/28/18 7 Taylor Gourmet Taylor Gourmet09/06/18 11 Ruby's Diner Inc. Ruby's Diners09/06/18 11 Mike Isabella Concepts Arroz G, Kapnos and Graffiato, Isabella Eatery, Kapnos Taverna, Pepita and Yona08/15/18 11 Noon Mediterranean Grill Noon Mediterranean Grill08/06/18 11 Real Mex Restaurants Inc. El Torito, Acapulco, Chevys Fresh Mex, Sinigual brands05/08/18 11 RMH Franchise Applebee's Franchisee04/16/18 11 Bertucci's Corporation Bertucci's10/30/17 11 Vasari LLC Dairy Queen (23 units)10/18/17 11 Mac Acquisition LLC Romano's Macaroni Grill06/14/17 11 Soupman Inc. The Original Soup Man06/06/17 11 Ignite Restaurant Group Brick House Tavern + Tap, Joe's Crab Shack10/04/16 11 Rita Restaurant Corp. Don Pablo's / Hops10/03/16 11 Garden Fresh Restaurant Corporation Souplantation and Sweet Tomatoes09/30/16 11 Cosi Inc. Cosi09/08/16 11 Zio's Italian Kitchen Zio's Italian Kitchen08/08/16 11 Logan's Roadhouse Inc. Logan's Roadhouse07/30/15 11 Z'Tejas Southwestern Grill Z'Tejas07/27/15 11 Frontier Star LLC Hardee's Franchisee02/17/15 11 Saladworks LLC Saladworks07/14/14 11 Crumbs Bake Shop Inc. Crumbs06/17/14 11 Elephant Bar Global Grill / Wok Kitchen Elephant Bar03/31/14 11 Fired Up Inc. Johnny Carino's03/14/14 11 Quiznos Sub Quiznos Sub03/10/14 11 Sbarro LLC Sbarro Pizza02/04/14 11 Buffet Partners, L.P. Furr's Fresh Buffet02/03/14 11 HDOS Enterprises Hot Dog on a Stick12/15/13 11 F&H Acquisition Corp. Fox & Hound sports bar and Champps casual dining chains12/18/12 11 UFood Restaurant Group UFood Grill10/17/12 11 Back Yard Burgers Inc. Back Yard Burgers Inc.10/10/12 11 TC Global Tully's Coffee Chain09/12/12 11 Piccadilly Restaurants LLC Piccadilly Cafeteria05/14/12 11 Golden Griddle Family Restaurants Golden Griddle Family Restaurants01/18/12 11 Buffets Inc. Old Country Buffet, HomeTown Buffet, Ryan's steak-buffet
Investment Banking | Monthly Newsletter February 2016 | 1RESTAURANT INDUSTRY UPDATE | 11
Restaurant Industry Update
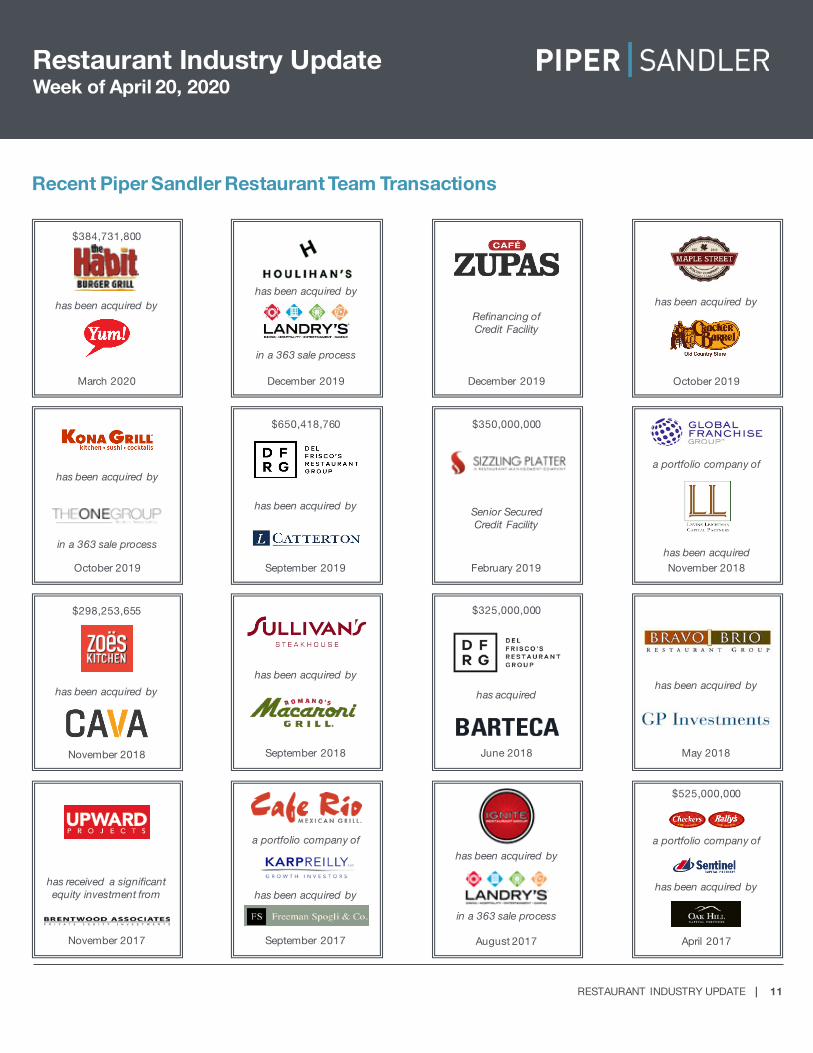
Recent Piper Sandler Restaurant Team Transactions
has been acquiredNovember 2018
a portfolio company of
has been acquired by
May 2018
$525,000,000
has been acquired by
April 2017
a portfolio company of
has been acquired by
October 2019
$350,000,000
Senior Secured Credit Facility
February 2019
$325,000,000
has acquired
June 2018
August 2017
has been acquired by
in a 363 sale process
Refinancing of Credit Facility
December 2019
$650,418,760
has been acquired by
September 2019
September 2018
has been acquired by
September 2017
a portfolio company of
has been acquired by
December 2019
has been acquired by
in a 363 sale process
October 2019
has been acquired by
in a 363 sale process
$298,253,655
has been acquired by
November 2018
November 2017
has received a significant equity investment from
has been acquired by
$384,731,800
March 2020
Week of April 20, 2020
Investment Banking | Monthly Newsletter February 2016 | 1RESTAURANT INDUSTRY UPDATE | 12
Restaurant Industry Update
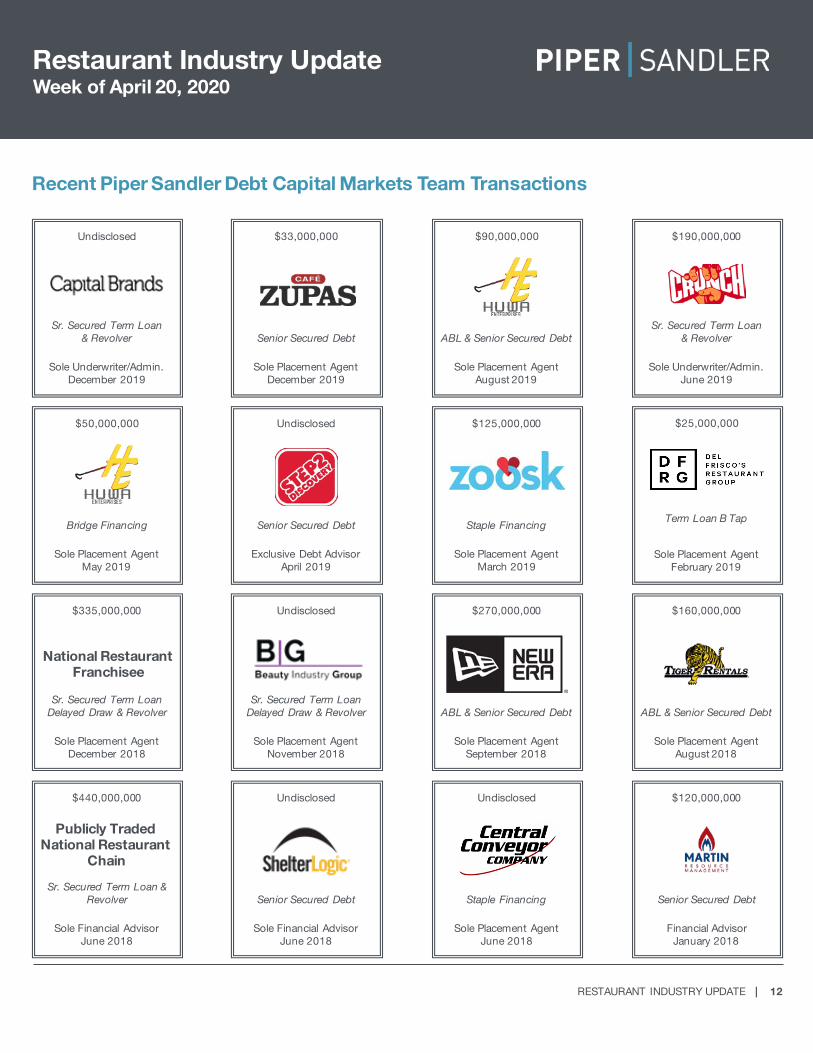
Recent Piper Sandler Debt Capital Markets Team Transactions
Week of April 20, 2020
Senior Secured Debt
$33,000,000
Sole Placement AgentDecember 2019
Senior Secured Debt
Undisclosed
Exclusive Debt AdvisorApril 2019
Sr. Secured Term LoanDelayed Draw & Revolver
Undisclosed
Sole Placement AgentNovember 2018
Senior Secured Debt
Undisclosed
Sole Financial AdvisorJune 2018
ABL & Senior Secured Debt
$90,000,000
Sole Placement AgentAugust 2019
ABL & Senior Secured Debt
$270,000,000
Sole Placement AgentSeptember 2018
Staple Financing
$125,000,000
Sole Placement AgentMarch 2019
Staple Financing
Undisclosed
Sole Placement AgentJune 2018
Bridge Financing
$50,000,000
Sole Placement AgentMay 2019
Sr. Secured Term LoanDelayed Draw & Revolver
$335,000,000
Sole Placement AgentDecember 2018
National Restaurant Franchisee
Sr. Secured Term Loan & Revolver
$440,000,000
Sole Financial AdvisorJune 2018
Publicly Traded National Restaurant
Chain
Sr. Secured Term Loan& Revolver
Undisclosed
Sole Underwriter/Admin.December 2019
Sr. Secured Term Loan& Revolver
$190,000,000
Sole Underwriter/Admin.June 2019
$25,000,000
Sole Placement AgentFebruary 2019
Term Loan B Tap
ABL & Senior Secured Debt
$160,000,000
Sole Placement AgentAugust 2018
Senior Secured Debt
$120,000,000
Financial AdvisorJanuary 2018
Investment Banking | Monthly Newsletter February 2016 | 1RESTAURANT INDUSTRY UPDATE | 13
Restaurant Industry Update
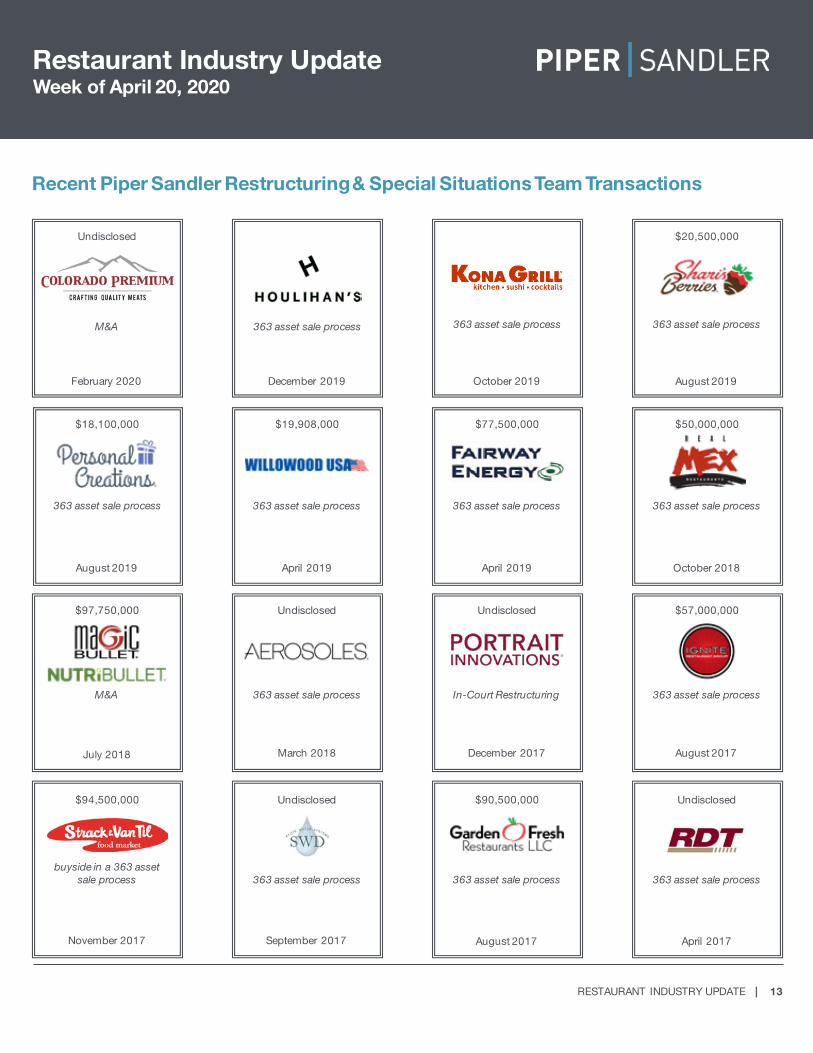
Recent Piper Sandler Restructuring & Special Situations Team Transactions
Week of April 20, 2020
August 2019
363 asset sale process
$97,750,000
M&A
July 2018
November 2017
M&A
Undisclosed
February 2020
$18,100,000
$94,500,000
buyside in a 363 asset sale process
$77,500,000
April 2019
Undisclosed
In-Court Restructuring
December 2017
August 2017
October 2019
363 asset sale process
363 asset sale process
$90,500,000
363 asset sale process
October 2018
363 asset sale process
August 2017
Undisclosed
April 2017
363 asset sale process
August 2019
$20,500,000
363 asset sale process
$50,000,000
$57,000,000
363 asset sale process
$19,908,000
363 asset sale process
April 2019
March 2018
363 asset sale process
September 2017
December 2019
363 asset sale process
Undisclosed
363 asset sale process
Undisclosed
Investment Banking | Monthly Newsletter February 2016 | 1RESTAURANT INDUSTRY UPDATE | 14
Restaurant Industry Update
DISCLOSURES
Research Independence
• Our research analysts are independent from our investment bankers and develop their opinions based on the results and merits of a covered company
• Our research analysts, together with research management, make their own coverage decisions, including decisions to initiate or terminate coverage. Our investment bankers do not have any input into company- specific coverage decisions
• Piper Sandler does not offer favorable research or specific ratings or price targets in consideration of, or as an inducementfor, investment banking business
• Our research analysts do not participate in efforts to solicit investment banking business
General
• Piper Sandler Companies (NYSE: PIPR) is an investment bank and asset management firm headquartered in Minneapolis with offices across the U.S., London and Hong Kong
• Securities brokerage and investment banking services are offered in the United States through Piper Sandler & Co., member NYSE and SIPC, in Europe through Piper Sandler Ltd., authorized and regulated by the Financial Conduct Authority, and in Hong Kong through Piper Sandler Hong Kong, authorized and regulated by the Securities and Futures Commission
• Asset management products and services are offered through three separate investment advisory affiliates. U.S. Securities and Exchange Commission (SEC) registered Piper Sandler Investment Management LLC, PSC Capital Partners LLC, and Piper Sandler & Co.
PIPER SANDLER RESTAURANT INVESTMENT BANKING TEAM
DAMON CHANDIKHead of Consumer Group+1 650 [email protected]
CARLOS SANCHEZManaging Director+1 415 [email protected]
KIMBERLY WASLEYDirector+1 415 [email protected]
JUSTIN WALTERSAssociate+1 704 [email protected]
AIMEE SQUIRESSenior Analyst+1 415 [email protected]
CJ NOVOGRADACAnalyst+1 415 [email protected]
PIPER SANDLER PRODUCT COVERAGE TEAM
LEN SHEERHead of Capital AdvisoryManaging Director+1 212 [email protected]
TERI STRATTONRestructuring & Special SituationsManaging Director+1 310 [email protected]
JEAN HOSTYRestructuring & Special SituationsManaging Director+1 312 [email protected]
JOEL SCHNEIDEREquity Capital MarketsManaging Director+1 212 [email protected]
Week of April 20, 2020