Responsive Environments, Place and Presence · Responsive Environments, Place and Presence 36 place...
39
PsychNology Journal, 2005 Volume 3, Number 1, 35 – 73 35 Responsive Environments, Place and Presence Rod McCall , Shaleph O’Neill , Fiona Carroll , David Benyon , Michael Smyth Napier University, Edinburgh, UK ABSTRACT This paper examines the effect that changing arena (i.e. an immersive CAVE or head mounted display) and adding an augmented barrier has on the sense of place and presence in two photo-realistic virtual environments. Twenty eight subjects (17 male, 11 female) mainly undergraduate students or staff took part. The paper summarises two experiments that used a range of data capture methods including the place probe, semantic differentials, distance estimates and the MEC Questionnaire. The results indicate that in non-interactive photo-realistic environments the choice of arena has an impact on the perceived ability to undertake actions, and hence sense of place and presence; with the CAVE providing a lower sense of spatial presence for certain aspects than the HMD. Keywords: presence, place, CAVE, HMD. Received 18 February 2005; received in revised form 09 April 2005; accepted 11 April 2005. Introduction This paper explores how sense of place and presence is altered by changing the arena in which a virtual environment is displayed and how it is affected by the use of graphical augmentations. An empirical study was undertaken that compared two arenas: a fully immersive, six-sided cubicle (a CAVE) and a Head Mounted Display (HMD). Both displayed a variety of scenes using a photo-realistic display known as image based rendering (IBR). The technology explored in this study is based around the idea of capturing photographic images of a real world location or place. The photographs are then processed and rendered in a virtual environment arena. A key part of the user experience of such an environment is an individual’s sense of place (Relph, 1976; Tuan, 1977). Our previous work explored the comparison of sense of place between real and virtual environments (McCall et al., 2004) and how to capture the sense of Corresponding Author: Rod McCall Napier University, Edinburgh, UK. E-mail: [email protected]
Transcript of Responsive Environments, Place and Presence · Responsive Environments, Place and Presence 36 place...

PsychNology Journal, 2005 Volume 3, Number 1, 35 – 73
35
Responsive Environments, Place and Presence
Rod McCall , Shaleph O’Neill , Fiona Carroll , David Benyon ,
Michael Smyth
Napier University,Edinburgh, UK
ABSTRACT
This paper examines the effect that changing arena (i.e. an immersive CAVE or head mounted display) and adding an augmented barrier has on the sense of place and presence in two photo-realistic virtual environments. Twenty eight subjects (17 male, 11 female) mainly undergraduate students or staff took part. The paper summarises two experiments that used a range of data capture methods including the place probe, semantic differentials, distance estimates and the MEC Questionnaire. The results indicate that in non-interactive photo-realistic environments the choice of arena has an impact on the perceived ability to undertake actions, and hence sense of place and presence; with the CAVE providing a lower sense of spatial presence for certain aspects than the HMD.
Keywords: presence, place, CAVE, HMD.
Received 18 February 2005; received in revised form 09 April 2005; accepted 11 April 2005.
Introduction
This paper explores how sense of place and presence is altered by changing the
arena in which a virtual environment is displayed and how it is affected by the use of
graphical augmentations. An empirical study was undertaken that compared two
arenas: a fully immersive, six-sided cubicle (a CAVE) and a Head Mounted Display
(HMD). Both displayed a variety of scenes using a photo-realistic display known as
image based rendering (IBR).
The technology explored in this study is based around the idea of capturing
photographic images of a real world location or place. The photographs are then
processed and rendered in a virtual environment arena. A key part of the user
experience of such an environment is an individual’s sense of place (Relph, 1976;
Tuan, 1977). Our previous work explored the comparison of sense of place between
real and virtual environments (McCall et al., 2004) and how to capture the sense of
Corresponding Author: Rod McCall Napier University, Edinburgh, UK. E-mail: [email protected]

Responsive Environments, Place and Presence
36
place (O'Neill et al., 2004; McCall et al., 2004) so that designers can better design the
virtual experience. As a result we became interested in how sense of place changes
when the arenas are changed, or when aspects of the scene are changed, for example
through the use of graphical augmentations of the photo-realistic scene. Our research
was also driven by the need to provide information that could help the system
developers in selecting appropriate scenes and in improving the technology.
According to Relph (Relph, 1977) sense of place is related to physical properties,
activities and meanings. These are very high-level issues and in this paper we have
chosen to further break these categories down adopting a framework proposed by
Bentley, Alcock, Murrain, McGlynn and Smith (Bentley et al., 1985) known as
‘responsive environments’. The concept of responsive environments shares many of
the basic aspects of environment legibility developed by Lynch (Lynch, 1960). By
focussing on what features make an environment responsive to the needs of its users
we can then begin to explore how properties of virtual environments (such as arena
used for the display and scope for movement) may alter the responsiveness and
ultimately sense of place and presence.
The paper begins with an introduction to the concept of responsive environments
(Bentley et al. 1985), place and presence. From there it discusses the nature of the
studies in this paper, including information on the arenas, augmentation (a barrier) and
data capture methods. It then presents results, discussion and a conclusion.
Responsive environments
Bentley et al. (1985) have developed a set of guidelines which they claim make an
environment responsive to the needs of its users. They do this using the following
concepts: permeability, variety, robustness, visual appropriateness, richness,
personalisation and legibility.
Permeability is a property of how easy it is to move through an environment and
depends heavily upon the paths and objects placed within the space. There are two
types of permeability: physical properties (e.g. a path) and visual appearance. For
example although a path may exist in some environment, if it is not visually obvious it
may remain unused. This in turn affects the sense of place people experience in the
environment. Permeability is also influenced by the nature of spaces, for example
whether they permit private or public access.
Variety refers to the range of activities, people and building forms which can be found
in a space. The varied nature of people, forms and activities will create a range of

R. McCall & al.
37
meanings and in turn the meanings may influence the variety of options available. For
example in a museum people can buy gifts, view exhibits, talk to other visitors and
perhaps visit a café. However a virtual version of the same museum may concentrate
only on aspects related to viewing exhibits, thereby altering the sense of place. As well
as being shaped by the range of activities which are built into the space, variety is a
product of the location of features and paths of movement.
Robustness explores how a single space can be put to multiple uses. An example
would be a room where changing the configuration of the furniture may lead to it
becoming a lecture room, dining room or place for a Christmas party. Robustness is
also influenced by temporal aspects. For example a museum exhibit may be open only
at specific times, with people queuing in order to gain access. If large groups of people
are queuing then the queue may act as a meeting point, social space (as people may
begin to converse) or as an area to relax prior to seeing the exhibits. However as soon
as the exhibit opens then the queuing area may simply return to its original use, that of
channelling and controlling movement.
Visual appropriateness is how the provision of cues can support variety, robustness
and legibility, it is vital if people are to correctly interpret how to make appropriate use
of an environment. Examples of poor visual appropriateness are when buildings are
identical in colour and appearance making it difficult to differentiate them.
Richness relates to the range of sensory experiences available, for example sight,
smell, touch and sound. It is also concerned with how the experience can have an
effect on the emotional state of those visiting the place. A visual example would be the
use of paths to provide a heightened sense of awareness of the environment and that
something important is going to happen. Therefore in the visual sense it is important to
consider how long something can be viewed and where it can be viewed from.
Personalisation is the ability we are given to customise an environment on a large or
small scale. Small scale personalisation can include moving a chair in a room, large
scale personalisation being the ability to change the appearance of a building.
Legibility is how easy it is for a person to construct a mental map of their environment
and depends to a large extent to the form of the environment and the activities people
undertake. Lynch (Lynch, 1970) discusses many features such as paths, nodes,
landmarks, districts and edges.
Although these concepts are drawn from the real world they are relevant to the
development of virtual environments. For example paths play a key role in nearly all of
the properties of a responsive environment, due to the fact that they are a predominant
Responsive Environments, Place and Presence
38
part of the mental image a person possesses (Appleyard, 1970; Kuipers, 2001; Lynch,
1970). They shape the activities of people and are shaped by the activities people
undertake. Paths also provide a rich sensory experience, as they act as a means to
walk by and through features of a space. This results in them playing a critical role in
the development of a sense of place. In real world environments they suggest and
provide a means of movement. However in the virtual environments discussed in this
paper technical restrictions prevent people from moving. Although the environments
suggest that paths are available using them is not possible. Moreover, virtual
environments often restrict several aspects of the experience such as richness, variety,
robustness and personalisation; therefore reducing the potential cues available that
may help people in developing their sense of place.
Place
Researchers in the field of environmental psychology and more recently virtual
environments have explored the idea of place in order to understand the whole
experience people have of locations (spaces) that they visit (Spagnolli & Gamberini,
2005). The work has often taken a phenomenological perspective (Relph, 1976; Tuan,
1977) with the objective of uncovering the core aspects of a space that result in it
becoming a place. In basic terms a space is the physical manifestation of a location, for
example a room, its walls and furniture etc. Whereas a place contains higher level
aspects such as the activities people undertake, any meanings they attach to it, as well
as the physical properties (Norberg-Schultz, 1976;Relph, 1976).
Presence
Assuming that an environment is responsive to the needs of its users and that our
sense of embodiment allows people to experience the range of activities, people and
forms provided, we contend that they are likely to experience a strong sense of place
and presence. Therefore in a virtual environment presence can be seen as ‘the
subjective experience of being in one place or environment even when one is
physically situated in another’ (Witmer & Singer, 1998). If the sense of place is strong
and the technology provides a high quality experience then people will experience the
'illusion of non-mediation’ (Lombard & Ditton, 1997). Presence also manifests itself in
three ways: physical, social and co-presence (Ijsselsteijn & Riva, 2003). Physical
presence is the focus in this paper and deals with feeling as if one is physically located
in a mediated environment. Social presence is when there is a feeling of being with

R. McCall & al.
39
others, either locally or remotely and co-presence is where one feels a sense of being
co-located somewhere with others and combines aspects of social and physical
presence. This paper focuses on physical presence as both virtual environments
studied are for single users only.
A contrasting view of presence is offered by Floridi (Floridi, 2004) as the 'successful
observation' of entities in our surroundings. This view creates two ideas of presence:
forward and backward. Forward presence is where we seek to extend our boundaries
of experience to a remote location, for example by manipulating a robot at a remote
location such as the moon (also known as tele-presence). In contrast backward
presence is where the environment is brought to the participant, for example by placing
someone in an immersive CAVE and projecting images of a given location. The
experiments in this paper focus on backward presence as the environments used seek
to bring another environment to the user.
Contributing Work
The approach adopted from the outset of the research has been to understand
presence in relation to place. Initial studies explored a number of different techniques
for eliciting data, ranging from questionnaires; such as the immersive tendencies
Questionnaire (ITQ) (Witmer & Singer, 1998), the Sense of Presence Inventory (SOPI),
structured interviews, talk-aloud protocols and the subsequent development of our own
method the Place Probe (O’Neill et al., 2004; McCall et al., 2004a)
The effectiveness of these methods has been explored through a variety of data
analysis techniques such as grounded analysis, peer reviewing, semiotic analyses and
various forms of coding. Furthermore, the utility of these techniques has been studied
in a variety of settings such as environmental architecture (Smyth, 2003), real and
virtual representations of botanical gardens, a university stairwell and a city view of
Prague (McCall et al., 2004a; McCall et al., 2004b; O’Neill & Benyon, 2003).
One of the motivations underpinning this research has been to compare virtual
representations of places against their real counterparts. Such comparisons can be
made at many different levels of abstraction. The comparison of the Prague botanical
gardens and the Edinburgh botanical gardens (O’Neill & Benyon, 2003) was
considered to be valid at the level of general characteristics i.e. the virtual gardens did
not feel hot and humid which was a key characteristic of the real gardens. However,
the representational quality of many of the plants provided an overall feel of ‘being in’ a
botanical garden.

Responsive Environments, Place and Presence
40
Similarly, the virtual viewpoint study (O’Neill et al., 2004) allowed for the comparison
between a real viewpoint in Prague and a virtual representation of that same place. Of
course it is very difficult for the real and the virtual places to ever be exactly the same.
The impossibility of making a detailed and exact replica must always be kept in mind
when considering the data. However, for the purposes of informing the design of a
virtual place that is as faithful as possible to the real place, focusing on key emergent
themes does appear to be useful. The comparisons made by probing participants’
sense of place in both real and virtual versions of the viewpoint highlighted similarities
in participants experiences, as well as significant technical problems that tended to
interfere with their sense of place and ultimately presence.
Study
Equipment
The virtual environments in the study used a photo-realistic rendering technology
developed within the EU funded BENOGO project. Firstly a digital camera is used to
capture a set of images at a given location. The images are mapped onto a concave
sphere and are displayed in a HMD or CAVE. The actual image seen by the user is a
composite of those previously captured and is based on their position and a software
algorithm.
Unlike certain other photo-realistic technologies the BENOGO system lets people
move freely within a specified area and provides horizontal parallax. However the level
of movement is limited, for example in the system used in this study people can only
walk within a 60cm diameter (in the horizontal plane). Moreover, when looking at the
top and bottom (of the world or sphere) there are some graphical distortions. The
system does not allow interaction with others or photo-realistic objects.
In addition to the rendering technology used the environments were displayed in two
arenas; a HMD and an immersive CAVE. The HMD had a resolution of 640x480 pixels
and displays 14 pixels per degree of view. In comparison the CAVE has a resolution of
1024x1024 pixels but only displays 11 pixels per degree of view. The lower number of
pixels per degree combined with the fact that the images in the CAVE are stretched
across a larger surface area results in the images appearing at a much lower
resolution.
Head tracking was used within the HMD in order to calculate the position of the user
and hence to render the scene from an appropriate point of view in real time. In the

R. McCall & al.
41
CAVE the images are projected on to each wall (or surface) with tracking provided via
a head sensor.
Environments
In order to carry out the studies two environments were chosen. The first was a view
from a balcony within the Czech Technical Museum in Prague (see figures 1a & 1b).
This environment was used to conduct the evaluation of place and presence as it
contains interesting content. The second environment was an office within the Czech
Technical University (figures 2a & 2b), it was chosen as it was used high resolution
graphics and all relevant distances within the space were known.
We were also interested in exploring the effect of augmentations on the sense of
place, presence and distance in both arenas. Hence we implemented a computer
generated augmented barrier (see figures 1a and 2a). A barrier was chosen since at
the time of the studies movement of the users was restricted to a 60cm disc and it was
felt that the barrier may discourage people from venturing out with the disc area and
hence experiencing blank displays and other technical problems. It is our intention to
explore the effect the barrier has on movement in future publications. The barrier is
computer generated and when compared to the photo-realistic virtual environment
there are a number of noticeable differences, namely the resolution appears different, it
is brighter and the textures appear less natural.
Fig. 1(a) and 1(b): The technical museum with the augmented barrier and a view from the balcony in the technical museum.

Responsive Environments, Place and Presence
42
Fig. 2(a) and 2(b): The augmented barrier in the box world and the box world without the augmented barrier.
Data Capture Methods
The objective throughout the study is to combine qualitative and quantitative data
sources and to look for corroboration within the results. It was felt that while measures
such as the MEC questionnaire may provide numerical scores for the varying
conditions, they do not shed light on the higher level experiences which may be related
to the sense of presence; for example the ability to understand content or feelings of
space and size. Moreover the objective of the work was to provide feedback to the
system developers hence there was an interest in relating specific features of the
technology to feelings of place and presence.
The Place Probe
During prior studies it became apparent that using any single method to capture
aspects of place and presence was insufficient. Consequently we began to explore a
variety of methods that would be capable of capturing rich information about places;
from technical aspects through to higher level issues such as meaning and activities.
The result was the development of an en-situ tool known as the ‘Place Probe’ (O’Neill
et al., 2004; McCall et al., 2004a).
Probes have been used in two main contexts. Cultural probes (Gaver, 1999) for the
capture of rich data about the context in which a technology was being used, or where
it was likely to be used. The probes were not intended to simply elicit some objective
data, they were intended to provoke responses. In a similar vein Technology probes
(Westerlund, Lindquist, & Sundblad, 2001) have been used particularly in the domestic

R. McCall & al.
43
setting to explore new uses of technologies. The probe which they developed used
methods that were intended to inform the design of a prototype system which would
provide a common interface where different generations within a family could
communicate, even if they were are at different physical locations. They used probes to
capture information about the nature of communications between family members. The
probes contained a communication diary, notebook, two disposable cameras, address
envelopes and a pen. Other probes have been used by (Eggen et al., 2002) and by
Baillie (Baillie et al., 2002).
The probe reported here differed in that it was designed to capture experiences at a
specific point in time or a particular place rather than over an extended period of time.
Drawing on the experiences of the previous empirical studies our place probe included
several key elements; a visitors book, sketch maps, semantic differentials and a six
word summary. Earlier experiences of the probe found that it was capable of identifying
a rich range of data about real and virtual places, in particular attributes which were
relevant to exploring the concepts behind responsive environments.
The place probe is completed by each participant after they have completed a
relevant part of the study, for example after they have experienced the CAVE or HMD.
The probe takes approximately ten to fifteen minutes to complete and the participants
can request assistance if they are unsure what they must complete for each section.
Part 1: The Visitors Book
Research undertaken by Turner and Turner (2003) has highlighted the written reports
contained in visitor’s books as a source of rich data about place. Indeed such reports
have the advantage that they are often ask open-ended questions e.g. ‘Please tell us
about your experience’ rather than ‘Tell us about the lighting’, hence they do not
prompt people to provide answers on specific topics.
Part 2: Sketch Maps
Sketch maps provide information on the layout and key features of a location. In this
case accuracy of the map is not of prime concern, rather it is the depiction of those
aspects of the place that people remember; for example a tree, building or seating
area. They can also be used to provide additional information such as where people
are standing or their paths through the environment.

Responsive Environments, Place and Presence
44
Part 3: Semantic Differentials
Semantic differentials are sets of descriptors of the place on a bi-polar scale. For
example, people are asked to indicate where they would position the place on a scale
of attractive-ugly, big-small, colourful-colourless, noisy-quiet, and so on. Eleven
characteristics have been used (O’Neill et al., 2004). The results presented later do not
include data from this element of the probe. However, a similar instrument was
included in the experiments.
Part 4: Six Words
The final part of the probe asked people to write down six words which best described
their experience of being in a particular place.
Semantic Differentials
A set of semantic differentials which are identical to those found in the place probe
were used. In this instrument participants were asked to rate various features of the
environment (see tables s1-s4 at the end of this paper). The differentials combine
Osgood’s (Ogood, Suci, & Tannenbaum, 1957) semantic differentials and Relph’s three
aspects of place (physical features, activities afforded and affect engendered). For
example people are asked if the environment is attractive or ugly, with the rating
ranging from Very Attractive, through neither (i.e. not attractive or ugly) to Very Ugly.
Prior to each set of differentials a question is provided so that participants will
concentrate on the relevant area. The differentials build on the aspects of place
developer by Relph (Relph, 1976) by adding a section specifically designed to explore
the effects of the mediating technology. The objective of the semantic differentials is to
develop maps of the connotative associations people have with certain words and the
environment, which in turn allows the abstraction of information on their feelings
towards it.
Semi structured Interview
The semi-structured interviews were conducted within a relaxed framework, which
allowed for the retrieval of both general and focused qualitative information. Five
questions were formulated before the interview (see

R. McCall & al.
45
Table 1 : Interview questions) with some random questions materialising during the
interview. All the questions were discussed in an informal manner with the interviews
lasting between ten and twenty minutes. The first question is an open-ended question
while the preceding questions are more specific. The method of questioning was quite
flexible and each question was designed and phrased to probe for relevant details.
Each participant experienced the virtual technical museum, either through the HMD or
the CAVE and each interview was recorded using a DAT recorder.
1. Can you tell me your general feeling and thoughts on your experience in the VR environment?
2. Did anything in the environment trigger your curiosity? 3. Was there anything odd or unusual in the environment? 4. Where did you think you were? 5. What did you think you were doing there?
Table 1 : Interview questions.
MEC Spatial Presence Questionnaire
The MEC questionnaire (Vorderer et al., 2000) is designed to measure the
experience of spatial presence. The questionnaire is derived from a solid theory of
spatial presence and is divided into a number of different sections:
Attention allocation.
Spatial situation model.
Spatial presence: a) self location, b) possible actions.
Higher cognitive involvement.
Suspension of disbelief.
Domain specific interest.
Visual spatial imagery.
It is designed for immediate use after media exposure and the scoring system
consists of a five point scale. Depending on the requirements of the study, the
questionnaire can contain 8,6 or 4 items per section. Data from studies conducted
during the development of MEC pointed to the 4 item set being suitable for our work
and it was chosen for use throughout both experiments. A list of the questions used in
this study can be found at the end of this paper in tables M1-M7.

Responsive Environments, Place and Presence
46
Distance Estimate Test
For an environment to be responsive its users must feel as if they have the ability to
move around and interact with objects in their personal and action spaces. An action
space is usually categorised as a distance of greater than arms length (which is
personal space) but less than 30 metres (Loomis & Knapp, 2003). In the box world
environment chosen for this study all objects existed within the action space.
Prior work on distance estimates within virtual environments has found that users of
HMD’s typically underestimate distance relative to the real environment, with the
display being the problem area not the weight of the HMD (Willemsen, Colton, Creem-
Regehr, & Thompson, 2004). However image quality or realism was found not to have
any significant impact (Thompson, Willemsen, Gooch, Creem-Regehr, Loomis, & Beall,
2004). Other aspects such as depth cues play a critical role, and in the BENOGO
technology some issues remain such as the lack of horizontal occlusion or reflections.
Early experiences of the BENOGO technology and the different arenas suggested
there may be a variation in the feeling of being able to touch objects. Furthermore
anecdotal evidence pointed to objects in the CAVE feeling further away, hence
reducing the feeling of being able to act within the space. Consequently the focus of
this part of the study was on how estimation of distance changes between each arena.
Moreover the augmented barrier became an additional aspect to explore as it was built
specifically to make participants feel as if there were less actions available.
In order to conduct this study a box world was used (see figures 2a & 2b) where the
exact distances to the specified points were already known. The box world was chosen
as at the time of the study it offered the highest resolution available and the distances
were known. The participant experiences the environment from the perspective of the
camera (see the black spot marked camera in figure 3), giving then an egocentric view
of the space. In this study the focus was on exploring distance measures within the
action space of the user. It should be noted however that the objective of exploring the
distance measurements is to compare the different arenas (CAVE vs. HMD) and the
effect of adding the barrier, rather than to compare them to the actual distances.

R. McCall & al.
47
Fig. 3: Box World Map. The black dot indicates the position of the user, each coloured block represents a point they were asked to measure.
Prior to being asked for distance measures of the virtual environment, each
participant was asked to estimate a relative distance of something in the real
environment and for their own height. On entering the virtual world they were asked
how they felt relative to their normal height. The distance estimates explored feelings of
absolute distance (i.e. from themselves to a given point) and relative distance (i.e
between two points), the questions are outlined below:
1. How tall are you?
2. Relative to your normal height do you feel short, tall or normal in the scene?
3. Which box is nearest you?
4. Which box is furthest away?
5. What is the distance of the blue box?
6. What is the distance of the far green box?
7. What is the distance between the two red boxes?
8. Facing the near green box, what is the width of the room?
9. Facing the blue box what is the length of the room?

Responsive Environments, Place and Presence
48
Procedure
The experiments were conducted during a two day workshop at Aalborg University,
Denmark. Two sets of experiments were conducted on consecutive days using
different sets of participants and varying methods as described in Table 3. They are not
intended to be comparative studies but instead are intended to explore the use of
different methods and to capture as diverse and large a set of data as possible.
Experiment 1 Experiment 2 Museum:With Vs Without Barrier (Semantic differentials, MEC)
CAVE
Box world: distance estimates With Vs Without Barrier
Museum: No Augmentation (MEC, Place probe, Semi-structured Interview)
Museum:With Vs Without Barrier (Semantic differentials, MEC)
HMD
Box world: distance estimates With Vs Without Barrier
Museum: No Augmentation (MEC, Place probe, Semi-structured Interview)
Table 2: Structure of the studies carried out during the workshop.
Experiment 1 was conducted with another team of researchers who were interested
in exploring sound augmentations. Due to the number and nature of tests being
conducted during experiment 1 it was felt that participants may get bored if they were
asked to complete the place probe on several occasions. Hence the experiment used
only the semantic differentials element of the place probe. The MEC questionnaire was
used during both experiments simply to allow for maximum data collection.
On being assigned to an arena the participants were then informed of the structure of
the test, the range of environments and that they would be asked to complete a series
of questionnaires. The order in which participants experienced the environments and
barrier conditions was chosen at random. After each of the museum test conditions
they were asked to complete a MEC questionnaire and set of semantic differentials
(from the place probe). Prior to starting the box world tests the participants were asked
to provide a distance estimate of an aspect of the real environment. After the initial test
they asked to complete the two augmentation conditions, after which they were asked
to provide a series of distance estimates.
Experiment 2 was intended to compare the difference in sense of place and presence
when comparing the CAVE and HMD. For this the only variable which was changed

R. McCall & al.
49
was the arena. This resulted in there being more time available for each participant
once they had completed the task. Hence they were encouraged to complete the Place
Probe, MEC questionnaire and take part in a short semi-structured interview.
There were no complex tasks involved in any of the test conditions, hence it was felt
that only basic instruction on how to use in the CAVE or HMD should be provided.
These included telling people that they could move around or adjust the positioning of
the HMD.
Participants
A total of 28 subjects took part in the study, for the most part they were students and
staff from Aalborg University and ranged from those in computing to those from an Arts
and Social Sciences background. During experiment 1, 10 males and 4 females took
part. While during experiment 2, the group consisted of 7 females and 7 males.
Statistics Used
The nature of the study resulted in only a small number of participants experiencing
each condition and as a result the data was not always normally distributed.
Accordingly non-parametric statistics were used to permit comparison between the
different data sets. The primary statistic used was the Mann-Whitney u-test which
allows for comparison of two data sets in order to ascertain whether there is a genuine
statistically significant variation in the data. The confidence interval used was set at
95% which translates into their being less than a 5% chance of the result being due to
a random factor (p<=0.05). Therefore where the data indicates p=0.03 this indicates
the result has a 3% chance of being due to a random factor.
Results
The results presented focus on the order in which the studies were conducted (see
the experiment breakdown in table 1), and the data capture method used. The
semantic differentials and distance measures apply only to the studies carried out as
part of experiment 1. Data from the MEC spatial presence questionnaire covers
findings from both experiments. Data from the place probe applies to studies carried
out during experiment 2 only. The results do not report the findings from the semantic
differentials component of the place probe during experiment 2.
Responsive Environments, Place and Presence
50
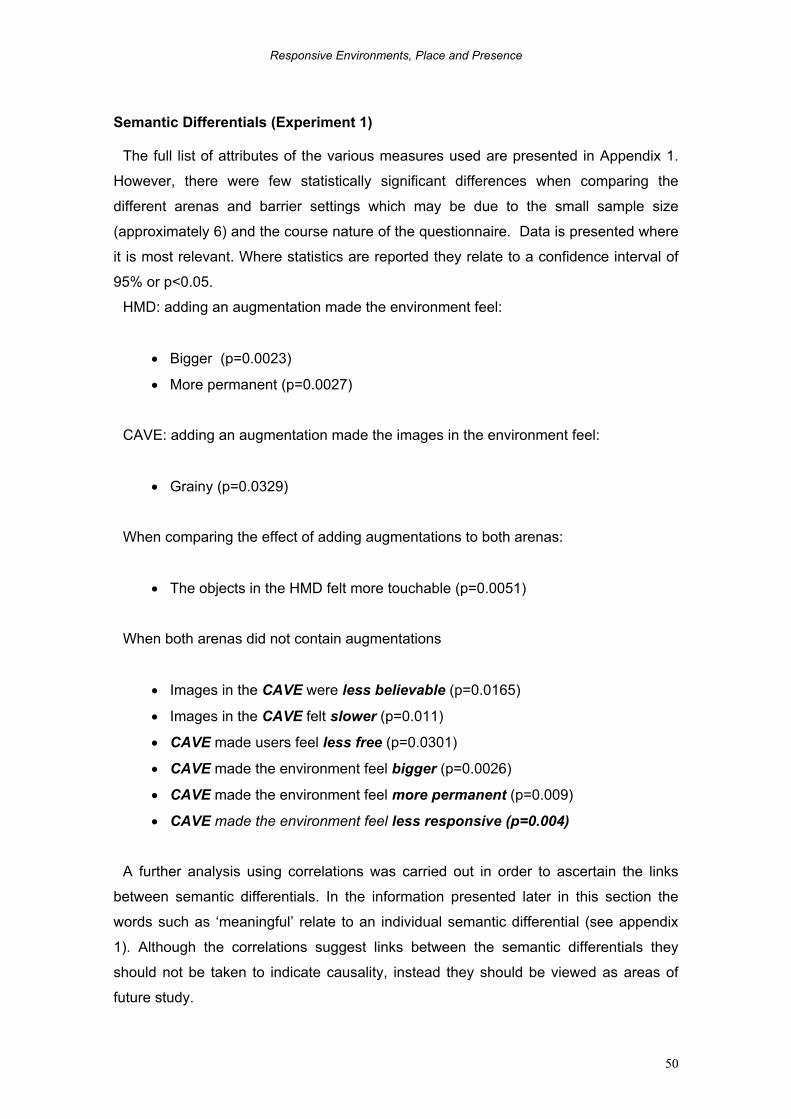
Semantic Differentials (Experiment 1)
The full list of attributes of the various measures used are presented in Appendix 1.
However, there were few statistically significant differences when comparing the
different arenas and barrier settings which may be due to the small sample size
(approximately 6) and the course nature of the questionnaire. Data is presented where
it is most relevant. Where statistics are reported they relate to a confidence interval of
95% or p<0.05.
HMD: adding an augmentation made the environment feel:
Bigger (p=0.0023)
More permanent (p=0.0027)
CAVE: adding an augmentation made the images in the environment feel:
Grainy (p=0.0329)
When comparing the effect of adding augmentations to both arenas:
The objects in the HMD felt more touchable (p=0.0051)
When both arenas did not contain augmentations
Images in the CAVE were less believable (p=0.0165)
Images in the CAVE felt slower (p=0.011)
CAVE made users feel less free (p=0.0301)
CAVE made the environment feel bigger (p=0.0026)
CAVE made the environment feel more permanent (p=0.009)
CAVE made the environment feel less responsive (p=0.004)
A further analysis using correlations was carried out in order to ascertain the links
between semantic differentials. In the information presented later in this section the
words such as ‘meaningful’ relate to an individual semantic differential (see appendix
1). Although the correlations suggest links between the semantic differentials they
should not be taken to indicate causality, instead they should be viewed as areas of
future study.

R. McCall & al.
51
On exploring the correlations it was found that how ‘meaningful’, ‘interesting’,
‘exciting’ and ‘memorable’ the environment was, depended to large degree on the
overall image quality, with ‘meaningfulness’ being correlated to ‘realism’ and ‘nearness’
of objects. ‘Accuracy’ correlated with ‘believability’, which affected the feeling of
‘orientation’, with ‘orientation’ being correlated to the ‘colourfulness’ and ‘lightness’ of
the scene. As a result ‘accuracy’ is related to the ‘colour’ and consistency of images
when a person moves.
The CAVE and HMD both present the scenes in different ways with objects in the
CAVE appearing further away. The perception of distance and the ability to touch
objects appears important in making the environment feel responsive to the needs of
the users. Further examination of the correlations found that the perceived ability to
touch objects has a direct impact on the sense of ‘mobility’, ‘freedom’ and ‘activity’.
The sense of being inside the environment was positively correlated to the perceived
ability to ‘touch’ objects, the ‘lightness’ of the scene (arena) and how ‘beautiful’ the
environment felt. ‘Beautiful’ correlated with feeling of being ‘oriented’ and the
environment feeling ‘full’ rather than ‘empty’. In turn ‘fullness’ of the space was directly
related to ‘realism’, ‘accuracy’ and how ‘believable’ the environment felt. The sense of
scale (or ‘bigness’) of the environment had a direct impact upon how ‘meaningful’,
‘memorable’ and ‘interesting’ the scene was.
Distance Measures (Experiment 1)
The distance measures have been calculated for both arenas and augmentation
settings, the sample groups are approximately 6 or 7 for each condition. The table
headings refer to the objects in the distance estimate tests (see table 3), with the blue
box [A], green box [B], W & L room relate to the width and length of the virtual room
and between is the difference between dark boxes C & D. Correct is the measured
distance of the objects or distances from the standing point in the real world equivalent
of the virtual environment. A map of the blocks used in the study can be found in figure
3.

Responsive Environments, Place and Presence
52
Absolute Distances Relative Distances
Blue Box Green Box W Room L Room BetweenObjects
Actual 100 433 782 658 115 CAVE Mean 113.33 558.33 950.00 950.00 250.00 Barrier Median 90.00 500.00 850.00 800.00 200.00 St Dev 51.25 307.27 339.12 388.59 173.20 CAVE Mean 126.00 560.00 920.00 900.00 186.00 Median 100.00 500.00 900.00 800.00 200.00 St Dev 48.79 304.96 349.28 353.55 21.90 HMD Blue Box Green Box W Room L Room Between Barrier Mean 66.67 358.33 641.67 783.33 250.00 Median 60.00 350.00 700.00 800.00 250.00 St Dev 19.66 91.74 185.52 213.70 70.71 HMD Mean 48.78 266.69 509.06 599.01 190.24 Median 60.00 350.00 641.67 783.33 250.00 St Dev 25.43 151.57 281.71 333.79 103.51
Table 3: Comparative distance estimates for the CAVE and HMD, with and without the barrier.
Fig. 4a: Median distance measures for blue box task.

R. McCall & al.
53
Fig. 4b: Median distance measures for the green box task.
The results in table 3 indicate that people thought the distances for the location of
objects and room dimensions were larger within the CAVE than the HMD, this applied
irrespective of whether the barrier was present (see figures 4a&b and 5a&b). However
there were no such variations when comparing between object distances. At this stage
these findings are only indicative as the only statistically significant result related to the
distance of the blue box; many others came close to being significant and hence
warrant further investigation. However we found no link between object distance
estimates and the presence of the barrier (see figure 6).

Responsive Environments, Place and Presence
54
Fig. 5a: Comparing median length of room measurements task.
The absolute distance estimates of blocks in the CAVE and HMD varied substantially,
but were not statistically significant. At this stage it is possible to speculate that for the
distances of objects people consistently underestimated them in the HMD, and were
approximately accurate or over estimating them in CAVE. With the distance estimates
in the HMD increasing when an augmentation is added. There was also a consistent
overestimation of room size in the CAVE, and underestimation in the HMD.
Interestingly though the between objects score for both environments appeared to be
consistent and more accurate in the CAVE.

R. McCall & al.
55
Fig. 5b: Comparing median width of room measures.
Fig. 6: A graph illustrating the median between objects distances.
The data partially confirms some findings from prior work (Willemsen et al., 2004) that
people consistently underestimate distances in HMD’s. However it also points to some
variations, in particular with absolute distance measures when comparing the CAVE
and HMD.

Responsive Environments, Place and Presence
56
MEC Spatial Presence Questionnaire (Experiments 1 & 2)
Fig. 7: A chart comparing the results from the MEC questionnaire in the HMD. (A) Attention allocation (B) Spatial Situation model (C) Spatial Presence: Self location (D) Spatial Presence: Possible Actions (E) Higher cognitive involvement (F) Suspension of Disbelief (G) Domain Specific Interest (H) Visual Spatial Imagery.
The data from the HMD study (see figure 7) without the barrier shows a high average
score for spatial presence (self location, C, scoring 3.958 and possible actions, D,
scoring 3.499). The level of participants’ attentiveness is quite high (A, score of 4.458)
and as is the spatial situation model (B, 4.12). The participants’ ability to suspend
disbelief is average as is their cognitive involvement and ability to visualise the space.
The participants’ interest in the environment is low. On adding the barrier there appears
to be a drop in the scores for spatial situation model, spatial presence (self location),
cognitive involvement and suspension of disbelief but an increase in domain specific
interest and visual spatial imagery.

R. McCall & al.
57
Fig. 8: MEC data when comparing the CAVE with and without the barrier.
There are similar trends in the data when exploring the effect of adding the barrier to
the CAVE condition (see figure 8); with the only difference being the level of domain
specific interest which marginally increases when the barrier is added to the CAVE.
Also on a quick examination of the data the drop in scores when the barrier is added to
the CAVE is much higher than in the HMD condition. One very interesting finding is that
the scope for possible actions drops substantially when the barrier is added.
On comparing the arenas without the barrier the results are somewhat mixed (figure
9). Interestingly though the HMD performs better with respect to spatial situation,
spatial presence (self location and possible actions). With the CAVE appearing only to
materially enhance aspects such as cognitive involvement, domain specific interest and
visual spatial imagery. The scores for the CAVE for attention allocation, spatial
presence (self location and possible actions) are much lower than for the HMD.
However the barrier (see figure 10) appears to make little effect on issues such as
spatial situation, domain specific interest and visual spatial imagery.

Responsive Environments, Place and Presence
58
Fig. 9: MEC data when comparing the HMD and CAVE without the barrier.
Fig. 10: MEC data comparing the HMD and CAVE with the barrier.
Place Probe: Descriptions and Keywords (Experiment 2)
The place probe was given to fourteen participants after they experienced the virtual
technical museum (HMD=6, CAVE=8). The following are the overall key themes from
the data from both arenas obtained from the descriptive section (visitors book) and six
words of the probe:

R. McCall & al.
59
Restrictiveness
Size
Oldness
Strangeness
Fun
Impressiveness
Emptiness
Negative feelings
Physical objects
Technology
The action space of both arenas was restricted and this recurring theme emerged
from the data leading to the participants feeling disappointed as their ability to explore
the environment was curtailed.
‘I missed that I couldn’t move around.’ (Female, 28, CAVE)
‘I would have liked to see more of the museum, not just turn around and see
the things placed in a circle around me.’ (Female, 30, HMD)
‘Better movement capabilities would take the experience to a higher level.’
(Female, 47,HMD)
‘The restriction of the movement seemed annoying.’ (Male, 25, CAVE)
Legibility and visual appropriateness remained a problem within both arenas, with
more technical problems being noted in the CAVE. This was highlighted by words such
as ‘stereo’, ‘real’, ‘VR’, ‘science fiction’ and ‘technic’ being used to refer to the CAVE,
while these terms were not used with respect to the HMD.
‘Impressive stereo – effect though the resolution leaves something to be
desired.’ (Male, 25, CAVE)
‘Also when looking down the image and the experience was pretty bad.’ (Male,
32, CAVE)
‘I had a problem with errors.’ (Female, 28, CAVE)
Physical objects were noted from both experiences i.e. trains, planes , cars, bikes,
railing, ceiling, balcony (the planes were noted 10 times, motorbikes were noticed 4

Responsive Environments, Place and Presence
60
times, bikes were noted 3 times, trains were noted 4 times, railing were noted 3 times).
However, problems with resolution meant that legibility was a problem with participants
being able to see objects yet not able to identify them.
‘I found it quite hard to actually see things clearly at all times.’ (Female,
25, CAVE)
‘I tried to read the information in the museum.’ (Female, 47, HMD)
In both arenas they got the sense of the size of the room, with words like large, huge,
big, and great used to describe experiences. In the CAVE the word ‘large’ tended to be
used more while in the HMD they used the word ‘big’.
From both arenas, the feelings that were emerging varied from scary, spooky to an
interesting, nice and very good experience. People in both, found it scary because they
felt if they moved too far, they would fall down while a person in the HMD also felt
spooked because it was so realistic they could ‘almost smell the dust and oil from the
old machines’.
Participants in both arenas described it as a nice and good experience. Words like
‘old’, ‘history’ and ‘vintage’ were used to describe the environment. The words ‘vintage’
and ‘old’ being used more in the CAVE while the words ‘vintage’ and ‘historical’ being
used in the HMD arena. People in the CAVE arena got more of a strange, surreal,
confused, curious feeling while those in the HMD got more of a mysterious feeling.
People in both mentioned it was fun and a person in the CAVE described it as an
‘interesting’ experience while those in the HMD described it as an ‘exciting’ experience.
The CAVE experience was noted as being dark and was described as empty,
deserted, scary and bad while the HMD was described as boring, melancholy and
silent. Nevertheless, people in both arenas have started to make certain connections
with the environment and the real world. For example, in the CAVE arena, they
described the experience like being inside a ship or inside a computer game while in
the HMD it was more like the feeling of being back in the twenties/thirties.
‘It sounded like the inside of a ship.’ (Female, 38, CAVE)
‘I had the impression of being inside a computer game.’ (Female, 25, CAVE)
‘I had the feeling of being back in the twenties/thirties.’ (Female, 24,HMD)

R. McCall & al.
61
Place Probe: Sketch Maps (Experiment 2)
The sketch map section of the probe provided some interesting information about
what people considered to be the most salient aspects of the environment they
encountered. In both the HMD and the CAVE participants identified the same kinds of
objects, the most common of which were:
Motorbikes
Planes
Trains
Cars
Hanging planes
Individual preferences revealed examples of specific objects such as the ‘gold motor
bike’ or ‘the yellow plane’ but none of these were common across participants or
environments.
The tables 4 & 5 illustrate the specific counts for map goodness, objects, total position
of objects and the position of the most significant objects. They also show the position
ratios of all objects and significant objects.
No Goodness Object Count
TotalPosition
SignificantPosition
All Pos Ratio
Sig Pos Ratio
8 2 7 4 4 0.13 0.8 9 1 9 4 4 0.13 0.8 10 1 4 4 2 0.13 0.4 11 1 4 0 0 0 0 12 1 3 1 1 0.03 0.2 13 3 22 22 5 0.73 1
Table 4: HMD with 6 participants.

Responsive Environments, Place and Presence
62
No Goodness Object Count
TotalPosition
SignificantPosition
All Pos Ratio
SigPosRatio
8 2 5 4 3 0.13 0.6 9 2 5 4 4 0.13 0.8 10 2 3 0 0 0 0 11 3 28 28 5 0.93 1 12 3 11 11 4 0.36 0.8 13 1 7 5 3 0.17 0.6 14 2 10 8 2 0.27 0.4 15 3 14 14 5 0.47 1
Table 5: HMD with 6 participants.
According to Billinghurst and Weghorst, (1995) an ANOVA must be conducted across
the significant position ratio of all the maps in each world and over the All position ratio.
Significant ratio produces results regarding how well oriented participants were in both
environments, whereas all position ratio identifies if either of the worlds had more
clearly identifiable landmarks. However the lack of participant numbers in these tests
meant that using an ANOVA is not very reliable.
Mann-Whitney tests were used instead to look for significant differences between
both all position and significant position ratios. The test results suggest that there are
no significant difference between the two versions of the worlds.
We also compared the object count and Map Goodness scores across the worlds.
Billinghurst and Weghorst, (1995) suggest that these aspects of data only be used to
compare across maps of the same environment. While we were comparing across two
different arenas we felt that the environment was rendered using the same images and
experienced spatially in largely the same way according to the lack of significant
differences in the ratio tests. Therefore we felt that it might be relevant to compare map
goodness and object count statistics.
In employing statistical analysis to look for differences between the data, nothing was
found to distinguish between the two different groups of maps. The data from the
sketch maps appears to show that the level of cognitive mapping is indistinguishable
between both the HMD and CAVE.
Semi structured Interview (Experiment 2)
Data from the semi-structured interviews covers experiment 2 only, i.e. the CAVE or
HMD without the augmented barrier. The findings from the semi structured interviews
show that even though many of the participants got a ‘sense of the place’ in both

R. McCall & al.
63
arenas, they still were not achieving a strong ‘sense of presence’. Many participants
could identify the place as a museum and recognise the objects:
‘I thought it looked real, it was …I got the feeling it was a museum… Oh it was
the way it was …the things were planted in the room with signs (Female,28,
CAVE)
‘Ya I had the feeling it was a large room and I could identify the main objects in
it …(Female ,35, HMD)
‘It was like a tech museum, ya there was sights of aeroplanes, bicycles and
transportation.’ (Female ,38, CAVE)
‘‘I really felt I was standing in a room and looking at this old museum.
‘(Female, 21,HMD)
Despite the positive comments made by the participants they were not experiencing a
true complete sense of being there. This lack of being there can be attribute to the
breaks which they experience in the sense of place (such as feeling as if they were in a
movie) and technical aspects (such as occasional blackness) as outlined below:
‘… but I don’t think I got the feeling I was there I was kinda of looking into it
so… It was kinda like being in the environment …ya I would describe it like
…Kinda like looking into the movie about it ’ (Female,28, CAVE)
‘It was quite real and then again it felt like I was inside a computer game’
(Female, 38, CAVE)
It was quite a sensation it really felt like being there …well until you turn the
other side or went out of the sensory frame’ (Male,25, CAVE)
While the content of both arenas visually engaged the participants, they felt
disappointed in that although they could see paths and other objects they restricted
movement range prevented them from doing so. This is outlined in the comments
below:
“But the …I felt there was some restrictions in the movement because you
couldn’t move out very much,” (Male,32, CAVE)
“I could look over the fence but of course I was limited in the …I think it was a
metre /a square metre where I could move around” (Male,25, HMD)

Responsive Environments, Place and Presence
64
“I also felt restricted, I felt I couldn’t walk very far and if I turned too much it
would go black” (Male, 25, CAVE)
Problems also arose in relation to visual appropriateness and legibility, namely that
although participants could identify objectives such as hanging planes, motorbikes,
vintage cars, it was not possible to find out more about the exhibits. For example signs
and pictures on the wall were difficult to read, this would often result in people suddenly
becoming accurately aware of the technical issues and hence detecting the medium.
Some examples are provided below:
“The things were planted in the room with the signs …I tried to see if I could
read one but…” (Female, 28, CAVE)
“I would have been much more satisfied if I could have got closer to see more
specific details. Ok” (Female, 30, HMD)
“And there was some text but it was unreadable but I could easily identify the
object ….I could easily identify planes and cars” (Male,25, CAVE)
Discussion
The premise of this paper is that an environment which is responsive to the needs of
its users will exhibit a stronger sense of place than those that are not responsive. This
is primarily based around the idea that many aspects of responsive environments are
critical to models of place. For example activities play a key role within a sense of place
and the responsiveness of an environment. Hence if a virtual environment adequately
provides relevant cues (such as people, paths and forms) it should lead to more
activities being available to users and hence a heightened sense of place. Moreover,
by drawing the users’ attention away from technical issues or limitations it is suggested
that the sense of presence will also increase as people are focussing on the content
not the medium. To this end the discussion will examine how the virtual environments
used in this study respond to the needs of their users and ultimately shape their sense
of place and presence.
Comparing Arenas
In general the participants found the CAVE less responsive than the HMD. This may
initially be due to the lack of permeability; the ability to move around an environment
R. McCall & al.
65
and for the movement channels to be clearly visible. In terms of the study presented
here the semantic differentials point to movement being related to the ability to touch,
and senses of freedom, mobility and activity. Taking these as a starting point both
arenas do not compare well to the real equivalent as movement is restricted thus
reducing the ability to touch objects, as well as freedom and mobility. Data from the
interviews and probe back this up with participants indicating they found movement
restrictive through comments like “you couldn't move around very much” and “the
restriction on movement seemed annoying”. In addition, people felt they could move
around less in the CAVE, this was noted in both the MEC questionnaire and semantic
differentials.
Variety is the range of activities, people and forms which exist within an environment.
In the context of the study here it would be expected that the real version would afford
more variety when compared to its virtual counterpart. On closer examination there are
variations between arenas, for example the semantic differentials indicate there is a
link between the feeling of being inside the environment, and how the ability to
undertake activities is related to nearness and ability to touch objects. Additionally the
CAVE seems bigger, thus reducing the nearness, ‘touchability’ of objects and the
feeling of being inside. The sense of things being further away from the participant is
reinforced in the CAVE by the increased estimates of distance. Further evidence can
be found within the interviews with one person saying the CAVE made them feel like
they were in a movie, which implies they are passive and not active within the scene.
Another participant commented on trying to touch the railing to prevent falling within the
HMD. This connection between touch and objects in the scene was not prevalent within
the CAVE. The perceived inability to carry out even basic tasks such as holding the
railing may be due to the increased sense of scale within the CAVE which in turn may
provide an indication as to why objects felt less touchable. The MEC spatial presence
data confirmed the feeling that there seemed more scope for activities within the HMD
than in the CAVE. At this stage there appears to be no difference in the sense of
variety when related to forms and other people, this may be due to the same images
being used in both arenas.
A robust environment is one which affords many uses through small or simple
changes, such as moving furniture or through temporal and social changes. As this is
also related to the ability to make changes it will be discussed alongside the ability to
personalise the environment. In this study neither arena offered the participants the
ability to customise any part of the environment. Moreover, there was no social

Responsive Environments, Place and Presence
66
interaction, which may have brought about a change of use or temporal changes
(except for sound cues). Aspects discussed earlier such as the lack of ability to touch
objects clearly have an effect on robustness, however beyond the issues already
discussed it is not possible to make meaningful comparisons between the arenas.
We would contend that the change in aspects such as variety and permeability
between arenas has an effect on sense of place. For example there were variations in
the descriptive attributes of the place probe and semantic differentials, to the extent
that the same environment appeared to have different meanings between the two
arenas. For example in the HMD people commented on it making them think of the
20’s and 30’s whereas the CAVE felt like a ship. There were also variations the nature
of descriptions with more technical aspects predominating from those using the CAVE.
Furthermore the levels of spatial presence (self location and possible actions) (columns
C & D, figures (9 &10) were lower for the CAVE than the HMD.
Comparing Augmentations (The Barrier)
The barrier appears to have had some effect on place and presence but not as much
as the choice of arena. There was some indication that the barrier caused people to
feel the CAVE was more grainy, possibly leading to problems with visual
appropriateness and legibility. The barrier also lowered the degree of spatial presence.
Anecdotal evidence would point to this being caused by the different light intensities
and resolution of the augmentation in comparison to the rest of the scene. Adding the
barrier to the CAVE had by far the largest impact, with the MEC scores for spatial
presence (possible actions and self location) and attention allocation falling
substantially. The drop in the score for possible actions appears to confirm the theory
that the barrier reduces the scope for actions but the affect on attention allocation
requires more research.
General Findings
From the perspective of real environments visual appropriateness and legibility are
how the appearance of the environment helps people identify its uses. There were
clear issues with image quality which had a direct impact on the ability to read signs or
gain more information from other content. Within the probe data the issue of resolution
in the CAVE (legibility) was noted by a number of participants, and seemingly on a
more regular basis than for the HMD. However for both environments the lack of

R. McCall & al.
67
resolution made it difficult to read signs and hence gain a greater understanding about
the content of the exhibition.
For both environments if people experienced a sense of place, this was exhibited in
the data found in the structured interviews and many aspects of the place probe. It was
frequently noted that people felt they were in a museum, with the main negative points
being they felt they were in a computer game and that the screen resolution wasn't
always very high. These combined with the general awareness of other technical
issues would point to people being distracted by the medium.
Conclusion
The studies presented in this paper have looked at the effect of changing arena and
adding the graphical augmentation of a barrier to two virtual environments, a technical
museum and a box world. Further work is required for example in exploring the
correlations within the semantic differentials and improving the sensitivity of the
measuring techniques. There is also a need to further refine how the concept of
responsive environments can be used to evaluate virtual environments, and the links to
place and presence.
In contrast to anecdotal evidence the CAVE did not provide the heightened sense of
presence or place that we would have expected. This is especially surprising given that
we would expect its immersive nature to have improved both areas. While this in part
can be put down to basic technical limitations, such as the different size of pixels and
lightness much of the findings can be explained in terms of the lack of how the
properties map onto responsive environments. One of the major reasons being that the
environment felt more distant and hence less easy to touch. The other problem area for
all arenas being the implied range of movement options (paths) when in fact none were
available. Both of these had the effect of implying more opportunities for movement
and activities than actually existed.
The findings point to the choice of arena being an important factor in the sense of
place and presence, primarily on account of the increased sense of size which people
experienced in the CAVE. This points to the need to carefully consider the nature of the
tasks which are likely to be undertaken in the environment and the importance of
accurate distance measures. A core aspect of the expected sense of place is the ability
to touch items and hence the HMD would appear to offer a better solution.
The idea of responsive environments provides a clearer method of looking for specific
features within an environment and how they impact upon the sense of place, in
Responsive Environments, Place and Presence
68
particular aspects such as paths, activities and legibility. It clearly does not cover all
aspects of the place experience but does provide a useful framework upon which
arenas and environments can be explored.
Acknowledgements
We acknowledge the assistance of other members of the BENOGO project, in
particular the staff at Aalborg University Denmark. We would also like to thank Trevor
Jones and Matthew Leach for their comments on early drafts of this paper. Funding for
this project was provided by the European Union under grant number IST-2001-39184.
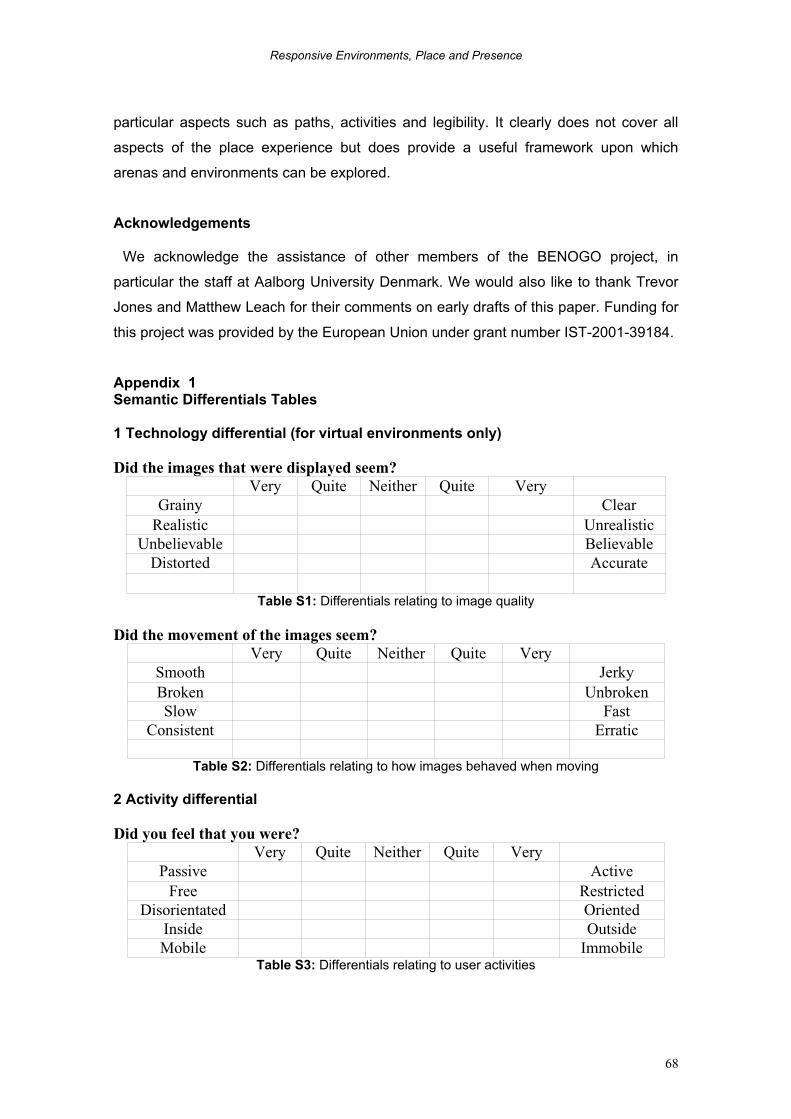
Appendix 1 Semantic Differentials Tables
1 Technology differential (for virtual environments only)
Did the images that were displayed seem? Very Quite Neither Quite Very
Grainy Clear Realistic Unrealistic
Unbelievable Believable Distorted Accurate
Table S1: Differentials relating to image quality
Did the movement of the images seem? Very Quite Neither Quite Very
Smooth Jerky Broken Unbroken Slow Fast
Consistent Erratic
Table S2: Differentials relating to how images behaved when moving
2 Activity differential
Did you feel that you were? Very Quite Neither Quite Very
Passive Active Free Restricted
Disorientated Oriented Inside Outside Mobile Immobile
Table S3: Differentials relating to user activities

R. McCall & al.
69
3 Space differential
Did you feel that the environment was? Very Quite Neither Quite Very
Small Big Empty Full Light Dark
Enclosed Open Permanent Temporary Colourless Colourful
Static Moving Responsive Inert
Far Near Untouchable Touchable
Table S4: Differential relating to the sense of space
4 Affective/Meanings differential
Did you feel that the environment was? Very Quite Neither Quite Very
Ugly Beautiful Pleasant Unpleasant Stressful Relaxing Harmful Harmless Exciting Boring
Interesting Uninteresting Memorable Forgettable Meaningful Meaningless Confusing UnderstandableSignificant Insignificant
Table S5: Differentials relating to meanings and affect
Q1 I devoted my whole attention to the [medium].
Q2 I concentrated on the [medium].
Q3 The [medium] captured my senses.
Q4 I dedicated myself completely to the [medium].
Table M1 MEC: Attention Allocation Questions
Q1 I was able to imagine the arrangement of the spaces presented in the [medium] very well. Q2 I had a precise idea of the spatial surroundings presented in the [medium]. Q3 I was able to make a good estimate of the size of the presented space. Q4 Even now, I still have a concrete mental image of the spatial environment.
Table M2 MEC: Spatial Situation Model (SSM)

Responsive Environments, Place and Presence
70
Q1 I felt like I was actually there in the environment of the presentation.
Q2 It was as though my true location had shifted into the environment in the presentation.Q3 I felt as though I was physically present in the environment of the presentation.Q4 It seemed as though I actually took part in the action of the presentation
Table M3 MEC: Spatial presence: Self Location (SPSL)
Q1 I had the impression that I could be active in the environment of the presentation.Q2 I felt like I could move around among the objects in the presentation.
Q3 The objects in the presentation gave me the feeling that I could do things with them. Q4 It seemed to me that I could do whatever I wanted in the environment of the presentation.
Table M4 MEC: Spatial Presence: Possible actions (SPPA)
Q1 I thought most about things having to do with the [medium].
Q2 I thoroughly considered what the things in the presentation had to do with one another. Q3 The [medium] presentation activated my thinking.
Q4 I thought about whether the [medium] presentation could be of use to me.
Table M5 MEC: Higher Cognitive Involvement
Q1 I concentrated on whether there were any inconsistencies in the [medium].
Q2 I didn’t really pay attention to the existence of errors or inconsistencies in the [medium]. Q3 I took a critical viewpoint of the [medium] presentation.
Q4 It was not important for me whether the [medium] contained errors or contradictions.
Table M6 MEC: Suspension of Disbelief (SoD)
Q1 I am generally interested in the topic of the [medium]. Q2 I have felt a strong affinity to the theme of the [medium] for a long time. Q3 There was already a fondness in me for the topic of the [medium] before I was exposed to it. Q4 I just love to think about the topic of the[medium].
Table M7 MEC: Domain Specific Interest (DSI)

R. McCall & al.
71
Q1 When someone shows me a blueprint, I am able to imagine the space easily.
Q2 It’s easy for me to negotiate a space in my mind without actually being there.
Q3 When I read a text, I can usually easily imagine the arrangement of the objects described. Q4 When someone describes a space to me, it’s usually very easy for me to imagine it clearly.
Table M8 MEC: Visual Spatial Imagery (VSI)
References
Appleyard, D. (1970). "Styles and Methods of Structuring A City." Environment and
Behaviour 2(1): 110-117.
Baillie, L., Benyon, D., MacAulay, C., & Petersen, M. (2003) Investigating Design
Issues in Household Environments. Cognition Technology and Work 5(1) 33-44
Bentley, I., Alcock, A., Murrain, P., McGlynn, S., & Smith, G. (1985). Responsive
Environments a Manual For Designers. London, Architectural Press.
Benyon, D. & Höök, K. (1997). Navigation in Information Space: Supporting the
Individual. Interact'97 Conference Proceedings, Perth, Australia.
Billinghurst, S. & Weghorst, M. (1995). The use of sketch maps to measure cognitive
maps of virtual environments, VRAIS '95 Conference Proceedings. North Carolina,
USA.
Eggen, B., Hollemans, G., & van de Sluis, R. (2003) Exploring and enhancing the
home experience Cognition Technology and Work 5(1) 44-54
Gaver, B., Dunne, T., & Pacenti, E. (1999). Design: Cultural Probes. Interactions 6(1)
21-29
Floridi, L. (2004). The Philosophy of Presence: From Epistemic Failure to Successful
Observability, Presence: Special Issue on Legal, Ethical and Policy Issues
associated with Wearable Computers, Virtual Environments and Computer
Mediated Reality, MIT Press, Massachusetts.
IJsselsteijn, W.A. & Riva, G. (2003). Being There: The experience of presence in
mediated environments. In: Riva, G., Davide, F., & IJsselsteijn, W.A., (eds.), Being
There - Concepts, Effects and Measurements of User Presence in Synthetic
Environments, Amsterdam: IOS Press. pp. 3-16.
Kuipers, B. (2001). The Skeleton in the Cognitive Map: A Computational Hypothesis: 9.
Lombard, M. & Ditton, T.(1997). At the Heart of It All: The Concept of Presence,
Journal of Computer-Mediated Communication, 3(2).
http://www.ascusc.org/jcmc/vol3/issue2/lombard.html

Responsive Environments, Place and Presence
72
Loomis, J. M. & Knapp, J. M. (2003). Visual perception of egocentric distance in real
and virtual environments. In L. J. Hettinger and M. W. Haas (Eds.), Virtual and
adaptive environments (pp. 21–46). Mahwah, NJ: Erlbaum.
Lynch, K. (1960). The Image of The City, MIT Press.
McCall, R., O'Neill, S.J., Benyon, D.R., & Smyth, M. (2004 a). A Method for Designing
Virtual Places in proceedings of the Seventh Annual International Workshop
Presence 2004, Universidad Politecnica de Valencia, Spain
McCall, R., O'Neill, S.J., & Carroll, F. (2004 c). Measuring Presence in Virtual
Environments. CHIDEMO paper CHI2004, Vienna, Austria
McCall, R., O'Neill, S.J., Carroll, F., & Benyon, D.R. (2004 b).The Presence Probe. In
Workshop on Designing and Evaluating Virtual Reality systems, University of
Nottingham, UK.
Norberg-Schultz, C. (1971). Existence, Space, Architecture. London, Studio Vista.
O'Neill, S.J. & Benyon, D.R. (2003). A Semiotic Approach to Investigating Presence. in
proceedings of COSIGN 2003, Middlesbrough, University of Teeside, UK
O'Neill, S.J., McCall, R., Smyth, M., & Benyon, D.R. (2004). Probing The Sense of
Place in proceedings of the Seventh Annual International Workshop Presence
2004, Universidad Politecnica de Valencia, Spain
O'Neill, S.J. & McCall, R.G. (2004). Measuring Presence in Virtual Environments:
Demo 1 The Botanic Garden, Video, CHI2004 proceedings CD2, CHI2004 Vienna,
Austria
Osgood, E.C., Suci, G.J., & Tannenbaum, P.H. (1957). The Measurement of Meaning.
Urbana, University of Illinois Press.
Relph, E. (1976) Place and Placelessness, London: Pion Books
Smyth, M. (2003). Articulating the Sense of Place: The Jencks Landform. In,
Proceedings of Space, Spatiality and Technology pp. 62-66.
Spagnolli, A & Gamberini, L. (2005). A place for presence. Understanding the human
involvement in mediated interactive environments. PsychNology Journal, 3 (1): 4-
13.
Thompson, W. B., Willemsen, P., Gooch, A. A., Creem-Regehr, S. H., Loomis, J. M., &
Beall, A. C. (in press). Does the quality of the computer graphics matter when
judging distance in visually immersive environments? Presence: Teleoperators and
Virtual Environments.
Tuan,Y.-F. (1977) Space and Place. Minneapolis: University of Minnesota Press.

R. McCall & al.
73
Turner, S., Turner, P., Carroll, F., O'Neill, S., Benyon, D., McCall, R., & Smyth, M.
(2003). Re-creating the Botanics: towards a sense of place in virtual environments.
The 3rd UK Environmental Psychology Conference, June 2003, Aberdeen, UK
Turner, P., Turner, S., & Carroll, F. (to appear). The tourist Gaze: Contextualised
Virtual Environments. Turner, P. & Davenport, E. (Eds.) Spaces, Spatiality and
Technology. Kluwer Academic Press, Dordrecht.
Vorderer, P., Wirth, W., Gouveia, F. R., Biocca, F., Saari, T., Jäncke, F., Böcking,
S.,Schramm, H., Gysbers, A., Hartmann, T., Klimmt, C., Laarni, J., Ravaja, N.,
Sacau, A., Baumgartner, T., & Jäncke, P. (2004). MEC Spatial Presence
Questionnaire (MEC-SPQ): Short Documentation and Instructions for Application.
Report to the European Community, Project Presence: MEC (IST-2001-37661).
Online. Available from http://www.ijk.hmt-hannover.de/presence
Westerlund, B., Lindquist, S., & Sundblad, Y. (2001) Cooperative design of
communication support for and with families in Stockholm – communication maps,
communication probes and low-tech prototypes. First Equator IRC Workshop on
Ubiquitous Computing in Domestic Environments, Nottingham, 13-14 th September
2001.
Willemsen, P., Colton, M.B., Creem-Regehr, S.H., & Thompson, W.B. (2004). "The
Effects of Head-Mounted Display Mechanics on Distance Judgments in Virtual
Environments". ACM SIGGRAPH Symposium on Applied Perception in Graphics
and Visualization, p. 35-48. Los Angeles, CA USA. August 7-8.
Witmer, B.G. & Singer, M.J. (1998). Measuring presence in virtual environments: A
presence questionnaire. Presence, 7(3), pp 225-240.