Degradation of zooxanthellae and regulation of their density

1
RESPONSES TO in situ SHADING BY ZOOXANTHELLAE IN THE SCLERACTINIAN CORAL Siderastrea radians
By
EMILY LOUISE MITCHEM
A THESIS PRESENTED TO THE GRADUATE SCHOOL OF THE UNIVERSITY OF FLORIDA IN PARTIAL FULFILLMENT
OF THE REQUIREMENTS FOR THE DEGREE OF MASTER OF SCIENCE
UNIVERSITY OF FLORIDA
2008
2
© 2008 Emily Louise Mitchem
3
To my friends and family for all of their love, support, and encouragement

4
ACKNOWLEDGMENTS
I would like to thank my committee: Tom Frazer, Chuck Jacoby, and Edward Phlips. I
would also like to thank the following people for assistance in the field: Robert Mitchem, Ryan
Kroutil and Meredith Montgomery. Both Ryan Kroutil and Darlene Saindon were invaluable
sounding boards for working through ideas and discussing the logisitics of the field experiment.
Mary Cichra and Susan Badylak were very helpful with advice on counting zooxanthellae. Dr.
Jacoby was very helpful in writing this thesis, without him it might never have been completed.
I would also like to thank my family for their love, support, encouragement, and understanding
while working on this project. For all who helped me along the way whom I forgot to mention, I
apologize and appreciate all of their help. This project was made possible, in part, by Special
Activity License (SAL) #: 08SRP-1084.

5
TABLE OF CONTENTS page
ACKNOWLEDGMENTS ...............................................................................................................4
LIST OF TABLES ...........................................................................................................................6
LIST OF FIGURES .........................................................................................................................7
ABSTRACT .....................................................................................................................................8
CHAPTER
1 INTRODUCTION ..................................................................................................................10
2 MATERIALS AND METHODS ...........................................................................................14
Study Site ................................................................................................................................14 Field Work ..............................................................................................................................15 Sample Processing ..................................................................................................................16 Data Analysis ..........................................................................................................................17
3 RESULTS ...............................................................................................................................20
General Site Characteristics ....................................................................................................20 Confirming Light Reduction Treatments ................................................................................20 Changes in Zooxanthellae Densities .......................................................................................22 Changes in Chlorophyll a Concentrations ..............................................................................22 Changes in Chlorophyll a Per Zooxanthellae .........................................................................23
4 DISCUSSION .........................................................................................................................36
Light Reduction Treatments ...................................................................................................36 Surface Area and Polyps .........................................................................................................36 Changes in Zooxanthellae Densities .......................................................................................37 Changes in Chlorophyll a Concentrations ..............................................................................39 Changes in Chlorophyll a Per Zooxanthellae .........................................................................39 Conclusions .............................................................................................................................42
LIST OF REFERENCES ...............................................................................................................47
BIOGRAPHICAL SKETCH .........................................................................................................51

6
LIST OF TABLES
Table page 3-1 Weather during the experiment. .........................................................................................24
3-2 Nested ANOVA testing for differences in proportion of light at the bottom for various locations under shading treatments. ......................................................................24
3-3 Nested ANOVA testing for differences in zooxanthellae densities among Siderastrea radians colonies from shading treatments. ........................................................................30
3-4 One-way ANOVA testing for differences in zooxanthellae densities among Siderastrea radians colonies from shading treatments. .....................................................30
3-5 One-way ANOVA testing for differences in chlorophyll a concentrations among Siderastrea radians colonies from shading treatments. .....................................................32
3-6 One-way ANOVA testing for differences in chlorophyll a concentrations within zooxanthellae from shaded Siderastrea radians colonies. ................................................34
4-1 Zooxanthellae cells cm-2, µg chlorophyll a cm-2, and pg chlorophyll a zooxanthellae-
1 for various coral species. .................................................................................................46

7
LIST OF FIGURES
Figure page 2-3 Locations under each shading treatment (1.5 x 1.5-m plots) where light was
measured. ...........................................................................................................................19
3-1 Back-transformed mean proportions of light penetrating under shading treatments with 95% confidence limits ...............................................................................................25
3-2 Mean irradiances measured at the bottom at two stations for Project COAST (Stations 6 and 7) and in all treatments during the experiment. ........................................26
3-3 Linear regression of surface area (cm2) vs. weight of tin foil (mg) for 5 standard surface areas (1cm2, 4 cm2, 16 cm2, 36 cm2,and 64 cm2) ..................................................27
3-4 Linear regression of Siderastrea radians √(Surface area (cm2) vs. √[Height(cm) x 0.5Diameter(cm)]. ..............................................................................................................28
3-5 Linear regression of number of polyps vs. Siderastrea radians estimated surface area (cm2) ...................................................................................................................................29
3-6 Back-transformed mean densities of zooxanthellae (cells cm-2) with 95% confidence intervals for Siderastrea radians colonies from different shading treatments. .................31
3-7 Back-transformed mean concentrations of chlorophyll a (µg cm-2) with 95% confidence intervals for Siderastrea radians colonies from different shading treatments ...........................................................................................................................33
3-8 Back-transformed mean concentrations of chlorophyll a (pg zooxanthellae-1) with 95% confidence intervals for Siderastrea radians colonies from different shading treatments ...........................................................................................................................35
4-1 Cumulative size frequency distributions for diameters of Siderastrea radians colonies (n = 30) from different shading treatments. .........................................................45

8
Abstract of Thesis Presented to the Graduate School of the University of Florida in Partial Fulfillment of the
Requirements for the Degree of Master of Science
RESPONSES TO in situ SHADING BY ZOOXANTHELLAE IN THE SCLERACTINIAN CORAL Siderastrea radians
By
Emily Mitchem
December 2008 Chair: Thomas K. Frazer Major: Fisheries and Aquatic Sciences
Siderastrea radians colonies in the St. Martins Keys, Florida (SMK) were shaded for 10
days using artificial shading screens with targeted light reductions of 0, 25, 50, 75, and 100%.
Corals were sampled and processed to yield equations for estimating surface area and number of
polyps from diameters and heights. In combination with counts of zooxanthellae and analyses of
chlorophyll a concentrations, these equations were used to estimate numbers of zooxanthellae
per square centimeter, concentrations of chlorophyll a per square centimeter, and concentrations
of chlorophyll a per zooxanthellae. On average, S. radians colonies had fewer zooxanthellae per
cm and less chlorophyll a per square centimeter than has been reported for other coral species.
Results suggest that zooxanthellae densities vary among plots within treatments, and the
densities do not change in a consistent pattern as shading is increased. Similarly, chlorophyll a
concentrations per square centimeter did not exhibit a consistent relationship with intensity of
shading. In contrast, corals subjected to 50% light reduction had chlorophyll a concentrations
per zooxanthellae that were 58.6% higher than concentrations in unshaded corals. However,
corals subjected to 75% light reduction had only 3.6% higher concentrations than corals
subjected to 50% light reduction. Thus, corals responded to shading in a 10-day period, but their
response appeared to be constrained by their light compensation point, the amount of chlorophyll

9
a that can be contained in a single zooxanthellae, or the rate at which chlorophyll a can be
produced. Assuming unshaded corals represent a reliable control, S. radians gained an estimated
0.1713 pg of chlorophyll a per zooxanthellae per day on average. Siderastrea radians’
zooxanthellae, though “sun-loving”, did show some adaptation to low light environments, by
increasing chlorophyll a concentrations, suggesting that colonies of these corals from SMK have
the ability to adapt to reduced light environments in a relatively short amount of time. This and
future studies of S. radians and its responses to the myriad effects of eutrophication will be
valuable when attempting to implement sustainable management of the St. Martins Keys and true
coral reefs elsewhere.
10
CHAPTER 1 INTRODUCTION
As human populations grow, anthropogenic activities introduce increasing quantities of
sediments, nutrients, and other pollutants into coastal waters (Roberts et al. 2002, Brun et al.
2003). In particular, increased nutrient delivery caused by industrial and domestic wastewater,
deforestation, and agricultural and urban run-off often can result in changes in the production
characteristics of estuarine and nearshore ecosystems that, in turn, alters their structure and
function (Duarte 1995, Valiela et al. 1997). For example, eutrophication can result in a
proliferation of phytoplankton, epiphytes, and drift macroalgae (Duarte 1995, Ruiz & Romero
2001, Brun et al. 2003, Lamote & Dunton 2006). One typical change in eutrophic waters is a
shift from nutrient limitation to light limitation (Duarte 1995). Such a change can greatly affect
sessile organisms that rely directly on photosynthesis because they cannot seek out a more
suitable light environment.
Nearshore corals, whether reef-building or solitary, are affected by light availability
because they rely on symbiotic algae known as zooxanthellae. In fact, photosynthetically active
radiation (PAR; 400-700 nm) and short wavelength radiation (UVR; 290-400 nm) strongly
influence both the distribution and physiology of corals because these forms of energy influence
zooxanthellae (Hoegh-Guldberg 1999). The most common zooxanthellae are dinoflagellates in
the genus Symbiodinium (Rowan 1998). Symbiodinium is a genetically diverse genus that seems
to comprise a yet-to-be-defined number of ecologically distinct types, clades or species
(LaJeunesse 2001). Zooxanthellae supply their hosts with energy and essential compounds by
translocating up to 95% of their photosynthetic production in the form of leaked amino acids,
sugars, complex carbohydrates and small peptides (Hoegh-Guldberg 1999). In return, the host
supplies its symbionts with essential nutrients in the form of ammonia and phosphate from its

11
waste (Hoegh-Guldberg 1999). Factors that stress zooxanthellae can often impact their ability to
photosynthesize and supply nutrients and other essential compounds to their Cnidarian host,
which can cause deleterious changes in the host. Thus, tracking changes in zooxanthellae
abundance and their chlorophyll content allows researchers and managers alike to understand
and possibly predict how coral populations will react or adapt to environmental stressors.
In the waters surrounding the St. Martin’s Keys (SMK), located near the Homosassa River,
recent survey work has revealed a large population of the scleractinian coral, Siderastrea
radians, previously unstudied by the scientific community (Lazar 2008). This species,
however, is common in Florida, the Bahamas, and the Caribbean (Amos & Amos 1997, Bak &
Meesters 1999, Humann & Deloach 2002), often inhabiting flat or rocky substrates, shallow
reefs, and back reefs (Humann and Deloach 2002). Like most corals, S. radians has an intimate
symbiotic relationship with a type of zooxanthellae, Symbiodinium type B5a. This type is known
to tolerate temperatures up to 36 oC (Warner et al. 1999) and predominate in very shallow waters
where irradiance is high. Siderastrea radians generally are a stress tolerant species (see Lirman
et al. 2002, Lirman et al. 2003).
In the SMK, Siderastrea radians, is found primarily in relatively shallow (< 3 m) waters.
In this region, a long-term monitoring program (Project COAST) has documented conditions in
five coastal systems since 1997 (see Jacoby et al. 2008). The Homosassa River system, which is
nearest the SMK, has been exhibiting changes that indicate the potential for detrimental
eutrophication, including increased nutrient concentrations, increased periphyton loads and loss
of submerged aquatic vegetation (Frazer et al. 2006a, 2006b). Such effects point to reduced light
availability as a key concern in this region. Thus, an improved understanding of how S. radians
colonies in the SMK respond to shading will assist local managers in making sustainable
12
decisions regarding nutrient loadings and provide insights that are likely to be applicable to other
scleractinian corals.
A large number of shading studies have been conducted on vegetated habitats, including
seagrass meadows (see Fitzpatrick & Kirkman 1995, Ruiz & Romero 2001, Brun et al. 2003,
Fokeera-Wahedally & Bhikajee 2005) and kelp forests (Kennelly 1989). Fewer shading studies
have been conducted on corals (but see Rogers 1979, Lirman et al. 2003), and of those, most
were long term (i.e., 30 days or longer). In general, shading studies have shown that
concentrations of chlorophyll a and other photosynthetic pigments within zooxanthellae, and
other algal species, increase under low light intensity and decrease under high light intensity
(Kirk 1994, Hoegh-Guldberg 1999). In this study, I experimentally manipulated the light
environment of Siderastrea radians colonies in the shallow, coastal waters adjacent to the
Homosassa River by installing shading screens for a period of 10 days. Though eutrophication is
typically a longer, more gradual process, algal blooms are a common result (Duarte 1995).
These algal blooms often last for weeks, significantly reducing available light penetrating to the
bottom. Artificially shading S. radians for a short time should aid our understanding of how
such algal blooms affect these corals, whose symbionts rely on light for photosynthesis.
Although artificial shading is not equivalent to extreme turbidity or blooms of phytoplankton or
macroalgae, any of these influences can lower light intensity below the relevant light
compensation point and elicit similar responses in corals (Rowan 1998). Altering the amount of
light penetrating to S. radians in the SMK can provide insights into how zooxanthellae react or
adapt to reduced light in eutrophic environments. This research will augment our understanding
of the effects of eutrophication and facilitate improved management and conservation of corals
in eutrophic waters.

13
The objectives of this shading study were to quantify zooxanthellae densities, chlorophyll
a concentrations per unit surface area, and concentrations of chlorophyll a per zooxanthellae in
Siderastrea radians from the SMK before and after shading. The results will indicate if and how
S. radians responds to reduced irradiance over a relatively short amount of time (10 days).

14
CHAPTER 2 MATERIALS AND METHODS
Study Site
The study was conducted in the waters surrounding the St. Martins Keys (SMK; 28o 45.5'
N, 82o 37.1' W), located along the north-central Gulf coast adjacent to Citrus County, Florida.
These islands are contained within the St. Martins Marsh Aquatic Preserve and the
Chassahowitzka National Wildlife Refuge. The benthic habitat in the study area comprises a
varying mixture of patchy, locally dense Thalassia testudinum, Syringodium filiforme, and
Halodule wrightii on a limestone bed (Greenawalt-Boswell et al. 2007). Penicillis spp.,
Halimeda spp., and Acetabularia spp. are common macroalgae in the area (Mitchem, pers. obs.).
The coral assemblage at SMK comprises a nearly monospecific assemblage of Siderastrea
radians, with a few colonies of S. siderea. Corals are found in mean densities of 7 colonies m-2,
with maximum densities of 86 colonies m-2 (Lazar 2008).
The study area borders an extensive salt-marsh complex associated with the Homosassa
River, a spring-fed, coastal stream approximately 14.5 km in length (Frazer et al. 2006a, 2006b)
that discharges into the Gulf of Mexico. At two fixed sites that are monitored monthly in the
immediate vicinity of the study site (see Jacoby et al. 2008), water clarity in an 8-year time
period was generally good, allowing, on average, 40% of incident light to penetrate to the bottom
(mean depth = 0.88 m, mean light extinction coefficient (Kd PAR) = 1.05 m-1, mean Secchi depth
= 0.87 m). Water temperatures ranged from 9.6 oC to 33.3 oC, with a mean of 23.1 oC, and
salinities ranged from 11.95‰ to 36.39‰, with a mean of 25.06‰. The shallow coastal waters
in the area are well-flushed as a consequence of a semi-diurnal tidal range of ca. 1 m (Glancy et
al. 2003), driving, in large part, observed variations in salinity.

15
Field Work
Eight 2.25-m2 plots were established in a qualitatively homogenous section of the study
area. At each plot, 1.5-m x 1.5-m shading screens of dark gray fiberglass (Phifer Wire Products,
Inc., Tuscaloosa, AL, USA) were set at 60 cm above the limestone bottom following methods
reported by Calleja et al. (2006). Shade treatments targeted 0%, 25%, 50%, 75%, and 100% light
reduction, with 0%, 50%, and 100% treatments duplicated, yielding a total of eight study plots.
Shading plots were designed to cover at least 30 corals that were not within 0.25 m of the plot’s
border. Shades remained in place for 10 days, beginning 18 June 2008. Weather permitting,
water temperatures, salinities, water depths, dissolved oxygen concentrations, pH values, and
light attenuation coefficients were measured every day at noon (± 1 hour). In addition, screens
were examined and fouling organisms that might affect the light field were removed.
Actual light attenuation under the screens was assessed by measuring photosynthetically
active radiation (PAR, 400-700 nm) at the bottom using a LI-COR sensor (model LI-192SA) and
comparing this measurement with similar measures obtained with the sensor positioned above
the substrate in five different positions along a transect under each screen (outer left, inner left,
center, inner right, and outer right; Figure 2-1). The outer positions were approximately 0.5 m
from the center, and the inner positions were 0.25 m from the center. All measurements were
taken at noon on clear days under calm conditions.
On the 11th day (28 June 2008), 30 corals within each shading regime were harvested with
a hammer and chisel. Whenever possible, only corals more than 0.25 m from the edges of the
shades were collected. Harvested corals were immediately wrapped in tin foil and double-bagged
in Ziploc™ freezer bags (Broadbent et al. 2002). These bags were placed in a styrofoam cooler
with dry ice to freeze the corals as quickly as possible. Once a cooler was filled, its lid was
sealed with duct tape. Additionally, on the day the plots were assembled, 30 corals were taken

16
from the surrounding waters to serve as a baseline for the condition of all corals at the start of the
experiment. These corals, labeled ambient corals, were harvested and frozen in the same way as
the shaded corals. In total, 270 corals were harvested.
Sample Processing
Tissue was removed from the coral skeletons using the Waterpik™ method (see Johannes
& Wiebe 1970; Falkwoski & Dubinsky 1981; Broadbent et al. 2002; Edmunds & Gates 2002).
Filtered seawater was used to prevent cytolysis of zooxanthellae (Johannes & Wiebe 1970). The
seawater and tissue mixture was collected in a beaker and sieved, sequentially, through 40-µm
and 20-µm mesh sieves to remove debris and mucus. Three separate 2-ml samples were taken
from the mixture and preserved in Lugol’s for enumeration of zooxanthellae. The remaining
solution was vacuum filtered onto Whatman GF/F glass filters (nominal pore size = 0.7 µm) for
determination of chlorophyll a. The diameter and height of each coral skeleton also was
measured.
Chlorophyll samples were extracted in 90% ethanol for 24–72 hours. Extracted samples
were centrifuged, and chlorophyll a was measured using a spectrophotometeric technique, with
acidification and correction for phaeophytin (Sartory & Grobbelaar 1984).
Zooxanthellae densities were estimated by pouring each 2-ml sample into a settling
chamber and allowing the algal cells to settle for at least four hours. Samples in the settling
chambers were examined with the aid of an inverted microscope at 400x magnification.
Zooxanthellae were counted using a 250 x 250 µm grid, with each square in the grid measuring
25 x 25 µm. At least 100 cells were counted per sample, for a total of at least 300 cells per coral
colony. A conversion factor (CF) was obtained using Equation 2-1.
CF = 283.385 (2-1) 0.0625(Number of grids counted)(# ml settled)
17
The CF obtained in Equation 2-1 was multiplied by the total number of cells counted per sample
to calculate the number of zooxanthellae per ml. This value was multiplied by the total volume
of the coral tissue and seawater mixture to obtain the total number of zooxanthellae per colony.
Formulae for converting diameters and heights of corals to surface areas and numbers of
polyps were created using the tin foil method (see Marsh 1970; Fagoonee et al. 1999; Edmunds
& Gates 2002). The tin foil method required weighing 10 replicate squares for each of five
surface areas (i.e., 1 cm2, 4 cm2, 16 cm2, 36 cm2, and 64 cm2). A least-squares linear regression
was fit to the data, including the origin, to obtain a weight to surface area relationship. Next, tin
foil was wrapped around a sub-sample of 88 corals, with as little wrinkling as possible, and cut
around the bottom of the colony. These pieces of tin foil were weighed, and the surface areas of
the colonies were estimated using the regression equation created above. A least-squares linear
regression of the square roots of the estimated surface areas versus the square roots of the
products of the appropriate heights and radii was forced through the origin to yield an equation
for converting heights and/or diameters to surface areas. Polyps were counted on the 88 corals,
and a least-squares linear regression of number of polyps versus estimated surface area was
forced through the origin to provide an equation for converting surface area to number of polyps.
Data Analysis
The relative amount of shading and its consistency under the shades was tested by
converting irradiance measurements obtained during the experiment to proportion of the light
available at the bottom. Data were balanced by randomly selecting one of the two duplicate
values for the 0%, 50% and 100% treatments. The resulting data were arcsin transformed. A
Ryan-Joiner test for normality, a Cochran’s test for homoscedasticity and a nested analysis of
variance (ANOVA) were conducted on the transformed data. The ANOVA had levels of shading
18
as a fixed factor and position under the shade as a nested factor. A Tukey’s test was conducted to
determine differences among levels within a significant factor. Type I error rates for the
ANOVA and Tukey’s test were chosen according to the results of Ryan-Joiner and Cochran’s
tests. Means and 95% confidence limits were calculated, back-transformed and plotted.
Chlorophyll and zooxanthellae data were transformed into µg chl a cm-2 (or µg chl a
polyp-1) and cells cm-2 (or cells polyp-1), respectively. These standardized measures allow
physiological data to be compared among corals of different types, shapes and sizes (Edmunds &
Gates 2002).
For all analyses, zooxanthellae densities, chlorophyll a concentrations cm-2, and
concentrations of chlorophyll a zooxanthellae-1 were tested for normality using a Ryan-Joiner
test and tested for homoscedasticity using Cochran’s test. The data were transformed if
necessary. A nested ANOVA was conducted using the data from the replicated 0%, 50% and
100% treatments, with plots nested within the fixed factor treatments. Based on the results from
this analysis, data were either pooled (no significant variation between replicate plots) or
balanced by randomly selecting one replicate for inclusion in a one-way ANOVA with treatment
as a fixed factor, with five levels. Tukey’s tests were conducted to detect differences among
levels in significant factors. Type I error rates for the ANOVAs and Tukey’s tests were chosen
according to the results of Ryan-Joiner and Cochran’s tests. Means and 95% confidence intervals
were calculated, back-transformed and plotted.

19
Figure 2-3. Locations under each shading treatment (1.5 x 1.5-m plots) where light was
measured.

20
CHAPTER 3 RESULTS
General Site Characteristics
The weather during the experiment varied (Table 3-1). On 5 days, the weather at the site
was sunny to partly sunny and calm. On the other 5 days, however, the area experienced heavier
cloud cover, severe thunderstorms and rain. On three days, rain fell at nearby locations but not at
the study site, and on two days, rain was not recorded in the area.
In contrast to rainfall, conditions in the nearshore waters were relatively constant
throughout the experiment. Means ± standard deviations (SD) for water temperatures and
salinities were 28.99 ± 0.76 oC and 30.92 ± 1.05‰, respectively. Mean water depth at the study
site during the experiment was 1.66 ± 0.31 m, with bottom Secchi measurements on all days.
Mean dissolved oxygen concentration was 4.77 ± 1.00 mgL-1, and mean pH was 7.88 ± 0.12
during the experiment. The mean light attenuation coefficient (Kd PAR) measured on five days
during the experiment was 0.512 ± 0.130 m-1, which indicated that approximately 43% of
incident light penetrated to the bottom.
Confirming Light Reduction Treatments
Arcsin transformed proportions of light penetrating under the shades were found to be non-
normal (p < 0.01) and homoscedastic (p > 0.05), suggesting that significant results should be
interpreted cautiously. A nested ANOVA indicated that there were significant differences in light
levels under different shading treatments (F = 315.15, df = 3, 8, p < 0.001; Table 3-2), but not
among the outer, inner, and center measurement points under each treatment (F = 0.33, df = 8,
78, p = 0.950; Table 3-2). A Tukey’s test (Type I error rate = 0.001; Figure 3-1) indicated that
significantly less light penetrated under the 100% and 75% treatment than under the 50% and

21
25% treatments, which were not significantly different. Overall, mean proportions were within
5–17% of their relative target values.
Light reductions under the various shading treatments also were compared with monthly
light data from two Project COAST stations (see Jacoby et al. 2008) near the experimental area
(Homosassa Stations 6 and 7). Irradiance (µE m-2 s-1) under all treatments was less than the mean
irradiance in June or any other month of the year, as calculated with data from eight years (1999-
2007; Figure 3-2). Light reaching corals in the 0% shade treatment was similar to the mean light
reaching the bottom during the months of June in the eight years.
The mean diameter (± SD) of Siderastrea radians colonies was 38.6 ± 13.8 mm, and the
mean height was 22.8 ± 8.8 mm. The smallest diameter measured was 14.6 mm, and the largest
was 80.4 mm. The smallest height measured was 4.8 mm, and the largest was 49.7 mm.
The linear regression of foil surface areas to weights was significant (r2 = 0.99, n = 50, p <
0.001; Figure 3-3). The weight of tin foil (mg) was related to surface area (cm2) by Equation 3-1.
Surface area = 230.6 (Weight of foil) (3-1)
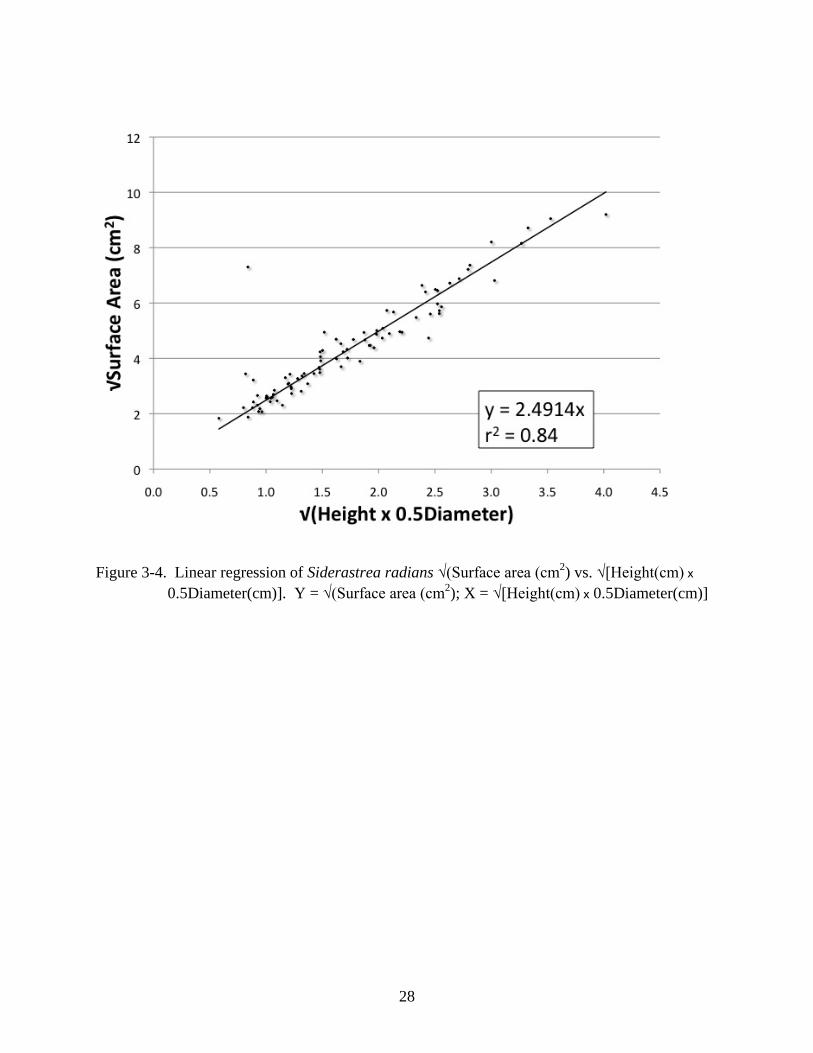
The weights of pieces of foil wrapped around 88 Siderastrea radians colonies were
regressed against their expected surface area, obtained using Equation 3-1. The surface areas of
S. radians colonies were similar to those of hemispheres, and a significant linear regression of
square roots of estimated surface areas versus square roots of the products of the appropriate
heights and radii (r2 = 0.84, n = 88, p < 0.001; Figure 3-4) was converted to Equation 3-2 for
calculating surface area (cm2) from height (cm) and diameter (cm).
Surface area = 6.2071(Height x 0.5Diameter) (3-2)
A significant linear regression (r2 = 0.92, n = 88, p < 0.001; Figure 3-5) related estimated
number of polyps per colony to surface area (cm2) according to Equation 3-3.

22
Number of polyps = 7.212(Surface area) (3-3)
Changes in Zooxanthellae Densities
Counts of zooxanthellae cm-2 were tested for normality and homoscedasticity using a
Ryan-Joiner test and Cochran’s test, respectively. The results from these tests indicated that the
data were non-normal and had unequal variances. To correct for this, zooxanthellae cells cm-2
were log10-transformed. After transformation, a Ryan-Joiner test for normality and a Cochran’s
test for homoscedasticity indicated that data remained non-normal (p <0.01) and variances
remained unequal (p < 0.01), which suggests cautious interpretation of significant results. A
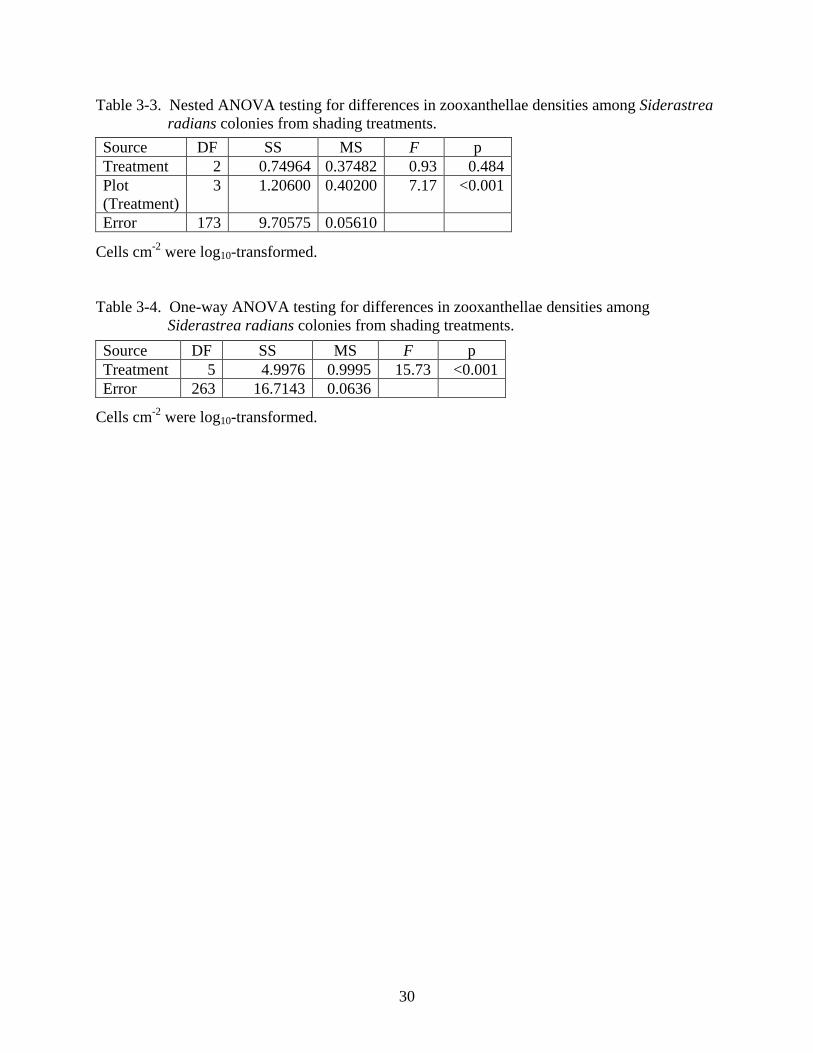
nested ANOVA indicated significant differences between duplicate plots (F = 7.17, df = 3, 173,
p < 0.001; Table 3-3), but not among treatments (F = 0.93, df = 2, 3, p = 0.484; Table 3-3).
Given these results, counts of zooxanthellae cm-2 were balanced by randomly selecting 30
corals from the duplicate 0%, 50%, and 100% light reduction treatments. The log10-transformed
data were non-normal (p < 0.01) and variances were unequal (p < 0.01), so results of the
ANOVA were interpreted cautiously. A one-way ANOVA indicated significant differences
among shading treatments (F=13.84, df = 5, 263, p < 0.001; Table 3-4; Figure 3-6). Results of an
ANOVA using zooxanthellae cells polyp-1 were the same because the ANOVA is not affected by
linear scaling. A Tukey’s test (Type I error rate = 0.001) indicated that fewer zooxanthellae cm-2
were found in corals from the 25% light reduction treatment (Figure 3-6).
Changes in Chlorophyll a Concentrations
Due to a malfunctioning spectrophotometer, chlorophyll a samples from one plot of the
0% shading treatments and all of the 25% and 100% shading treatments were lost. Therefore, no
nested ANOVAs were performed on chlorophyll data per unit surface area, per polyp, or per
zooxanthellae. Log10-transformed chlorophyll a concentrations were normal (p > 0.10) and
homoscedastic (p > 0.05). A one-way ANOVA indicated that concentrations of chlorophyll a

23
cm-2 differed significantly among shading treatments (F = 6.44, df = 3, 146, p < 0.001; Table 3-
5; Figure 3-7). Results of an ANOVA using concentrations of chlorophyll a polyp-1 were the
same since the ANOVA is not affected by linear scaling. A Tukey’s test (Type I error rate =
0.05) indicated that ambient Siderastrea radians colonies, i.e., those collected at the start of the
experiment, had less chlorophyll a per unit area or polyp than those from all other treatments,
which were not significantly different.
Changes in Chlorophyll a Per Zooxanthellae
Chlorophyll concentrations expressed as log10-transformed pg chl a zooxanthellae-1 were
normal (p > 0.10) and homoscedastic (p > 0.05). A one-way ANOVA indicated that
concentrations of chlorophyll a zooxanthellae-1 were significantly different among shading
treatments (F = 23.64, df = 3, 146, p < 0.001; Table 3-6). A Tukey’s test (Type I error rate =
0.05) indicated that colonies from the 0% treatment yielded the least concentrations of
chlorophyll a zooxanthellae-1, with ambient colonies yielding intermediate concentrations, and
50 % and 75 % shading treatments yielding the highest concentrations, which were not
significantly different (Figure 3-8). Mean chlorophyll a concentrations zooxanthellae-1 increased
by 58.6% between corals from the 0% and 50% treatments, but there was an increase of only
3.6% between corals from the 50% and 75% treatments.

24
Table 3-1. Weather during the experiment.
Rainfall data obtained from the Southwest Florida Water Management District (http://bkvscadasrv03.swfwmd.state.fl.us/public/) Table 3-2. Nested ANOVA testing for differences in proportion of light at the bottom for
various locations under shading treatments.
Light data were arcsin(√proportion) transformed.
Day Date Site Weather 28o 45'30" N 82o 37'6" W
Daily Rainfall (mm) Ozello
Station #1160 28o 51'12" N 82o 35'45" W
Daily Rainfall (mm) Chassahowitzka Station #6113 28o 43'18" N 82o 33'5" W
1 18 June 2008 Stormy 100% cloud cover
1.016 6.858
2 19 June 2008 Sunny 75% cloud cover
2.032 2.794
3 20 June 2008 Sunny 0% cloud cover
0.000 0.000
4 21 June 2008 Stormy 100% cloud cover
11.176 4.318
5 22 June 2008 Stormy 100% cloud cover
10.922 6.858
6 23 June 2008 Stormy 100% cloud cover
1.524 0.254
7 24 June 2008 Sunny 75% cloud cover
0.000 0.000
8 25 June 2008 Sunny 0% cloud cover
6.096 8.382
9 26 June 2008 Sunny 55% cloud cover
0.254 8.890
10 27 June 2008 Stormy 100% cloud cover
0.254 0.254
Source DF SS MS F p Treatment 3 3.84548 1.28183 315.15 <0.001 Location (Treatment) 8 0.03030 0.00379 0.33 0.950 Error 78 0.88490 0.01134

25
Figure 3-1. Back-transformed mean proportions of light penetrating under shading treatments
with 95% confidence limits. Different letters indicate significantly different means according to a Tukey’s test.

26
Figure 3-2. Mean irradiances measured at the bottom at two stations for Project COAST
(Stations 6 and 7) and in all treatments during the experiment.

27
Figure 3-3. Linear regression of surface area (cm2) vs. weight of tin foil (mg) for 5 standard
surface areas (1cm2, 4 cm2, 16 cm2, 36 cm2,and 64 cm2). Y = Surface area (cm2); X = Weight of foil (mg)
28
Figure 3-4. Linear regression of Siderastrea radians √(Surface area (cm2) vs. √[Height(cm) x
0.5Diameter(cm)]. Y = √(Surface area (cm2); X = √[Height(cm) x 0.5Diameter(cm)]

29
Figure 3-5. Linear regression of number of polyps vs. Siderastrea radians estimated surface area
(cm2). Y = Number of polyps; X = Surface area (cm2)
30
Table 3-3. Nested ANOVA testing for differences in zooxanthellae densities among Siderastrea radians colonies from shading treatments.
Cells cm-2 were log10-transformed. Table 3-4. One-way ANOVA testing for differences in zooxanthellae densities among
Siderastrea radians colonies from shading treatments.
Cells cm-2 were log10-transformed.
Source DF SS MS F p Treatment 2 0.74964 0.37482 0.93 0.484 Plot (Treatment)
3 1.20600 0.40200 7.17 <0.001
Error 173 9.70575 0.05610
Source DF SS MS F p Treatment 5 4.9976 0.9995 15.73 <0.001 Error 263 16.7143 0.0636

31
Figure 3-6. Back-transformed mean densities of zooxanthellae (cells cm-2) with 95% confidence
intervals for Siderastrea radians colonies from different shading treatments. Different letters indicate significantly different means according to a Tukey’s test.

32
Table 3-5. One-way ANOVA testing for differences in chlorophyll a concentrations among Siderastrea radians colonies from shading treatments.
Concentrations (µg chlorophyll a cm-2) were log10-transformed.
Source DF SS MS F p Treatment 3 0.7201 0.2400 6.44 <0.001 Error 146 5.4434 0.0373

33
Figure 3-7. Back-transformed mean concentrations of chlorophyll a (µg cm-2) with 95%
confidence intervals for Siderastrea radians colonies from different shading treatments. Different letters indicate significantly different means according to a Tukey’s test.

34
Table 3-6. One-way ANOVA testing for differences in chlorophyll a concentrations within zooxanthellae from shaded Siderastrea radians colonies.
Concentrations (pg chlorophyll a zooxanthellae-1) were log10-transformed.
Source DF SS MS F p Treatment 3 1.0746 0.3582 23.63 <0.001 Error 146 2.2136 0.0152

35
Figure 3-8. Back-transformed mean concentrations of chlorophyll a (pg zooxanthellae-1) with
95% confidence intervals for Siderastrea radians colonies from different shading treatments. Different letters indicate significantly different means according to a Tukey’s test.

36
CHAPTER 4 DISCUSSION
Light Reduction Treatments
ANOVA results indicated that light reduction treatments performed in the expected rank
order (25% < 50% < 75% < 100%). Actual light reduction under shading treatments, however,
differed from the target values. The 25% shading treatment was closer to 40% light reduction,
making this treatment statistically equal to the light reduction in the 50% shading treatments,
which achieved an actual mean of 50% light reduction. The 75% shading treatment reduced the
available light by 83% on average. Therefore, the 75% light reduction treatment was statistically
equal to the 100% light reduction treatment, which reduced light penetrating under the screen by
97%. Results also indicate that light was reduced consistently underneath each shading
treatment, so corals harvested closer to the edge of the plots experienced the same light regime as
corals harvested from the center of each plot.
Irradiance (µE m-2 s-1) penetrating under all shading treatments was less than the mean
irradiance penetrating to the bottom in any month for eight years (1999-2007). On sunny days,
light reaching corals in the 0% shading treatment was similar to light reaching the bottom during
June for the same eight years. It is unclear how event-driven light reduction, such as the storms
during the experiment, affected the irradiance penetrating to the bottom.
Surface Area and Polyps
Results of a regression using height and diameter of Siderastrea radians colonies suggest
these parameters can be used to predict the surface area of colonies with high accuracy. The
results of the linear regression indicated that S. radians surface area was an accurate predictor of
the number of polyps colony-1. Surface area estimations suggest that S. radians in the SMK are
roughly hemispherical. Thus, by simply measuring the diameter of these colonies, surface areas,

37
numbers of polyps per colony and heights (see Lazar 2008) can be estimated. These results
could allow researchers to estimate a variety of parameters from diameters measured in the field
without having to harvest colonies. Additionally, linear scaling meant that analyzing data
expressed in terms of surface area was equivalent to analyzing data expressed in terms of polyps.
Changes in Zooxanthellae Densities
Results suggest that zooxanthellae densities vary spatially, i.e. between plots within
treatments. Therefore, data from replicate treatments were not pooled. The results of a balanced
ANOVA indicate that increased shading did not yield consistent changes in densities of
zooxanthellae. Only colonies from the 25% treatment had significantly lower densities. This
result could be due to experimental factors, such as the 25% treatment being closer to 40%
shading than 25% (Figure 3-1) or a variety of untested natural factors.
One post hoc hypothesis was that S. radians in 25% light reduction treatments were
consistently smaller or larger than colonies in other treatments. Cumulative size frequency
distributions based on diameters of corals from each shading treatment were similar, except
ambient corals were larger (Figure 4-1). Thus, size was not likely to be a cause of the differences
in the corals from the 25% shading treatment.
The lack of change in zooxanthellae densities among shaded Siderastrea radians from
SMK is not unexpected. In one study, Falkowski and Dubinsky (1981) collected Stylophora
pistillata from the Gulf of Eilat and transplanted colonies from high to low light environments.
Stylophora pistillata zooxanthellae densities did not change with exposure to reduced light
conditions. Producing more cells is thought to be more energy intensive than increasing the
amount of photosynthetic pigments per cell. In fact, it is common for unicellular algae to
increase the concentration of their photosynthetic pigments under reduced light conditions rather
than investing energy in cell division (Kirk 1994).

38
Zooxanthellae densities in Siderastrea radians from the SMK were lower than reported for
other coral species (Table 4-1). It has been suggested, however, that there is considerable
variation in density within a coral colony throughout the year (0.5 x 10⁶ to 5 x 106 cm-2), with
fluctuations over three orders of magnitude among coral colonies (Fagoonee et al. 1999). For
example, Fagoonee et al. (1999) also found that zooxanthellae densities in Acropora formosa
were lower in the spring and summer months, possibly due to the high levels of irradiance in the
summer and spring, compared to the lower light levels in fall and winter. Although at the SMK,
there is less light penetration in the summers, the days are longer. Corals may be responding to a
longer duration of light in the summer, rather than increased light intensity. Therefore, S.
radians taken from the SMK in June may be expected to have lower zooxanthellae densities than
colonies collected in the winter. Additionally, there is evidence of a regulatory mechanism
governing zooxanthellae densities, because zooxanthellae densities have been shown to depend
on densities measured in the previous week (Fagoonee et al. 1999). This relationship suggests
that the zooxanthellae may take longer than a week to adjust their numbers in response to
environmental variations and stressors.
Further research, in the form of long-term monitoring and shading studies, would help
clarify the questions related to lowered zooxanthellae densities in Siderastrea radians from
SMK. Two types of studies should be conducted. First, a long-term monitoring of S. radians in
the SMK could elucidate natural cycles in zooxanthellae densities over months, seasons, and
even years to determine if densities vary through time. The second study, a long-term shading
project, could further investigate if the non-significant difference in densities between the 0%
and 100% shading treatments might continue as a trend and result in an adaptation, given enough
time. A long-term shading study would prolong stress, which would give S. radians more time

39
to alter their zooxanthellae densities. For example, the difference between the zooxanthellae
densities in corals from the 100% and 0% shading treatments would translate into an increase of
7400 zooxanthellae d-1 if unshaded corals acted as a reliable control.
Changes in Chlorophyll a Concentrations
Siderastrea radians colonies from SMK not exposed to shading had lower concentrations
of chlorophyll a than four species of Porites, Stylophora pistillata, and three species of
Montastraea (Table 4-1). Thus, S. radians colonies in the SMK may have lower chlorophyll a
concentrations under normal conditions than some other species of coral. This is not unexpected
for algae, both unicellular and multicellular, living in high light environments (Kirk 1994). In
fact, the type of zooxanthellae found in Siderastrea radians, Symbidinium type B is known as a
“sun-specialist” and predominates in corals living in very shallow water (Rowan 1998).
Ambient corals that were taken before the experiment started (Day 0) had lower
chlorophyll a concentrations than corals from 0% shade treatments harvested at the end of the
experiment (Day 11). This suggests that something unrelated to the shading experiment may
have altered light in the SMK between Day 0 and Day 11, such as the large amount of rain the
area received during the experiment.
Chlorophyll a concentrations from 50% and 75% shading treatments were not significantly
different from the 0% treatment. These results combined with the results for zooxanthellae
density suggest that chlorophyll a concentrations zooxanthellae-1 may be the key to
understanding how S. radians in SMK adapt to reduced light availability.
Changes in Chlorophyll a Per Zooxanthellae
Results indicate that concentrations of chlorophyll a per zooxanthellae were lowest in
Siderastrea radians colonies in the 0 % shading treatment, with ambient (Day 0) colonies having
slightly higher concentrations. Colonies from the 50% and 75% shading treatments exhibited the

40
highest concentrations, which were statistically equal. From the 0% to the 50% light reduction
treatment, chlorophyll a concentrations per cell increased 58.6%, but from 50% to 75% light
reduction, there was an increase of only 3.6%. These results are not unexpected. Many species
of algae increase the amount of photosynthetic pigments they contain when exposed to reduced
light intensity. Some species of algae are even known to increase their pigment concentrations
two- to five-fold (Kirk 1994). Algal species that are successful in low light environments can
increase their pigment concentrations in one of two ways. They can either increase the number
of photosynthetic units per cell or increase the size of existing photosynthetic units (Richardson
et al. 1983). For example, in most green plants, including algae, it appears that the increase in
chlorophyll content during shade adaptation is largely due to an increase in the number of
photosynthetic units, rather than their size (Kirk 1994). Shade adaptation in zooxanthellae,
however, is seemingly due to an increase in the size of photosynthetic units, rather than the
number of photosynthetic units per cell (Falkowski & Dubinsky 1981, Kirk 1994). In fact,
Richardson et al. (1983) argued that increasing the size of the photosynthetic unit was more
energetically efficient. As a consequence of increasing the size of photosynthetic units in cells,
shade-adapted algae have higher photosynthetic rates per unit biomass than their high light-
adapted counterparts (Falkowski & Dubinsky 1981, Kirk 1994). It is unclear which tactic S.
radians in SMK used to increase their chlorophyll a concentrations per cell, but it is reasonable
to conclude that they probably increased the size of their photosynthetic units, as this is typically
how zooxanthellae respond to reduced irradiance.
The 58.6% increase in chlorophyll a per zooxanthellae in Siderastrea radians subjected
to 50% shading, relative to unshaded corals, combined with the 3.6% increase in chlorophyll a
per zooxanthellae between corals subjected to 75% shading and those subjected to 50%, suggests
41
that zooxanthellae may be reaching the point at which they can no longer increase the
chlorophyll a concentrations in their cells and maintain basic metabolism. Exactly when
zooxanthellae reach the compensation point where photosynthesis cannot keep up with
respiration is not clear and not every species or type of Symbiodinium necessarily has the same
compensation point. For example, Rogers (1979) shaded 10 species of coral for 5 weeks.
During that time, Acropora cervicornis was the first to respond to shading stress, bleaching after
only 3 weeks. At the end of 5 weeks, Diploria labyrinthiformis and Montastrea annularis were
pale, but not white, indicating a negative stress response, but no coral death. The other 7 species
of coral shaded during the 5 weeks had some pale areas, but remained fairly healthy. Of these
healthy species, one was Acropora agaricites, indicating that even corals in the same genus can
have very different stress responses. Siderastrea siderea, a close relative of S. radians,
recovered from shading stress better than all other species in the experiment (Rogers 1979). This
result may be related to the fact that S. sidera colonies harbor Symbiodinium type C1
(LaJeunesse 2001), a known shade-adapted type (Rowan 1998). As the zooxanthellae in S.
radians are notoriously “sun-loving” (Rowan 1998), they may have a lower light compensation
point. However, because the zooxanthellae in the experiment were subjected to a high level of
shading relatively quickly, they may not have had enough time to adjust their light compensation
point.
In addition, the capacity for zooxanthellae to accumulate pigments must be finite.
Zooxanthellae are typically small, 5–10 µm in diameter, and type B zooxanthellae, those found
in Siderastrea radians, are among the smallest (LaJeunesse 2001). Because the rate of increase
in chlorophyll a per cell was less from 50% to 75% light reduction, the maximum chlorophyll a

42
per zooxanthellae for S. radians could be around 4.3 pg chlorophyll a, which was the mean
concentration across the two treatments.
Lastly, Siderastrea radians zooxanthellae are evolutionarily adapted to high levels of
irradiance, and they might not change chlorophyll a concentrations quickly. Both 50% and 75%
light reduction treatments were of the same duration – 10 days. If the experiment had been
continued for another 10 days, the chlorophyll a concentrations per zooxanthellae for corals in
the 50% light reduction treatment may have stayed constant and the concentrations for corals in
the 75% treatment may have increased. Assuming 0% shading treatments acted as a reliable
control, S. radians’ zooxanthellae had an estimated gain of 0.1713 pg chlorophyll a day-1, which
is faster than the rate reported for Styphora pistillata (0.1567 pg chloropyll a day-1; Falkowski &
Dubinsky 1981). Thus, S. radians may be increasing their chlorophyll a per zooxanthellae at
their maximum rate, and colonies subjected to light reductions greater than 50% may require
longer than 10 days to adapt completely.
Conclusions
A long-term shading and monitoring approach, as previously described, could help answer
questions as to how zooxanthellae respond and adapt to reduced irradiance. Long-term
monitoring and shading studies could utilize underwater fluorometers (i.e. DIVING-PAM;
Hoegh-Guldberg & Jones 1999; Winters et al. 2003; Hoogenboom et al. 2006) to detect changes
in photosynthetic capacity, in situ, and these measurements could be converted to chlorophyll
concentrations using a calibration curve developed by sampling some colonies. The required
surface areas, numbers of polyps, and heights, could be estimated from simple diameter
measurements that could be taken in the field, without harvesting colonies. Such studies would
provide insights into the light compensation point for corals.

43
Despite the unanswered questions remaining at the end of this study, insights were gained
into how Siderastrea radians in the SMK adapt to shading stress. Importantly, S. radians’
zooxanthellae, though “sun-loving,” did respond to lowered light conditions, by increasing
chlorophyll a concentrations zooxanthellae-1. This suggests that S. radians, along with being
unusually tolerant of high and low temperatures (Macintyre 2003) and burial (Rice & Hunter
1992, Lirman et al. 2002, Lirman et al. 2003), has the ability to adapt to reduced light
environments in a relatively short amount of time (~10 days). Eutrophication is usually a
gradual process, occurring stepwise over time. The short-term response of S. radians’
zooxanthellae to reduced irradiance suggests that these corals can respond quickly enough to
cope with the gradual reduction in light availability caused by eutrophication.
Along with being gradual, reductions in light availability as a result of eutrophication are
typically long-lasting, often reducing irradiance for all attached photosynthetic organisms over
months or years. Whether the zooxanthellae in Siderastrea radians can continue to adapt and
cope with long-term shading is unclear. Further research, including a long-term shading study of
S. radians in SMK is needed to elucidate their responses.
Increased shading is not the only effect that eutrophication has on coastal environments.
Eutrophication also causes major changes in submerged vegetation, including increased growth
of algae that can overgrow corals (Duarte 1995, Valiela et al. 1997). Another relevant
consequence of eutrophication are changes in benthic biogeochemical processes (Duarte 1995,
Nixon 1995). By definition, eutrophication causes an increase in organic matter (Nixon 1995),
which often results in increased remineralization of organic matter in the sediments and reduced
oxygen concentrations in bottom waters. Hypoxic and often anoxic conditions can, in turn,
decrease survivorship of benthic organisms (Duarte 1995). In addition, in eutrophic waters,

44
seagrasses are often lost, which can promote resuspension of sediments (Duarte 1995) and harm
corals by further reducing light, burying colonies, or preventing coral larvae from settling and
surviving. The consequences of eutrophication are diverse and more research is needed to fully
understand how corals, including S. radians from the St. Martins Keys, will adapt or cope with
such environmental changes.

45
Figure 4-1. Cumulative size frequency distributions for diameters of Siderastrea radians
colonies (n = 30) from different shading treatments.

46
Table 4-1. Zooxanthellae cells cm-2, µg chlorophyll a cm-2, and pg chlorophyll a zooxanthellae-1 for various coral species.
Values represent means ± standard deviations or ranges. A dash (–) indicates no data reported.
Species Depth (m)
106 cells cm-2
µg chl a cm-2
pg chl a cell-1
Reference
Siderastrea radians (Ambient)
2 0.3 ± 0.1 1.1 ± 0.6 3.4 ± 1.0 This Study
Siderastrea radians (0 % Shade)
2 0.5 ± 0.3 1.5 ± 0.7 2.8 ± 1.0 This Study
Stylophora pistillata – 1.6 ± 0.3 3.6 ± 1.1 2.2 ± 0.3 Falkowski and Dubinsky 1981
Porites lobata 0–2 1.5–6.9 9.3–47.5 4.5–16.7 Apprill et al. 2007 Porites lutea 0–2 2.3–5.6 17.3–29.3 4.4–9.8 Apprill et al. 2007 Porites astreoides 4–5 – 4.7 ± 2.0 2.2 ± 0.4 Myers et al. 1999 Porites porites 4–5 – 4.2 ± 2.3 3.7 ± 1.8 Myers et al. 1999 Acropora cervicornis
4–5 – 0.9 ± 0.8 0.9 ± 0.6 Myers et al. 1999
Agaricia tenuifolia 4–5 – 1.2 ± 0.8 1.6 ± 1.0 Myers et al. 1999 Favia fragum 4–5 – 0.9 ± 0.2 0.5 ± 0.5 Myers et al. 1999 Montastraea annularis
4–5 – 3.6 ± 0.8 1.1 ± 0.5 Myers et al. 1999
Montastraea cavernosa
4–5 – 5.4 ± 2.0 2.4 ± 1.2 Myers et al. 1999
Montastraea faveolata
10 – 5.4 ± 0.1 – Lesser et al. 2000
Montastraea cavernosa
10 – 6.8 ± 0.4 – Lesser et al. 2000

47
LIST OF REFERENCES
Amos WT, Amos SH (1997) Lesser Starlet Coral. In: Atlantic and Gulf Coasts. Chanticleer Press, New York. 472 pp
Apprill AM, Bidigare RR, Gates RD (2007) Visibly healthy corals exhibit variable pigment concentrations and symbiont phenotypes. Coral Reefs 26:387-397
Bak RPM, Meesters EH (1999) Population structure as a response of coral communities to global change. Amer Zoo 39:56-65
Broadbent AD, Jones GB, Jones RJ (2002) DMSP in corals and benthic algae from the Great Barrier Reef. Est Coast Shelf Sci 55:547-555
Brun FG, Vergara JJ, Navarro G, Hernandez I, Perez-Llorens JL (2003) Effect of shading by Ulva rigida canopies on growth and carbon balance of the seagrass Zostera noltii. Mar Ecol Prog Ser 265:85-96
Calleja ML, Barrón C, Hale JA, Frazer TK, Duarte CM (2006) Light regulation of benthic sulfate reduction rates mediated by seagrass (Thalassia testudinum) metabolism. Est and Coast 29:1255-1264
Duarte CM (1995) Submerged aquatic vegetation in relation to different nutrient regimes. Ophelia 41:87-112
Edmunds PJ, Gates RD (2002) Normalizing physiological data for scleractinian corals. Coral Reefs 21:193-197
Fagoonee I, Wilson HB, Hassell MP, Turner JR (1999) The dynamics of zooxanthellae populations: a long-term study in the field. Science 283:843-845
Falkowski PG, Dubinsky Z (1981) Light-shade adaptation of Stylophora pistillata, a hermatypic coral from the Gulf of Eilat. Nature 289:172-174
Fitzpatrick J, Kirkman H (1995) Effects of prolonged shading stress on growth and survival of seagrass Posidonia australis in Jervis Bay, New South Wales, Australia. Mar Ecol Prog Ser 127:279-289
Fokeera-Wahedally SBM, Bhikajee M (2005) The effects of in situ shading on the growth of a seagrass, Syringodium isoetifolium. Est Coast Shelf Sci 64:149-135
Frazer TK, Notestein SK, Keller SR, Jacoby CA (2006a) Water quality characteristics of the nearshore Gulf coast waters adjacent to Citrus, Hernando and Levy Counties: Project COAST 1997 – 2005. Final Report. Southwest Florida Water Management District, Brooksville, Florida. 119 pp

48
Frazer TK, Notestein SK, Pine WE (2006b) Changes in the physical, chemical and vegetative characteristics of the Homosassa, Chassahowitzka and Weeki Wachee rivers. Final Report. Southwest Florida Water Management District, Brooksville, Florida. 163 pp
Glancy TP, Frazer TK, Cichra CE, Lindberg WJ (2003) Comparative patterns of occupancy by decapods crustaceans in seagrass, oyster, and marsh edge habitats in a northeast Gulf of Mexico estuary. Estuaries 26:1291-1301
Greenawalt-Boswell J, Frazer TK, Jacoby CA, Arnold WS (2007) Mortality and exploitation rate estimates for the recreational bay scallop fishery off the Gulf Coast of Florida, USA. N Am J Fish Manage 24:1230-1242
Hoegh-Guldberg O (1999) Climate change, coral bleaching and the future of the world’s coral reefs. Mar and Fresh Res 50:839-866
Hoegh-Guldberg O, Jones RJ (1999) Photoinhibition and photoprotection in symbiotic dinoflagellates from reef-building corals. Mar Ecol Prog Ser 183:73-86
Hoogenboom MO, Anthony KRN, Connolly SR (2006) Energetic cost of photoinhibition in corals. Mar Ecol Prog Ser 313:1-12
Humann P, Deloach N (2002) Reef Coral Identification: Florida, Caribbean, Bahamas. New World Publications, Inc: Jacksonville, Florida. 278 pp
Jacoby CA, Frazer TK, Saindon DD, Keller SR, Behringer DC Jr (2008) Water quality characteristics of the nearshore Gulf coasts waters adjacent to Citrus, Hernando and Levy Counties: Project COAST 1997-2007. Annual Report. Southwest Florida Water Management District, Brooksville, Florida. 62 pp
Johannes RE, Wiebe WJ (1970) Method for determination of coral tissue biomass and composition. Limnol and Oceanogr 15:822-824
Kennelly SJ (1989) Effects of kelp canopies on understorey species due to shade and scour. Mar Ecol Prog Ser 50:215-224
Kirk JTO (1994) Light & photosynthesis in aquatic ecosystems. 2nd ed. Cambridge University Press, New York. 509 pp
LaJeunesse TC (2001) Diversity and community structure of symbiotic dinoflagellates from Caribbean coral reefs. Mar Biol 141:387-400
Lamote M, Dunton KH (2006) Effects of drift Macroalgae and light attenuation on chlorophyll fluorescence and sediment sulfides in the seagrass Thalassia testudinum. J Exp Mar Biol Ecol 334:174-186
Lazar KE (2008) Reproductive demography of the scleractinian coral Siderastrea radians in the St. Martins Keys, Florida: Spatial patterns in abundance, size, and reproductive characteristics. MS thesis, University of Florida, Gainesville, Florida. 85 pp

49
Lesser MP, Mazel C, Phinney D, Yentsch CS (2000) Light absorption and utilization by colonies of the congeneric hermatypic corals Montastraea faveolata and Montastraea cavernosa. Limnol Oceanogr 45:76-86
Lirman D, Manzello D, Macia S (2002) Back from the dead: the resilience of Siderastrea radians to severe stress. Coral Reefs 21:291-292
Lirman, D, Orlando B, Macia S, Manzello D, Kaufman L, Biber P, Jones T (2003) Coral communities of Biscayne Bay, Florida and adjacent offshore areas: diversity, abundance, distribution, and environmental correlates. Aquat Conserv 13:121-135
Macintyre IG (2003) A classic marginal coral environment: tropical coral patches off North Carolina, USA. Coral Reefs 22:474
Marsh JAJ (1970) Primary productivity of reef-building calcareous red algae. Ecology 51:255-263
Myers MR, Hardy JT, Mazel CH, Dustan P (1999) Optical spectra and pigmentation of Caribbean reef corals and macroalgae. Coral Reefs 18:179-186
Nixon SW (1995) Coastal marine eutrophication – a definition, social causes, and future concerns. Ophelia 41:199-219
Rice SA, Hunter CL (1992) Effects of suspended sediment and burial on scleractinian corals from west central Florida patch reefs. Bull Mar Sci 51:429-442
Richardson K, Beardall J, Raven JA (1983) Adaptation of unicellular algae to irradiance: an analysis of strategies. New Phytol 93:157-191
Roberts CM, McClean CJ, Veron JEN, Hawkins JP, Allen GR, McAllister DE, Mittermeier CG, Schueler FW, Spalding M, Wells F, Vynne C, Werner TB (2002) Marine biodiversity hotspots and conservation priorities for tropical reefs. Science 295:1280-1284
Rogers CS (1979) The effect of shading on coral reef structure and function. J Exp Mar Biol Ecol 41:269-288
Rowan R (1998) Diversity and ecology of zooxanthellae on coral reefs. J Phycol 34:407-417
Ruiz JM, Romero J (2001) Effects of in situ experimental shading on the Mediterranean seagrass Posidonia oceanica. Mar Ecol Prog Ser 251:107-120
Sartory DP, Grobbelaar JU (1984) Extraction of chlorophyll a from freshwater phytoplankton for spectrophotometric analysis. Hydrobiologia 114:177-187
Valiela IJ, McClelland I, Hauxwell J, Behr PJ, Hersh D, Foreman K (1997) Macroalgal blooms in shallow estuaries: Controls and ecophysiological and ecosystem consequences. Limnol Oceanogr 42:1105-1118

50
Warner ME, Fitt WK, Schmidt GW (1999) Damage to photosystem II in symbiotic dinoflagellates: A determinant of coral bleaching. Proc Natl Acad Sci USA 96:8007-8012
Winters G, Loya Y, Röttgers R, Beer S (2003) Photoinhibition in shallow-water colonies of the coral Stylophora pistillata as measured in situ. Limnol Oceanogr 48:1388-1393

51
BIOGRAPHICAL SKETCH
Emily L. Mitchem was born in 1984 in Atlanta, Georgia. She lived in Naples, Florida until
1998, when she moved to Rincon, Georgia, a suburb of Savannah, Georgia, with her parents.
Emily ran cross-country in high school and was often outside running. She attended school in
Georgia until she graduated in May 2002 from South Effingham High School, and left that same
summer to attend the University of Florida. At first, Emily wanted to be a doctor and majored in
microbiology. She soon learned that being a doctor involved being around numerous sick people
and changed her major to zoology, with plans of becoming a marine biologist. Emily took
“Doc” Maturo’s marine biology class during summer 2001 under Dr. Patrick Baker and realized
she had made the right choice in not becoming a doctor. With Dr. Shirley Baker under the
University Scholar’s Program, Emily completed an undergraduate thesis titled, “Native Florida
Crustacean Predators Preferences Regarding the Non-Indigenous Green Mussel, Perna viridis.”
In fall 2005, Emily received her Bachelor of Science in zoology (summa cum laude).
Immediately, Emily began working in Dr. Thomas Frazer’s lab doing lab and field work, with
the anticipation of starting her master’s degree in the fall. After two-and-a-half years of
working with Dr. Thomas Frazer, Emily received the Master of Science degree from the
University of Florida Fisheries and Aquatic Sciences Program in December 2008. After
graduation, Emily plans to teach high school biology.