Responses of Hordeum vulgare to a ... -...
24
1 Running title Responses of Hordeum vulgare to a short-term potassium deprivation Implication of phospholipase D in response of Hordeum vulgare root to a short-term potassium deprivation Hafsi C. a , Russo M.A. b , Sgherri C. c , Izzo R. c , Navari-Izzo F. c* , Abdelly C. a a Laboratoire d’Adaptation des Plantes aux Stress Abiotiques, Centre de Biotechnologie, BP 901, Hammam-Lif 2050, Tunisie b Dipartimento di Scienze Agronomiche, Agrochimiche e delle Produzioni Animali, via S.Sofia 98, Università di Catania, Italy c Dipartimento di Chimica e Biotecnologie Agrarie, via del Borghetto 80, Università di Pisa, Italy *Corresponding author: Tel.: +39-50-2216633; fax: +39-50-2216630; e-mail address: [email protected]
Transcript of Responses of Hordeum vulgare to a ... -...

1
Running title
Responses of Hordeum vulgare to a short-term potassium deprivation
Implication of phospholipase D in response of Hordeum vulgare root to a short-term
potassium deprivation
Hafsi C.a, Russo M.A.
b, Sgherri C.
c, Izzo R.
c, Navari-Izzo F.
c*, Abdelly C.
a
a Laboratoire d’Adaptation des Plantes aux Stress Abiotiques, Centre de Biotechnologie, BP 901,
Hammam-Lif 2050, Tunisie
b Dipartimento di Scienze Agronomiche, Agrochimiche e delle Produzioni Animali, via S.Sofia 98,
Università di Catania, Italy
c Dipartimento di Chimica e Biotecnologie Agrarie, via del Borghetto 80, Università di Pisa, Italy
*Corresponding author: Tel.: +39-50-2216633; fax: +39-50-2216630; e-mail address:
2
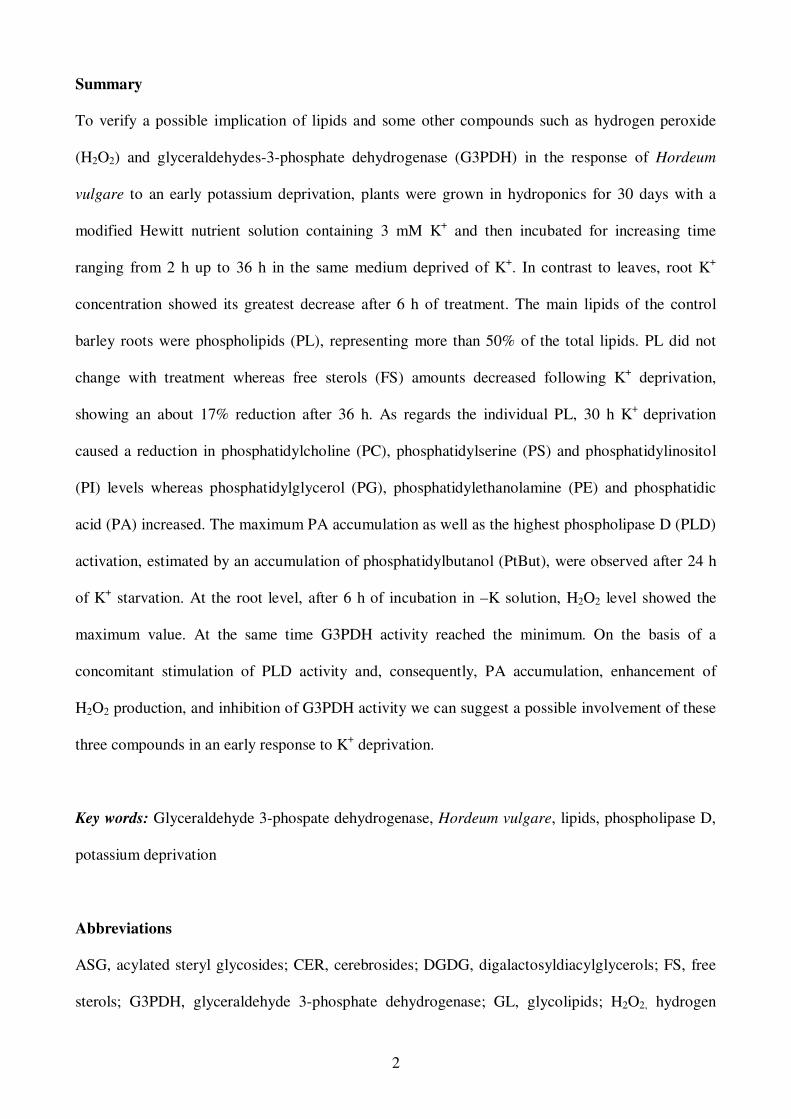
Summary
To verify a possible implication of lipids and some other compounds such as hydrogen peroxide
(H2O2) and glyceraldehydes-3-phosphate dehydrogenase (G3PDH) in the response of Hordeum
vulgare to an early potassium deprivation, plants were grown in hydroponics for 30 days with a
modified Hewitt nutrient solution containing 3 mM K+ and then incubated for increasing time
ranging from 2 h up to 36 h in the same medium deprived of K+. In contrast to leaves, root K
+
concentration showed its greatest decrease after 6 h of treatment. The main lipids of the control
barley roots were phospholipids (PL), representing more than 50% of the total lipids. PL did not
change with treatment whereas free sterols (FS) amounts decreased following K+ deprivation,
showing an about 17% reduction after 36 h. As regards the individual PL, 30 h K+
deprivation
caused a reduction in phosphatidylcholine (PC), phosphatidylserine (PS) and phosphatidylinositol
(PI) levels whereas phosphatidylglycerol (PG), phosphatidylethanolamine (PE) and phosphatidic
acid (PA) increased. The maximum PA accumulation as well as the highest phospholipase D (PLD)
activation, estimated by an accumulation of phosphatidylbutanol (PtBut), were observed after 24 h
of K+ starvation. At the root level, after 6 h of incubation in –K solution, H2O2 level showed the
maximum value. At the same time G3PDH activity reached the minimum. On the basis of a
concomitant stimulation of PLD activity and, consequently, PA accumulation, enhancement of
H2O2 production, and inhibition of G3PDH activity we can suggest a possible involvement of these
three compounds in an early response to K+ deprivation.
Key words: Glyceraldehyde 3-phospate dehydrogenase, Hordeum vulgare, lipids, phospholipase D,
potassium deprivation
Abbreviations
ASG, acylated steryl glycosides; CER, cerebrosides; DGDG, digalactosyldiacylglycerols; FS, free
sterols; G3PDH, glyceraldehyde 3-phosphate dehydrogenase; GL, glycolipids; H2O2, hydrogen
3
peroxide; MGDG, monogalactosyldiacylglycerols; PA, phosphatidic acid; PtBut,
phosphatidylbutanol, PC, phosphatidylcholine; PE, phosphatidylethanolamine; PG,
phosphatidylglycerol; PI, phosphatidylinositol; PL, phospholipids; PLD, phospholipase D; PS,
phosphatidylserine.
Introduction
In their natural environments, plants are subjected to multiple abiotic stresses including drought,
salinity, heavy metals, and nutrient deficiencies. The latter constraint affects seriously growth and
metabolism of plants on agricultural soils around the world (Wang, 2002). Among the essential
mineral nutrients, K+, as macronutrient, is needed for growth and metabolic process of plants. K
+
plays an important role in a wide range of functions: photosynthesis, enzyme activation, protein
synthesis and osmoregulation (Marschner, 1995). K+ deficiency usually causes numerous
physiological disorders, depressed plant growth and development and reduced crop yield and
quality. In a natural environment K+ concentrations vary widely in time and space and low-K
+
conditions are often transient. Therefore, plants, unable to move, must be able to adjust their uptake
systems rapidly to transient shortages in K+ supply (Grieth et al., 2005).
Although much is known about K+ uptake systems, little is known about the mechanisms by which
plants sense and respond to variations in the K+ concentrations (Shin and Schachtman, 2004).
In response to K+ deprivation, recent studies indicate the involvement of some compounds
considered as signalling molecules such as hydrogen peroxide (H2O2) (Hafsi et al., 2008), ethylene
(Shin and Schachtmann, 2004) and phytohormones such as auxin, and jasmonic acid (Armengaud et
al., 2004).
Recently, it has been demonstrated that phospholipase D (PLD, EC 3.1.4.4), besides its catabolic
function, has critical roles in cell signalling cascades (Meijer and Munnik, 2003; Navari-Izzo et al.,
2006; Russo et al., 2007; Sgherri et al., 2007). This enzyme hydrolyzes structural phospholipids at
the terminal phosphate diester bond, leading to the formation of phosphatidic acid (PA) and a free
4
head group such as choline, in the case of phosphatidylcholine (PC, Zhang et al., 2003). PA is
considered a second messenger in response to multiple environmental stresses, i.e. hyperosmotic
stress (Munnik et al., 2000), symbiotic interactions (Den Hartog et al., 2001), copper excess
(Navari-Izzo et al., 2006; Sgherri er al., 2007), and phosphate deprivation (Russo et al., 2007). In
vivo and in vitro studies in suspension cultured rice cells, Yamaguchi et al. (2004) demonstrated
that PLD is activated by H2O2 and this activation involves a protein tyrosine kinase. It has also been
suggested that H2O2 directly modulates the reactive cysteine residues of protein tyrosine kinase
(Meng et al., 2002) and glyceraldehydes-3-phosphate dehydrogenase (G3PDH; EC 1.2.1.12)
inhibiting their enzymatic activities (Schuppe-Koistinen et al., 1994). In animal cells (PC12 cells),
Kim et al. (2003) identified G3PDH as a H2O2-dependent positive regulator of PLD2 and found that
the interaction between G3PDH and PLD2 was highly dependent on oxidative modulation of
catalytic cysteine in G3PDH. Subsequently, these authors suggested that H2O2, besides its role in
the inactivation of the dehydrogenase activity of G3PDH on its catalytic site, may also endow
G3PDH with the ability to bind PLD2 and the resulting association is involved in the regulation of
PLD2 activity by H2O2. Recently, in the halophyte Hordeum maritimum subjected to a short
potassium deprivation, a clear relationship among H2O2 production, G3PDH inhibition and PLD
activation has been also demonstrated (Hafsi et al., 2008).
In this context, the present work focuses on changes in PLD and G3PDH activities, H2O2
production, and on alterations of root lipids in H. vulgare following short periods of K+ starvation.
The finding of a link among these compounds should be a useful tool for the further dissection of
signalling pathways involved in the perception of K+ changes at cellular and tissue level.
Materials and methods
Plant Material
Seeds of Hordeum vulgare (var. Manel) were obtained from the National Institute of Agronomic
Research of Tunis. Seeds were disinfected for 2 min with NaClO (approximately 2% of active
5
chlorine), abundantly rinsed in distilled water and imbibed for 16 h with running tap water. The
seeds were then placed on a floating layer of clay in plastic pots filled with 5 L of tap water. Three
days after sowing, the pots were filled with 5 L of modified Hewitt nutrient solution (1966). The
nutrient solution contained the following macronutrients: 1.5 mM MgSO4, 3.5 mM Ca (NO3)2, 5.4
mM NaNO3, 2 mM NH4H2PO4, and 3 mM KCl. The micronutrients (ppm) were: Mn (0.5), Cu
(0.04), Zn (0.05), B (0.5), Mo (0.02) (Arnon and Hoagland, 1940) and Fe (3) as Fe-tartaric acid
complex. Nutrient solutions were renewed twice per week. Cultivation was carried out in a growth
chamber with a day/night temperatures of 21°C/16°C, a 16 h photoperiod, a photon flux density of
400 µmol m-2
s-1
and 70-75% relative humidity. Light was provided by fluorescent tubes (Osram L
140W/20) and incandescent lamps (Philips 25W).
After a period of 30 d, roots of one set of intact plants were washed with distilled water and plants
transferred to the same growth medium but deprived of K+ for increasing periods of time (2, 6, 24,
30, and 36 h). The other set of plants was kept in the +K solution as a control. For PLD
determination the plants were incubated in the presence of 0.2% n-butanol.
Extraction and separation of lipids
Lipids were extracted from fresh root tissues by addition of boiling isopropanol followed by
chloroform:methanol (2:1, v/v) containing butylhydroxytoluol (50 µg ml-1
) as an antioxidant. The
solvent mixture was then washed with 0.88% KCl to separate the chloroform phase. The upper
water phase was re-extracted with chloroform and the chloroform phases combined and dried under
a stream of N2. Lipid extracts dissolved in chloroform:acetic acid (100:1, v/v) were transferred to
SEP-PAK (Waters, Milford, MA, USA) according to Navari-Izzo et al. (2006) and sequentially
eluted with 20 ml of chloroform:acetic acid (100:1, v/v) for neutral lipids, 10 ml of acetone and 10
ml acetone:acetic acid (100:1, v/v) for glycolipids and 7.5 ml of methanol:chloroform:water
(100:50:40, v/v/v) for phospholipids (PL). Chloroform (2.25 ml) and water (3 ml) were added
successively to the eluate containing the PL to obtain a phase separation and to facilitate their
6
recovery. The separation of individual lipids was performed by TLC (Silica Gel 60, 0.25 mm
thickness; Merck, Damstadt, Germany) with the following solvent mixture: petroleum ether-Et2O-
HOAc (80:35:1, v/v/v) for neutral lipids (free sterols); CHCl3-MeOH-H2O (65:25:4, v/v/v) for
glycolipids (steryl glycosides and cerebrosides); CHCl3-MeOH-HOAc-H2O (85:15:10:3.5) for PL.
After development, the bands were located with iodine vapour. Individual lipids were identified by
co-chromatography with authentic standards. Total lipids derived from the sum of the moles
recovered for free sterols (FS), glycolipids (GL) and PL. FS were extracted with n-hexane and
quantitatively assayed as reported by Navari-Izzo et al. (1993) using cholesterol as standard. PL and
GL were quantified assaying their phosphorus and glucose contents, respectively (Navari-Izzo et
al., 1993).
Phospholipase D activity
PLD (EC 3.1.4.4) activity was measured as the in vivo production of phosphatidylbutanol (PtBut)
essentially as described by de Vrije and Munnik (1997). Following the extraction and separation of
the PL fraction from lipids of whole roots and leaves, PtBut was isolated from the rest of the PL
developing the TLC plates in the organic upper phase of a solvent mixture composed by ethyl
acetate:iso-octane:acetic acid:water (v/v/v/v). After development, bands were located with iodine
vapors and PtBut identified by co-chromatography with an authentic standard (Avanti Polar Lipids,
Alabaster, AL). Quantitative analysis of PtBut was performed as reported by Navari-Izzo et al.
(2006) using KH2PO4 as a standard.
H2O2 determination
H2O2 contents were evaluated following the method of Sgherri et al. (1994), with 1 g of tissue and a
standard curve in the 1-15 nmol H2O2 range at 0-4° and using ice-cold solutions. According to the
previous authors, this method is very sensitive and reproducible, and it excludes the interference of
other peroxides except for a small amount of lipid peroxide.
7
NADP+-dependent glyceraldeyde-3-phosphate dehydrogenase (G3PDH)
The extraction of G3PDH was performed in 100 mM Tris-HCl (pH 8.1), containing 0.1 mM Na2-
EDTA, 1 mM diethyldithiocarbamic acid (DIECA) and 4% (w/v) polyclar AT. The assay mixture
consisted of 100 mM Tris-HCl (pH 8.1), containing 5 mM MgCl2, 2 mM ATP, 1 mM 3-
phosphoglyceric acid, 0.06 U ml-1
3-phosphoglyceric phosphokinase and 70 µM NADPH. NADP+-
dependent G3PDH activity was determined using a coupled reaction, by monitoring the reduction in
absorbance following NADPH oxidation at 340 nm (Navari-Izzo et al., 1997).
Potassium content
Aliquots of roots and shoots were ground to a fine powder and then digested with concentrated
HNO3 and K+ content was determined by atomic absorption spectrophotometry (Izzo et al., 1991).
Statistical analysis
The results are the means from two replicates of three independent experiments (n=3). All data are
reported as mean values ± standard errors (SE). The significance of differences among mean values
was determined by one-way ANOVA. Comparisons among means were performed using Duncan’s
multiple-range test. Reported means in figures accompanied by different letters are significantly
different at P ≤ 0.01.
Results
During the whole treatment, control plants did not show significant differences in both mineral and
biochemical parameters in comparison with plants collected at the beginning of the experiment. For
this reason the data reported as control (0 h) are the mean of the values obtained during the whole
experimental period.
8
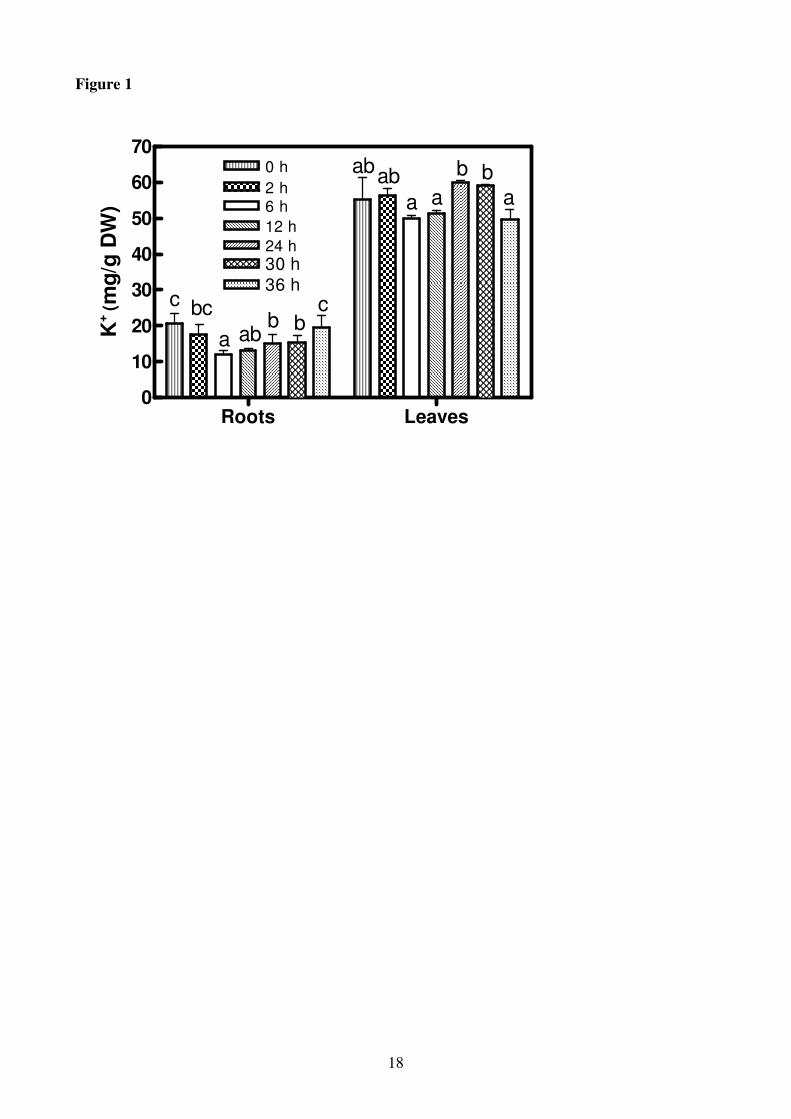
In roots of H. vulgare after 6 h of K+ deprivation a reduction in K
+ concentration of about 41% in
comparison with +K roots was observed. After this period, a slight increase in K+ concentrations
occurred and after 36 h of K+
deprivation the value of K+
in the roots reached the same level as in
the control roots (Fig.1). On the contrary the leaves did not show significant reduction in K+
concentration during the whole experimental period in comparison with the control (Fig.1).
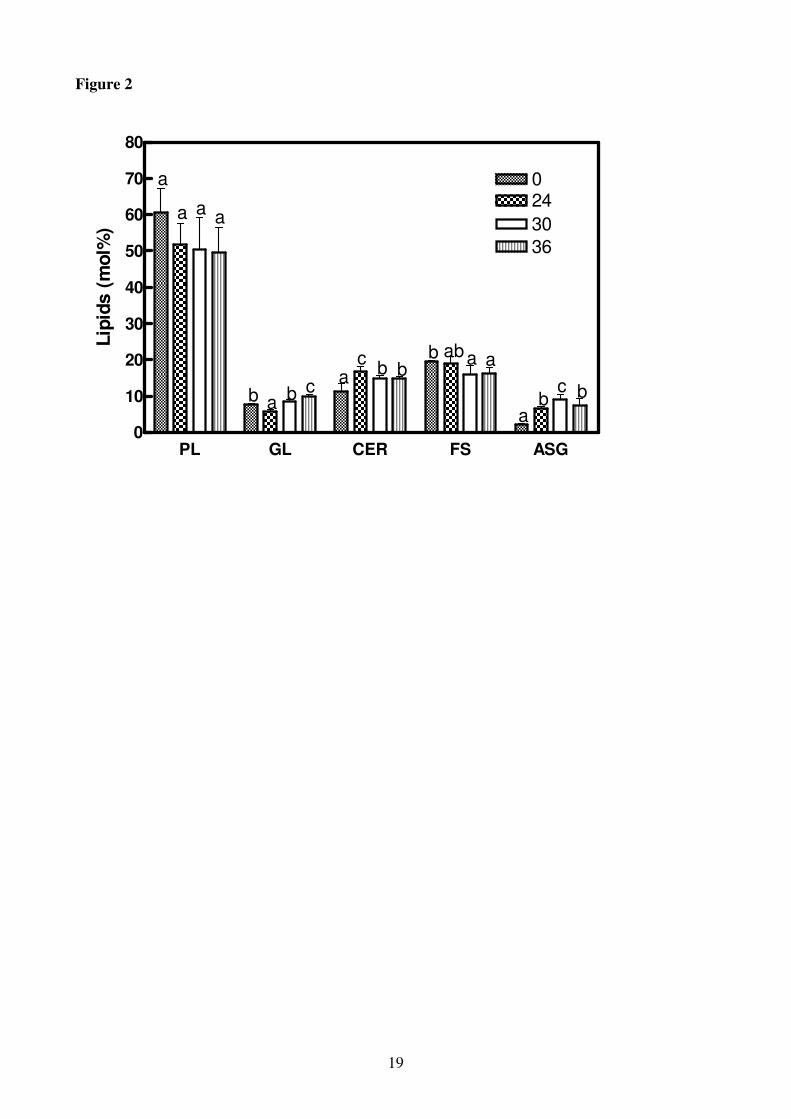
The main lipids of the control barley roots were PL, representing more than 50% of the total lipids,
followed by FS (17%), cerebrosides (CER, 14%) and lesser amounts of GL (MGDG and DGDG)
and acylated steryl glycosides (ASG). PL amounts did not change with the treatment whereas FS
amounts decreased following K+ deprivation, with a reduction of 17% after 36 h; in contrast, GL,
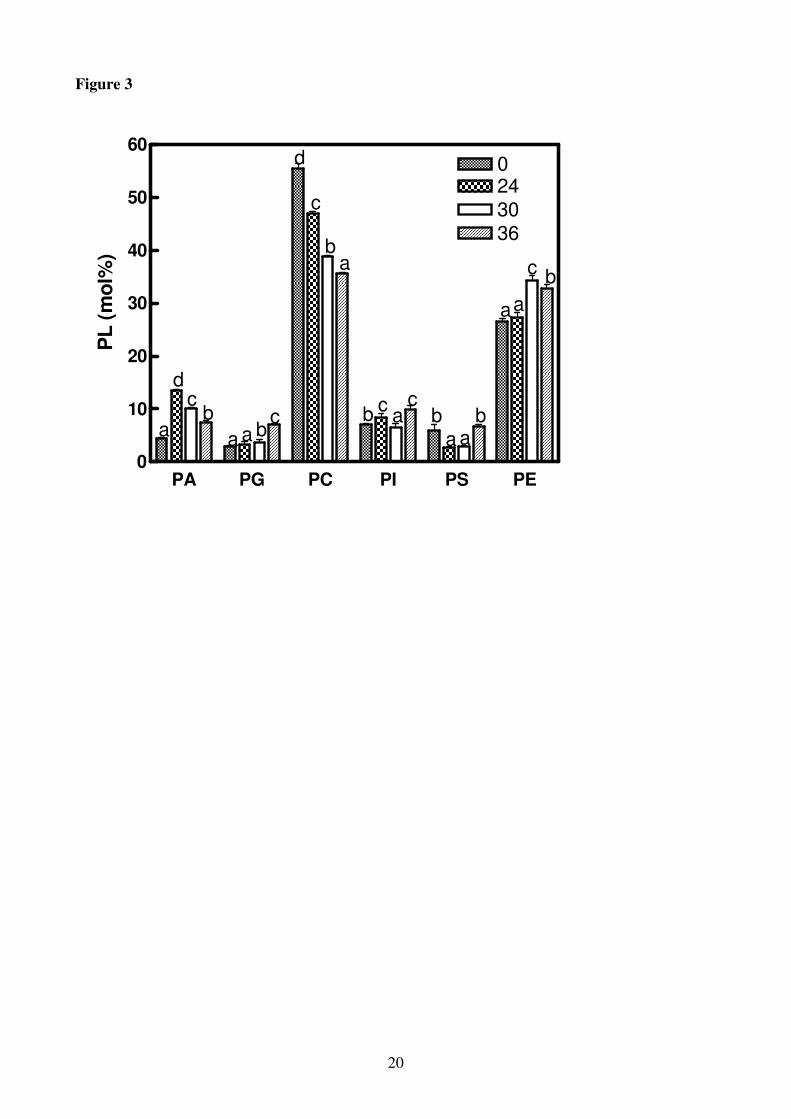
cerebrosides and ASG increased (Fig. 2). As regards the individual PL, 30 h of K+
deprivation
caused a reduction in phopsphatidylcholine (PC), phosphatidylserine (PS) and phosphatidylinositol
(PI) levels whereas phosphatidylglycerol (PG), phosphatidylethanolamine (PE) and phosphatidic
acid (PA) increased (Fig. 3). As a consequence of PC and PE changes, the PC to PE molar ratio
decreased by 50% at 30 h of K+
deprivation in comparison to the control.
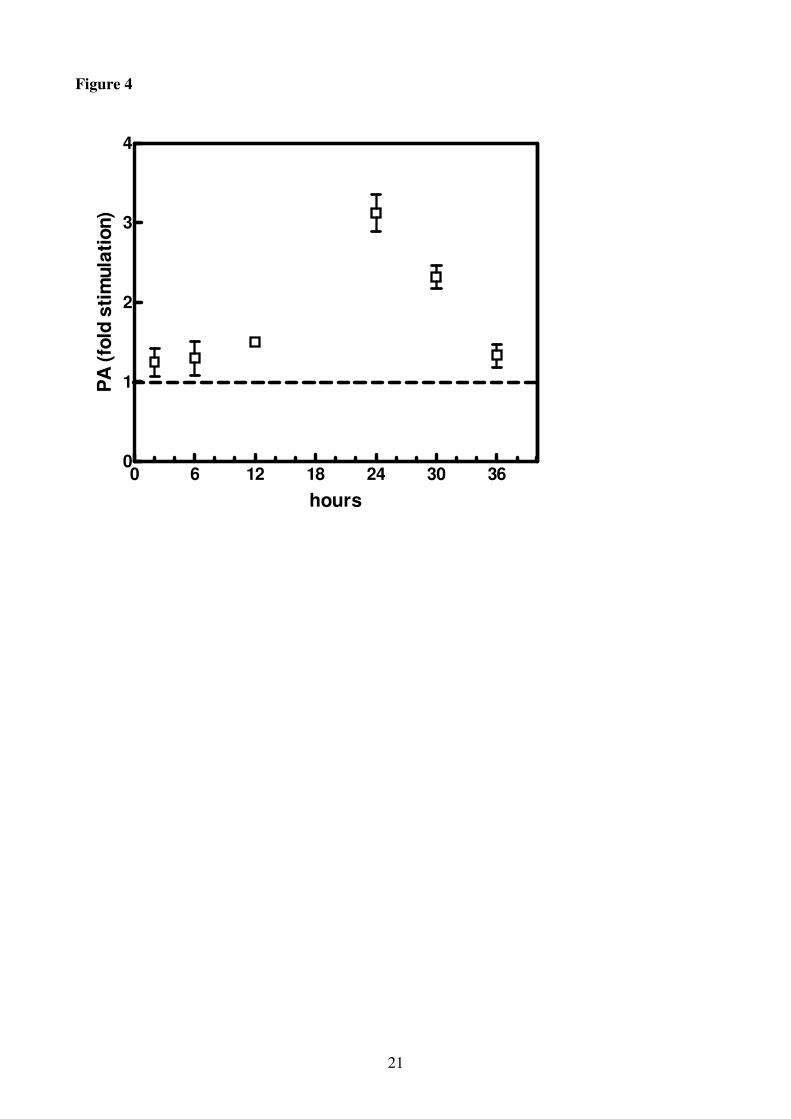
The accumulation of PA started after 2 h of K+
deprivation and continued till 24 h, when it reached
a value 3.3 fold higher than the control (Fig. 4). Thereafter, PA level decreased remaining anyway
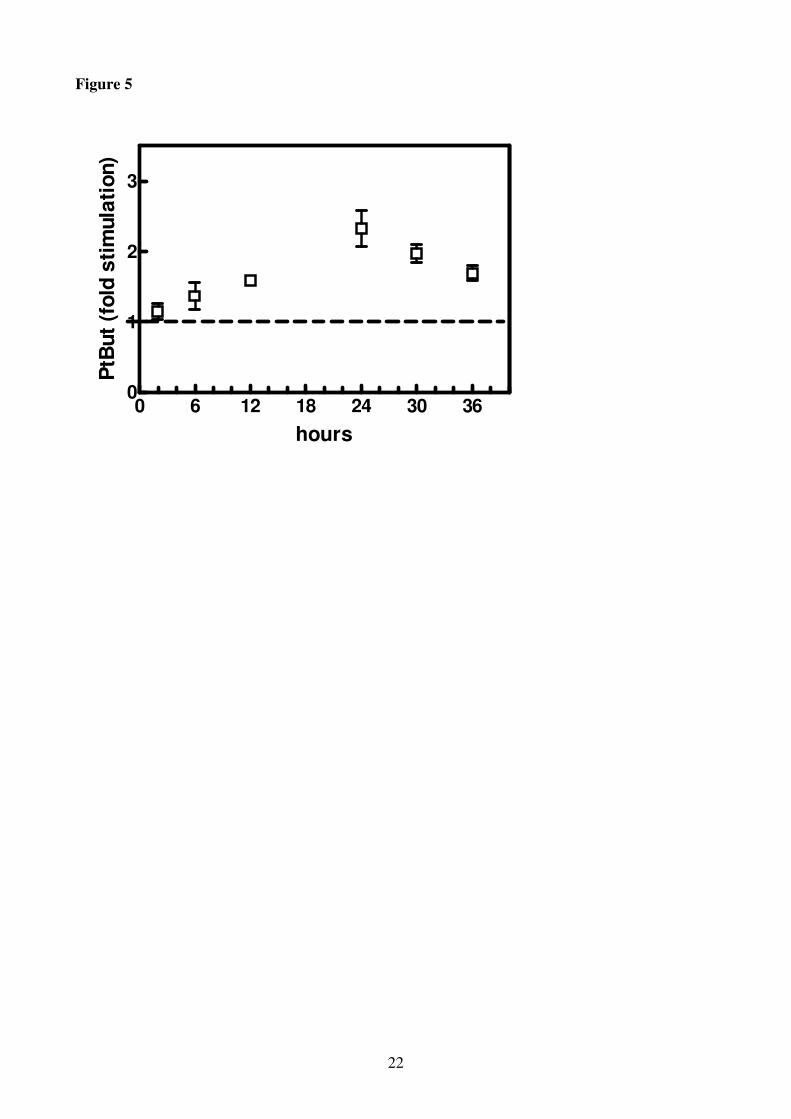
higher than in the control at the end of the experiment (36 h). PtBut showed the same trend of PA
(Figs, 4, 5); indeed, PtBut accumulation began after 2 h and increased approximately more than 2-
fold within 24 h, decreasing thereafter (Fig 5). In the leaves no PtBut formation was observed (data
not shown).
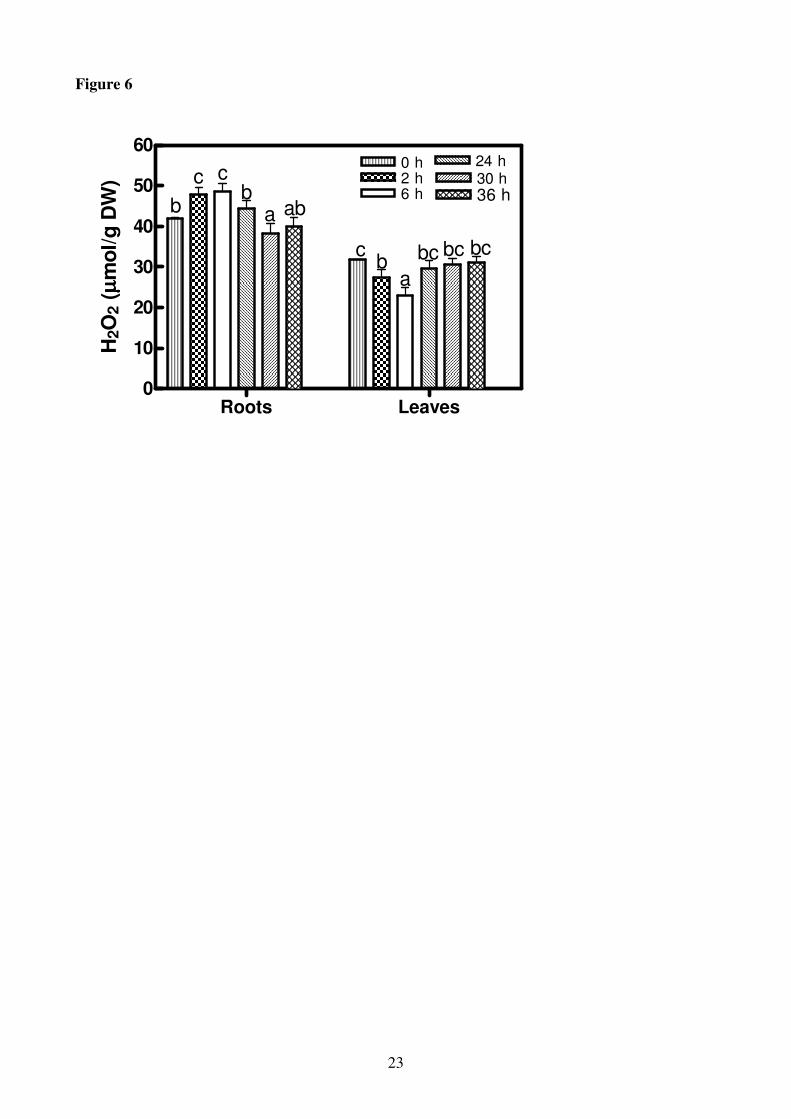
In roots, H2O2 level increased showing a maximum after 6 h of K+ deprivation (1.2 fold increase) in
comparison with +K roots. Thereafter, H2O2 level decreased reaching after 30 h values lower than
in the control. The leaves showed an opposite trend decreasing till 6 h and increasing thereafter
reaching the control value at the end of experiment (Fig. 6).
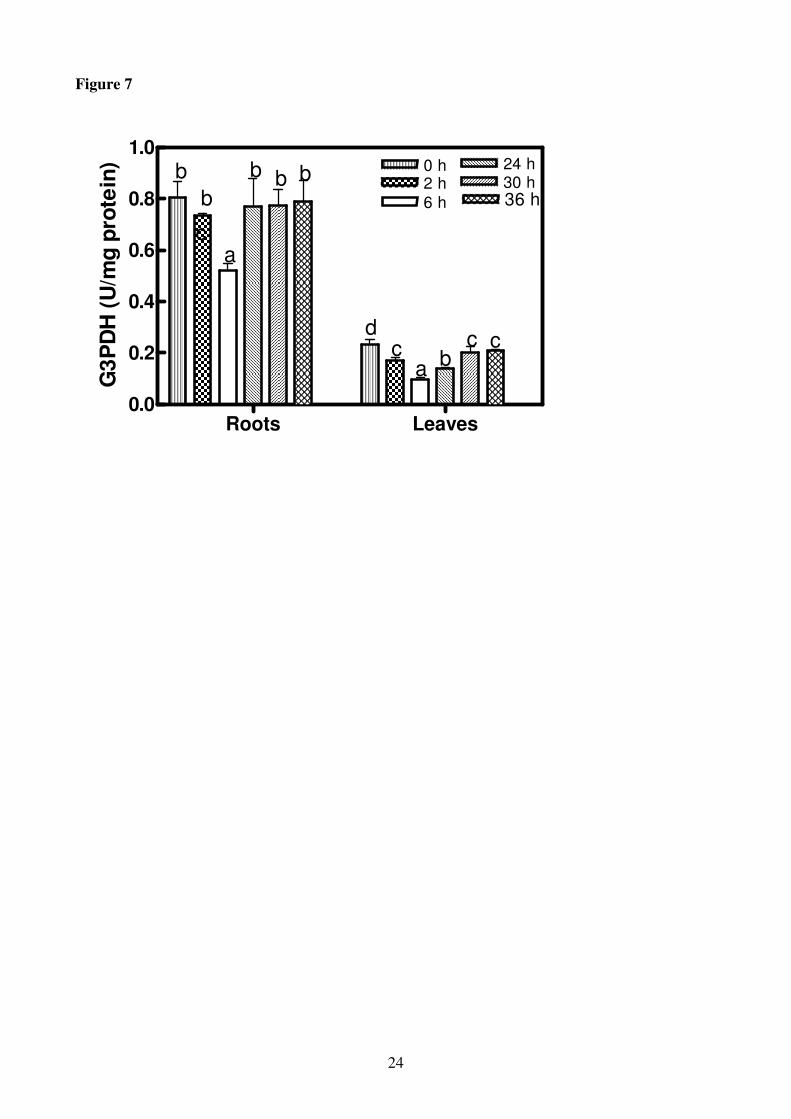
In roots and leaves subjected to K+ deprivation, G3PDH activity showed a similar trend but the
activity was higher in roots than in leaves for the whole period of treatment. The G3PDH activity
9
decreased with time reaching the minimum value after 6 h of treatment (35% and 59% of reduction
in roots and leaves in comparison with the control, respectively). Thereafter G3PDH activity
increased again (Fig.7).
Discussion
The early decrease in root K+ concentrations (Fig.1) might be due to its translocation to leaves, in
which K+ concentrations are relatively stable for the whole period of K
+ starvation (Hafsi et al.,
2008).
The removal of K+ from the growth medium led to a decrease in the membrane phospholipids PC,
PS and PI. This may reflect the induction of different phospholipases (PLDs) responsible for the
hydrolysis of some membrane phospholipids producing water-soluble free head groups (e.g.
choline) and PA (Cummings et al., 2002; Meijer and Munnik, 2003). In H. vulgare, differently from
H. maritimum which showed a first activation of PLD after 2 h of K+ deprivation and a second
stimulation after 24 h of treatment (Hafsi et al., 2008), PLD activity peaked after 24 h of K+
starvation (3.5-fold PtBut accumulation in comparison with the control) (Fig. 5). PtBut is a relative
measure of PLD activity due to the unique ability of this enzyme to transfer its phosphatidyl group
to an alcohol forming phosphatidylalcohol (Munnik, 2001; Navari-Izzo et al., 2006). In agreement
with Navari-Izzo et al. (2006) and Russo et al. (2007) on the basis of the concomitant increase in
PLD activity and the decrease in some membrane PL and, in particular, in the PC content (Fig. 3),
we can hypothesize that PC could have served as substrate for PA formation. Following K+
deprivation the decrease in PC, with the simultaneous increase in PE (Fig. 3), suggests that PC
could have been converted into PE by polar head group exchange or hydrolysed forming PA. Under
severe stress condition, PC hydrolysis results in the formation of DAG for DGDG synthesis, but in
H. vulgare we detected neither increase in DAG nor in DGDG (data not shown), as a consequence,
under K+ deficiency PLD activity inducing PA accumulation may reflect the induction of different
phospholipases involved in signalling the lowered K+ status. K
+ limitation was quickly sensed by
10
the root system since PA accumulation was measured as early as 2 h after the transfer of plants in –
K medium. The higher amount of PA in comparison with PtBut (12.4 and 5.9 mol% of the total PL,
respectively) could derive, besides via PLD, via the PLC/DAG kinase pathway as suggested by
Testerink and Munnik (2005) and Russo et al. (2007) or as intermediate in the biosynthesis of GL
and PL.
The early and transient increase in H2O2 in roots (Fig. 6) supports the idea that this molecule could
play a signalling role in response to a short-term K+ starvation. Shin and Schachtman (2004) and
Shin et al. (2005) showed that H2O2 is rapidly accumulated in response to a short-term potassium
deprivation triggering the expression of certain genes. In addition, the previous authors
demonstrated that changes in the kinetics of K+ uptake are due to H2O2, whose production is
localized in a specific region of the roots that has been shown to be active in K+ uptake and
translocation. Under the same growth conditions of H. vulgare, we have found in the halophyte H.
maritimum, a great and fast production of H2O2 after 6 h of K+ starvation in both roots and leaves
(Hafsi et al., 2008). In Arabidopsis roots most of gene expression was induced after 6 h of K+
deprivation (Shin et al., 2005), and in H. maritimum roots the concomitant increase and decrease in
H2O2 level and G3PDH activity, respectively, was sensed after 6 h when the maximum K+
deprivation occurred (Hafsi et al., 2008). Six h of K+ deprivation could represent a crucial time to
sense the nutrient deprivation (Shin et al., 2005) and to start an early response at least at root level
in H. vulgare too (Figs 6-7). The eventually PLD activation (Figs. 4-5) might be, in part, the result
of G3PDH inhibition by H2O2.
Indeed, H2O2 is the most stable of reactive oxygen species and is capable of rapid diffusion across
cell membranes and several studies demonstrated that H2O2 is implicated in PLD activation: PLD in
endothelial cells (Natarajan et al., 1993) and PLDδ in Arabidopsis (Zhang et al., 2003), are
activated by H2O2. The mechanism by which PLD is activated by H2O2 requires further research. In
vivo and in vitro studies in suspension cultured rice cells, PLD is activated by H2O2 and this
activation involves a protein tyrosine kinase (Yamaguchi et al., 2004). Recently it has been
11
indirectly suggested that G protein- regulated events are likely involved in PLD signalling (Navari-
Izzo et al., 2006) even though a recent report indicates that, at least in plants, mastoparan also has
the ability to activate MAPK signalling without requiring the involvement of a canonical
heterotrimeric G protein (Miles et al., 2004).
It has been demonstrated that in Arabidopsis cell extracts, the activity of G3PDH is inhibited by
H2O2 and Hancock et al. (2005) suggested that G3PDH may be a direct target of H2O2.
Furthermore, in animal cells (PC12 cells) the activity of PLD2 was dependent on its interaction with
G3PDH (Kim et al., 2003). These authors suggested that H2O2, besides its role in the inhibition of
the dehydrogenase activity of G3PDH, causes structural changes of this enzyme on its catalytic
cysteine residue which facilitate its association with PLD2, and as a consequence, the regulation of
PLD2 activity by H2O2.
Besides the evidences in vitro and in animal cells (Kim et al., 2003), the present data, together those
obtained in Arabidopsis (Shin et al., 2005) and H. maritimum (Hafsi et al., 2008), support the
hypothesis that a link among G3PDH activity, H2O2 level and PLD activation could play a role also
in roots as a part of the signalling machinery activated following a short-time K+ starvation.
However, other experiments will be needed to investigate more in deeply the mechanisms by which
these three compounds are interconnected and implicated in the response to a short-term K+
deprivation.
Acknowledgements
This paper was supported by the University of Pisa (Fondi di Ateneo 2006-2007). Hafsi Chokri was
supported by the Tunisian Ministry of Higher Education, Scientific Research and Technology
(LR02CB02).
12
References
Armengaud P, Breitling R, Amtmann A. The potassium-dependant transcriptome of
Arabidopsis reveals a prominent role of jasmonic acid in nutrient signalling. Plant Physiol 2004;
136:2556-76.
Arnon DI, Hoagland DR. Crop production in artificial solutions and in soil with special
reference to factors affecting yields and absorption of inorganic nutrients. Soil Sci 1940; 50: 463-
84.
Cummings R, Parinandi N, Wang L, Usatyuk P, Natarajan V. Phospholipase
D/phosphatidic acid signal transduction: Role and physiological significance in lung. Mol Cell
Biochem 2002; 234/235:99-109.
de Vrije T, Munnik T. Activation of phospholipase D by calmodulin antagonists and
mastoparan in carnation petals. J Exp Bot 1997; 48:1631-7.
Den Hartog M, Musgrave A, Munnik T. Nod factor induced phosphatidic acid and
diacyglycerol pyrophosphate formation: a role for phospholipase C and D in root hair
deformation. Plant J 2001; 25:55-65.
Grieth M, Mäser P, Schroeder JI. The potassium Transporter AtHAK5 Functions in K+
Deprivation-Induced High-Affinity K+ Uptake and AKT1 K
+ Channel Contribution to K
+ Uptake
Kinetics in Arabidopsis Roots. Plant Physiol 2005; 137:1105-14.
Hafsi C, Russo MA, Sgherri C, Izzo R, Abdelly C, Navari-Izzo F.
Has glyceraldehyde 3-
phosphate dehydrogenase a role in the early response of Hordeum maritimum L. to potassium
deprivation? Agrochimica 2008, In press.
Hancock JT, Henson D, Nyirenda M, Desikan R, Harisson J, Lewis M, Hughes J, Neill SJ.
Proteomic identification of glyceraldehyde 3-phosphate dehydrogenase as an inhibitory target of
hydrogen peroxide in Arabidopsis. Plant Physiol Biochem 2005; 43:828-835.
13
Hewitt EJ. Sand and water culture methods used in the study of plant nutrition.
Commonwealth Bureau of Horticultural Plantation Crops, Tech Commun 1966, No 22.
Izzo R, Navari-Izzo F, Quartacci MF. Growth and mineral absorption in maize seedlings
as affected by increasing NaCl concentrations. J Plant Nutr 1991; 14: 687-99.
Kim JH, Lee S, Park JB, Lee DS, Kim JH, Ha SH, Hasumi K, Endo A, Suh PG, Ryu SH.
Hydrogen peroxide induces association between glyceradehyde 3-phosphate dehydrogenase and
phospholipase D2 to facilitate phospholipase D2 activation in PC12 cells. J Neurochem 2003;
85:1228-36.
Marchner H. Mineral nutrition of higher plants. Academic Press, London. 1995.
Meijer HJ, Munnik T. Phospholipase based signalling in plants. Annu Rev Plant Biol
2003; 54:265-306.
Meng TC, Fukada T, Tonks NK. Reversible oxidation and inactivation of protein tyrosine
phosphatases in vivo. Mol. Cell 2002; 9: 387-99.
Miles GP, Samuel MA, Jones AM, Ellis BE. Mastoparan rapidly activates plant MAP kinase
signaling independent of heterotrimeric G proteins. Plant Physiol. 2004; 134: 1332-6.
Munnik T, Meijer JGM, ter Riet B, Hirt H, Frank W, Bartels D, and Musgrave A.
Hyperosmotic stress stimulates phospholipase D activity and elevates the levels of phosphatidic
acid and diacyglycerol pyrophosphate. Plant J 2000; 22(2):147-54.
Munnik T. Phosphatidic acid: an emerging plant lipid second messenger. Trends Plant Sci
2001; 6(5):1360-1385.
Natarajan V, Taher MM, Roehm B, Parinandi NL, Schmid HHO, Kiss Z, Garcia JGN.
Activation of endothelial cell phospholipase D by hydrogen peroxide and fatty acid
hydroperoxide. J Biol Chem 1993; 268:930-7.
Navari-Izzo F, Cestone B, Cavallini A, Natali L, Giordani T, Quartacci MK. Copper
excess triggers phospholipase D activity in wheat roots. Phytochem 2006; 67:1232-42.
14
Navari-Izzo F, Meneguzzo S, Loggini B, Vazzana C, Sgherri CLM. The role of the
glutathione system during dehydration of Boea hygroscopica. Physiol Plant 1997; 99: 23-30.
Navari-Izzo F, Quartacci MF, Melfi D, Izzo R. Lipid composition of plasma membrane
isolated from sunflower seedlings grown in water stress conditions. Physiol Plant 1993; 87: 508-
14.
Russo MA, Quartacci MF, Izzo R, Belligno A, Navari-Izzo F. Long- and short-term
phosphate deprivation in bean roots: Plasma membrane lipid alterations and transient stimulation
of phospholipases. Phytochem 2007; 68: 1564-1571.
Schuppe-Koistinen I, Moldeus P, Bergman T, Cotgreave IA. S-thiolation of human
endothelial cell glyceraldehyde-3-phosphate dehydrogenase after hydrogen peroxide treatment.
Eur J Biochem 1994; 221: 1033-7.
Sgherri C, Quartacci MF, Navari-Izzo F. Early production of activated oxygen species in
root apoplast of wheat following copper excess. J Plant Physiol 2007; 164: 1152-60.
Sgherri CLM, Loggini B, Puliga S, Navari-Izzo F. Antioxidant system in Sporobolus
Stapfianus: changes in response to desiccation and rehydration. Phytochem 1994; 35: 561-5.
Shin R, Berg RH, Schachtman DP. Reactive oxygen species and root hairs in Arabidopsis
response to nitrogen, phosphorus and potassium deficiency. Plant Cell Physiol 2005; 46(8):1350-
7.
Shin R, Schachtman DP. Hydrogen peroxide mediates plant root cell response to nutrient
deprivation. Proc. Natl. Acad. Sci. USA 2004; 101(23):8827-32.
Testerink C, Munnik T. Phosphatidic acid: a multifunctional stress signalling lipid in
plants. Trends Plant Sci 2005; 10:368-75.
Wang X. Phospholipase D in hormonal and stress signalling. Plant Biol. 2002; 5:408-414.
Yamaguchi T, Tanabe S, Minami E, Shibuya N. Activation of phospholipase D induced by
hydrogen peroxide in suspension cultured rice cells. Plant Cell Physiol 2004; 45(9):1261-70.
15
Zhang W, Wang C, Qin C, Wood T, Olafsdottir G, Welti R, Wang X. The oleate-
stimulated phospholipase D, PLDδ, and phosphatidic acid decrease H2O2-induced cell death in
Arabidopsis. Plant Cell 2003; 15:2285-95.

16
Legends to Figures
Figure 1
Potassium concentrations in roots and leaves of Hordeum vulgare seedlings incubated in a solution
without K+ for increasing periods of time (0-36 h). Results are the means of three replicates each
analysed twice ± SE (n = 3). Significant differences (P ≤ 0.01) among treatments are accompanied
by different letters.
Figure 2
Total lipid composition of roots of H. vulgare seedlings incubated in a solution without K+ for
increasing periods of time (0-36 h). Statistical analysis was as in Figure 1. PL, phospholipids; GL,
glycolipids; CER, cerebrosides; FS, free sterols; ASG, acylated steryl glycosides. Single lipid class
is expressed as mole % of the total moles of lipids.
Figure 3
Phospholipid composition of roots of H. vulgare seedlings incubated in a solution without K+ for
increasing periods of time (0-36 h). Statistical analysis was as in Figure 1. PL, phospholipids; PA,
phosphatidic acid; PG, phosphatidylglycerol; PC, phosphatidylcholine; PI, phosphatidylinositol; PS,
phosphatidylserine; PE, phosphatidylethanolamine. The single PL is expressed as mole % of the
total moles of PL.
Figure 4
Phosphatidic acid (PA) in roots of H. vulgare seedlings incubated in a solution without K+ for
increasing periods of time (0-36 h). Contents are expressed as fold stimulation in comparison with
the control (horizontal line). Results are the means of three replicates each analysed twice ± SE (n =
3).
Figure 5
Accumulation of phosphatidylbutanol (PtBut) in roots of H. vulgare seedlings incubated in a
solution without K+ for increasing periods of time (0-36 h). At each time point PtBut is expressed as
17
fold stimulation in comparison with the control (horizontal line, 1.97 mol % of total PL). Results
are the means of three replicates each analysed twice ± SE (n = 3).
Figure 6
Hydrogen peroxide (H2O2) contents in roots and leaves of H. vulgare seedlings incubated in a
solution without K+ for increasing periods of time (0-36 h). Statistical analysis was as in Figure 1.
Figure 7
Glyceraldehyde-3-phosphate dehydrogenase (G3PDH) activity in roots and leaves of H. vulgare
seedlings incubated in a solution without potassium for increasing periods of time (0-36 h).
Statistical analysis was as in Figure 1.
18
Figure 1
Roots Leaves0
10
20
30
40
50
60
700 h
2 h
6 h
12 h
30 h
36 hc
bc
a abb b
c
a a
babab
24 h
a
b
K+
( mg
/g D
W)
19
Figure 2
PL GL CER FS ASG0
10
20
30
40
50
60
70
80
0
24
30
36
a
a
aaa
b bc
a
a
abb
c
c bb
abb a
Lip
ids
(m
ol%
)
20
Figure 3
PA PG PC PI PS PE0
10
20
30
40
50
600
24
30
36
ab
c
d
aa
bb
aa
bc
cab
c
aab
ca
bc
d
PL
(m
ol%
)
21
Figure 4
0 6 12 18 24 30 360
1
2
3
4
hours
PA
(fo
ld s
tim
ula
tio
n)
22
Figure 5
0 6 12 18 24 30 360
1
2
3
hours
PtB
ut
(fo
ld s
tim
ula
tio
n)
23
Figure 6
Roots Leaves0
10
20
30
40
50
600 h
2 h
24 h
36 h6 h
a abbb
cc
ab
30 h
bc bcc bc
H2O
2 (
µµ µµm
ol/
g D
W)
24
Figure 7
Roots Leaves0.0
0.2
0.4
0.6
0.8
1.00 h
2 h
24 h
36 h
30 h
6 h
c
a
b
b
b bb
ab
cc
dc
G3
PD
H (
U/m
g p
rote
in)