Response to Legislative Request For Information
40
1570 Grant Street, Denver, CO 80203-1818 P 303.866.2993 F 303.866.4411 www.colorado.gov/hcpf Department of Health Care Policy and Financing 1570 Grant Street Denver, CO 80203 November 1, 2015 The Honorable Kent Lambert, Chair Joint Budget Committee 200 East 14 th Avenue, Third Floor Denver, CO 80203 Dear Senator Lambert: Enclosed please find the Department of Health Care Policy and Financing’s response to the Joint Budget Committee’s Request for Information #7 regarding the implementation of the Accountable Care Collaborative Organization project. Legislative Request for Information #7 states: The Department is requested to submit a report by November 1, 2015, to the Joint Budget Committee providing information on the implementation of the Accountable Care Collaborative Organization project. In the report, the Department is requested to inform the Committee on how many Medicaid clients are enrolled in the pilot program, the current administrative fees and costs for the program, and performance results with an emphasis on the fiscal impact. Attached is the Accountable Care Collaborative annual report which provides information regarding program enrollment, expenditure, and performance in FY 2014-15. If you require further information or have additional questions, please contact the Department’s Legislative Liaison, Zach Lynkiewicz, at [email protected] or 720-854-9882. Sincerely, Susan E. Birch, MBA, BSN, RN Executive Director SEB/srm Enclosure(s): Health Care Policy and Financing FY 2014-15 RFI #7
Transcript of Response to Legislative Request For Information
1570 Grant Street, Denver, CO 80203-1818 P 303.866.2993 F 303.866.4411
www.colorado.gov/hcpf
Department of Health Care Policy and Financing
1570 Grant Street
Denver, CO 80203
November 1, 2015
The Honorable Kent Lambert, Chair Joint Budget Committee 200 East 14th Avenue, Third Floor Denver, CO 80203 Dear Senator Lambert: Enclosed please find the Department of Health Care Policy and Financing’s response to the Joint Budget Committee’s Request for Information #7 regarding the implementation of the Accountable Care Collaborative Organization project. Legislative Request for Information #7 states: The Department is requested to submit a report by November 1, 2015, to the Joint Budget Committee providing information on the implementation of the Accountable Care Collaborative Organization project. In the report, the Department is requested to inform the Committee on how many Medicaid clients are enrolled in the pilot program, the current administrative fees and costs for the program, and performance results with an emphasis on the fiscal impact. Attached is the Accountable Care Collaborative annual report which provides information regarding program enrollment, expenditure, and performance in FY 2014-15. If you require further information or have additional questions, please contact the Department’s Legislative Liaison, Zach Lynkiewicz, at [email protected] or 720-854-9882. Sincerely,
Susan E. Birch, MBA, BSN, RN Executive Director SEB/srm Enclosure(s): Health Care Policy and Financing FY 2014-15 RFI #7
1570 Grant Street, Denver, CO 80203-1818 P 303.866.2993 F 303.866.4411
www.colorado.gov/hcpf
Cc: Representative Millie Hamner, Vice-chair, Joint Budget Committee Representative Bob Rankin, Joint Budget Committee Representative Dave Young, Joint Budget Committee Senator Kevin Grantham, Joint Budget Committee
Senator Pat Steadman, Joint Budget Committee John Ziegler, Staff Director, JBC
Eric Kurtz, JBC Analyst Henry Sobanet, Director, Office of State Planning and Budgeting Bettina Schneider, Budget Analyst, Office of State Planning and Budgeting Legislative Council Library State Library John Bartholomew, Finance Office Director, HCPF Gretchen Hammer, Health Programs Office Director, HCPF Dr. Judy Zerzan, Client and Clinical Care Office Director, HCPF Chris Underwood, Health Information Office Director, HCPF Jed Ziegenhagen, Community Living Office Director, HCPF Tom Massey, Policy, Communications, and Administration Office Director, HCPF Rachel Reiter, External Relations Division Director, HCPF Zach Lynkiewicz, Legislative Liaison, HCPF
Legislative Request for Information #7 states:
Department of Health Care Policy and Financing, Medical Services Premiums – the Department is
requested to submit a report by November 1, 2015, to the Joint Budget Committee, providing
information on the implementation of the Accountable Care Collaborative Organization project. In
the report, the Department is requested to inform the Committee on how many Medicaid clients are
enrolled in the program, the current administrative fees and costs for the program, and performance
results with an emphasis on the fiscal impact.
Executive Summary
Many factors contribute to health: personal health behaviors, access to medical care, effective
provider-patient communication, a connected health system, and access to resources to meet basic
needs. These factors, when actively managed in a health care delivery system, can have a positive
and sustainable impact on health outcomes and the amount of money it takes to achieve those
outcomes. By focusing on such factors, the Accountable Care Collaborative (ACC) program
continued to demonstrate costs avoided for taxpayers and health improvement for Medicaid clients
amid its fourth consecutive year of rapid enrollment growth.
The Department is pleased to submit this annual report on the ACC to the Joint Budget Committee.
As requested, this Legislative Request for Information (LRFI) reports on FY 2014-15 and includes
an update on:
ACC enrollment
Current administrative fees and costs associated with the program
Performance results with an emphasis on the fiscal impact
Enrollment
As of June 2015, there were 899,596 Medicaid clients enrolled in the ACC (more than 70% of all
Colorado Medicaid clients). This is a 48% increase in enrollment in the ACC program since June
2014. A primary goal of the program is to connect ACC clients to a Primary Care Medical Provider
(PCMP) so clients have a usual source of preventive health services and a place to go if they get
sick or injured. In FY 2014-15, the Department implemented financial incentives to encourage
greater focus on client connections to a PCMP; the percent of ACC clients who are connected
(referred to as attribution) to a PCMP increased by almost 10 percentage points. Nearly 76% of
ACC enrollees are now connected to a PCMP.
Administrative Fees and Costs for the Program
Financial analysis indicates that the ACC program avoided medical costs for ACC enrollees of
$121,288,048 in FY 2014-15. For FY 2014–15, total administrative costs for the ACC program were
$83,605,253. This amount covers administrative payments made to Regional Care Collaborative
Organizations (RCCOs), PCMPs, and to the Statewide Data Analytics Contractor (SDAC). After
accounting for these administrative costs, the Department’s analyses indicate that the program had
net costs avoided of $37,682,795. This was achieved by coordinating client care, reducing
duplicative and unnecessary service use, and shifting the focus of the health system away from
uncoordinated episodic care to primary and preventive care.
Program Performance
For FY 2014-15, data suggest that the ACC had a positive impact on service utilization patterns.
ACC clients who had been in the program for longer than six months were more likely to seek timely
follow-up care after being discharged from the hospital and were more likely to receive vital prenatal
and postpartum care. At the same time, ACC clients with more than six months in the program were
less likely to receive services at an emergency room, receive high-cost imaging services, or be
readmitted to a hospital within 30 days of discharge as compared to those enrolled for six months
or less. In addition, Department analyses show that the rate of receipt of annual well-child visits and
chlamydia screenings increased for clients who were enrolled for more than six months, when
compared with those enrolled for six months or less. Finally, results from the Consumer Assessment
of Health Care Providers and Systems (CAHPS) survey conducted during FY 2014-15 indicate that
client satisfaction remains high.
In FY 2014-15, Colorado Medicaid continued to be a leader in health system transformation through
the ACC program. The Department started a program to recognize and reward PCMPs who offer
services beyond those traditionally provided by Medicaid fee-for-service providers, such as the
availability of afterhours or weekend appointments, co-location with a behavioral health provider,
and utilization of population health data. Two hundred and sixty five practice sites met at least the
minimum number of factors necessary to be assessed as an enhanced PCMP for FY 2014-15 and
the majority of ACC clients were attributed to one of these practices. The Department started
allowing Community Mental Health Centers to serve as PCMPs, formally recognizing their work to
integrate physical and behavioral health. Finally, the Department also implemented two new ACC
initiatives this year, the ACC Medicare-Medicaid Program (ACC: MMP) and the ACC: Rocky
Mountain Health Plans Prime (ACC: RMHP Prime) program, which was implemented and
authorized under HB 12 -1281. The ACC: MMP provides intensive care coordination services for
full benefit Medicare-Medicaid enrollees and ACC: RMHP Prime is using alternative payment
arrangements and shared savings with their primary care provider network and community partners
to further practice transformation efforts and increase the integration of behavioral health in primary
care.
The Department has a strong record of designing innovative solutions to improve the health of
Medicaid enrollees through the ACC program. In FY 2015–16, the Department plans to build on
these successes by continuing to enroll Medicaid clients into the ACC, creating new ways to deliver
integrated health care, and continuing to design and implement new payment strategies that drive
lasting health system improvement
Department of Health Care Policy and Financing November 1, 2015
Legislative Request for Information #7 Page 1
1. Introduction
1.1 Program Overview
The Accountable Care Collaborative (ACC) is designed to transform Colorado Medicaid from a
system that relies on fee-for-service payment for episodic care into a system that encourages and
rewards integrated, person-centered care that leads to good health outcomes for Colorado’s
Medicaid clients while lowering costs for the State.
The ACC is central to the Department’s mission to increase access to health care and improve health
outcomes while showing careful stewardship of financial resources. This mission is aligned with the
Triple Aim created by the Institute for Healthcare Improvement and adopted by the Centers for
Medicare and Medicaid Services: improve the patient experience of care, improve the health of
populations, and reduce the cost of health care.
These are ambitious goals that require innovation throughout the system, and the ACC is making
changes on all fronts: engaging clients to be active in their own care, supporting providers,
improving access to primary care, connecting the fragmented pieces of the health care system, and
helping clients obtain non-medical services that have a dramatic impact on health. Because of its
thoughtful and steady approach to health system transformation, the ACC has achieved cost
avoidance while working within the current system to change the way health care is delivered.
The Department implemented the ACC program in May 2011 with one practice and roughly 500
people in a few counties. The program has grown to statewide enrollment of 899,596 Medicaid
clients, as of June 2015. There are about 520 practices, statewide, functioning as Primary Care
Medical Providers (PCMPs) within the program.
Clients enrolled in the ACC receive physical health services through a Primary Care Case
Management system. This means that providers are paid for each medical service they deliver. In
addition, the ACC has introduced new payments tied to increased value and health outcomes. The
program is designed to provide a client-centered, whole-person approach to care. It connects clients
to medical and non-medical resources, minimizing barriers to access and ensuring the delivery of
timely, appropriate, quality care to all its enrollees—leading to better health outcomes at lower costs.
The four primary goals of the ACC are to:
Ensure access to a focal point of care or medical home for all ACC enrollees;
Coordinate medical and non-medical care and services;
Improve client and provider experiences in the Colorado Medicaid system; and
Provide the necessary data to support these goals, analyze progress, and move the program
forward.
Department of Health Care Policy and Financing November 1, 2015
Legislative Request for Information #7 Page 2
There are three core components of the ACC program:
Seven Regional Care Collaborative Organizations (RCCOs), each accountable for the
program in a different part of the state;
PCMPs who function as medical homes for ACC enrollees;
The Statewide Data Analytics Contractor, which provides the Department, RCCOs and
PCMPs with actionable data at the population and client level.
Regional Care Collaborative Organizations (RCCOs)
The purpose of the RCCOs is to meet health and financial outcome targets in their region while
ensuring appropriate care coordination and that every enrollee has a medical home. RCCOs work at
the local level to support ACC clients and providers. The RCCOs’ main responsibilities are the
following:
Medical management and care coordination: ensuring that every client in their region
receives coordinated, comprehensive, person-centered care, and other non-medical supports
as needed to overcome barriers to getting appropriate care
Provider network development: developing a formal contracted network of primary care
providers, and an informal community network of medical and non-medical services
Provider support: supporting primary care medical providers in providing efficient, high
quality care by providing clinical tools, client materials, administrative support, and practice
redesign
Accountability and reporting: reporting to the state on the region’s progress, and meeting
programmatic and Departmental goals
Primary Care Medical Providers (PCMPs)
One of the ACC’s goals is to link every enrollee to a primary care medical provider as his or her
central point of care. The PCMPs function as medical homes, a model that promotes comprehensive,
coordinated, client-centered care that leads to a positive client experience and better health
outcomes. PCMPs are responsible for ensuring timely access to primary care for ACC enrollees, but
may provide care coordination directly, or work with RCCOs to give the best possible support to
clients. The following are the responsibilities of PCMPs:
Medical home: be the focal point of care for clients
Primary care: provide the majority of their clients’ primary and preventive care
Connection to community and social services: assess clients’ medical and non-medical
needs, and help them access services they need to improve their overall health and well-
being and attain their health goals
In FY 2014-15, the Department implemented a program to recognize and reward PCMPs who offer
services such as the availability of afterhours or weekend appointments, co-location with a
Department of Health Care Policy and Financing November 1, 2015
Legislative Request for Information #7 Page 3
behavioral health provider, and utilization of population health data. Two hundred and sixty-five
practice sites met at least the minimum number of factors necessary to be assessed as an enhanced
PCMP. Additional information about this initiative is provided in Section 5.1 of this report.
Statewide Data Analytics Contractor (SDAC)
The Statewide Data and Analytics Contractor provides the Department, RCCOs, and PCMPs with
actionable data at both the population level and the client level. Population-level data is used to
evaluate and improve the performance of RCCOs, PCMPs, and the program overall. Client-level
data is used to support care management activities, and can help RCCOs and PCMPs identify clients
with many medical needs. Data is provided via an online portal with secure access monitored by the
RCCOs and the Department.
The SDAC tracks several performance metrics so that RCCOs, PCMPs and the Department can be
held accountable for meeting program goals. Some of these measures are Key Performance
Indicators (KPIs). KPIs are used to determine incentive payments for RCCOs and PCMPs. KPIs
are changed as the priorities and needs of the program evolve. The SDAC also tracks other
performance measures that are not tied to payment but allow the RCCOs, PCMPs and the
Department to monitor performance.
The SDAC originally used only Medicaid paid claims data. In an effort to improve the care
coordination services available to clients, the SDAC has recently added Medicare paid claims,
nursing facility, home health and behavioral health service data. Additionally, RCCOs are receiving
hospital admission, discharge, and transfer data collected by the Colorado Regional Health
Information Organization (CORHIO) network.
1.2 New ACC Initiatives
The ACC program implemented two new initiatives in FY 2014-15. The ACC Medicare-Medicaid
Program (ACC: MMP) provides intensive care coordination services for full benefit Medicare-
Medicaid enrollees. The program integrates and coordinates physical, behavioral, and social health
needs for these clients. As of June 2015, the program had 27,583 enrollees. The ACC Rocky
Mountain Health Plans Prime (ACC: RMHP Prime) program, established under the authority
provided by HB 12-1281, is using alternative payment arrangements and shared savings with their
primary care provider network and community partners to further practice transformation efforts
and increase the integration of behavioral health in primary care. As of June 2015, this program had
33,978 enrollees.
Department of Health Care Policy and Financing November 1, 2015
Legislative Request for Information #7 Page 4
1.3 In This Report
This report has four additional sections:
2. Enrollment in the ACC
3. Financial Performance
4. Program Performance
5. Health System Transformation
Appendix A: Technical Documentation for Calculating Cost of Care
2. Enrollment in the ACC
Enrollment in the ACC program continued to increase dramatically in FY 2014-15, while the
program made significant improvements to enhance enrollees’ connection to primary care.
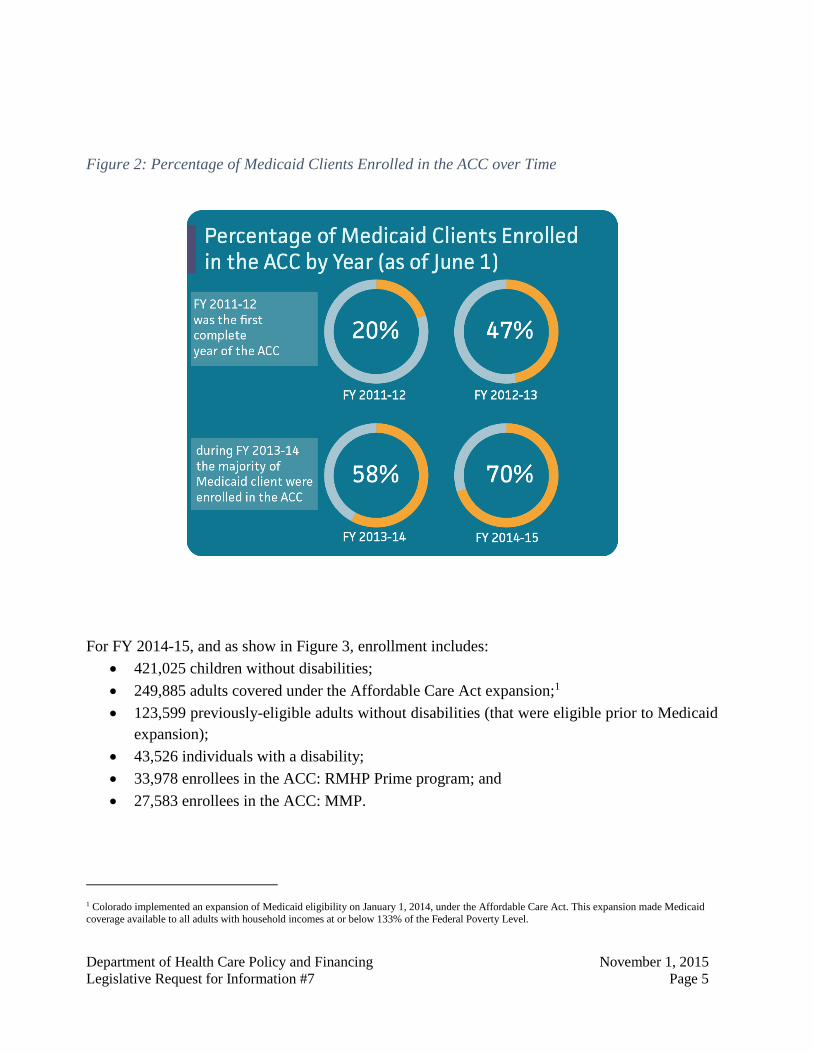
2.1. Enrollment Numbers
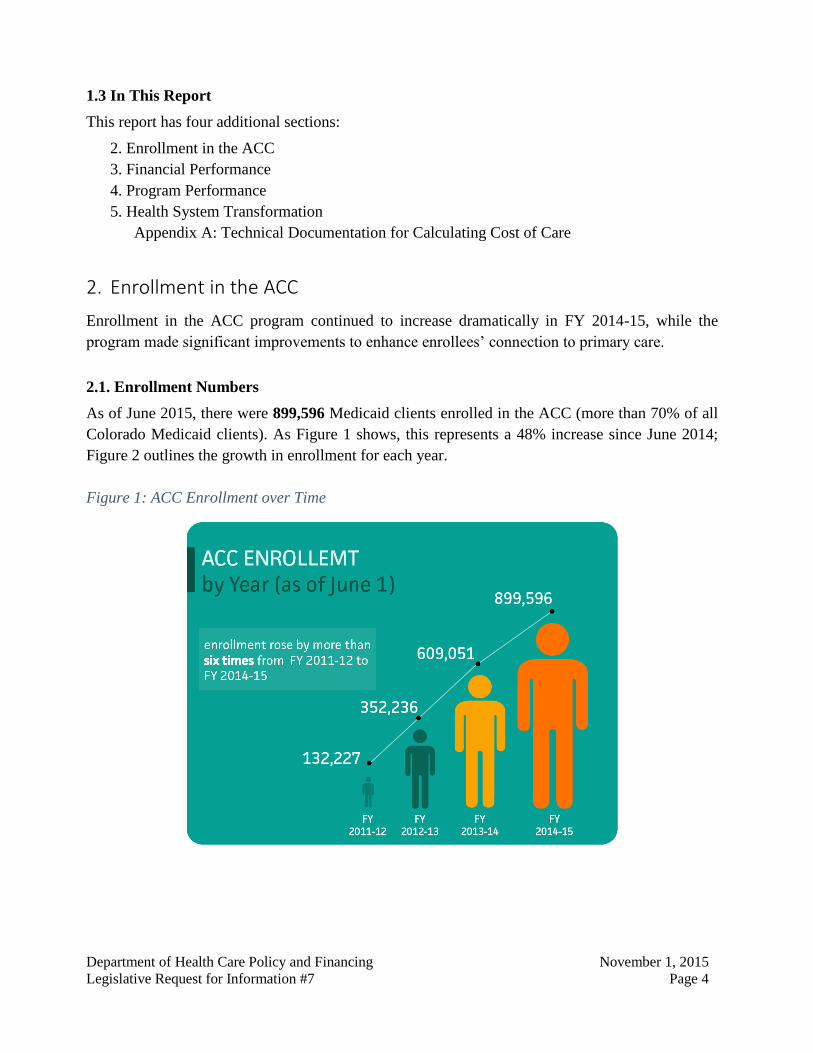
As of June 2015, there were 899,596 Medicaid clients enrolled in the ACC (more than 70% of all
Colorado Medicaid clients). As Figure 1 shows, this represents a 48% increase since June 2014;
Figure 2 outlines the growth in enrollment for each year.
Figure 1: ACC Enrollment over Time
Department of Health Care Policy and Financing November 1, 2015
Legislative Request for Information #7 Page 5
Figure 2: Percentage of Medicaid Clients Enrolled in the ACC over Time
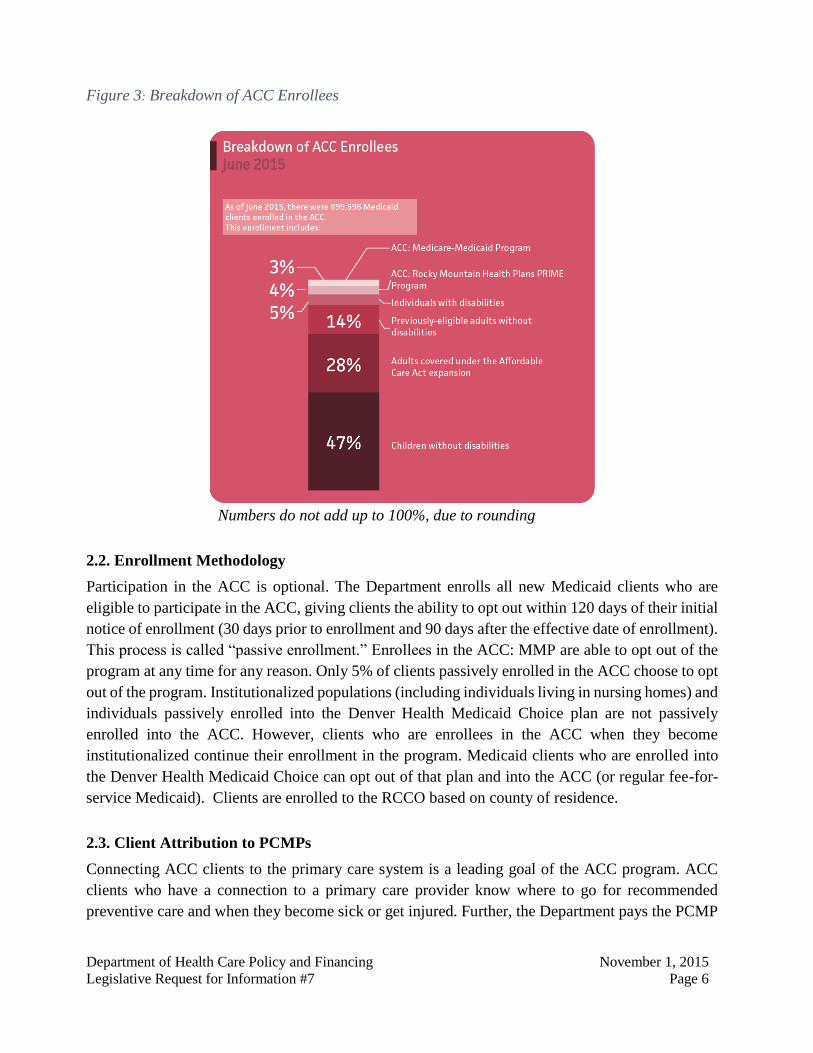
For FY 2014-15, and as show in Figure 3, enrollment includes:
421,025 children without disabilities;
249,885 adults covered under the Affordable Care Act expansion;1
123,599 previously-eligible adults without disabilities (that were eligible prior to Medicaid
expansion);
43,526 individuals with a disability;
33,978 enrollees in the ACC: RMHP Prime program; and
27,583 enrollees in the ACC: MMP.
1 Colorado implemented an expansion of Medicaid eligibility on January 1, 2014, under the Affordable Care Act. This expansion made Medicaid
coverage available to all adults with household incomes at or below 133% of the Federal Poverty Level.
Department of Health Care Policy and Financing November 1, 2015
Legislative Request for Information #7 Page 6
Figure 3: Breakdown of ACC Enrollees
Numbers do not add up to 100%, due to rounding
2.2. Enrollment Methodology
Participation in the ACC is optional. The Department enrolls all new Medicaid clients who are
eligible to participate in the ACC, giving clients the ability to opt out within 120 days of their initial
notice of enrollment (30 days prior to enrollment and 90 days after the effective date of enrollment).
This process is called “passive enrollment.” Enrollees in the ACC: MMP are able to opt out of the
program at any time for any reason. Only 5% of clients passively enrolled in the ACC choose to opt
out of the program. Institutionalized populations (including individuals living in nursing homes) and
individuals passively enrolled into the Denver Health Medicaid Choice plan are not passively
enrolled into the ACC. However, clients who are enrollees in the ACC when they become
institutionalized continue their enrollment in the program. Medicaid clients who are enrolled into
the Denver Health Medicaid Choice can opt out of that plan and into the ACC (or regular fee-for-
service Medicaid). Clients are enrolled to the RCCO based on county of residence.
2.3. Client Attribution to PCMPs
Connecting ACC clients to the primary care system is a leading goal of the ACC program. ACC
clients who have a connection to a primary care provider know where to go for recommended
preventive care and when they become sick or get injured. Further, the Department pays the PCMP
Department of Health Care Policy and Financing November 1, 2015
Legislative Request for Information #7 Page 7
and RCCO a per member per month (PMPM) payment, helping to support both entities in their
efforts to provide medical homes and coordinate care for ACC clients.
Clients enrolled in the ACC program are attributed, or assigned, to a PCMP through three processes:
1. Clients are assigned to a PCMP if they have a recent claims history with that provider
(within the last 12 months)
2. If a client has no claims history with an ACC provider, he or she will be assigned to a PCMP
if a member of their family has had a recent claims history with that provider
3. Clients may select their own PCMP at any time. Client choice will always take priority over
system assignment.
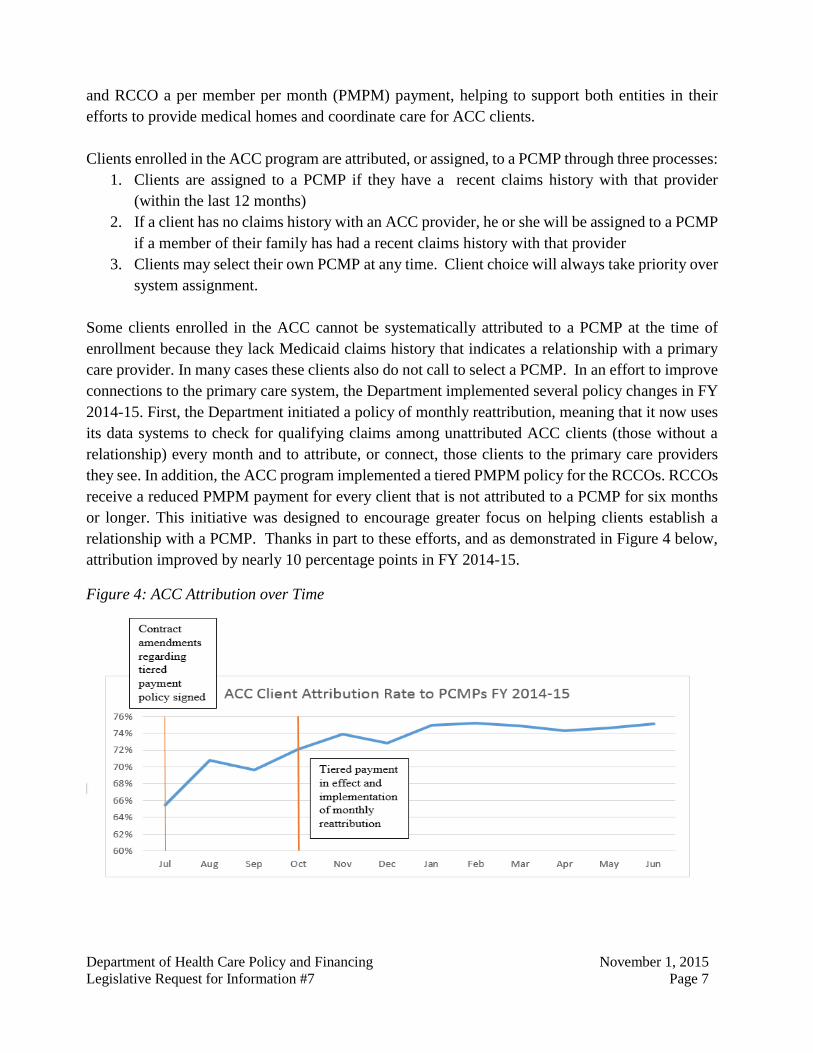
Some clients enrolled in the ACC cannot be systematically attributed to a PCMP at the time of
enrollment because they lack Medicaid claims history that indicates a relationship with a primary
care provider. In many cases these clients also do not call to select a PCMP. In an effort to improve
connections to the primary care system, the Department implemented several policy changes in FY
2014-15. First, the Department initiated a policy of monthly reattribution, meaning that it now uses
its data systems to check for qualifying claims among unattributed ACC clients (those without a
relationship) every month and to attribute, or connect, those clients to the primary care providers
they see. In addition, the ACC program implemented a tiered PMPM policy for the RCCOs. RCCOs
receive a reduced PMPM payment for every client that is not attributed to a PCMP for six months
or longer. This initiative was designed to encourage greater focus on helping clients establish a
relationship with a PCMP. Thanks in part to these efforts, and as demonstrated in Figure 4 below,
attribution improved by nearly 10 percentage points in FY 2014-15.
Figure 4: ACC Attribution over Time
Department of Health Care Policy and Financing November 1, 2015
Legislative Request for Information #7 Page 8
3. Financial Performance
The ACC operates as a Primary Care Case Management program. This means that providers are
paid for each medical service they deliver, but PCMPs and RCCOs also have financial incentives to
provide high-value care in the most efficient locations. The Department invests in the ACC’s
administrative costs to realize a savings in medical service costs as well as better health outcomes.
In FY 2014-15, the Department estimates that the ACC again avoided medical costs that were in
excess of program administrative costs. This section is divided into four subsections, as follows:
3.1 Methodology
3.2 Program Costs
3.3 Program Costs Avoided
3.4 Financial Performance Across Populations
3.1. Methodology
For this analysis, the Department looked at program costs and estimated costs avoided for FY 2014-
15 using a counterfactual estimation technique. This is a retrospective review of program
performance, and so costs and cost avoided estimates will differ from those in budget requests,
which use a prospective methodology to project future program costs and savings.
Note that, due to systematic limitations related to Medicare costs, it was not possible to observe or
estimate costs for the ACC: MMP population, and so they are excluded from the analysis.
Individuals enrolled in ACC: RMHP Prime are also excluded because that analysis was done
separately and reported on in a separate report.2
Additional information about the methodology is provided in Appendix A.
3.2. Program Costs
For FY 2014-15, total administrative costs for the ACC were $83,605,253. This amount covers
payments made to the RCCOs, payments made to PCMPs, and payments made to the SDAC.
RCCO Payments
RCCOs receive a PMPM payment for ensuring care coordination, provider support, network
development, and reporting responsibilities. Beginning in September 2014, the RCCO PMPM rate
for FY 2014-15 was reduced by $0.50 from the FY 2013-14 rate to establish an additional incentive
pool.3 As described previously, in October 2014, the Department also implemented a tiered RCCO
2 This report, the Department of Health Care Policy and Financing’s report on the Medicaid Payment Reform and Innovation Pilot Program
required by Section 25.5-5-415 (4)(a)(III), C.R.S. is available on the Colorado General Assembly’s website
(http://www.leg.state.co.us/library/reports.nsf/reports.xsp)
3 PMPM rates vary by RCCO, based on what the RCCO negotiated at the beginning if its contract. The new base rate is between $8.43 and $9.00.

Department of Health Care Policy and Financing November 1, 2015
Legislative Request for Information #7 Page 9
payment policy, reducing the PMPM by 35% for clients who had been unattributed to a PCMP for
six months or longer.
RCCOs are also eligible to receive incentive payments for improvement on Key Performance
Indicators (KPIs). In FY 2014-15, RCCOs were paid a total of $62,280,126, including $58,096,683
in PMPM payments and $4,183,443 in incentive payments. The incentive payment amount includes
the $469,618 paid for KPIs and the $3,713,825 paid from the new incentive pool. The incentive
pool was paid out to the RCCOs based on their relative performance for the rate of clients who had
a physician visit within 30 days of a hospital discharge.4 The total payments to the RCCOs represent
76% of total ACC administrative costs.
PCMP Payments
PCMPs receive PMPM payments for the extra commitment associated with providing medical home
services to clients. Like the RCCOs, PCMPs are also eligible to receive incentive payments for
reaching performance targets on KPIs. Additionally, for FY 2014-15, for the first time, PCMPs
could receive an additional payment for meeting enhanced primary care factors, such as co-locating
physical and behavioral health providers or offering care after hours (the program is discussed in
detail in Section 5.1). Providers that were determined by their RCCO as meeting at least five of nine
of the enhanced factors in FY 2014-15 received the annual incentive payment in September 2015.5
During FY 2014-15, PCMPs were paid a total of $17,825,127, which includes $14,805,164 in
PMPM payments and $3,019,963 in incentive payments. These payments do not include
reimbursement for direct clinical services, which are paid through the standard Medicaid claims
process. The incentive payments are comprised of $353,313 for KPI performance as well as
$2,666,650 in enhanced PCMP payments. Two hundred sixty-five primary care providers met the
standards as an enhanced PCMP. Payments to PCMPs represent 20% of all ACC administrative
costs.
SDAC Payments
The SDAC receives payment for its services in providing timely, actionable data to the RCCOs,
PCMPs and the Department. For FY 2014–15, the SDAC was paid the contracted rate of $3,500,000.
3.3. Program Costs Avoided
In FY 2014-15, the Department estimates that the ACC avoided medical costs for enrolled clients
that exceeded all administrative costs. In FY 2014-15, the ACC achieved cost avoidance of
4 The performance pool dollars were paid out in FY 2015-16 but because the withhold from the administrative costs occurred during FY 2014-15
they have been included as part of the administrative dollars for the fiscal year covered by this report. 5 The enhanced PCMP dollars were paid out in FY 2015-16 but because the withhold from the administrative costs occurred during FY 2014-15 they have been included as part of the administrative dollars for the fiscal year covered by this report.
Department of Health Care Policy and Financing November 1, 2015
Legislative Request for Information #7 Page 10
Net costs avoided = administrative costs subtracted from gross$6,000 - $2,000 = $4,000 net costs avoided
Assume administrative costs of $2,000(money paid to RCCOs, PCMPs, and the SDAC)
Gross costs avoided = Actual cost of care subtracted from the benchmark$24,000 - $18,000 = $6,000 gross costs avoided
Actual cost of care for ACC members of of $18,000 per year20 clients x $75 per month x 12 months = $1,500 per month ($18,000 per year)
Benchmark for cost of care of $24,000 per year20 clients x $100 PMPM x 12 months
Develop an assumption of cost of care based on historical costs without the ACC (assume $100)
Assume 20 ACC Members
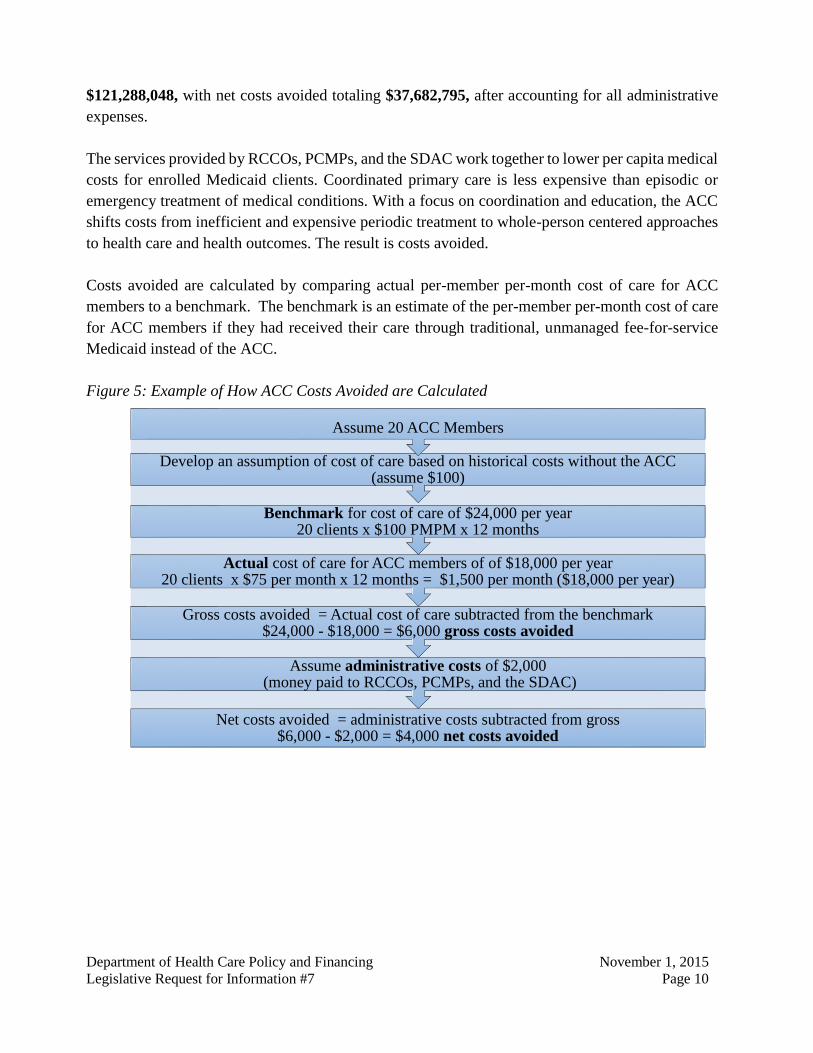
$121,288,048, with net costs avoided totaling $37,682,795, after accounting for all administrative
expenses.
The services provided by RCCOs, PCMPs, and the SDAC work together to lower per capita medical
costs for enrolled Medicaid clients. Coordinated primary care is less expensive than episodic or
emergency treatment of medical conditions. With a focus on coordination and education, the ACC
shifts costs from inefficient and expensive periodic treatment to whole-person centered approaches
to health care and health outcomes. The result is costs avoided.
Costs avoided are calculated by comparing actual per-member per-month cost of care for ACC
members to a benchmark. The benchmark is an estimate of the per-member per-month cost of care
for ACC members if they had received their care through traditional, unmanaged fee-for-service
Medicaid instead of the ACC.
Figure 5: Example of How ACC Costs Avoided are Calculated
Department of Health Care Policy and Financing November 1, 2015
Legislative Request for Information #7 Page 11
3.4. Financial Performance Across Populations
While the overall financial performance of the program is important, it is helpful to understand the
program’s fiscal performance by population. In FY 2014-15, program costs were less than expected
for expansion adults and clients with disabilities. Program costs were higher than expected for
previously eligible adults and children.6 It is also important to note that not all program costs can
be attributed to specific enrolled sub-populations. Fixed costs, such as infrastructure development,
community relationship-building, and delivery system reform are shared across the program and
serve all clients.
Financial Performance: Clients with Disabilities
In FY 2014-15, the ACC achieved gross costs avoided of $86,231,931 for the population of ACC
enrollees with disabilities. Administrative costs for clients with disabilities were $4,800,830. The
result is net costs avoided of $81,431,101 for this population.
Individuals with disabilities are often more medically vulnerable than people without disabilities,
frequently have multiple chronic conditions, and require greater intensive care, such as inpatient
hospital stays, more consistently and more often, than do children and adults without disabilities.
As a result, populations with disabilities drive a large portion of spending for any health care plan
and within any health care system. Programs such as the ACC, with a focus on coordinating care
among primary care providers and specialists, connecting clients to community partners that can
enhance access to resources, fostering communication among medical and non-medical agencies
and providers who render care to this population, and helping to develop and follow up on service
coordination plans have a greater opportunity to achieve cost efficiencies among individuals with
disabilities than with other populations. The aggregate cost of care analysis shows significant costs
avoided for ACC clients with disabilities, a finding fully supported by actual expenditure reductions
on expensive services, such as hospital services, for the Medicaid population with disabilities. While
there are likely many factors that contributed to declines in per capita expenditure on hospital
services for individuals with disabilities, strong declines in inpatient and outpatient spending for this
population aligned with expectations for ACC program performance.
Table 1, on the following page, provides additional detail.
6 Incentive payments were not divided among the different populations and were not included in the sub-population’s gross costs. Thus, the sum of
each of the estimates of population-level costs avoided will be higher than the total costs avoided for the ACC program.
Department of Health Care Policy and Financing November 1, 2015
Legislative Request for Information #7 Page 12
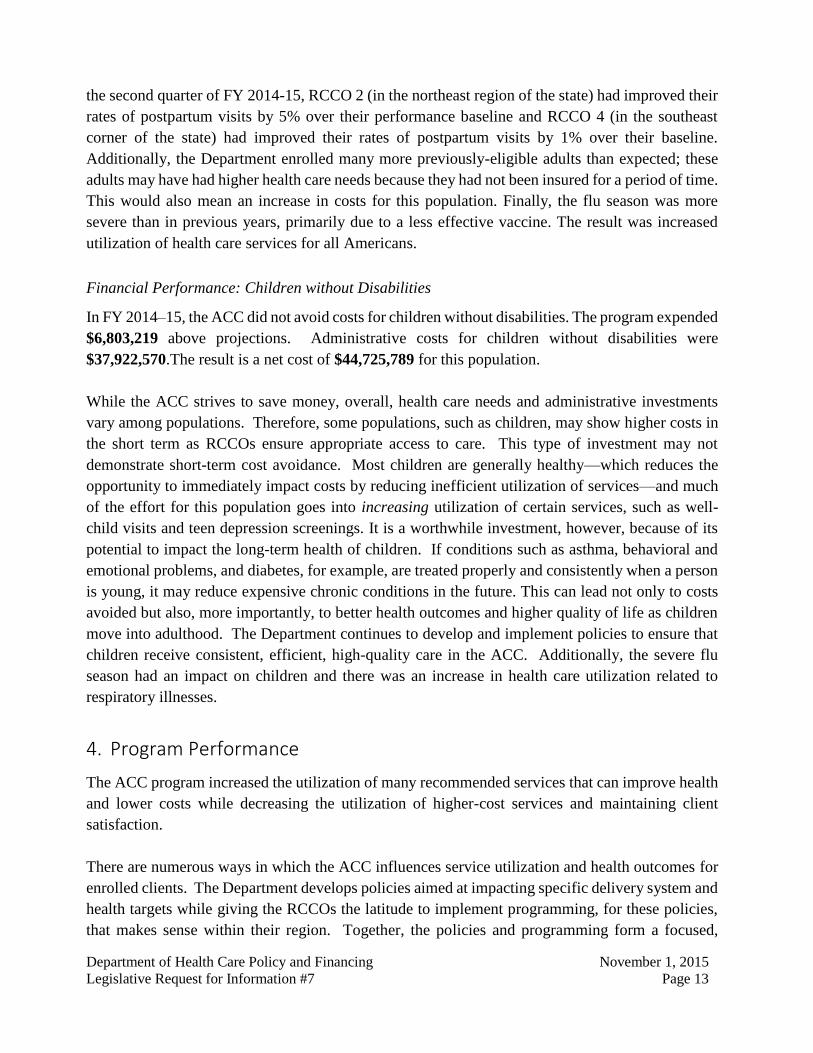
Table 1: Per Capita Expenditure for Inpatient and Outpatient Service for Individuals with
Disabilities (Ages 0-59)
Service Category FY 2012-13 FY 2013-14 FY 2014-15
Outpatient $57,838,186 $63,033,295 $58,113,463
Inpatient $113,024,520 $100,723,524 $90,638,415
Total $170,862,706 $163,756,819 $148,751,878
Caseload 61,920 64,424 66,548
Per Capita Inpatient and Outpatient
Hospital Expenditure
$2,759.41 $2,541.86 $2,235.26
Percentage Change -7.88% -12.06%
Financial Performance: Expansion Adults
In FY 2014–15, the ACC achieved gross costs avoided of $41,121,585 for expansion adults.
Administrative costs for expansion adults were $19,167,932. The result is net costs avoided of
$21,953,653 for this population.
Last year, the ACC program spent roughly $19 million more than estimated on the expansion
population. However, after additional time in the program, spending patterns on this population
appear to have stabilized to some degree. This experience aligns with experiences in other states
with similar expansion populations, where cost increases for the population appeared to be largely
temporary when there was a program to assign clients to medical homes and encourage care
coordination.7 It is also important to note that, during FY 2014-15, the percentage of expansion
adults who were attributed to a PCMP increased dramatically, from 40.5% in June 2014 to 60.7%
in June 2015. Connection to a primary care medical provider is consistently cited as a factor in
lowering health care costs while improving health outcomes among populations. As a primary goal
of the ACC, the Department, the RCCOs, the PCMPs will continue to connect expansion adults with
viable and accessible medical homes.
Financial Performance: Previously-eligible Adults without Disabilities
In FY 2014–15, the ACC achieved gross costs avoided of $737,752 for the population of previously-
eligible adults without disabilities. Administrative costs for previously-eligible adults were
$11,010,515. The result is a net cost of $10,272,763 for this population.
The Department was unable to determine the precise driver of increased costs for this population.
New focus on a KPI related to this population could be one explanation for the increased costs. In
FY 2014-15, for the first time, RCCOs and PCMPs could earn financial incentives for improving
the rate of receipt of postpartum visits in their region. Thus, it is not entirely surprising that there
were increased costs. RCCOs had the most success with this measure of any KPI last year. As of
7 http://healthpolicy.ucla.edu/publications/Documents/PDF/2014/Demand_PB_FINAL_10-8-14.pdf
Department of Health Care Policy and Financing November 1, 2015
Legislative Request for Information #7 Page 13
the second quarter of FY 2014-15, RCCO 2 (in the northeast region of the state) had improved their
rates of postpartum visits by 5% over their performance baseline and RCCO 4 (in the southeast
corner of the state) had improved their rates of postpartum visits by 1% over their baseline.
Additionally, the Department enrolled many more previously-eligible adults than expected; these
adults may have had higher health care needs because they had not been insured for a period of time.
This would also mean an increase in costs for this population. Finally, the flu season was more
severe than in previous years, primarily due to a less effective vaccine. The result was increased
utilization of health care services for all Americans.
Financial Performance: Children without Disabilities
In FY 2014–15, the ACC did not avoid costs for children without disabilities. The program expended
$6,803,219 above projections. Administrative costs for children without disabilities were
$37,922,570.The result is a net cost of $44,725,789 for this population.
While the ACC strives to save money, overall, health care needs and administrative investments
vary among populations. Therefore, some populations, such as children, may show higher costs in
the short term as RCCOs ensure appropriate access to care. This type of investment may not
demonstrate short-term cost avoidance. Most children are generally healthy—which reduces the
opportunity to immediately impact costs by reducing inefficient utilization of services—and much
of the effort for this population goes into increasing utilization of certain services, such as well-
child visits and teen depression screenings. It is a worthwhile investment, however, because of its
potential to impact the long-term health of children. If conditions such as asthma, behavioral and
emotional problems, and diabetes, for example, are treated properly and consistently when a person
is young, it may reduce expensive chronic conditions in the future. This can lead not only to costs
avoided but also, more importantly, to better health outcomes and higher quality of life as children
move into adulthood. The Department continues to develop and implement policies to ensure that
children receive consistent, efficient, high-quality care in the ACC. Additionally, the severe flu
season had an impact on children and there was an increase in health care utilization related to
respiratory illnesses.
4. Program Performance
The ACC program increased the utilization of many recommended services that can improve health
and lower costs while decreasing the utilization of higher-cost services and maintaining client
satisfaction.
There are numerous ways in which the ACC influences service utilization and health outcomes for
enrolled clients. The Department develops policies aimed at impacting specific delivery system and
health targets while giving the RCCOs the latitude to implement programming, for these policies,
that makes sense within their region. Together, the policies and programming form a focused,
Department of Health Care Policy and Financing November 1, 2015
Legislative Request for Information #7 Page 14
regional approach to care coordination, practice support, and system transformation that correlates
with the positive outcomes seen in the ACC. Some specific examples of RCCO activities are
provided within this section.
This section is divided into five subsections, as follows:
4.1 Methodology
4.2 Utilization of Lower-cost Outpatient and Wellness and Preventive Services
4.3 Utilization of Higher-cost Services and ER Services
4.4 Populations that are New to the ACC
4.5 Client Satisfaction
4.1. Methodology
Comparison Groups
For FY 2014-15, the Department focused the analysis on the performance of the ACC for clients
enrolled in the ACC by the amount of time they have spent in the ACC, rather than comparing those
enrolled to those not enrolled in the program as was done in previous years. The Department took
this approach because, at the time of analysis, more than 70% of Medicaid clients in Colorado were
enrolled in the ACC and the group not enrolled is comprised of specific types of individuals (such
as those with a strong relationship to a non-ACC-contracted provider, or those who have opted out
of the program). The non-enrolled group has unique characteristics that cause them to differ in
significant ways from those enrolled in the ACC, prohibiting accurate comparisons across the
groups. For FY 2014-15, the Department compared claims data for three groups of ACC enrollees—
those enrolled in the program 0-3 months, 4-6 months, and 7-10 months. When there were too few
instances of services used, the analysis only compared two groups of enrollees—those enrolled in
the program 0-6 months, and those enrolled for 7-10 months. Note, that due to claims run-out, only
ten months of FY 2014-15 program data were available at the time this report was prepared.
While the Department believes this is the preferred method for measuring performance of the ACC,
the analysis has some notable limitations. First, for clients enrolled in the program for less than six
months, the analysis cannot adjust for the timing of annually recommended services. Well-child
visits and chlamydia screenings, for example, are typically performed on an annual basis; so an
increase in these services after six months may be reflective of an ACC intervention or simply
reflective of the timing of appointments. Claims data report when a service was rendered, not why
it was rendered at a particular time. Also, for newly-eligible clients who are pregnant, factors other
than ACC involvement may contribute to higher rates of services after the client has been in the
program for at least six months. Routine recommended visits, for example, increase later in a
pregnancy and certain issues that require enhanced medical care, such as gestational diabetes, may
not be detected until several months into the pregnancy. However, these limitations are less of a
Department of Health Care Policy and Financing November 1, 2015
Legislative Request for Information #7 Page 15
factor for the other program performance metrics, such as ER utilization or 30-day follow-up care,
which are not tied to a periodicity schedule.
Population Inclusions and Exclusions
Unless specified otherwise, the data presented here include all populations of ACC enrollees –
children without disabilities, adults eligible under the Affordable Care Act expansion, previously-
eligible adults without disabilities, and children and adults with disabilities.
Enrollees in ACC: RMHP Prime were not included in the analysis as the Department submitted a
separate legislative report on these enrollees. The ACC: MMP population was also excluded:
for consistency with financial reporting—they were excluded from the financial
performance analysis due to systematic limitations;
because enrollment did not begin until midway through FY 2014-15; and
there will be separate performance indicators for the ACC: MMP.
Section 4.4 provides an overview of preliminary performance results for the ACC: MMP.
The most common exception to the principle of including all other populations applies to the results
shown for the program’s KPIs, the primary pay-for-performance measures for the program. The
methodology for establishing the benchmarks (goals) for KPIs requires historical data and those
data were not available for some populations. Thus, the following populations (referred to below
as “KPI population exclusions”) were excluded from the KPIs:
Clients with less than three months of enrollment in the ACC;
Clients who were enrolled in any managed care plan for a period of time during the reporting
period;
Clients eligible for both a Medicare and a Medicaid benefit, including those enrolled in the
ACC: MMP;
Clients who are defined as part of the Medicaid expansion population;
Clients in the Working Adults with Disabilities Buy-in Eligibility Type; and
Clients in the Children with Disabilities Buy-in Eligibility Type.
The Department has gained experience tracking some of these populations in the ACC program, and
will be reducing the number of population exclusions applied to the KPIs in future years. Notably,
beginning in FY 2015-16, Medicaid expansion clients, clients in both buy-in programs, and
individuals enrolled in a managed care plan for less than three months in a reporting period will be
included in the KPIs. Clients enrolled in the ACC: MMP will continue to be excluded from the
ACC KPIs as there are unique KPIs to monitor the performance of the ACC: MMP.
Department of Health Care Policy and Financing November 1, 2015
Legislative Request for Information #7 Page 16
For FY 2014-15, the KPIs were well-child visits among children ages 3-9, postpartum care, and ER
utilization.
4.2. Utilization of Lower-cost Outpatient and Wellness and Preventive Services
Data from FY 2014-15 indicate that as people spend more time in the ACC program, they are more
likely to receive recommended health services.
KPI: Well-Child Visits Among Children Ages 3-9 (KPI population exclusions applied)
This is a measure of the rate of receipt of an annual well-child visit among children in the ACC ages
3-9. Well-child visits are an important time for communication between caretakers and health
providers and provide opportunities for essential preventive care such as childhood vaccinations.
Additionally, caretakers receive information and advice on normal development, nutrition, sleep,
safety, and diseases. The Department measures the client population between ages of three to nine
because this is an age group for which Colorado’s performance has historically been low. During
FY 2014-15 the RCCOs implemented multiple strategies to increase the annual well-child check
rates. As examples, Colorado Community Health Alliance, serving Region 6, conducted an
extensive review and mapping of well-child service utilization within their region and used the
information to develop a joint plan with school based health clinics and other providers to outreach
and educate clients in the areas that showed the lowest utilization of well-child services. In Region
1, Rocky Mountain Health Plans conducted “warm transfers” of clients from their customer service
center to pediatric practices to facilitate scheduling of well-child visits. RCCO 1 reported a 15% -
20% increase in appointments since instituting these “warm transfers.”
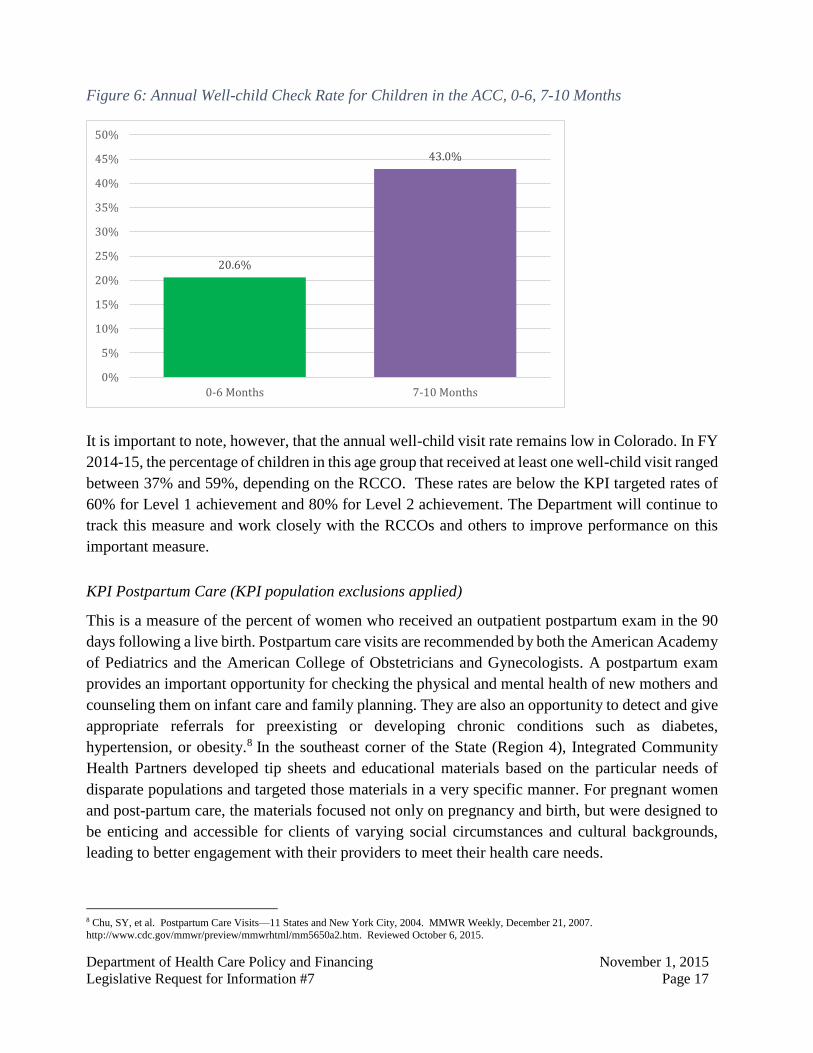
As Figure 6 on the next page indicates, the rate of receipt of annual well-child visits is more than
twice as high for children in the program for 7-10 months, as compared to those enrolled for 6
months or less. As mentioned earlier, this could be indicative of ACC involvement, timing of annual
appointments, or a combination thereof.
Department of Health Care Policy and Financing November 1, 2015
Legislative Request for Information #7 Page 17
Figure 6: Annual Well-child Check Rate for Children in the ACC, 0-6, 7-10 Months
It is important to note, however, that the annual well-child visit rate remains low in Colorado. In FY
2014-15, the percentage of children in this age group that received at least one well-child visit ranged
between 37% and 59%, depending on the RCCO. These rates are below the KPI targeted rates of
60% for Level 1 achievement and 80% for Level 2 achievement. The Department will continue to
track this measure and work closely with the RCCOs and others to improve performance on this
important measure.
KPI Postpartum Care (KPI population exclusions applied)
This is a measure of the percent of women who received an outpatient postpartum exam in the 90
days following a live birth. Postpartum care visits are recommended by both the American Academy
of Pediatrics and the American College of Obstetricians and Gynecologists. A postpartum exam
provides an important opportunity for checking the physical and mental health of new mothers and
counseling them on infant care and family planning. They are also an opportunity to detect and give
appropriate referrals for preexisting or developing chronic conditions such as diabetes,
hypertension, or obesity.8 In the southeast corner of the State (Region 4), Integrated Community
Health Partners developed tip sheets and educational materials based on the particular needs of
disparate populations and targeted those materials in a very specific manner. For pregnant women
and post-partum care, the materials focused not only on pregnancy and birth, but were designed to
be enticing and accessible for clients of varying social circumstances and cultural backgrounds,
leading to better engagement with their providers to meet their health care needs.
8 Chu, SY, et al. Postpartum Care Visits—11 States and New York City, 2004. MMWR Weekly, December 21, 2007.
http://www.cdc.gov/mmwr/preview/mmwrhtml/mm5650a2.htm. Reviewed October 6, 2015.
20.6%
43.0%
0%
5%
10%
15%
20%
25%
30%
35%
40%
45%
50%
0-6 Months 7-10 Months
Department of Health Care Policy and Financing November 1, 2015
Legislative Request for Information #7 Page 18
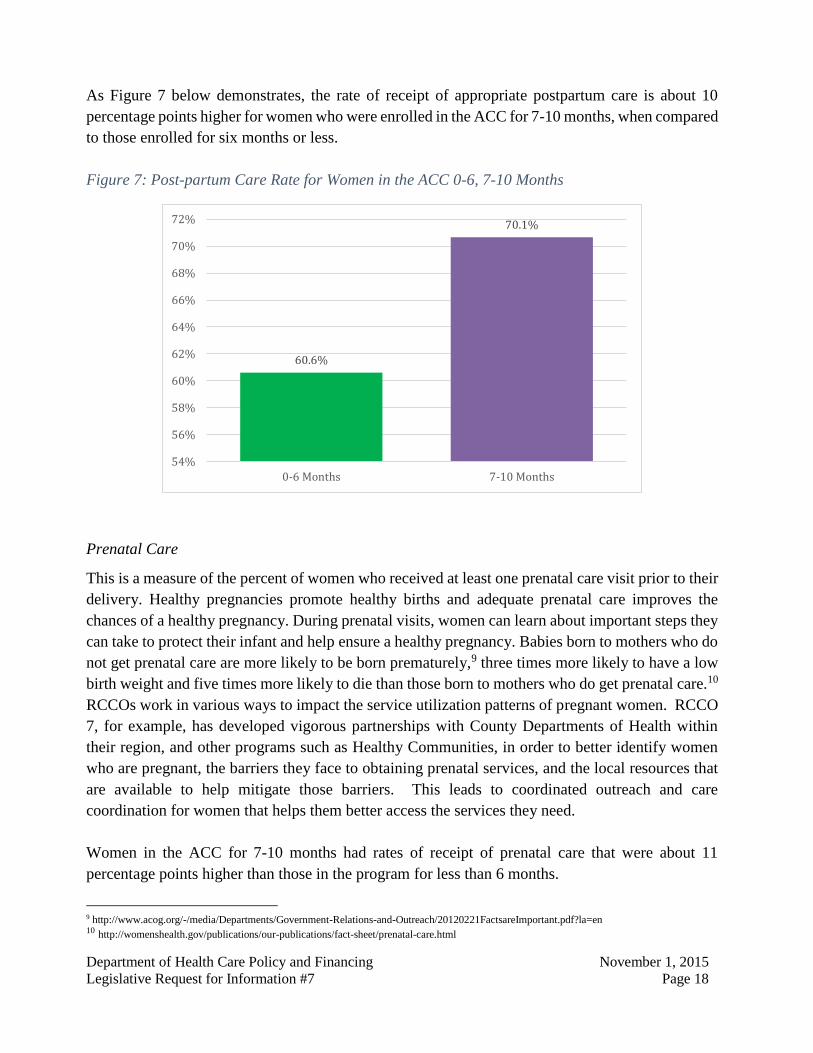
As Figure 7 below demonstrates, the rate of receipt of appropriate postpartum care is about 10
percentage points higher for women who were enrolled in the ACC for 7-10 months, when compared
to those enrolled for six months or less.
Figure 7: Post-partum Care Rate for Women in the ACC 0-6, 7-10 Months
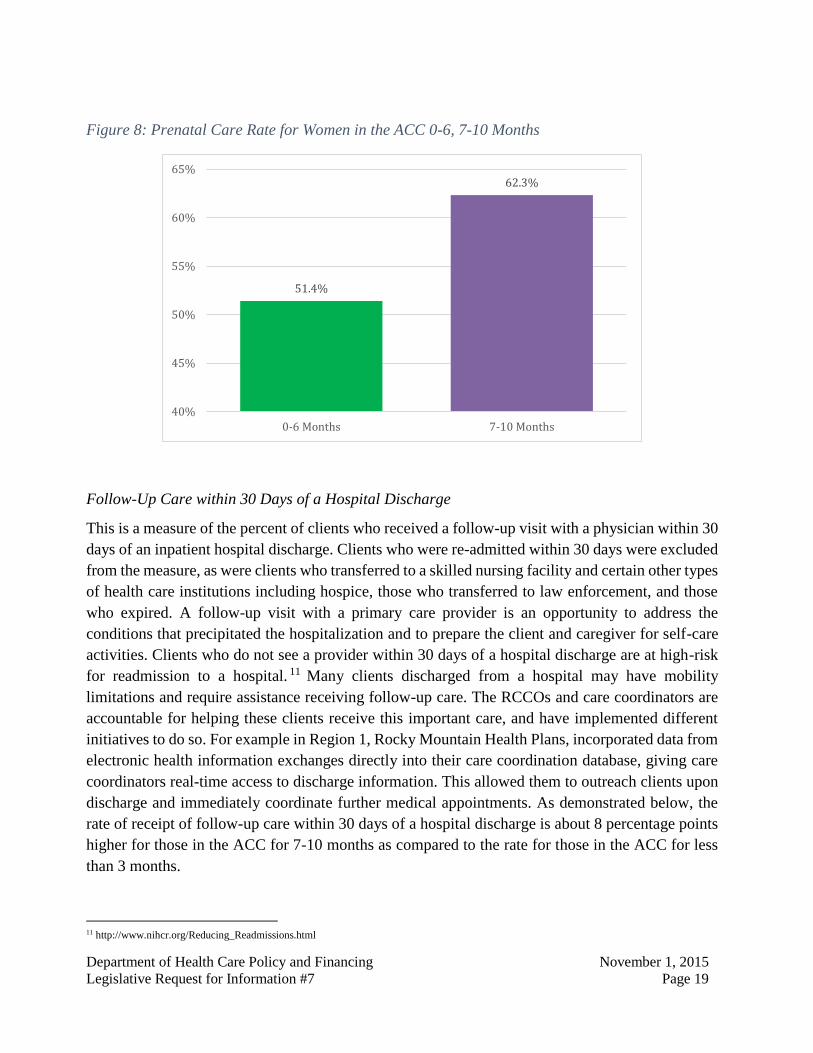
Prenatal Care
This is a measure of the percent of women who received at least one prenatal care visit prior to their
delivery. Healthy pregnancies promote healthy births and adequate prenatal care improves the
chances of a healthy pregnancy. During prenatal visits, women can learn about important steps they
can take to protect their infant and help ensure a healthy pregnancy. Babies born to mothers who do
not get prenatal care are more likely to be born prematurely,9 three times more likely to have a low
birth weight and five times more likely to die than those born to mothers who do get prenatal care.10
RCCOs work in various ways to impact the service utilization patterns of pregnant women. RCCO
7, for example, has developed vigorous partnerships with County Departments of Health within
their region, and other programs such as Healthy Communities, in order to better identify women
who are pregnant, the barriers they face to obtaining prenatal services, and the local resources that
are available to help mitigate those barriers. This leads to coordinated outreach and care
coordination for women that helps them better access the services they need.
Women in the ACC for 7-10 months had rates of receipt of prenatal care that were about 11
percentage points higher than those in the program for less than 6 months.
9 http://www.acog.org/-/media/Departments/Government-Relations-and-Outreach/20120221FactsareImportant.pdf?la=en 10 http://womenshealth.gov/publications/our-publications/fact-sheet/prenatal-care.html
60.6%
70.1%
54%
56%
58%
60%
62%
64%
66%
68%
70%
72%
0-6 Months 7-10 Months
Department of Health Care Policy and Financing November 1, 2015
Legislative Request for Information #7 Page 19
Figure 8: Prenatal Care Rate for Women in the ACC 0-6, 7-10 Months
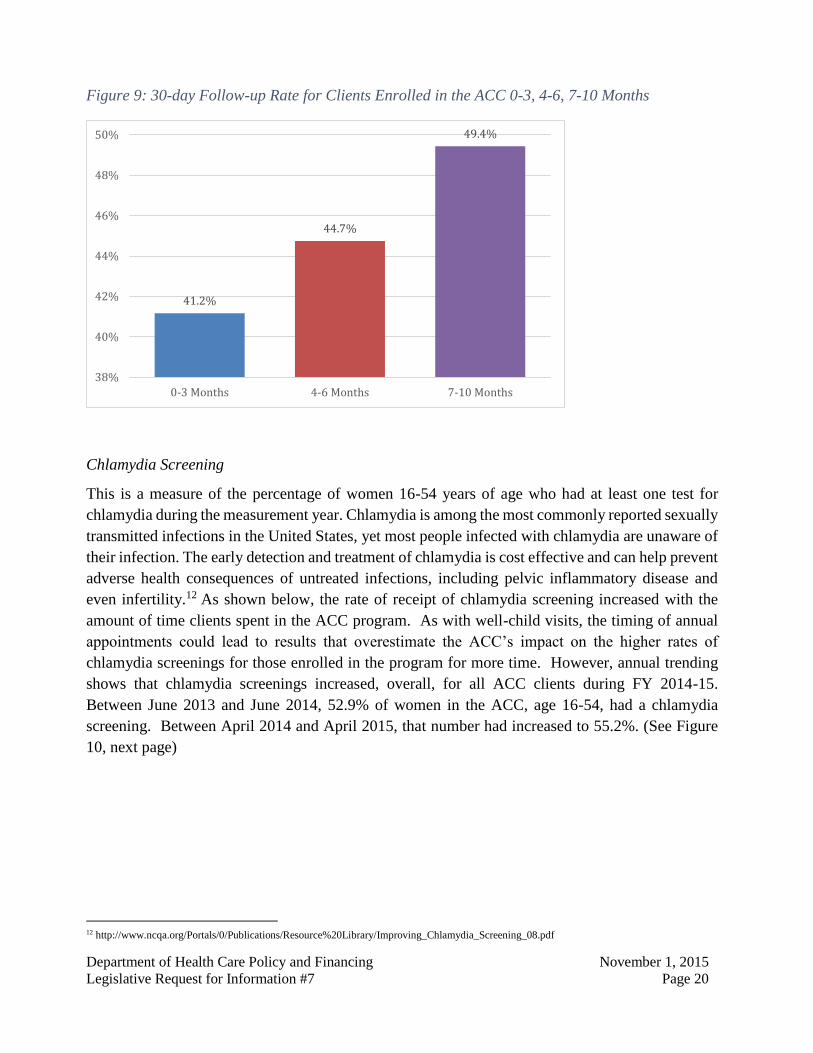
Follow-Up Care within 30 Days of a Hospital Discharge
This is a measure of the percent of clients who received a follow-up visit with a physician within 30
days of an inpatient hospital discharge. Clients who were re-admitted within 30 days were excluded
from the measure, as were clients who transferred to a skilled nursing facility and certain other types
of health care institutions including hospice, those who transferred to law enforcement, and those
who expired. A follow-up visit with a primary care provider is an opportunity to address the
conditions that precipitated the hospitalization and to prepare the client and caregiver for self-care
activities. Clients who do not see a provider within 30 days of a hospital discharge are at high-risk
for readmission to a hospital. 11 Many clients discharged from a hospital may have mobility
limitations and require assistance receiving follow-up care. The RCCOs and care coordinators are
accountable for helping these clients receive this important care, and have implemented different
initiatives to do so. For example in Region 1, Rocky Mountain Health Plans, incorporated data from
electronic health information exchanges directly into their care coordination database, giving care
coordinators real-time access to discharge information. This allowed them to outreach clients upon
discharge and immediately coordinate further medical appointments. As demonstrated below, the
rate of receipt of follow-up care within 30 days of a hospital discharge is about 8 percentage points
higher for those in the ACC for 7-10 months as compared to the rate for those in the ACC for less
than 3 months.
11 http://www.nihcr.org/Reducing_Readmissions.html
51.4%
62.3%
40%
45%
50%
55%
60%
65%
0-6 Months 7-10 Months
Department of Health Care Policy and Financing November 1, 2015
Legislative Request for Information #7 Page 20
Figure 9: 30-day Follow-up Rate for Clients Enrolled in the ACC 0-3, 4-6, 7-10 Months
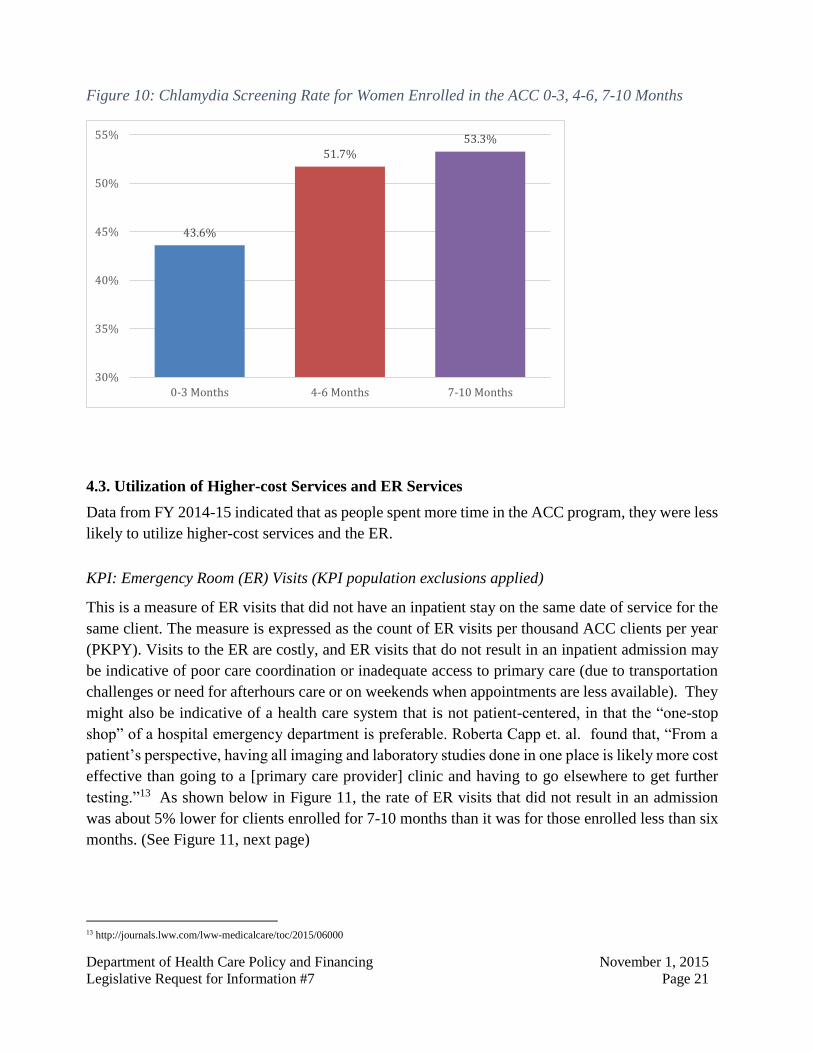
Chlamydia Screening
This is a measure of the percentage of women 16-54 years of age who had at least one test for
chlamydia during the measurement year. Chlamydia is among the most commonly reported sexually
transmitted infections in the United States, yet most people infected with chlamydia are unaware of
their infection. The early detection and treatment of chlamydia is cost effective and can help prevent
adverse health consequences of untreated infections, including pelvic inflammatory disease and
even infertility.12 As shown below, the rate of receipt of chlamydia screening increased with the
amount of time clients spent in the ACC program. As with well-child visits, the timing of annual
appointments could lead to results that overestimate the ACC’s impact on the higher rates of
chlamydia screenings for those enrolled in the program for more time. However, annual trending
shows that chlamydia screenings increased, overall, for all ACC clients during FY 2014-15.
Between June 2013 and June 2014, 52.9% of women in the ACC, age 16-54, had a chlamydia
screening. Between April 2014 and April 2015, that number had increased to 55.2%. (See Figure
10, next page)
12 http://www.ncqa.org/Portals/0/Publications/Resource%20Library/Improving_Chlamydia_Screening_08.pdf
41.2%
44.7%
49.4%
38%
40%
42%
44%
46%
48%
50%
0-3 Months 4-6 Months 7-10 Months
Department of Health Care Policy and Financing November 1, 2015
Legislative Request for Information #7 Page 21
Figure 10: Chlamydia Screening Rate for Women Enrolled in the ACC 0-3, 4-6, 7-10 Months
4.3. Utilization of Higher-cost Services and ER Services
Data from FY 2014-15 indicated that as people spent more time in the ACC program, they were less
likely to utilize higher-cost services and the ER.
KPI: Emergency Room (ER) Visits (KPI population exclusions applied)
This is a measure of ER visits that did not have an inpatient stay on the same date of service for the
same client. The measure is expressed as the count of ER visits per thousand ACC clients per year
(PKPY). Visits to the ER are costly, and ER visits that do not result in an inpatient admission may
be indicative of poor care coordination or inadequate access to primary care (due to transportation
challenges or need for afterhours care or on weekends when appointments are less available). They
might also be indicative of a health care system that is not patient-centered, in that the “one-stop
shop” of a hospital emergency department is preferable. Roberta Capp et. al. found that, “From a
patient’s perspective, having all imaging and laboratory studies done in one place is likely more cost
effective than going to a [primary care provider] clinic and having to go elsewhere to get further
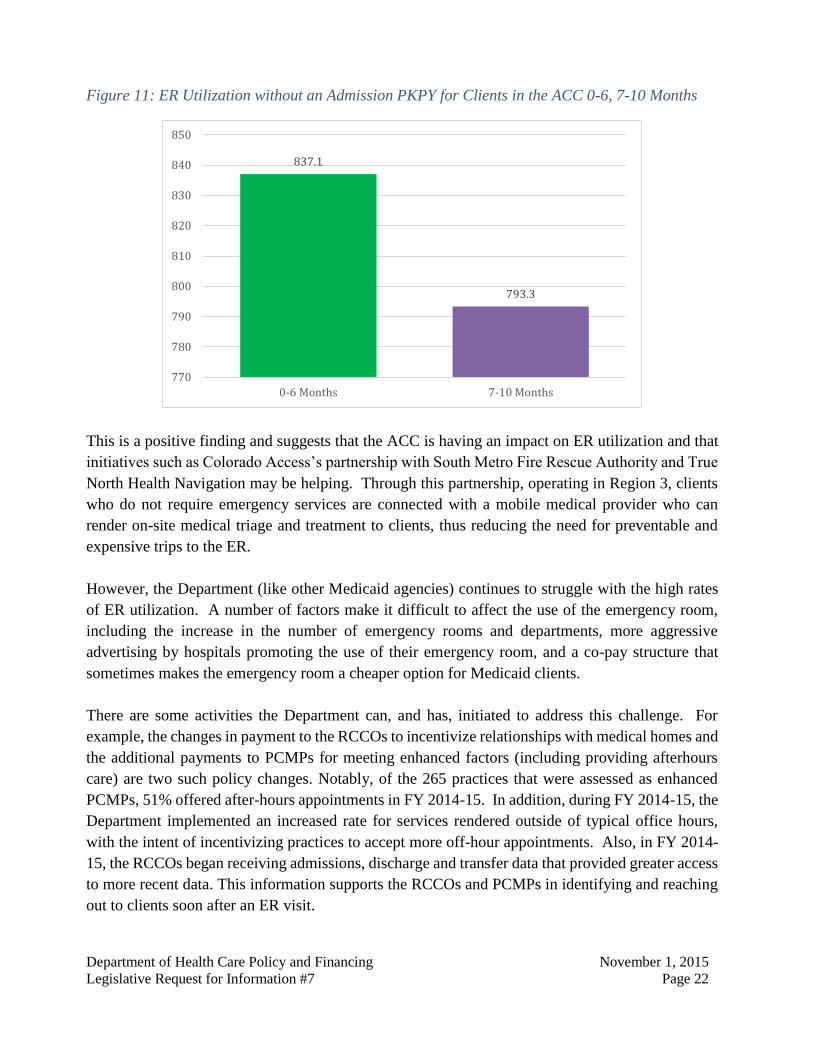
testing.”13 As shown below in Figure 11, the rate of ER visits that did not result in an admission
was about 5% lower for clients enrolled for 7-10 months than it was for those enrolled less than six
months. (See Figure 11, next page)
13 http://journals.lww.com/lww-medicalcare/toc/2015/06000
43.6%
51.7%
53.3%
30%
35%
40%
45%
50%
55%
0-3 Months 4-6 Months 7-10 Months
Department of Health Care Policy and Financing November 1, 2015
Legislative Request for Information #7 Page 22
Figure 11: ER Utilization without an Admission PKPY for Clients in the ACC 0-6, 7-10 Months
This is a positive finding and suggests that the ACC is having an impact on ER utilization and that
initiatives such as Colorado Access’s partnership with South Metro Fire Rescue Authority and True
North Health Navigation may be helping. Through this partnership, operating in Region 3, clients
who do not require emergency services are connected with a mobile medical provider who can
render on-site medical triage and treatment to clients, thus reducing the need for preventable and
expensive trips to the ER.
However, the Department (like other Medicaid agencies) continues to struggle with the high rates
of ER utilization. A number of factors make it difficult to affect the use of the emergency room,
including the increase in the number of emergency rooms and departments, more aggressive
advertising by hospitals promoting the use of their emergency room, and a co-pay structure that
sometimes makes the emergency room a cheaper option for Medicaid clients.
There are some activities the Department can, and has, initiated to address this challenge. For
example, the changes in payment to the RCCOs to incentivize relationships with medical homes and
the additional payments to PCMPs for meeting enhanced factors (including providing afterhours
care) are two such policy changes. Notably, of the 265 practices that were assessed as enhanced
PCMPs, 51% offered after-hours appointments in FY 2014-15. In addition, during FY 2014-15, the
Department implemented an increased rate for services rendered outside of typical office hours,
with the intent of incentivizing practices to accept more off-hour appointments. Also, in FY 2014-
15, the RCCOs began receiving admissions, discharge and transfer data that provided greater access
to more recent data. This information supports the RCCOs and PCMPs in identifying and reaching
out to clients soon after an ER visit.
837.1
793.3
770
780
790
800
810
820
830
840
850
0-6 Months 7-10 Months
Department of Health Care Policy and Financing November 1, 2015
Legislative Request for Information #7 Page 23
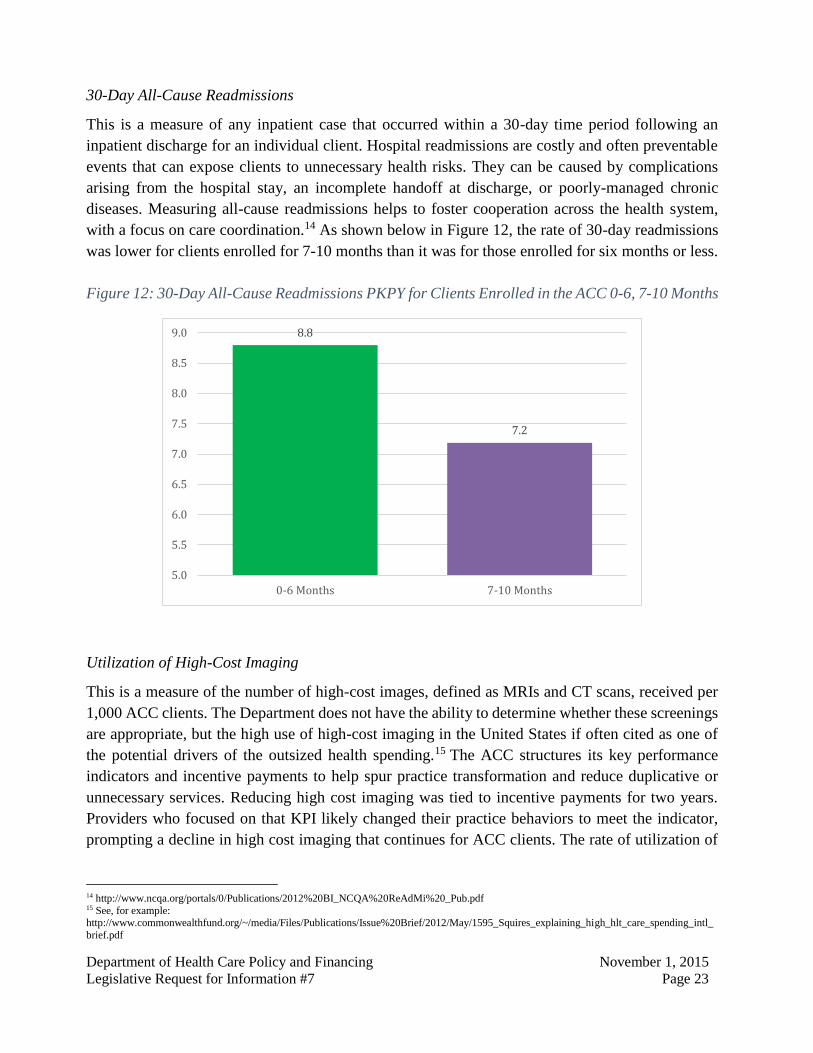
30-Day All-Cause Readmissions
This is a measure of any inpatient case that occurred within a 30-day time period following an
inpatient discharge for an individual client. Hospital readmissions are costly and often preventable
events that can expose clients to unnecessary health risks. They can be caused by complications
arising from the hospital stay, an incomplete handoff at discharge, or poorly-managed chronic
diseases. Measuring all-cause readmissions helps to foster cooperation across the health system,
with a focus on care coordination.14 As shown below in Figure 12, the rate of 30-day readmissions
was lower for clients enrolled for 7-10 months than it was for those enrolled for six months or less.
Figure 12: 30-Day All-Cause Readmissions PKPY for Clients Enrolled in the ACC 0-6, 7-10 Months
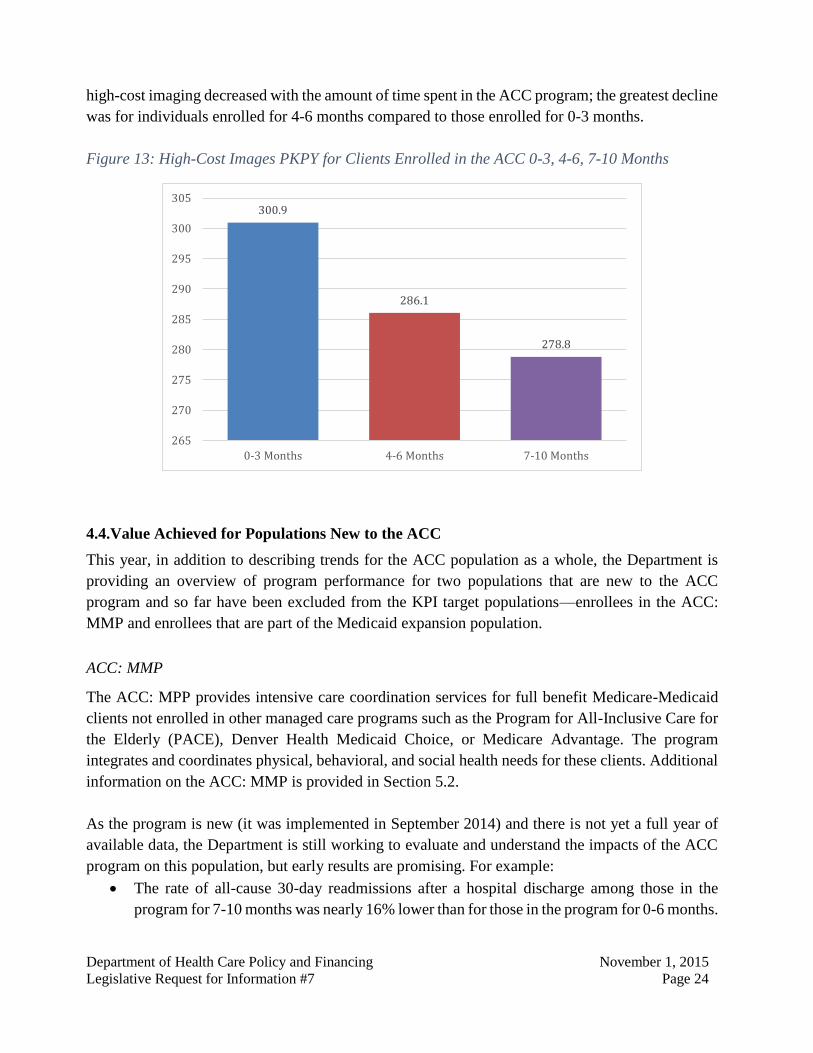
Utilization of High-Cost Imaging
This is a measure of the number of high-cost images, defined as MRIs and CT scans, received per
1,000 ACC clients. The Department does not have the ability to determine whether these screenings
are appropriate, but the high use of high-cost imaging in the United States if often cited as one of
the potential drivers of the outsized health spending.15 The ACC structures its key performance
indicators and incentive payments to help spur practice transformation and reduce duplicative or
unnecessary services. Reducing high cost imaging was tied to incentive payments for two years.
Providers who focused on that KPI likely changed their practice behaviors to meet the indicator,
prompting a decline in high cost imaging that continues for ACC clients. The rate of utilization of
14 http://www.ncqa.org/portals/0/Publications/2012%20BI_NCQA%20ReAdMi%20_Pub.pdf 15 See, for example: http://www.commonwealthfund.org/~/media/Files/Publications/Issue%20Brief/2012/May/1595_Squires_explaining_high_hlt_care_spending_intl_
brief.pdf
8.8
7.2
5.0
5.5
6.0
6.5
7.0
7.5
8.0
8.5
9.0
0-6 Months 7-10 Months
Department of Health Care Policy and Financing November 1, 2015
Legislative Request for Information #7 Page 24
high-cost imaging decreased with the amount of time spent in the ACC program; the greatest decline
was for individuals enrolled for 4-6 months compared to those enrolled for 0-3 months.
Figure 13: High-Cost Images PKPY for Clients Enrolled in the ACC 0-3, 4-6, 7-10 Months
4.4.Value Achieved for Populations New to the ACC
This year, in addition to describing trends for the ACC population as a whole, the Department is
providing an overview of program performance for two populations that are new to the ACC
program and so far have been excluded from the KPI target populations—enrollees in the ACC:
MMP and enrollees that are part of the Medicaid expansion population.
ACC: MMP
The ACC: MPP provides intensive care coordination services for full benefit Medicare-Medicaid
clients not enrolled in other managed care programs such as the Program for All-Inclusive Care for
the Elderly (PACE), Denver Health Medicaid Choice, or Medicare Advantage. The program
integrates and coordinates physical, behavioral, and social health needs for these clients. Additional
information on the ACC: MMP is provided in Section 5.2.
As the program is new (it was implemented in September 2014) and there is not yet a full year of
available data, the Department is still working to evaluate and understand the impacts of the ACC
program on this population, but early results are promising. For example:
The rate of all-cause 30-day readmissions after a hospital discharge among those in the
program for 7-10 months was nearly 16% lower than for those in the program for 0-6 months.
300.9
286.1
278.8
265
270
275
280
285
290
295
300
305
0-3 Months 4-6 Months 7-10 Months
Department of Health Care Policy and Financing November 1, 2015
Legislative Request for Information #7 Page 25
Rates of follow-up care within 30 days of a hospital discharge are slightly higher among
those in the program for 7-10 months compared to those in the program for 0-6 months.
The Expansion Population
As of June 2015, 249,885 expansion adults−70% of the total Affordable Care Act Medicaid
expansion population−were enrolled in the ACC. Expansion clients include parents with incomes
from 69% to 133% of the federal poverty level and all adults without dependent children with
incomes below 133% of the federal poverty level.
As with performance for the entire population, expansion clients with a longer duration in the ACC
generally had higher utilization of services that can improve health. For example, the rate of receipt
of both follow-up care within 30 days of a hospital discharge and of appropriate chlamydia screening
were higher among expansion adults enrolled in the program for 7-10 months compared to those in
the program for 0-6 months. However, aligning with data from similar expansions in other states,
expansion clients showed a general increase in the use of all health services as they spent more time
enrolled in the ACC program, even some health services that may not contribute to overall improved
health and lower costs. For example, utilization of high-cost imaging increased as individuals spent
more time in the ACC program, with those in the program for 7-10 months receiving, on average,
about 10% more of these services than those in the program for 0-6 months. The Department was
not able to discern systematically whether these diagnostic tests were appropriate or not. A
somewhat more concerning trend is that expansion clients in the program for 7-10 months went to
the ER for reasons that did not result in an inpatient admission at a rate 14% higher than clients in
the program for 0-6 months, the equivalent of 0.11 ER visits per year per client.
There are several possible explanations for these results. One possible explanation is that those
clients enrolled in the ACC for a longer period of time were among the first expansion clients to
enroll, and individuals who sought out Medicaid coverage immediately after the expansion may be
sicker or have more health care needs than those who waited several months before signing up for
coverage. Another explanation is that in examining a population that had been uninsured for a long
period of time prior to Medicaid coverage, the Department is conflating time in the ACC with time
covered by health insurance. This possibility is bolstered by the fact that the results are aligned with
existing literature on the increased use of diagnostic tests and the ER when individuals gain
Medicaid coverage. 16 Sarah Taubman et.al. found a significant increase in ER use among
individuals in Oregon who were randomly assigned to Medicaid coverage. Further, they found this
increase was concentrated in visits that did not result in a hospital admission.17
16 http://www.nejm.org/doi/full/10.1056/NEJMsa1212321 17 http://www.sciencemag.org/content/343/6168/263.full.pdf?keytype=ref&siteid=sci&ijkey=GoMYHyTTSQ4.Q
Department of Health Care Policy and Financing November 1, 2015
Legislative Request for Information #7 Page 26
Evidence from California suggests that increased health service use among newly enrolled Medicaid
beneficiaries may decline after the first full year of enrollment, especially in programs that, like the
ACC, include assignment to medical homes and elements of care coordination.18 Further, the ACC
is taking active steps to help combat unnecessary ER utilization among the expansion population,
including adding the expansion population to the target population for the program’s KPIs in FY
2015-16. This means that the quarterly performance payments to the RCCOs and PCMPs will be
tied to their performance for this population. Until recently, the Department lacked the historical
claims data necessary to develop performance targets among this population.
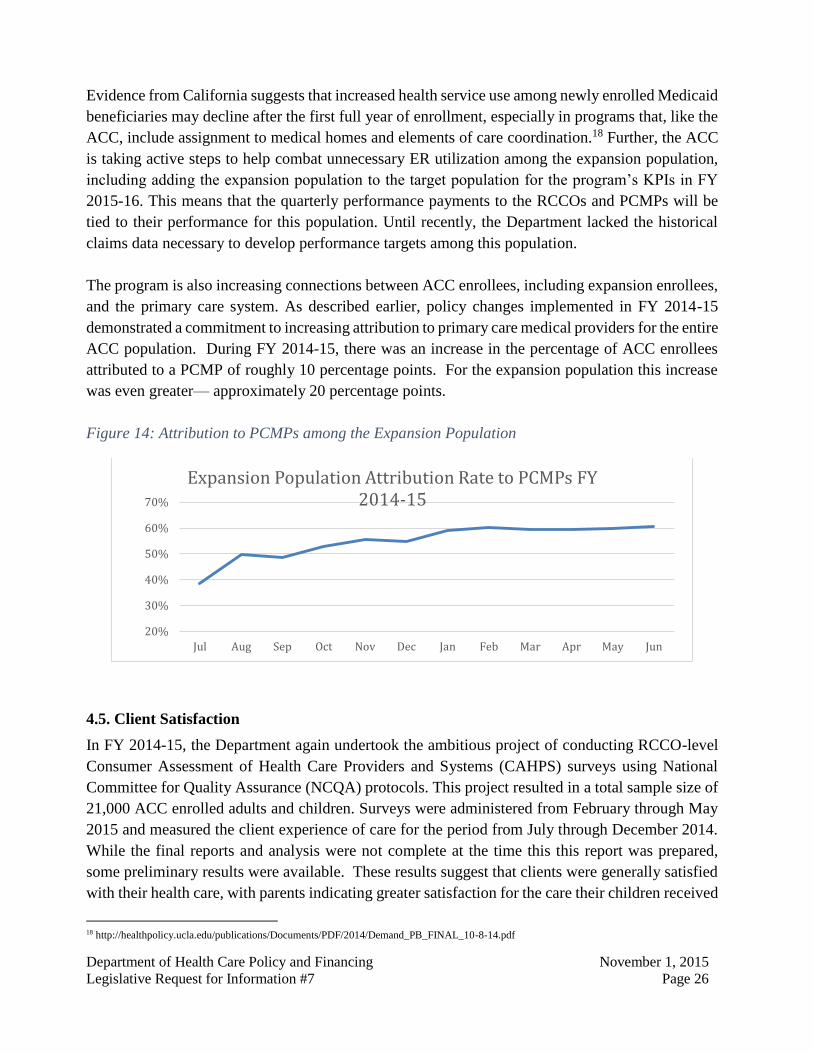
The program is also increasing connections between ACC enrollees, including expansion enrollees,
and the primary care system. As described earlier, policy changes implemented in FY 2014-15
demonstrated a commitment to increasing attribution to primary care medical providers for the entire
ACC population. During FY 2014-15, there was an increase in the percentage of ACC enrollees
attributed to a PCMP of roughly 10 percentage points. For the expansion population this increase
was even greater— approximately 20 percentage points.
Figure 14: Attribution to PCMPs among the Expansion Population
4.5. Client Satisfaction
In FY 2014-15, the Department again undertook the ambitious project of conducting RCCO-level
Consumer Assessment of Health Care Providers and Systems (CAHPS) surveys using National
Committee for Quality Assurance (NCQA) protocols. This project resulted in a total sample size of
21,000 ACC enrolled adults and children. Surveys were administered from February through May
2015 and measured the client experience of care for the period from July through December 2014.
While the final reports and analysis were not complete at the time this this report was prepared,
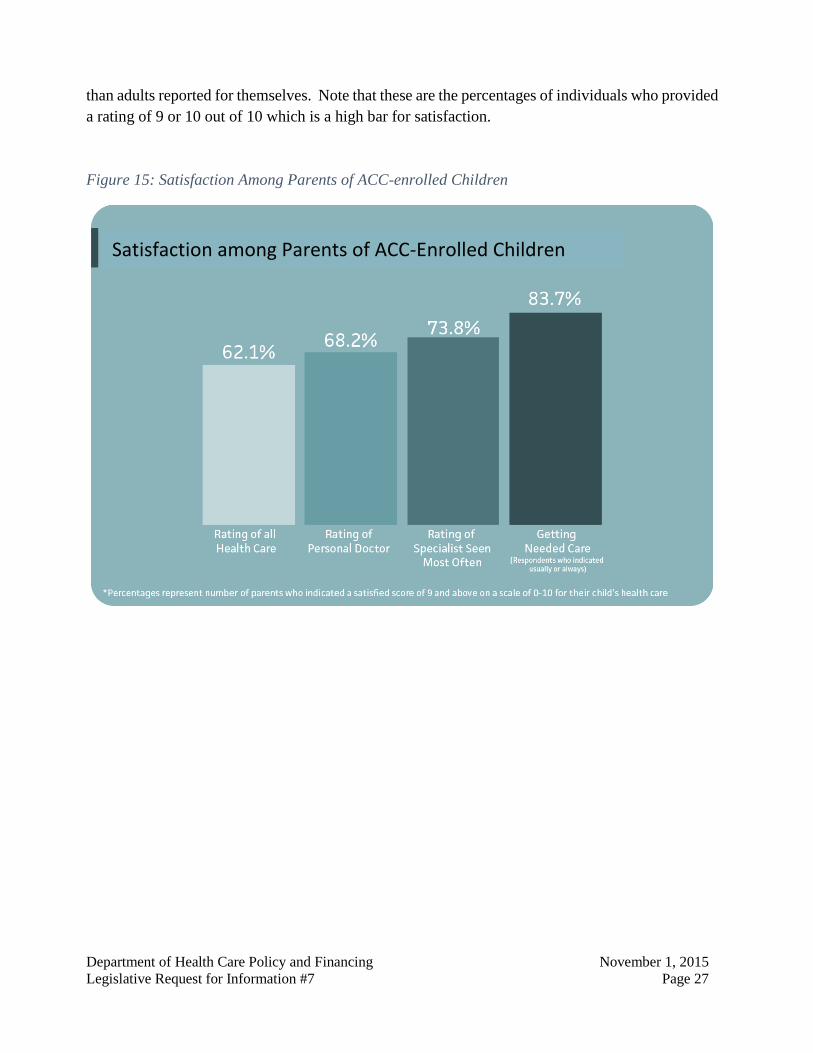
some preliminary results were available. These results suggest that clients were generally satisfied
with their health care, with parents indicating greater satisfaction for the care their children received
18 http://healthpolicy.ucla.edu/publications/Documents/PDF/2014/Demand_PB_FINAL_10-8-14.pdf
20%
30%
40%
50%
60%
70%
Jul Aug Sep Oct Nov Dec Jan Feb Mar Apr May Jun
Expansion Population Attribution Rate to PCMPs FY 2014-15
Department of Health Care Policy and Financing November 1, 2015
Legislative Request for Information #7 Page 27
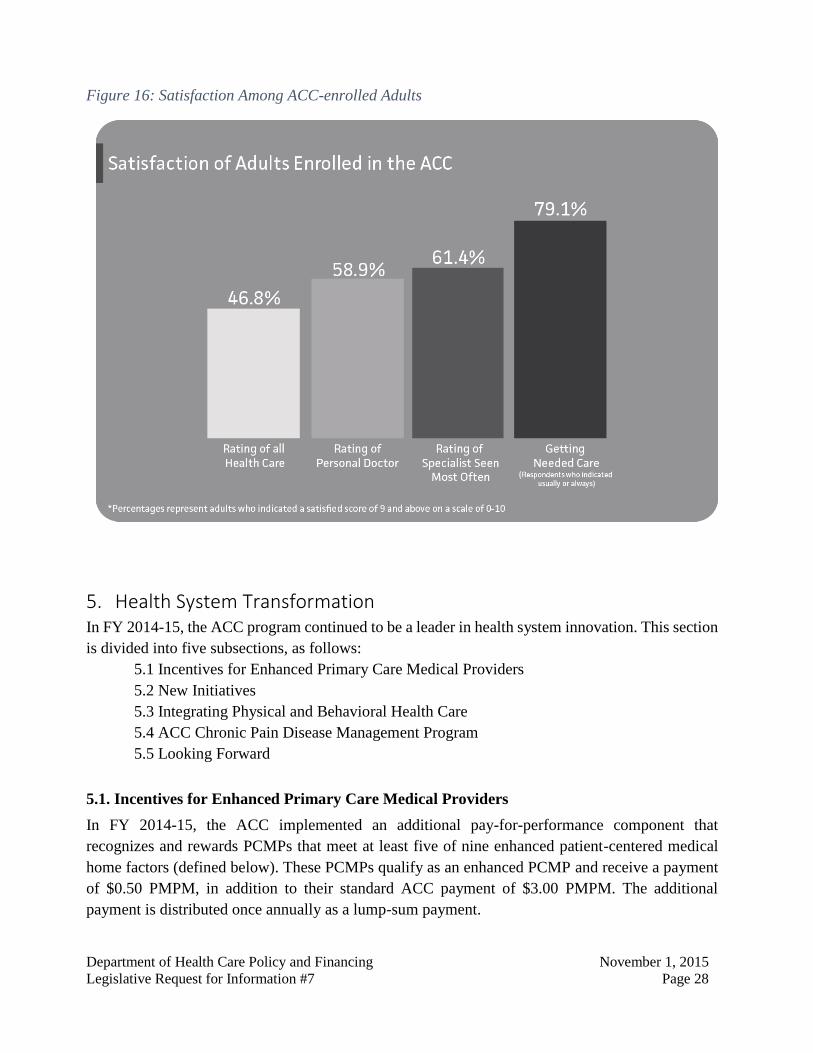
than adults reported for themselves. Note that these are the percentages of individuals who provided
a rating of 9 or 10 out of 10 which is a high bar for satisfaction.
Figure 15: Satisfaction Among Parents of ACC-enrolled Children
Satisfaction among Parents of ACC-Enrolled Children
Department of Health Care Policy and Financing November 1, 2015
Legislative Request for Information #7 Page 28
Figure 16: Satisfaction Among ACC-enrolled Adults
5. Health System Transformation In FY 2014-15, the ACC program continued to be a leader in health system innovation. This section
is divided into five subsections, as follows:
5.1 Incentives for Enhanced Primary Care Medical Providers
5.2 New Initiatives
5.3 Integrating Physical and Behavioral Health Care
5.4 ACC Chronic Pain Disease Management Program
5.5 Looking Forward
5.1. Incentives for Enhanced Primary Care Medical Providers
In FY 2014-15, the ACC implemented an additional pay-for-performance component that
recognizes and rewards PCMPs that meet at least five of nine enhanced patient-centered medical
home factors (defined below). These PCMPs qualify as an enhanced PCMP and receive a payment
of $0.50 PMPM, in addition to their standard ACC payment of $3.00 PMPM. The additional
payment is distributed once annually as a lump-sum payment.
Department of Health Care Policy and Financing November 1, 2015
Legislative Request for Information #7 Page 29
The nine enhanced primary medical home factors are based on the medical home standards from
National Committee on Quality Assurance, recommendations from the RCCOs and other
stakeholders, and Colorado Senate Bill 07-130, which defined the criteria for medical homes for
children. They are:
1. Extended Hours. Has regularly scheduled appointments (at least once per month) on a
weekend and/or a weekday outside of typical workday hours.
2. Timely Clinical Advice. Provides timely clinical advice by telephone or secure electronic
message both during and after office hours. Patients and families are clearly informed about
these procedures.
3. Data Use and Population Health. Uses available data to identify special patient populations
that may require extra services and support for medical and/or social reasons. The practice
has procedures to proactively address the identified health needs.
4. Behavioral Health Integration. Provides on-site access to behavioral health care providers.
5. Behavioral Health and Developmental Screening. Collects and regularly updates a
behavioral health screening (including substance use) for adults and adolescents, and/or
developmental screening for children (newborn to five years of age) using a Medicaid
approved tool. In addition, the practice has documented procedures to address positive
screens and has established relationships with providers to accept referred patients or utilizes
the standard referral and release form created by the behavioral health organizations.
6. Patient Registry. Generates a list of patients actively receiving care coordination.
7. Specialty Care Follow-Up. Tracks the status of referrals to specialty care providers and
provides the clinical reason for the referral along with pertinent clinical information.
8. Consistent Medicaid Provider. Accepts new Medicaid clients for the majority of the year.
9. Patient-Centered Care Plans. Collaborates with the patient, family or caregiver to develop
and update an individual care plan.
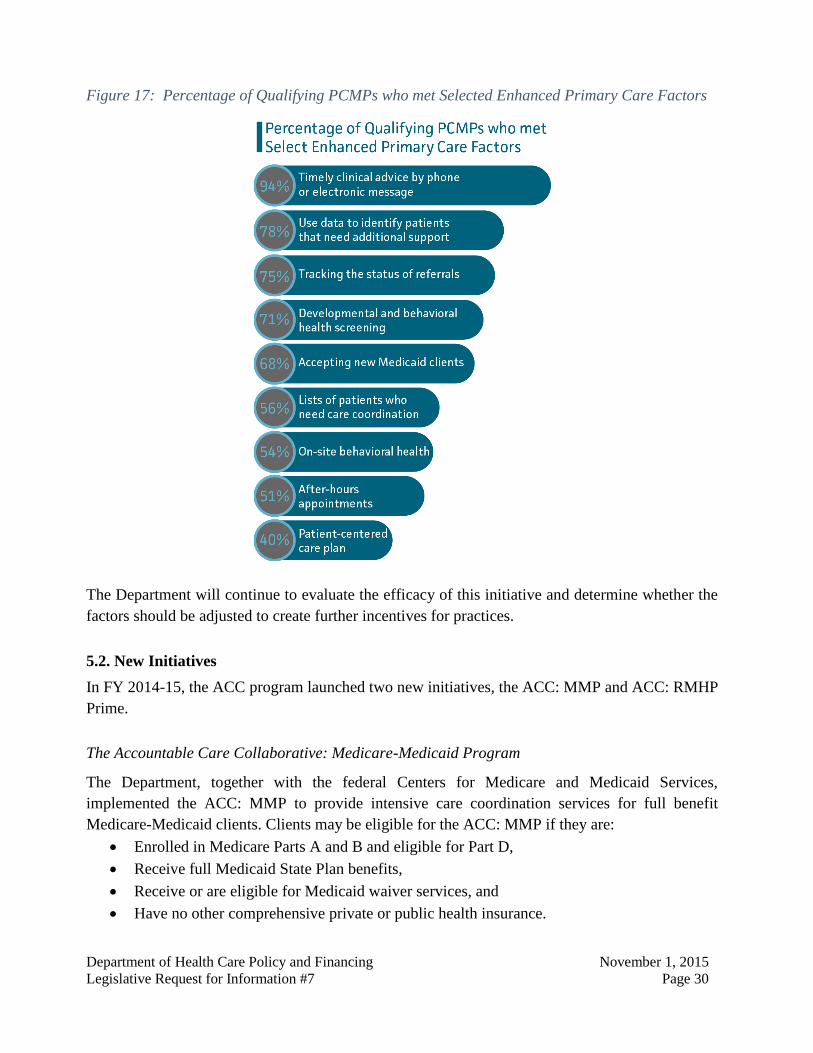
In FY 2014-15, RCCOs worked with PCMPs around the state to assess which practices met the
factors; about half of all PCMPs (265 practice sites) were validated as meeting the standards for
enhanced payment. These practices served over 500,000 ACC clients. About half of the qualifying
practices met the minimum number of factors (five) while 3% met all nine. Figure 17, on the
following page, shows what percentage of the qualifying PCMPs met each factor.
Department of Health Care Policy and Financing November 1, 2015
Legislative Request for Information #7 Page 30
Figure 17: Percentage of Qualifying PCMPs who met Selected Enhanced Primary Care Factors
The Department will continue to evaluate the efficacy of this initiative and determine whether the
factors should be adjusted to create further incentives for practices.
5.2. New Initiatives
In FY 2014-15, the ACC program launched two new initiatives, the ACC: MMP and ACC: RMHP
Prime.
The Accountable Care Collaborative: Medicare-Medicaid Program
The Department, together with the federal Centers for Medicare and Medicaid Services,
implemented the ACC: MMP to provide intensive care coordination services for full benefit
Medicare-Medicaid clients. Clients may be eligible for the ACC: MMP if they are:
Enrolled in Medicare Parts A and B and eligible for Part D,
Receive full Medicaid State Plan benefits,
Receive or are eligible for Medicaid waiver services, and
Have no other comprehensive private or public health insurance.
Department of Health Care Policy and Financing November 1, 2015
Legislative Request for Information #7 Page 31
Clients who receive both Medicare and Medicaid rely almost entirely on government programs to
help meet their health needs. Before this program, there were approximately 32,000 Coloradans who
were full benefit Medicare-Medicaid enrollees who were not in any integrated system of care.
Clients who participate in the ACC: MMP retain their Medicare and Medicaid benefits and services.
They also have the right to keep the same doctors and other health care providers.
A significant proportion of these clients have multiple chronic conditions and face limitations such
as cognitive impairments, low literacy, and face housing isolation. Compared to Medicaid recipients
not receiving Medicare benefits, they generally require a higher level of care but face more barriers
to receiving the right services at the right time and place. The system serving Medicare-Medicaid
enrollees is fragmented, which can result in unnecessary and duplicative services. The ACC: MMP
gives the Department an opportunity to better meet the needs of Medicare-Medicaid enrollees in
Colorado by helping reduce barriers to appropriate care. A new study by the RAND Corporation
measured the association between care coordination and health care utilization. It concluded that for
Medicare beneficiaries with diabetes and congestive heart failure or emphysema, improved care
coordination is associated with fewer hospitalizations, fewer complications and lower costs.19 The
conflicting coverage policies and incentives of Medicare and Medicaid are a major challenge to
improving the health of Medicare-Medicaid enrollees. One of the tools used in the program is a
Service Coordination Plan (SCP). The SCP is a tool that will help coordinate client care across
providers. It documents medical, social, and behavioral needs, and client short-term and long-term
goals. It is completed with the client and promotes client-centered care.
As of June 2015, 27,583 clients were enrolled in the ACC: MMP program.
ACC: Rocky Mountain Health Plans (RMHP) Prime
The ACC: RMHP Prime program has just concluded its first year of operation. The program,
established under the authority provided by HB 12-1281, is using alternative payment arrangements
and shared savings with Rocky Mountain Health Plans’ primary care provider network and
community partners to improve the integration and coordination of care for ACC clients. During FY
2014-15 enrollment surpassed initial projections by roughly 6,500 enrollees and nearly 34,000
clients were enrolled as of June 2015. Complete quality data is still forthcoming, but initial findings
demonstrate some early success. The program’s unique payment methodology has positively
impacted the level of collaboration between diverse provider types and community organizations.
The model has also furthered practice transformation efforts and increased the integration of
behavioral health in primary care. In FY 2015-16, the program will work to further strengthen
collaboration between community partners and examine the long-term sustainability of the model.
19 Hussey, PS. et al. “Continuity and the Costs of Care for Chronic Disease” JAMA. May, 2014; 174
Department of Health Care Policy and Financing November 1, 2015
Legislative Request for Information #7 Page 32
Additional information on ACC: RMHP Prime is available in the Department of Health Care Policy
and Financing’s report on the Medicaid Payment Reform and Innovation Pilot Program required
by Section 25.5-5-415 (4)(a)(III), C.R.S. This report is available on the Colorado General
Assembly’s website. Statutory authorization for the RMHP Prime program expires June 30, 2016.
5.3. Integrating Physical and Behavioral Health Care
A significant share of total health costs and population health outcomes is attributable to behavior,
decision-making, and substance use. Therefore, the integration of behavioral health services into an
accountable system of care is of primary importance. To support these health system transformation
efforts, in FY 2014-15 the ACC:
Allowed integrated Community Mental Health Centers to apply to be PCMPs within the
ACC. Prior to doing this, the Department worked with the Colorado Behavioral Healthcare
Council to develop a process for integrated physical health clinics located inside Community
Mental Health Centers to bill Medicaid for the physical health services provided at those
locations;
Implemented the ACC: RMHP Prime program which includes additional payments to
PCMPs in advanced practices for the employment of behavioral health providers on
comprehensive care teams. During FY 2014-15, three sites received global, monthly
payments to support integrated behavioral health providers within their practice. Clients
using these advanced PCMPs have direct access to behavioral health services in the course
of routine visits. In FY 2015-16, seven more practices will add integrated behavioral health
services using this model. Further, the innovative payment model has allowed Community
Mental Health Centers to contract, alongside the PCMPs, with RMHP to implement an
aligned gainsharing arrangement. In the event that savings are achieved across the entire
global budget for services, and quality targets are achieved, the Community Mental Health
Centers are eligible for a 30% share of total financial gains.
This work will continue into FY 2015-16 and beyond, with a particular focus on continued
alignment with the work of the Colorado State Innovation Model.
5.4. ACC Chronic Pain Disease Management Program
In March 2015, the ACC program implemented the Chronic Pain Disease Management Program to
improve the health of clients with chronic conditions and address rising rates of prescription abuse
in Colorado. Modeled after the Project ECHO® programs developed by the University of New
Mexico, the program uses private interactive video technology to connect PCMPs to a team of
specialists with expertise in a variety of pain management disciplines. The Program promotes the
use of evidence-based pain management practices and supports PCMPs in treating clients with
chronic pain within their primary care practice. Connecting providers through interactive video
allows any PCMP to participate, even if they are located great distances from the nearest specialist.
Department of Health Care Policy and Financing November 1, 2015
Legislative Request for Information #7 Page 33
Through the program, PCMPs are able to more effectively manage care for chronic pain conditions
and clients can remain in their medical home to receive care.
The program is being well received; nearly 40 clinic sites and more than 80 total providers have
participated in the program. Approximately 85% of the providers are primary care providers, and
approximately 15% are behavioral health providers that are collaborating with primary care
providers. Nearly 40% of the practice sites are outside of the Front Range area. The Department is
currently working with the University of Colorado to develop other similar programs that use the
Project ECHO® model to manage other diseases and conditions in the primary care setting.
5.5. Looking Forward
The next phase of the ACC program begins in July 2017 when new contracts for the regional
accountable entities go into effect. In April 2015, the Department announced that the administrative
functions the RCCOs and Behavioral Health Organizations will be integrated into a single regional
accountable entity in each of seven state regions. This will simplify interaction with the program for
both providers and clients and help to avoid duplicative contract requirements. The new regional
map will align largely with the current RCCO regions, with the exception of Elbert County, which
will switch from Region 7 to Region 3.
As the ACC evolves, it will continue to build on the successes of the program’s first four years. The
ACC was designed with a long-term vision in mind, and the understanding that delivery system
change must be iterative to keep up with an evolving health care system. The program has shown
its ability to innovate to improve client outcomes and reduce health care costs, and is well-poised to
continue to do so in the future.
Department of Health Care Policy and Financing November 1, 2015
Legislative Request for Information #7 Page 34
Appendix A:
Technical Documentation for Total Cost of Care
The goal of the counterfactual estimation technique is to compare actual observed costs under the
ACC to a hypothetical benchmark of costs in the absence of the ACC. This method is widely used
throughout the healthcare industry to estimate the impact of care management programs on the
total cost of care. Counterfactual estimation relies heavily on risk adjustment to render different
populations commensurable and on the ability to predict changes in utilization patterns.
Furthermore, counterfactual estimation does not account for time-invariant factors such as patient
preferences that could contribute to different pre-period costs for the enrolled and non-enrolled
groups. Because the counterfactual method does not control for time invariant factors beyond
health status, it is possible that differences in pre-period costs were calculated as savings.
Counterfactual estimation is the Department’s preferred approach because the widespread
adoption of the ACC means that there is no truly comparable population in Colorado Medicaid
against which to compare costs.
It is important to note that while similar, this counterfactual estimation technique differs from
method the Department anticipates using for its shared savings initiatives. In estimating the impact
of the ACC on the total cost of care, the Department is comparing actual observed performance to
a hypothetical baseline that would only exist without the ACC. The shared savings initiatives,
however, attempt to measure incremental improvements at the RCCO level, within the broader
context of the ACC.
Comparable Cohorts
In order to accurately estimate the impact of the ACC on total cost of care, it is necessary to divide
the enrolled population into similar groups. Each group of clients is expected to have similar
characteristics and health need and therefore similar costs. Furthermore, such a subdivision allows
more finely-tuned hypothetical growth rates to be applied to the benchmark cost for each group.
Groups were defined in the following way:
1. Clients are grouped into four distinct categories based on their age disability status, and
eligibility type. These four groups are:
Non-Disabled Children
Non-Disabled Parents and Caretakers below 68% FPL
Non-Disabled ACA Expansion Adults, Parents, and Caretakers
Disabled Adults and Children
Department of Health Care Policy and Financing November 1, 2015
Legislative Request for Information #7 Page 35
2. Clients are separated into the seven RCCO regions based on their county of residence. Each
of the three eligibility types above is separated into seven distinct groups, one for each
region.
3. Clients are separated into groups based on the month they were enrolled in the ACC
Program. Clients are enrolled on the first of each month. The months during FY 2013-14
are considered for this analysis. For each of the 28 distinct groups above (4 population
groups and 7 regions within each), clients are separated into enrolled or non-enrolled
groups for each of the 12 months during FY 2013-14.
Risk Adjustment
The advantage of establishing groups of clients with very similar diagnoses and severity of illness
is that the clients in each group will share similar health and cost expectations for the future.
Risk adjustment allows for the comparison of different groups of clients by normalizing for
differences in health status. A certain group of clients may be more expensive than another group,
but the first group may also be less healthy and require more health care services. A risk score is
a measurement of the relative health status of a group of clients compared to the health status of
the entire population. The risk score for the entire population is set to 1.0 and is based on the
average cost of the entire population. The risk score for a group of clients is established by
summing the total cost PMPM for the group and dividing by the total cost PMPM for the entire
population. This method relies on the assumption that sicker clients require more expensive care
on average.
In general, differences in health status are normalized by dividing the total average cost for a group
of clients by the average risk score for the group. Once risk has been normalized it is possible to
consider which group was more expensive on average, without potentially confounding factors
like differences in health status.
The risk adjustment methodology used to control for differences in health status is Clinical Risk
Groups (CRGs) developed by 3M. This methodology groups clients into similar subpopulations
based on diagnosis codes and procedure codes. Further refinement of each group is accomplished
by considering the relative severity of illness and risk of mortality for each of the members in a
given subpopulation. Risk scores are calculated using 3 years of historical claims data. Scores are
calculated separately for disabled and non-disabled populations.
Growth Rates
Counterfactual estimation relies heavily on the use of accurate growth rates to estimate a
benchmark in the absence of a comparison population. Using claims data from FY 2010-11 and
FY 2011-12, the Department’s actuary created population- and RCCO-level estimated growth
rates for the entire ACC-eligible Colorado Medicaid population. The actuary normalized the data
using the CRG methodology described above, adjusted the data to account for services that were
incurred but not reported (IBNR), and abstracted out program changes not related to the ACC.
This analysis allowed for an estimate rate of change for each population within each RCCO in all
Department of Health Care Policy and Financing November 1, 2015
Legislative Request for Information #7 Page 36
of 21 distinct services lines. Population-wide, these estimates indicate that medical expenditures
for the entire ACC-eligible population would have grown approximately 6.30% in FY 2013-14
and 3.95% in FY2014-15 in the absence of the ACC.
To avoid an overstatement of savings due to factors that the Department cannot control for in the
analysis, the Department chose a growth rate at the midpoint of actual growth rates and the
actuary's estimates. This results in a more conservative estimate of savings that acknowledges that
the Department has implemented multiple cost savings efforts in addition to the ACC since the
benchmark period.
Counterfactual Estimation
The counterfactual estimation technique relies heavily on both risk adjustment described above
and on accurate predictions of cost trends in the absence of the ACC. Two different counterfactual
benchmarks are applied to arrive at the estimate range of $98 million to $121 million of gross
savings. In general, savings estimates are developed by comparing actual, risk-adjusted costs to a
benchmark cost. The Department used two primary methods to estimate the impact of the ACC on
total cost of care.
First, the Department derived a population-wide estimate of $27.62 PMPM saved, taken from
analysis supporting the FY2013-14 annual report impact estimate. This variation of counterfactual
estimation relies on the existence of a comparison population. The initial results from the FY 2013-
14 comparison ($29.07 PMPM saved) were assumed to be reduced as more clients are enrolled in
the ACC. Multiplying this number by average monthly program enrollment yields approximately
$98 million of gross savings.
Second, the Department derived separate benchmark PMPMs for each of the 28 cohorts identified
above (4 eligibility types and 7 RCCOs). These benchmarks were then trended forward using
service line-, population-, and RCCO-level growth rates described above. These growth rates
account for other non-ACC Department initiatives. As a result, estimates calculated using these
growth rates are expected to reflect the impact of the ACC apart from other cost containment
efforts the Department has undertaken in recent years. The difference between these benchmarks
and actual observed costs varies for each population and RCCO, but on average the ACC saved
$215 per disabled adult or child per month and $16 per ACA-expansion adult per month. In
addition, the ACC invested an additional $2 per non-disabled previously-eligible adult per month
and $2 per non-disabled child per month. The population-wide weighted average for all groups is
$35 PMPM saved. In total, this method estimates $121 million of gross savings.