response time performance - The University of Sheffield/file/MCRU... · Response time performance...
89
1 Final report May 2006 THE COSTS AND BENEFITS OF CHANGING AMBULANCE SERVICE RESPONSE TIME PERFORMANCE STANDARDS Janette Turner Colin O’Keeffe Simon Dixon Kate Warren Jon Nicholl with the assistance of Brigitte Colwell Medical Care Research Unit School of Health and Related Research University of Sheffield Regent Court 30 Regent Street SHEFFIELD S1 4DA Tel: 0114 2225202 Fax: 0114 2220749
Transcript of response time performance - The University of Sheffield/file/MCRU... · Response time performance...

1
Final report May 2006
THE COSTS AND BENEFITS OF
CHANGING AMBULANCE SERVICE
RESPONSE TIME PERFORMANCE STANDARDS Janette Turner Colin O’Keeffe Simon Dixon Kate Warren Jon Nicholl with the assistance of Brigitte Colwell Medical Care Research Unit School of Health and Related Research University of Sheffield Regent Court 30 Regent Street SHEFFIELD S1 4DA Tel: 0114 2225202 Fax: 0114 2220749

2
CONTENTS
Page EXECUTVE SUMMARY 1 1. INTRODUCTION 3 1.1 Background 3 1.2 Call prioritisation 4 1.3 Study aims and objectives 5 2. METHODS 7 2.1 Overview 7 2.2 Areas included in the study 7 2.3 Approval for the study 8 2.4 Data collection 9 2.5 Information recorded 10 2.6 Additional follow up of patients who died or were lost to hospital follow up 12 3. RESULTS – DESCRIPTION OF CASES 14 3.1 Introduction 14 3.2 Characteristics and clinical casemix 14 4. RESULTS - RESPONSE TIME PERFORMANCE 23 4.1 Service Developments 23 4.2 Changes in response time performance 25 5. RESULTS – OUTCOMES 30 6. RESULTS - RESPONSE TIMES AND SURVIVAL 33 6.1 Methods 33 6.2 Number of cases 35 6.3 Factors associated with outcome 35 6.4 Crude mortality 37 6.5 Intended service analysis 38 6.6 Service received analysis 41 7. RESULTS - CLINICAL GROUPS AND OTHER OUTCOMES 44 7.1 Introduction 44 7.2 All clinical groups 44 7.3 Out-of-hospital cardiac arrest 45 7.4 Ruptured aortic aneurysms and other serious haemorrhage 50 7.5 Trauma 50 7.6 Summary 51 8. ECONOMIC EVALUATION 52 8.1 Case studies 52 8.2 National survey of costs and response times 55 8.3 Patient-level costing of hospital care 57 8.4 Discussion and conclusions 57 9. DISCUSSION AND CONCLUSIONS 68 REFERENCES 76 APPENDIX 1 The Acceptability of Emergency Medical Dispatch (EMD) systems to 999 callers 78 APPENDIX 2 AMPDS and CBD codes used for case identification 83

3
TABLES
Page 2.1 Ambulance service areas included in the study 8 2.2 All A calls and included A calls by study year 10 2.3 Proportion of patient report forms found by study year 11 3.1 Numbers of all included cases by year and service 14 3.2 Characteristics of all patients included in the study 15 3.3 Category A call groups by study year and service 16 3.4 Characteristics of cases followed up and not followed up 17 3.5 Clinical casemix of all included cases 18 3.6 Clinical casemix in each study year 19 3.7 Clinical casemix in each service 20 3.8 Comparison of ORCON A categorisation and confirmed clinical condition 22 4.1 Major developments at 4 study sites over 6 years 24 4.2 Change in Mean response time over 5 years for all calls, transported to hospital and left at scene 26 4.3 Change in Mean response time in 4 services for all calls, transported to hospital and left at scene 26 4.4 Median time to definitive care over 5 years 29 5.1 Outcomes for all included cases 30 5.2 Patient outcomes for each study year 31 5.3 Patient outcomes for each study service 32 6.1 Numbers included in the outcomes study 35 6.2 Association between characteristics and odds of death before discharge 36 6.3 Estimated change in odds of dying per year 39 7.1 Effect of slow response on survival by clinical group 45 7.2 Clinical diagnosis of out-of-hospital cardiac arrests 46 7.3 Survival by whether the arrest was witnessed by the crew 47 7.4 Survival by presenting rhythm 46 7.5 Bystander CPR 48 7.6 Bystander CPR in patients found in VF 48 7.7 Odds of survival in OHCA 50 8.1 Service developments in Service 1 aimed at improving response times in the year April 1997 to March 1998 58 8.2 Service developments in Service 1 aimed at improving response times
in the year April 1998 to March 2000 59 8.3 Service developments in Service 2 aimed at improving response times
in the year April 1997 to March 1998 60 8.4 Service developments in Service 2 aimed at improving response times
in the year April 1998 to March 2000 61 8.5 Service developments in Service 3 aimed at improving response times
in the year April 1997 to March 1998 62 8.6 Service developments in Service 3 aimed at improving response times
in the year April 1998 to March 2000 63 8.7 Service developments in Service 4 aimed at improving response times
in the year April 1997 to March 1998 64 8.8 Service developments in Service 4 aimed at improving response times
in the year April 1998 to March 2000 65 8.9 Response time, cost and activity trends over time 66 8.10 Models of cost per case 67

4
FIGURES
Page 3.1 Age and sex distribution of included cases 15 4.1 Percentage of responses recorded as ≤ 8 minutes - all calls 25 4.2. Percentage of responses within 8 minutes - calls where a patient is transported to hospital 26 4.3 Response time distribution for each study service, based on rounding to the nearest minute 28 4.4 Median time to definitive care over 5 years 29 6.1. Proportion of patients dying by year 37 6.2. Proportion of patients dying before discharge by year and service 38 6.3 SMR (and 95% confidence interval) by year for all services 40 6.4 SMR and response performance by year 40 6.5 SMRs by service and year 40 6.6 SMR and response time performance in services 2, 3, and 4 by year 40 6.7 Death before discharge by response time (rounded to nearest minute 1 =0–1.49) 41 6.8 SMR adjusted for characteristics by response time 42 6.9 SMR adjusted for despatch code as well as other characteristics by response time 43 7.1 Time of day of call for cardiac arrests 46 7.1 Survival in OHCA by response time 49 7.2 Survival in OHCA of patients in VF, by response time 49 7.3 Survival of OHCA patients found in VF who had bystander CPR by response time 49

1
EXECUTIVE SUMMARY
Following a review of ambulance service performance targets in 1995, new targets based on
the clinical priority of 999 calls were introduced. Priority despatch systems for ambulance
deployment were introduced in 1997, and by 2001 Ambulance Services were expected to
achieve 75% of responses from call to a crew arriving on scene within 8 minutes for life-
threatening (category A) calls. In order to examine the effects of these targets we have
evaluated service changes, response times and survival outcomes in four ambulance
services during the five years from 1997-2001.
We have examined 17,950 responses to patients at the scene following category A calls in
which the patient was reported as unconscious or not breathing or with acute chest pain.
The main findings from this study were
1. Services made many changes to their operations in order to improve response to
achieve the targets including for example developing new resources, better
communications, and dynamic deployment.
2 During this period the proportion of responses achieved in less than or equal to 8
minutes increased by a smaller amount than expected, from 47.0% to 60.2%.
3. A total of 14,993 patients were successfully followed up. These patients were elderly
(mean age 57) and predominantly male (59%). The largest single clinical group were
patients with cardiac conditions which made up over a quarter of the cases.
4. The identification of life-threatening incidents was poor with over 40% of patients not
needing admission to hospital.
5. Excluding patients who were not taken to A and E, as well as patients who were dead
at the scene on the arrival of the crew, there were 12,521 patients in whom the effect
of response time on outcome was studied. In year 1 16.3% of these patients died
before discharge; in year 5 16.7%.
Taking into account characteristics such as age, time of day, clinical condition and
ambulance service, there was no evidence of any change in outcome over the five
years of the study. This was not unexpected given the small and patchy
improvements in response times achieved.
6. We have therefore also examined the relationship between individual response times
and outcomes.
For all patients together there was no reliable evidence of an improvement in
outcome with faster response, and we estimate that the odds of dying were only 1.4%
less with responses ≤ 8 minutes compared to responses over 8 minutes.

2
7. We did find a statistically significant improvement in the odds of surviving to hospital
admission, especially when response times were very short (less than or equal to 4
minutes).
8. We also found benefits in out-of-hospital cardiac arrest. Out of 1154 out-of-hospital
arrests which had a cardiac origin and which weren’t witnessed by ambulance crews,
19 (1.8%) survived. However, the estimated odds of surviving to discharge increased
by 19% for each minute reduction in response time.
9. We couldn’t find any benefit in other groups such as trauma, serious haemorrhage, or
asphyxiation.
10. An economic evaluation estimated that it cost Ambulance Services £37,000 pa. for
each percentage improvement in terms of the 8 minute response time target. We
have not tried to calculate the cost-effectiveness of response time improvements
because of very great uncertainties over the estimates of both costs and benefits, and
because response times are substantially better now which will affect the cost of
further improvements.
Conclusions
Our results closely replicate those found in contemporary studies in the US. Overall, rapid
response in terms of an 8 minute target makes no discernible difference to survival to
discharge. Nevertheless, we also know there are benefits – for the survival of a small number
of out-of-hospital cardiac arrests, and in the short term in reducing levels of anxiety, pain and
distress. Thus for a given level of resources response times clearly need to be minimised.
However, given that Ambulance Services are now responding to 75% of category A calls
within 8 minutes, our results point to the conclusion that further developments in Ambulance
Service performance should be focused on better targeting and better clinical care rather than
further response time improvements.
3
1. INTRODUCTION
1.1 Background
Response time performance has been used as an indicator of ambulance service quality for
many years. Standards for performance have been in place in England since 1974. These
standards specified that 50% of all calls should be responded to within 8 minutes and 95%
within 14 minutes in urban services and 19 minutes in rural services.
The standards applied to all calls regardless of clinical urgency. However, the rationale for
using response time as a performance standard is based in research evidence on the
relationship between time and patient outcome for very specific clinical conditions,
predominately out of hospital cardiac arrest.
Survival from sudden cardiac arrest is dependent on a number of key factors1:
• Early recognition and access to treatment
• Early cardiopulmonary resuscitation (CPR)
• Early defibrillation
• Early advanced cardiac care
The development of Emergency Medical Systems, portable defibrillators and pre-hospital
personnel with advanced life support skills have moved these principles from the hospital to
pre-hospital settings2.
There is an extensive international literature on the impact of pre-hospital care on survival
from out of hospital cardiac arrest that has supported these principles. Highest survival to
discharge from hospital rates are documented in cases of arrest that are witnessed, where
there is bystander CPR and where the presenting rhythm is ventricular fibrillation (VF)
although survival rates widely differ from 26% in one US city3 9% in Amsterdam4, 6.7% in
Italy5 6% in Scotland6 and 2% in Canada7 and England8. One study in Sweden identified 6
factors for increasing chance of survival. These were initial rhythm, delay to arrival of the
rescue team, place of arrest, witnessed status, bystander CPR and age. Survival to one
month was 0.4% if none of these factors were present and 23.8% if all were present9.
The relationship between time and outcome is also well documented. A number of studies
have shown a linear inverse relationship between delay in resuscitation and survival1.
Defibrillation of VF arrests is associated with the highest survival and delay of only a few
minutes without CPR is sufficient for reversible VF arrest to proceed to irreversible asytstole9.
Ambulance service response time is also a related factor. In one Scottish study shorter
response time was significantly associated with increased probability of receiving early
defibrillation and subsequent survival6. An Australian study demonstrated an inverse
association between ambulance response time and survival10. A Canadian study examining
4
the relationship between time of defibrillation and survival from out of hospital cardiac arrest
found a steep decrease in the first 5 minutes of the survival curve with the odds of survival
decreasing by 0.77 for each minute of increasing response interval and suggested that
standards for response intervals would produce additional survivors for every minute
reduction11. A number of studies have also reported improvements in survival when the
cardiac arrest is witnessed by EMS personnel5,9,10 supporting the concept of rapid EMS
response.
Survival from out of hospital cardiac arrest is dependent on treatment within a very short time
frame – it is generally accepted that all people who collapse and are without a pulse for
beyond 12 minutes with no intervention are unsalvageable. A priority then for emergency
medical services is to target these cases and provide a rapid response.
In view of this evidence and concerns that clinical need was not reflected in ambulance
service performance standards, in 1995 the Department of Health set up a steering group to
review the ambulance service response time standards12 (the ORCON review group). The
group recommended that response to emergency calls should be prioritised according to the
urgency and seriousness of the patient’s condition on the assumption that a faster response
to life-threatening emergencies could lead to an increase in the number of lives saved. The
review group recommended three levels of response:
1. Category A - Life-threatening emergencies of which 90% should be responded to
within 8 minutes
2. Category B - Serious conditions which should receive the same response as current
standards (95% within 14/19 minutes)
3. Category C - An unspecified but appropriate response for calls with no immediate
clinical need.
In the short term, two levels of response time standards were introduced - Category A calls
with a target of 75% responded to within 8 minutes and category B+C which retained the
previous standard of 95% within 14 or 19 minutes. Ambulance services were set a target to
achieve these new standards by 2001.
1.2 Call prioritisation
The introduction of tiered standards means that some form of sorting or prioritisation of
emergency calls is required. At around the same time of the response time standard review,
UK ambulance services were beginning to introduce priority dispatch systems into their
control centres. The purpose of these systems is to enable the rapid identification of life-
threatening calls which require the fastest response and consequently deploy resources on
the basis of clinical need.

5
Two systems, both developed in the USA, were introduced: Advanced Medical Priority
Dispatch System (AMPDS) and Criteria Based Dispatch (CBD). Both systems use structured
protocols that allow trained Emergency Medical Dispatchers (EMDs) to assess 999 calls and
categorise them to different levels of urgency. Although there are some differences between
the two systems the key processes are the same. These are:
1. An initial assessment that gathers information on patient details (name, age,
location), key questions on clinical condition (to establish if the patient is conscious
and/or breathing) and the presenting problem (chief complaint).
2. Further interrogation about the presenting problem using assessment protocols or
guidelines for different clinical conditions or incident types. At the end of the process
a dispatch code is assigned which reflects condition and urgency. Condition (or
incident type) is indicated by the final category number and urgency is graded at four
levels for AMPDS and 3 levels for CBD. These levels are based on the requirement
for level of response (Advanced or Basic Life Support) and speed (lights and sirens or
not).
3. The EMD may provide post dispatch instructions. This may be simple first aid and
general advice (for example to send someone to look for the ambulance), or specific
instructions on what to do in an emergency (for example, CPR, freeing an airway).
Initially there were some concerns about the application of call prioritisation to UK services, in
particular the potential risk attached to under prioritisation of calls for a serious event.
Consequently in the first instance these systems were introduced in “shadow” form, that is,
calls were processed through the prioritisation systems but an immediate ambulance
response still sent. During this period an assessment of the safety and reliability of the
systems was conducted which found the risk of serious under-prioritisation to be low13. Call
prioritisation in ambulance services commenced properly in 1997.
1.3 Study aims and objectives
The introduction of new response time performance standards and call prioritisation resulted
in significant changes for ambulance services. The effects of this change in policy need to be
assessed in order to determine what improvements in patient outcome are achieved, whether
there are any lessons to be learned for prioritisation and response time standards, and to
ensure that the costs of implementation are justified. The purpose of this evaluation was to
measure the changes that result from implementing the new response time standards in four
ambulance services. The broad aims were to assess the costs, benefits, acceptability and
practical lessons of moving towards the new response time performance standards.
The original study objectives were:
1. To measure the effect of the introduction of the new response time performance
standards on ambulance service performance times for calls of different types and

6
levels of urgency as assessed by two priority dispatch systems and the ORCON
review groups categorisation.
2. To assess the effects of any improvements in response times for life-threatening calls
(ORCON review category “A”) on survival to hospital and to discharge,
hospitalisation, and length of stay till discharge.
3. To assess the acceptability to 999 callers of the operation of the priority dispatch
systems and pre-arrival instructions.
4. To monitor the nature of category ‘C’ calls including the reasons for the call and level
of need, and the management of those calls including the response times, outcome
and an assessment of alternative ways of managing calls.
5. To uncover and report on any practical lessons relating to the operation of priority
dispatch systems and priority dispatching.
6. To measure the costs and cost consequences of the introduction of the new response
time performance standards.
7. To make an assessment of the likely costs and health benefits of increasing the
response time performance standards beyond the current proposals.
We subsequently omitted objective 1 from the study as ambulance service response time
performance for different categories of calls is reported annually in Department of Health
Statistical Bulletins.
Findings in relation to objectives 3 and 4 have been previously reported in an interim report14.
In this report a summary of these studies is provided in the Appendix 1 with references to the
peer reviewed publications on these items.
The primary purpose of this report is therefore to present the findings of the main study
measuring the impact of changes in response time performance on patient outcome and the
economic evaluation.
7
2. METHODS
2.1 Overview
Consecutive, life-threatening category A 999 ambulance calls were sampled on an annual
basis for the 5 years 1996/7 – 2000/1 from 4 ambulance services. Of these, all calls where
an ambulance arrived at scene and treated or transported a patient were included in the
study. These cohorts of patients were followed up to discharge from hospital.
Details of incidents, patient characteristics, and clinical conditions were recorded. Processes
of pre-hospital and in-hospital care, mortality and costs have been assessed and compared
for each year and each service. Changes in response time performance have been
measured and the relationship between response time performance and mortality for all
cases and for different clinical conditions have been analysed over the 5 year study period.
A number of additional studies have also been carried out. These are:
• A descriptive study of the operational and organisational changes planned by the
study ambulance services to enable them to meet the revised performance standards
• A before and after study of caller satisfaction with and acceptability of Emergency
Priority Dispatch systems
• An assessment of the nature of category C 999 calls
The methods are described in more detail below.
2.2 Areas included in the study
Four ambulance services were included in the study. These were Royal Berkshire
Ambulance Service (RBAS – service 1), Derbyshire Ambulance Service (DAS – service 2),
Essex Ambulance Service (EAS – service 3), and West Midlands Ambulance Service (WMAS
– service 4). The services were chosen on the basis that at the start of the study they had
already implemented Emergency Priority Dispatch into their control rooms and could therefore
categorise calls (but had not yet implemented call prioritisation), were planning to report
response times for different categories of calls in the near future and that they represented
the types of environment typically encountered in England and included urban, mixed urban
and rural and very rural areas (table 2.1). In 1999 during the course of the study Derbyshire,
Nottinghamshire and Leicestershire ambulance services merged to become East Midlands
Ambulance Service NHS Trust.

8
Table 2.1 Ambulance service areas included in the study
Service 1 Service 2 Service 3 Service 4
Total annual 999 calls with an ambulance arriving at scene
Year 1 Year 5
38,600 46,600
47,000 (N/A merged)
93,600 114,700
200,300 217,800
Catchment population (millions) 0.76 0.93 2.14 2.67
% urban population 75 36 80 98
% rural population 20 59.5 19 2
% sparse population 5 4.5 1 0
Total area covered (miles2) 491 1010 1500 406
Number of major A&E departments served
2 2 7 13
Services 1 and 3 used the Criteria Based Dispatch (CBD) prioritisation system, Service 2 the
Advanced Medical Priority Dispatch System (AMPDS) and service 4 began the study using
CBD before changing to AMPDS in the third year of the study.
2.3 Approval for the study
Approval for the study was obtained from 24 ethics committees covering the 27 hospitals that
patients could be taken to within the geographical boundaries of each of the study ambulance
services.
Following approval by the ethics committees, letters were sent to the Medical Directors and
Chief Executives of all the hospitals involved and permission obtained to access the medical
records of patients we wished to follow up.
The A & E consultants of all 27 hospitals were also contacted by letter to explain the nature of
the study and request access to their records. Senior medical records managers and
information technology managers were visited personally by the project researcher to obtain
their co-operation and negotiate and agree the best methods of accessing records and
computerised information. Permission was also gained to access the Patient Administration
Systems to allow follow up of patients from A&E through to hospital admission.
Similarly the relevant control room and information managers were visited by the researcher
and processes for providing ambulance control room data from the computer aided dispatch
(CAD) system for 999 calls and retrieval of the patient report forms (PRFs) completed by
attending crews were negotiated and agreed.
9
2.4 Data collection
Inclusion of cases
The evaluation has focused on 999 calls for potentially life-threatening conditions when a
faster response may have some impact on patient outcome. To provide consistency in the
reporting of category A response time performance once call prioritisation was introduced, the
Department of Health produced a list of both AMPDS and CBD codes which were considered
to correspond to the seven condition types identified as category A calls. We have included a
sub-sample of all category A calls in which the patient was also reported as unconscious OR
not breathing OR with acute chest pain. We have termed these A* calls and it is these calls
that make up the cases included in our study. A list of codes used is given in appendix 1.
Exclusion criteria
A* calls where the patients were admitted to hospitals other than those included in our study
(e.g. where the Ambulance Service transports a patient across its geographical boundary to a
hospital in a neighbouring county) were excluded. Calls where no vehicle attended the scene
(for example hoax, aborted calls) were also excluded.
Sample periods
Calls were sampled at five time points – baseline and one, two, three and four years after call
prioritisation was introduced. The baseline time period was determined as immediately prior
to implementation of call prioritisation and any major service developments designed to
enable a service to work towards the new response time standards (for example station
closures, new rostering systems). As a consequence the sampling periods vary for each
service. The length of the sampling period for each service was determined by call volumes.
Our aim was to select a time period that would allow us to sample approximately 1000
consecutive A* calls in each year.
The sampling procedure for the baseline comprised taking a start point of the nearest
complete week that preceded any major service change and identifying all calls that
corresponded to the inclusion criteria EMD codes. This was repeated, moving back through
the consecutive weeks until the approximate target of 1000 calls was reached. An identical
sampling period was then used for years 2 through 5. The actual sampling periods were 1/1
to 31/3 (Berkshire), 15/1 to 31/3 (Derbyshire), 1/4 to 15/4 (West Midlands), and 1/11 to 30/11
(Essex).
During 1999 West Midlands changed their EMD dispatch systems from CBD to AMPDS. In
order to include calls identified by the AMPDS system we changed our sampling period to
12/3-25/3.

10
Case identification
At the end of each sample period in each of the five years of the study we obtained data
directly from the Computer Aided Despatch (CAD) systems from each of the four ambulance
services. The dispatch information contained records for all calls made to the four ambulance
services during each study sample period. We then identified our sample data (A* calls) by
selecting the AMPDS and CBD codes corresponding to Department of Health category A
calls and in which the patient was reported as unconscious OR not breathing OR with acute
chest pain.
Any calls where a vehicle did not arrive on scene or where the patient was taken outside the
study area were excluded.
During the 5-year period, there were 20347 calls identified from all category A life-
threatening calls made to the four ambulance services. Of these 17950 calls were included in
the study for follow up (Table 2.2). Exclusions were made on the basis that calls were
cancelled before an ambulance reached the scene and some patients were taken to a
hospital not included in our study. The changes in the number of cases and included cases
reflect the effect of the EMD system bedding in, changes in some services due to mergers
and switching EMD systems, and the sampling period covering Easter in some services in
some years but not in others.
Table 2.2 All A calls and included A calls by study year
Year of study 1 2 3 4 5
Total
Number of calls
4192 4553 3746 3803 4053 20347
3887 4026 3154 3288 3595 17950 Number included 92.7% 88.4% 84.2% 86.5% 88.7% 88.2%
2.5 Information recorded
Pre-hospital
Two sources of data were used. The ambulance service CAD data provided information on
the patient (name, age, sex), location of incident, grid reference for the incident, time of call,
timings of all vehicles dispatched (passed, mobile, on scene, left scene, at hospital) and
priority dispatch system category codes. This information was then used to identify the paper
ambulance service patient report forms (PRFs).
We attempted to obtain a PRF for every case in our study. From the PRF, information was
abstracted about the patient (name, date of birth and address), an incident description, the
patient condition on arrival of the crew including presence of vital signs, details of treatment
given, disposal of the patient (whether left on scene, or transported to hospital) outcome at

11
this point (alive or deceased). If the patient was taken to hospital details of name and
address allowed us to identify their A&E cards and medical notes in order to ascertain their
clinical outcome. If the patient was not taken to hospital then the PRF was used to determine
the outcome of the incident.
If the patient did not go to hospital and no PRF was found, then the dispatch information was
all the information we had on these incidents. For the outcomes part of the study these
incidents were considered lost to follow up. However, as the dispatch information included
time of call and time on scene then they were included in the response time part of the study.
Table 2.3 gives the proportion of PRFs found in each year of the study.
Table 2.3 Proportion of patient report forms found by study year
Year of study
1 2 3 4 5 Total
All included cases 3879 4013 3152 3279 3585 17908*
PRFs found number (%)
2933 (75.6)
2898 (72.2)
2190 (69.5)
2545 (77.6)
2725 (76)
13291 (74.2)
*excludes 42 cases where no patient was found at scene
In hospital
Every effort was made to trace each patient sampled who was transported to hospital to a
matched A&E and inpatient record. Matching criteria were the name of the patient, date and
time of incident, and type of incident. When a PRF was available this process was relatively
straight forward. When no PRF was available or when neither the CAD data nor the PRF
contained a name, then the CAD details had to be used to try and match incident date, time,
and type with an A&E register entry. This was generally successful. However, there were
some cases in which no matching case could be found, although the CAD data indicated the
patient had been transported to hospital. Similarly there were a few cases where there was
no record of A&E attendance of a named patient. In these cases the PAS system was
checked to see if that patient had been admitted to hospital at the corresponding date and
time. If an admission record was found these cases were followed up. When they had not,
the case was considered lost to follow up. It is likely that for some cases where no hospital
record was found for a named live patient they had a relatively minor condition and left A&E
before being registered. At some hospitals when a patient was dead on arrival they would be
certified by a doctor outside the department and not entered onto an A&E register.
Where cases were successfully followed up hospital information was obtained from A&E
records, inpatient notes and PAS systems. Information was recorded for A&E events,
inpatient events and final outcome.

12
Accident and Emergency events
Information recorded included time of arrival and discharge from A&E, patient condition
including vital signs, cardiac rhythm (for cardiac patients), preliminary diagnosis, condition on
leaving A&E and disposal (admitted, transferred, discharged, died).
Inpatient events
Details were recorded of where admitted to (speciality), length of stay, acute and long stay
episodes, any operations or major investigations (e.g. CAT scans), final diagnosis and
disposition (discharged home, discharged to continuing care or died). For any patient who
died details were recorded of the date, time, place and cause of death.
For trauma patients a full description of all injuries sustained and their Abbreviated Injury
Scale (AIS) codesref were made using A&E and inpatient records and post mortem reports.
AIS codes indicate threat to life and range from 1 indicating a minor injury to 6 indicating a
non-survivable injury. Injury mechanism was classified as blunt or penetrating.
The injury descriptions were coded using the AIS90 dictionaryref and Injury Severity Scores
(ISS) calculatedref. ISS scores are calculated by summing the squares of the AIS scores of
the most severe injuries in up to 3 body regions. ISS scores range from 1 to 75. Injury coding
was carried out by 3 researchers (JT, KW, CO’K). JT and KW had considerable coding
experience from previous studies. Training for CO’K was provided in house by JT. Any
difficult cases were discussed and coding agreed between raters.
2.6 Additional follow up of patients who died or were lost to hospital follow up
Cause of death
We wanted to ascertain the cause of death for all patients who died in our study. If the patient
died at hospital then cause of death was usually found in hospital records. However, if the
patient died at scene and was taken to directly to a mortuary then these cases were followed
up at the appropriate coroners to ascertain cause of death. With the permission of a coroner
the researcher accessed death certificates from the relevant coroner files.
In some instances researchers did not obtain the permission of coroners to view their records.
In these cases the NHS Central register (part of the Office for National Statistics) was
contacted and approval given to access their national register of deaths and obtain a death
certificate. Lists of patients were drawn up and sent to NHSCR who then sent a copy of the
death certificates to us.
Outcome
Over the course of the study there were also a few hundred patients recorded as being taken
to hospital by ambulance dispatch information and for whom we had identifiable information
(e.g name, date of birth) but no trace was found on A&E or inpatient systems. In order to find

13
out if these patients had died at the end of this incident or had survived we sent lists of these
patients’ details (name, address, date of incident) to the NHS Central Registry to cross-
reference on their databases. If the patient was traced on the register then they were
currently alive and therefore had survived the incident in our study. If the patient was
registered as having died then the date, place of death and death certificate was obtained.
From this information we were able to ascertain if the patient had died as a result of the
incident in our study. Those patients for whom there was no trace on the NHSCR were
considered lost to follow up.
14
3. RESULTS – DESCRIPTION OF CASES
3.1. Introduction
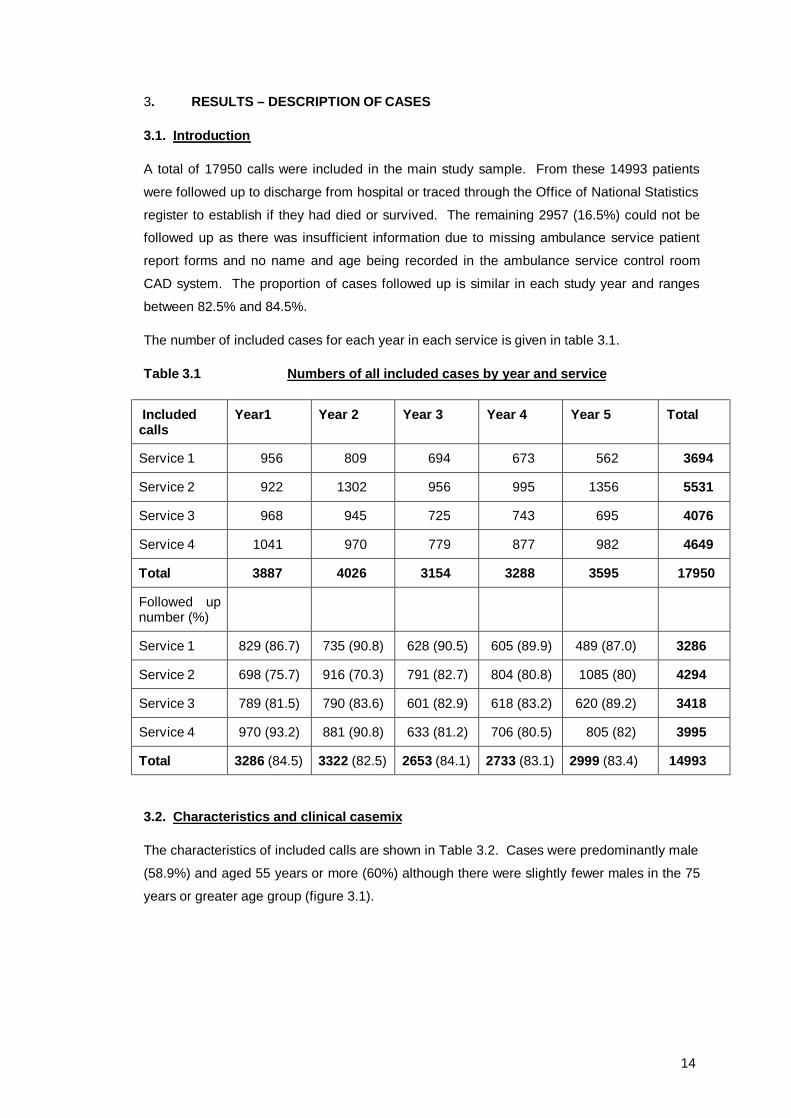
A total of 17950 calls were included in the main study sample. From these 14993 patients
were followed up to discharge from hospital or traced through the Office of National Statistics
register to establish if they had died or survived. The remaining 2957 (16.5%) could not be
followed up as there was insufficient information due to missing ambulance service patient
report forms and no name and age being recorded in the ambulance service control room
CAD system. The proportion of cases followed up is similar in each study year and ranges
between 82.5% and 84.5%.
The number of included cases for each year in each service is given in table 3.1.
Table 3.1 Numbers of all included cases by year and service
Included calls
Year1 Year 2 Year 3 Year 4 Year 5 Total
Service 1 956 809 694 673 562 3694
Service 2 922 1302 956 995 1356 5531
Service 3 968 945 725 743 695 4076
Service 4 1041 970 779 877 982 4649
Total 3887 4026 3154 3288 3595 17950
Followed up number (%)
Service 1 829 (86.7) 735 (90.8) 628 (90.5) 605 (89.9) 489 (87.0) 3286
Service 2 698 (75.7) 916 (70.3) 791 (82.7) 804 (80.8) 1085 (80) 4294
Service 3 789 (81.5) 790 (83.6) 601 (82.9) 618 (83.2) 620 (89.2) 3418
Service 4 970 (93.2) 881 (90.8) 633 (81.2) 706 (80.5) 805 (82) 3995
Total 3286 (84.5) 3322 (82.5) 2653 (84.1) 2733 (83.1) 2999 (83.4) 14993
3.2. Characteristics and clinical casemix
The characteristics of included calls are shown in Table 3.2. Cases were predominantly male
(58.9%) and aged 55 years or more (60%) although there were slightly fewer males in the 75
years or greater age group (figure 3.1).

15
Table 3.2 Characteristics of all patients included in the study
Characteristic Values Number % Age 0-14 555 4.4 15-34 1950 15.5 35-54 2544 20.3 55-74 3851 30.7 >75 3643 29 Not known 5407 Total 17950 100 Mean 57.34 Median 63.0
Sex Male 8927 58.9 Female 6234 41.1 Not known 2789 Total 17950
100
Orcon A category Chest pain 6699 37.3 Unconscious 11075 61.7 Breathing
difficulty 5 0
Child < 2 years 171 1.0
Total 17950 100
Figure 3.1 – Age and sex distribution of included cases
0
500
1000
1500
2000
2500
3000
Age group
Num
ber
malefemale

16
In terms of the classification of category A call made in ambulance control the majority of calls
fell into the unconscious and chest pain categories. Only 5/17950 cases were included in the
breathing difficulties category and only 171 in the child under 2 years of age category. The
child under 2 category does not represent all of this group. Services using CBD had a
specific category (27) for children and the number reported is those allocated to this code.
However, if a specific clinical condition was identified, a call for an under 2 years child would
be allocated to the category for that condition (e.g fits) rather than category 27. Services
using AMPDS only allocated children to a clinical category and did not have a specific code
for children. In total there were 267 (1.5%) children under 2 years of age included.
There were no cases reported as unconscious or not breathing and that also had EMD codes
corresponding to the anaphylaxis, penetrating trauma or obstetric haemorrhage groups which
are also part of the ORCON A categorisation. This is presumably because these are
relatively rare events that require very specific diagnostic information that may not be
available at the time of the 999 call.
Table 3.3 gives the number and percentage of calls in each category A group by study year
and service.
Table 3.3. Category A call groups by study year and service
Category Category A calls by type n (%)
Year of Study
Chest Pain Unconscious Breathing Difficulty
Child = < 2 years
Total
1 1542 (39.7) 2331(60.0) 0 14 (0.4) 3887(100)
2 1517 (37.7) 2439(60.6) 1 (0) 69 (1.7) 4026(100)
3 979 (31.0) 2133(67.6) 0 42 (1.3) 3154(100)
4 1236 (37.6) 2023(61.5) 1 (0) 28 0.9) 3288(100)
5 1425 (39.6) 2149(59.8) 3(0.1) 18 (0.5) 3595(100)
Service
1 690 (18.7) 2915(78.9) 0 89 (2.4) 3694(100)
2 2944 (53.2) 2586(46.8) 1 (0) 0 5531(100)
3 1205 (29.6) 2821(69.2) 0 50 (1.2) 4076(100)
4 1860 (40.0) 2753(59.2) 4(0.1) 32 (0.7) 4649(100)
Total 6699 11075 5 171 17950
The proportions of cases falling into the ambulance service categories remained stable over
the 5 year period with the majority of calls falling into the unconscious/fitting/unresponsive
category followed by the chest pain category. Less than 1% of calls fell into other categories.

17
There is variation in the distribution of calls by category between the study services. This
may be a consequence of the two different EMD systems used. Services 1 and 3 used CBD
whereas service 2 used AMPDS and service 4 used both. CBD has a code for unconscious or
not breathing for every condition category. This is restricted to a few conditions in AMPDS.
As a consequence there is a much greater number of unconscious codes used in the
sampling frame for services using CBD. As explained above, this system also has a separate
condition category code for children under 2 years of age which AMPDS does not.
Of the 17950 included calls we were unable to follow up 2591 (14.4%) and record an
outcome. We have examined the key characteristics of calls followed up and not followed up
to determine if there are any major differences between these two groups that may influence
the interpretation of the results. These are given in table 3.4
Table 3.4 Characteristics of cases followed up and not followed up Characteristics Followed up n (%) Not followed up n (%) Total n (%) Age (years)
0-14
15-34
35-54
55-74
>75
Total
550 (4.4)
1930 (15.5)
2527 (20.3)
3821 (30.7)
3611(29)
12437 (100)
5 (4.8)
20 (19.2)
17 (16.3)
30 (28.8)
32 (30.8)
104 (100)
555 (4.4)
1950 (15.5)
2544 (20.3)
3851 (30.7)
3643 (29)
12543 (100)
Sex Male
Female
Total
8541 (58.9)
5954 (41.1)
14495 (100)
375 (58.2)
266 (41.3)
644 (100)
8916 (58.9)
6220 (41.4)
15139 (100)
Orcon A category
Chest pain
Unconscious
Breathing difficulty
Child <2 years
Total
5772 (38.5)
8969 (59.6)
3 (0)
291 (1.9)
15035 (100)
910 (31.2)
1968 (67.5)
1 (0)
36 (1.2)
2915 (100)
6682 (37.2)
10937 (60.9)
4 (0)
327 (1.8)
17950 (100)
Transported to hospital
Yes
No
Total
11773 (78.5)
3362 (21.5)
15035 (100)
1951 (66.9)
964 (33.1)
2915 (100)
13724 (76.5)
4226 (23.5)
17950 (100)
Cardiac Arrest
Yes
No
Total
1230 (8.3)
13622 (91.7)
14852 (100)
17 (0.7)
2574 (99.3)
2591 (100)
1247 (7.1)
16196 (92.8)
17443 (100)
18
There was no difference in the age or sex profile of the two groups. A slightly larger proportion
of cases not followed up were categorised as unconscious and more of these cases were not
transported to hospital reflecting the relatively minor nature of some calls left at scene. For
both these groups less information is available to allow continued follow up. There was only a
small number of cardiac arrest cases that were not followed up. The main difference between
the two groups was in transports to hospital and as minor cases left at scene do not influence
the mortality analysis presented in section 6 we do not believe there are any significant biases
present in cases with missing data and hence outcome.
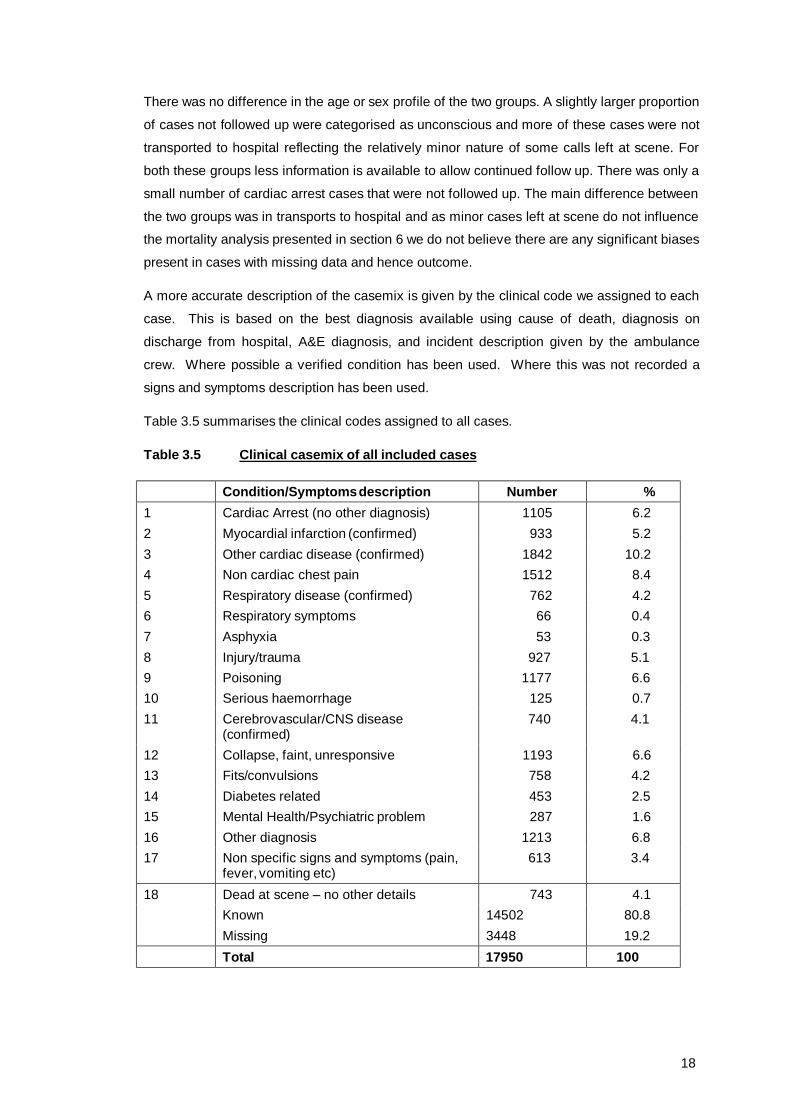
A more accurate description of the casemix is given by the clinical code we assigned to each
case. This is based on the best diagnosis available using cause of death, diagnosis on
discharge from hospital, A&E diagnosis, and incident description given by the ambulance
crew. Where possible a verified condition has been used. Where this was not recorded a
signs and symptoms description has been used.
Table 3.5 summarises the clinical codes assigned to all cases.
Table 3.5 Clinical casemix of all included cases
Condition/Symptoms description Number % 1 Cardiac Arrest (no other diagnosis) 1105 6.2 2 Myocardial infarction (confirmed) 933 5.2 3 Other cardiac disease (confirmed) 1842 10.2 4 Non cardiac chest pain 1512 8.4 5 Respiratory disease (confirmed) 762 4.2 6 Respiratory symptoms 66 0.4 7 Asphyxia 53 0.3 8 Injury/trauma 927 5.1 9 Poisoning 1177 6.6 10 Serious haemorrhage 125 0.7 11 Cerebrovascular/CNS disease
(confirmed) 740 4.1
12 Collapse, faint, unresponsive 1193 6.6 13 Fits/convulsions 758 4.2 14 Diabetes related 453 2.5 15 Mental Health/Psychiatric problem 287 1.6 16 Other diagnosis 1213 6.8 17 Non specific signs and symptoms (pain,
fever, vomiting etc) 613 3.4
18 Dead at scene – no other details 743 4.1 Known 14502 80.8 Missing 3448 19.2 Total 17950 100
19
Cardiac problems accounted for 21.6% of calls, respiratory problems 4.9% and collapse or
unresponsiveness (fits, collapse, cerebrovascular disease) 14.9%. Almost a quarter (23.4%)
of calls were for other medical problems, 5.1% for injury and 6.6% for poisoning.
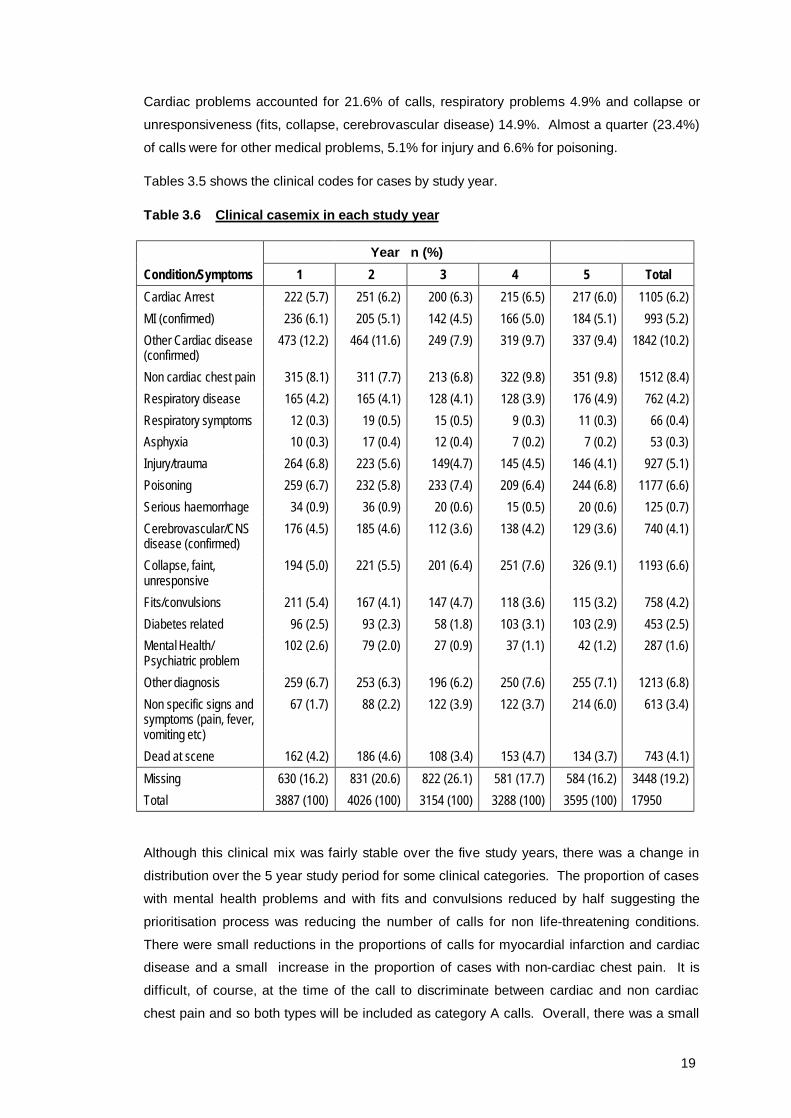
Tables 3.5 shows the clinical codes for cases by study year.
Table 3.6 Clinical casemix in each study year
Year n (%) Condition/Symptoms 1 2 3 4 5 Total Cardiac Arrest 222 (5.7) 251 (6.2) 200 (6.3) 215 (6.5) 217 (6.0) 1105 (6.2) MI (confirmed) 236 (6.1) 205 (5.1) 142 (4.5) 166 (5.0) 184 (5.1) 993 (5.2) Other Cardiac disease (confirmed)
473 (12.2) 464 (11.6) 249 (7.9) 319 (9.7) 337 (9.4) 1842 (10.2)
Non cardiac chest pain 315 (8.1) 311 (7.7) 213 (6.8) 322 (9.8) 351 (9.8) 1512 (8.4) Respiratory disease 165 (4.2) 165 (4.1) 128 (4.1) 128 (3.9) 176 (4.9) 762 (4.2) Respiratory symptoms 12 (0.3) 19 (0.5) 15 (0.5) 9 (0.3) 11 (0.3) 66 (0.4) Asphyxia 10 (0.3) 17 (0.4) 12 (0.4) 7 (0.2) 7 (0.2) 53 (0.3) Injury/trauma 264 (6.8) 223 (5.6) 149(4.7) 145 (4.5) 146 (4.1) 927 (5.1) Poisoning 259 (6.7) 232 (5.8) 233 (7.4) 209 (6.4) 244 (6.8) 1177 (6.6) Serious haemorrhage 34 (0.9) 36 (0.9) 20 (0.6) 15 (0.5) 20 (0.6) 125 (0.7) Cerebrovascular/CNS disease (confirmed)
176 (4.5) 185 (4.6) 112 (3.6) 138 (4.2) 129 (3.6) 740 (4.1)
Collapse, faint, unresponsive
194 (5.0) 221 (5.5) 201 (6.4) 251 (7.6) 326 (9.1) 1193 (6.6)
Fits/convulsions 211 (5.4) 167 (4.1) 147 (4.7) 118 (3.6) 115 (3.2) 758 (4.2) Diabetes related 96 (2.5) 93 (2.3) 58 (1.8) 103 (3.1) 103 (2.9) 453 (2.5) Mental Health/ Psychiatric problem
102 (2.6) 79 (2.0) 27 (0.9) 37 (1.1) 42 (1.2) 287 (1.6)
Other diagnosis 259 (6.7) 253 (6.3) 196 (6.2) 250 (7.6) 255 (7.1) 1213 (6.8) Non specific signs and symptoms (pain, fever, vomiting etc)
67 (1.7) 88 (2.2) 122 (3.9) 122 (3.7) 214 (6.0) 613 (3.4)
Dead at scene 162 (4.2) 186 (4.6) 108 (3.4) 153 (4.7) 134 (3.7) 743 (4.1) Missing 630 (16.2) 831 (20.6) 822 (26.1) 581 (17.7) 584 (16.2) 3448 (19.2) Total 3887 (100) 4026 (100) 3154 (100) 3288 (100) 3595 (100) 17950
Although this clinical mix was fairly stable over the five study years, there was a change in
distribution over the 5 year study period for some clinical categories. The proportion of cases
with mental health problems and with fits and convulsions reduced by half suggesting the
prioritisation process was reducing the number of calls for non life-threatening conditions.
There were small reductions in the proportions of calls for myocardial infarction and cardiac
disease and a small increase in the proportion of cases with non-cardiac chest pain. It is
difficult, of course, at the time of the call to discriminate between cardiac and non cardiac
chest pain and so both types will be included as category A calls. Overall, there was a small

20
reduction in the proportion of cardiac and chest pain cases over the 5 years which is one of
the specific groups targeted for improved response time performance.
There was an increase in the proportion of calls for reported collapse or unresponsiveness
which was also a target group for improved performance, however there was also an increase
in the proportion of calls for generalised signs and symptoms not specific to any target
category. This perhaps illustrates the difficulties of trying to obtain accurate information
during an emergency call.
There were also differences between services in the relative proportions of calls within some
clinical categories. Table 3.6 shows calls by clinical code for each service.
Table 3.7 Clinical casemix in each service
Service n (%)
Condition/Symptoms 1 2 3 4 Total
Cardiac Arrest 359 (9.7) 275 (5.0) 235 (5.8) 236 (5.1) 1105 (6.2) MI (confirmed) 130 (3.5) 439 (7.9) 176 (4.3) 188 (4.0) 993 (5.2) Cardiac disease (confirmed) 225 (6.1) 752 (13.6) 421 (10.3) 444 (9.5) 1842 (10.2) Non cardiac chest pain 150 (4.1) 579 (10.5) 239 (5.9) 544 (11.7) 1512 (8.4) Respiratory disease 122 (3.3) 276 (5.0) 143 (3.5) 221(4.8) 762 (4.2) Respiratory symptoms 8 (0.2) 24 (0.4) 14 (0.3) 20 (0.4) 66 (0.4) Asphyxia 13 (0.4) 22 (0.4) 7 (0.2) 11 (0.2) 53 (0.3) Injury (specified) 281 (7.6) 113 (2.6) 262 (8.4) 271 (6.5) 927 (6.4) Poisoning 270 (7.3) 334 (6.0) 282 (6.9) 291 (6.3) 1177 (6.6) Serious haemorrhage 32 (0.9) 37 (0.7) 30 (0.7) 26 (0.6) 125 (0.7) Cerebrovascular/CNS disease (confirmed)
189 (5.1) 155 (2.8) 214 (5.3) 182 (3.9) 740 (4.1)
Collapse, faint, unresponsive 264 (7.1) 304 (5.5) 258 (6.3) 367 (7.9) 1193 (6.6) Fits/convulsions 274 (7.4) 102 (1.8) 167 (4.1) 215 (4.6) 758 (4.2) Diabetes related 122 (3.3) 98 (1.8) 79 (1.9) 154 (3.3) 453 (2.5) Mental Health/Psychiatric problem 51 (1.4) 54 (1.0) 62 (1.5) 120 (2.6) 287 (1.6) Other diagnosis 181 (4.9) 414 (7.5) 257 (6.3) 361 (7.8) 1213 (6.8) Non specific signs and symptoms 69 (1.9) 264 (4.8) 100 (2.5) 180 (3.9) 613 (3.4) Dead at scene 192 (5.2) 64 (1.2) 181 (4.4) 306 (6.6) 743 (4.1) Missing 762 (20.6) 1225 (22.1) 949 (23.3) 512 (11.0) 3448 (19.2) Total 2932 (100) 4306 (100) 3127 (100) 4137 (100) 17950
Service 1 had a much higher proportion of calls identified as cardiac arrest than the other
services. However, if all the cardiac related categories are combined then excluding missing
cases service 2 has the highest proportion of this type of case with 34.1% compared to 24.2
%, 26.3% and 20.9% in services 1, 3 and 4 respectively. This suggests that, if the clinical

21
code is right then service 2 is better at targeting appropriate calls than the other services.
The high proportion of cardiac related cases in service 2 may partly explains why there is a
smaller proportion in other categories, particularly injury and fits and convulsions. There were
also fewer cases where no information other than the patient was dead at scene was
available although this may simply be a consequence of more successful follow up in this
area. There were some categories (injury, cerebrovascular disease, respiratory disease, non
specific signs & symptoms) where there appeared to be differences between services using
CBD compared to AMPDS.
There are a number of possible explanations for these differences
• Two different EMD systems were used to categorise 999 calls. There may be subtle
differences in the prioritisation process that results in differences in casemix.
• EMD systems are a tool used to categorise and triage emergency calls and, on the
basis of information provided, it is the Emergency Medical Dispatchers in the
ambulance service control rooms who allocate a condition and therefore identify calls
coded as A. There are differences in the training provided for each system and
may also be local differences within the same system, for example in protocol
compliance, that can result in differences in the accuracy and consistency of call
prioritisation in different services.
• There may also be genuine casemix differences between different services
depending on the type of geographical area and population served.
Although the clinical casemix of calls is fairly stable on a year on year basis the differences
between services has implications for evaluative research and ambulance service
performance measures as any comparisons between services has to take into account the
casemix differences between services.
Many conditions, for example diabetes related problems, cardiac arrests and poisonings
(particularly alcohol intoxications which account for 42% of this group) would have originally
been categorised as unconscious by the ORCON classification of category A on the basis of
the information given by the 999 caller. This is illustrated in Table 3.7 which compares the
initial ORCON category with subsequent clinical condition where this is known.
Overall, the broad classification provided by the ORCON categories seems to accurately
reflect the subsequent clinical casemix. Almost 90% of cardiac related cases were classified
in the chest pain category with the exception of cardiac arrests which were correctly allocated
to the unconscious category. The main anomaly is that no cases with respiratory problems
were classified as breathing difficulty at the time of the call.

22
Table 3.8 Comparison of ORCON A categorisation and confirmed clinical condition
ORCON A Category n (%)
Condition/Symptoms Chest pain unconscious Breathing difficulty
Child <2years
Total
Cardiac Arrest 51 (4.6) 1042 (94.3) 0 12 (1.1) 1105 (100) MI (confirmed) 826 (88.5) 107 (11.5) 0 0 993 (100) Cardiac disease (confirmed) 1601 (86.9) 241 (13.1) 0 0 1842 (100) Non cardiac chest pain 1443 (95.4) 69 (4.6) 0 0 1512 (100) Respiratory disease 475 (62.3) 268 (35.2) 0 19 (2.5) 762 (100) Respiratory symptoms 41 (62.1) 21 (31.8) 0 4 (6.1) 66 (100) Asphyxia 4 (7.5) 45 (84.9) 0 4 (7.5) 53 (100) Injury/trauma 42 (4.7) 868 (93.7) 0 17 (1.6) 927 (100) Poisoning 44 (3.7) 1132 (96.2) 0 1 (0.1) 1177 (100) Serious haemorrhage 23 (18.4) 102 (81.6) 0 0 125 (100) Cerebrovascular/CNS disease (confirmed)
52 (7.0) 685 (92.6) 0 3 740 (100)
Collapse, faint, unresponsive 93 (7.8) 1098 (92) 0 2 (0.2) 1193 (100) Fits/convulsions 21 (2.8) 694 (91.6) 3 (0.4) 40 (5.3) 758 (100) Diabetes related 11 (2.4) 441 (97.4) 1 (1.2) 0 453 (100) Mental Health/Psychiatric problem 79 (27.5) 208 (72.5) 0 0 287 (100) Other 695 (57.3) 496 (40.8) 1 (0.1) 21 (1.7) 1213 (100) Non specific signs and symptoms 406 (66.2) 203 (33.1) 0 4 (0.7) 613 (100) Dead at scene 7 (0.9) 735 (98.9) 0 1 (0.1) 743 (100) Missing 785 (22.8) 2620 (76.0) 0 43 (1.2) 3448 (100) Total 6699 11075 5 171 17950
The large proportion classified as unconscious in ORCON reflects the wide range of medical
conditions subsequently identified although final outcome and some types of conditions
suggest that “unconscious” is not a very accurate description of some cases. This may be a
consequence of the key question in the prioritisation process which asks the caller if the
patient is conscious and a yes or no answer is recorded. There were 11075 calls with EMD
codes corresponding to the ORCON unconscious category. However, of these 4345 (39.2%)
were recorded by the ambulance crew as conscious on arrival, 3679 (33.2%) as unconscious
and for 3051 (27.5%) there is no record of state of consciousness. Whilst in some instances
a patient may be unconscious at the time of the call but have recovered consciousness by the
time the ambulance crew arrived this is unlikely to be the case for more than half of the cases
in which state of consciousness is recorded. The outcome data presented later also supports
the view that a substantial proportion of cases were not of a serious nature. There may
therefore be some difficulty in relying on the interpretation of the term “conscious” by callers to
the ambulance service as a means of identifying life-threatening medical decisions.
23
4. RESULTS - RESPONSE TIME PERFORMANCE
4.1 Service developments
The introduction of call prioritisation and new response time standards for different categories
of call presents a significant organisational challenge to ambulance services. Semi-structured
interviews were conducted in all four services at the beginning of the study to determine how
they were planning to meet the new response time standards. Progress was determined from
an annual survey of services carried out for 6 years and described in more detail in the
economic evaluation.
All of the study services made changes to facilitate improving response time performance.
This includes major organisational changes including new capital investment as well as
reorganisation of existing resources. These can be summarised as follows:
• Changes to ambulance station configurations including relocations, total numbers and
initiatives to share premises (e.g with fire stations).
• A range of first responder schemes with the emphasis on single manned vehicles
including motorcycles. Longer term initiatives include the development of community
first responder schemes utilising personnel from outside the ambulance service itself.
• Developments to decrease total call time (receipt of call to vehicle clear for another
call) include increased use of standby points and dynamic deployment, improved
stocking procedures for vehicles which decrease the need for vehicles to return to
stations and better arrangements with hospitals to enable patients to be taken to the
most appropriate hospital rather than the nearest.
• Increased utilisation of IT developments including automatic vehicle location,
predictive analysis and data transmission to vehicles (pre-alert systems).
• Improvements in demand management including demand analysis, predictive
analysis, flexible crew rostering and the use of appropriately trained staff (e.g.
managers) as first responders.
Table 4.1 summarises the major developments in the four study sites at the beginning and
end of the study.

24
Table 4.1 Major developments at 4 study sites over 6 years
Service 1 Service 2 Service 3 Service 4
Year 1 Year 6 Year 1 Year 3* Year 1 Year 6 Year 1 Year 6
Number of solo paramedics 3 6 14 9 14 10 21 25
Number of other staff available for 999 response (managers etc)
4 12 34 11 7 25 25 23
Number of fast response vehicles including motorcycles
4 6 17 7 5 11 21 40
Number of ambulance stations 4 4 15 15 31 31 28 37
Number of static standby points 30 8 29 0 18 27 50 43
Priority dispatch system Yes Yes Yes Yes Yes Yes Yes Yes
Pre-alert system X Yes X X Yes Yes Yes Yes
Predictive analysis X Yes X X Yes Yes Yes Yes
Automatic vehicle location X Yes X X Yes Yes Yes Yes
Improved vehicle stocking X X X X X Yes X X
Improved communication with crews (e.g automatic data transmission
X Yes X Yes Yes Yes X Yes
Crew meal breaks taken on duty X Yes Yes Yes Yes Yes Yes Yes * Service 2 merged with neighbouring services in year 4.

25
4.2. Changes in response time performance
One of the main objectives of the study has been to measure changes in response time
performance over the 5 year study period as the services have moved towards the revised
performance standard of responding to 75% of category A calls within 8 minutes. We have
calculated the response time for all included calls using the response times recorded in the
CAD systems. Where more than one vehicle was dispatched the shortest response time has
been used in the analysis.
In some services in the early years of the study response times supplied by the AS CAD
systems were given as whole numbers of minutes. We understand that this was because the
event times (call, on scene) were only recorded in hours and minutes. This means that a
response time reported as 8 minutes, for example, could actually be from 7.01 to 8.99
minutes. However, the response time recorded in the CAD system has been used in the
calculation of means percentiles and other analyses.
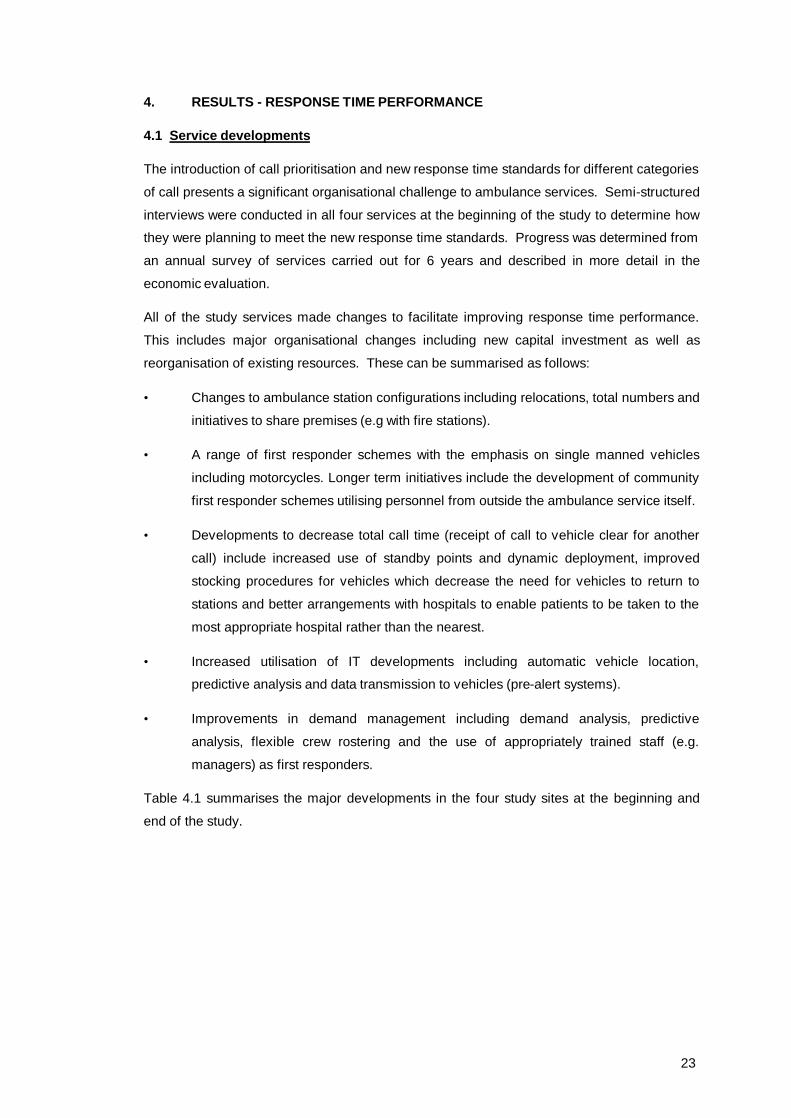
Figures 4.1 and 4.2 show the percentage of responses within 8 minutes for each service over
the 5 years. Tables 4.2 and 4.3 summarise mean response times for each service and each
year for all calls, those where a patient was left at the scene and those where a patient was
taken to hospital.
Figure 4.1 Percentage of responses recorded as ≤ 8 minutes - all calls
20
30
40
50
60
70
80
1 2 3 4 5
Study Year
% w
ithin
8 m
ins
Service 1Service 2Service 3Service 4
26
Figure 4.2. Percentage of responses within 8 minutes - calls where a patient is transported to hospital
20
30
40
50
60
70
80
1 2 3 4 5
Study year
% re
spon
ses
in 8
min
s
Service 1Service 2Service 3Service 4
Table 4.2 Change in Mean response time over 5 years for all calls, transported to hospital and left at scene
Mean response time (min:sec)
All calls Taken to hospital Left at scene
Year 1 09:21 09:19 09:29
Year 2 09:25 09:23 09:31
Year 3 08:49 08:54 08:36
Year 4 08:53 09:01 08:25
Year 5 08:18 08:22 08:05
Table 4.3 Change in Mean response time in 4 services for all calls, transported to hospital and left at scene
Mean response time (min:sec)
All calls Taken to hospital Left at scene
Service 1 08:47 08:47 08:46
Service 2 10:25 10:26 10:21
Service 3 08:29 08:30 08:27
Service 4 07:50 07:53 07:34

27
Mean response time improved over the 5 years reducing from 9 minutes 21 seconds in year
one to 8 minutes 18 seconds in year 5. However the percentage of responses within 8
minutes hardly changed. No service reached the 75% target although service 4 was close to
this in the final year. Service 1 showed the biggest and most consistent improvement with
performance increasing each year and median response time reduced by over 3 minutes in
total. Service 2 made only a marginal improvement and 3 services had a reduction in
performance before improvements began. With the exception of service 1 where the most
substantial improvement was made in the first year of the study, the biggest change in
performance was in the final study year.
Overall, there was little change in response time distribution in years 1 – 4. However, there
was a gradual increase in the proportion of calls responded to in very short times. The
proportion of calls responded to within 3 minutes increased from 3.5% in year 1 to 6.5% in
year 5 and within 5 minutes from 16.6% to 23.9% respectively.
There was no discernable difference in response time performance for calls where a patient
was transported to hospital. One of the perceived advantages of EMD systems is that the
assessment process makes more information about the call available. Control room staff can
then pass this information to ambulance crews as they are en-route to a call. The availability
of additional information may then potentially influence the speed with which a crew responds.
Although response time for patients left at scene was marginally faster than for patients
requiring hospital attendance there was some evidence that patients whose vital signs were
compromised were responded to more quickly than patients without any recorded abnormal
signs.
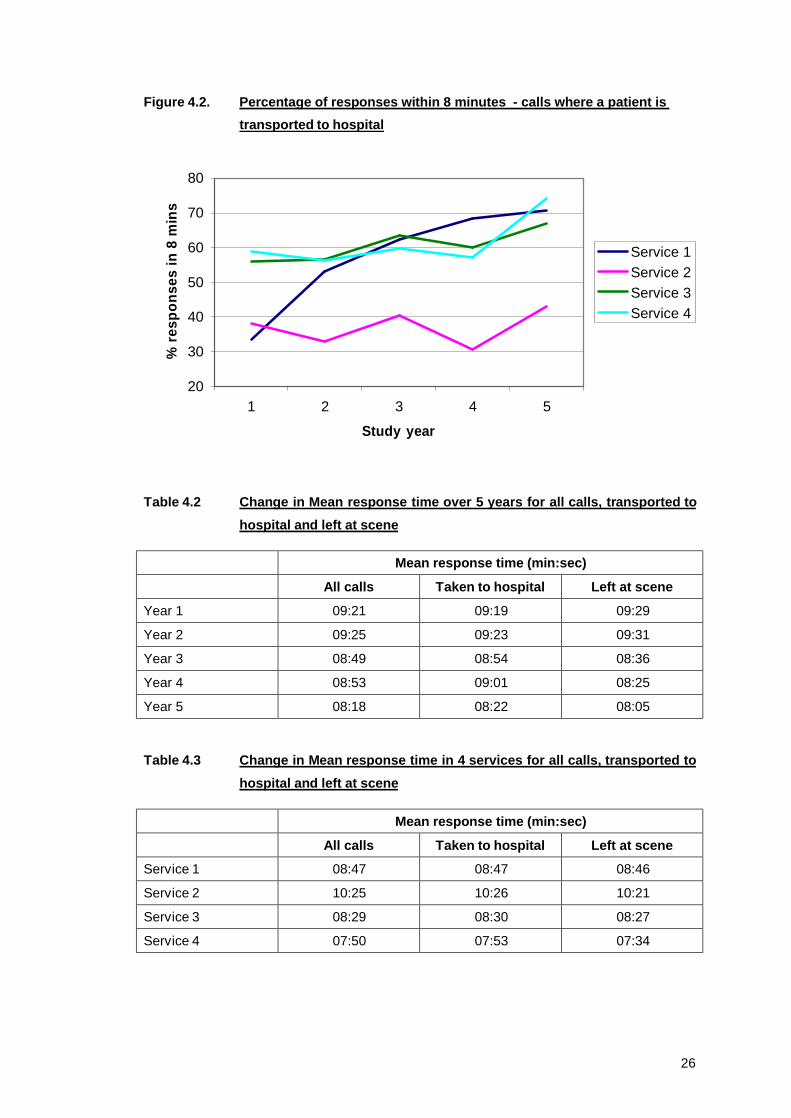
We have also examined the response time distributions for the services in terms of the
proportion of calls responded to in one minute time intervals based on the rounded values.
These are given in figure 4.3.
Response time distributions are similar for all four services although there are fewer response
times greater than 12 minutes in service 4. This is the only urban service and probably
reflects the more rural nature with longer distances of the other 3 services. Service 1
responded to 82.8% of calls within 12 minutes, service 2 73.9%, service 3 82.5% and service
4 93.2%.
28
Fig 4.3 Response time distribution for each study service, based on rounding to the nearest minute
Service 1
0
2
4
6
8
10
12
14
1 5 9 13 17 21 25 29 33
Minutes
% re
spon
ses
Service 2
0
2
4
6
8
10
12
1 5 9 13 17 21 25 29 33
Minutes
% re
spon
ses
Service 3
0
2
4
6
8
10
12
14
1 5 9 13 17 21 25 29 33
Minutes
% re
spon
ses
Service 4
0
2
4
6
8
10
12
14
16
18
1 5 9 13 17 21 25 29 33
Minutes
% re
spon
ses
29
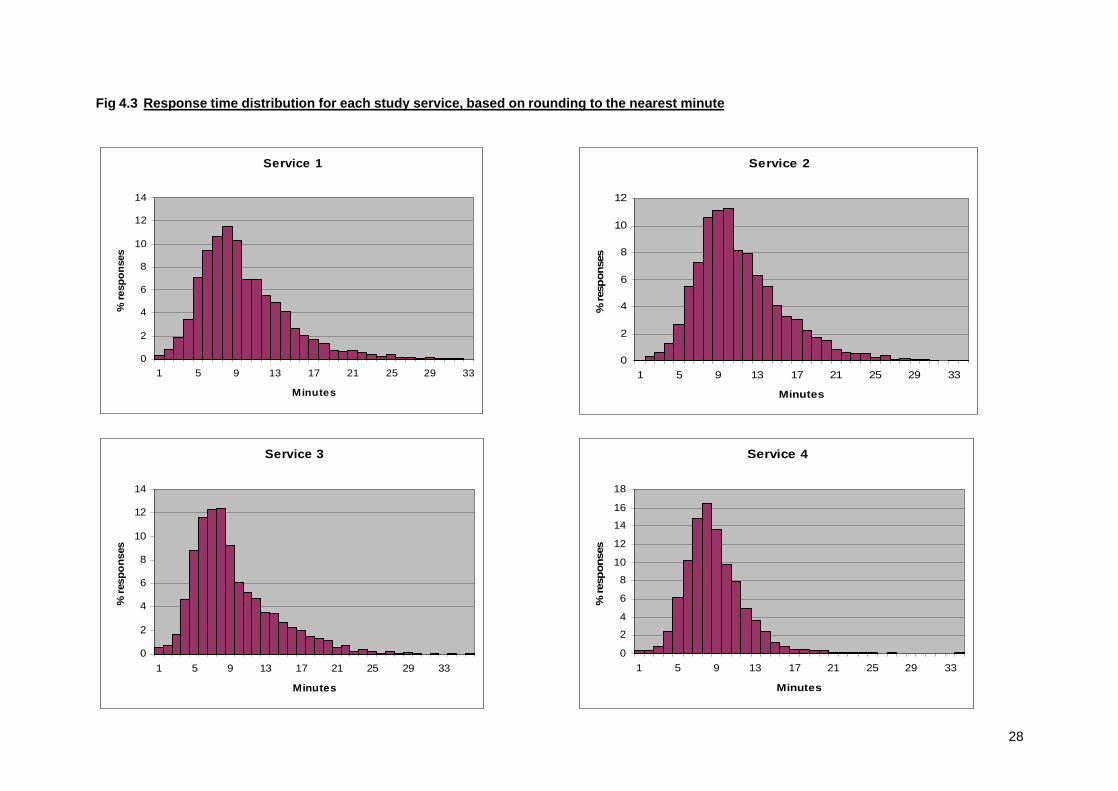
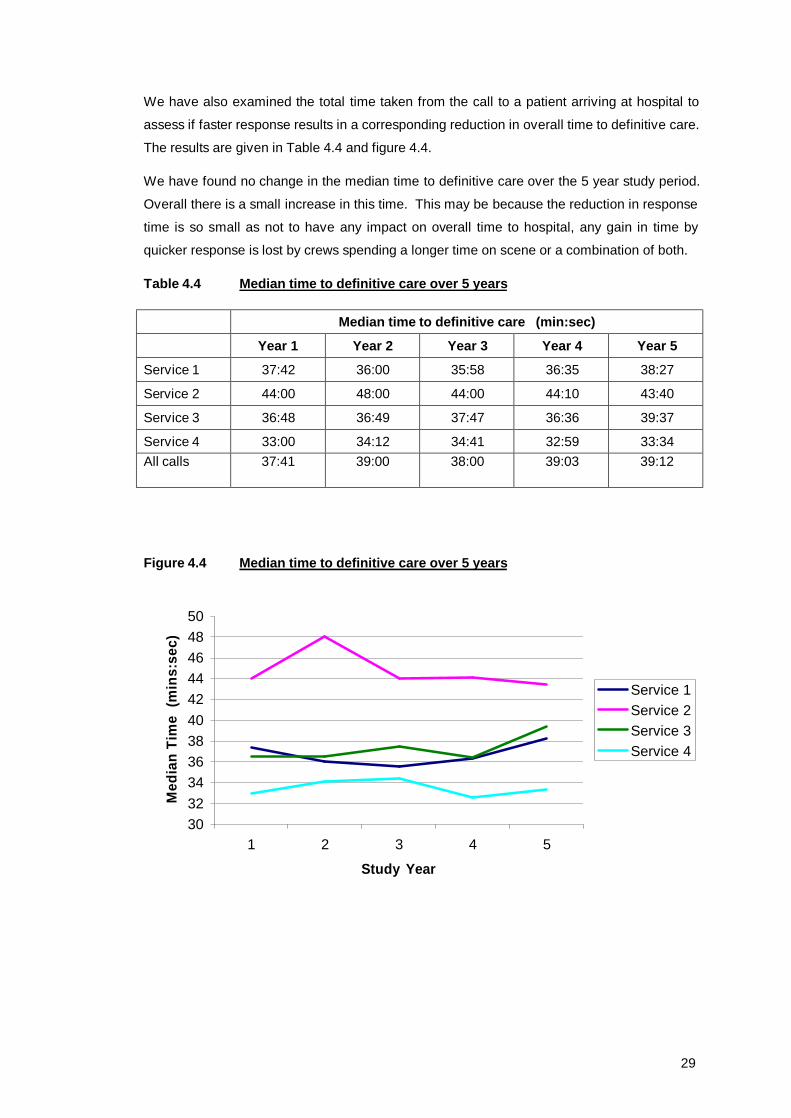
We have also examined the total time taken from the call to a patient arriving at hospital to
assess if faster response results in a corresponding reduction in overall time to definitive care.
The results are given in Table 4.4 and figure 4.4.
We have found no change in the median time to definitive care over the 5 year study period.
Overall there is a small increase in this time. This may be because the reduction in response
time is so small as not to have any impact on overall time to hospital, any gain in time by
quicker response is lost by crews spending a longer time on scene or a combination of both.
Table 4.4 Median time to definitive care over 5 years
Median time to definitive care (min:sec)
Year 1 Year 2 Year 3 Year 4 Year 5
Service 1 37:42 36:00 35:58 36:35 38:27
Service 2 44:00 48:00 44:00 44:10 43:40
Service 3 36:48 36:49 37:47 36:36 39:37
Service 4 33:00 34:12 34:41 32:59 33:34 All calls 37:41 39:00 38:00 39:03 39:12
Figure 4.4 Median time to definitive care over 5 years
3032343638404244464850
1 2 3 4 5
Study Year
Med
ian
Tim
e (m
ins:
sec)
Service 1Service 2Service 3Service 4
30
5. RESULTS - OUTCOMES
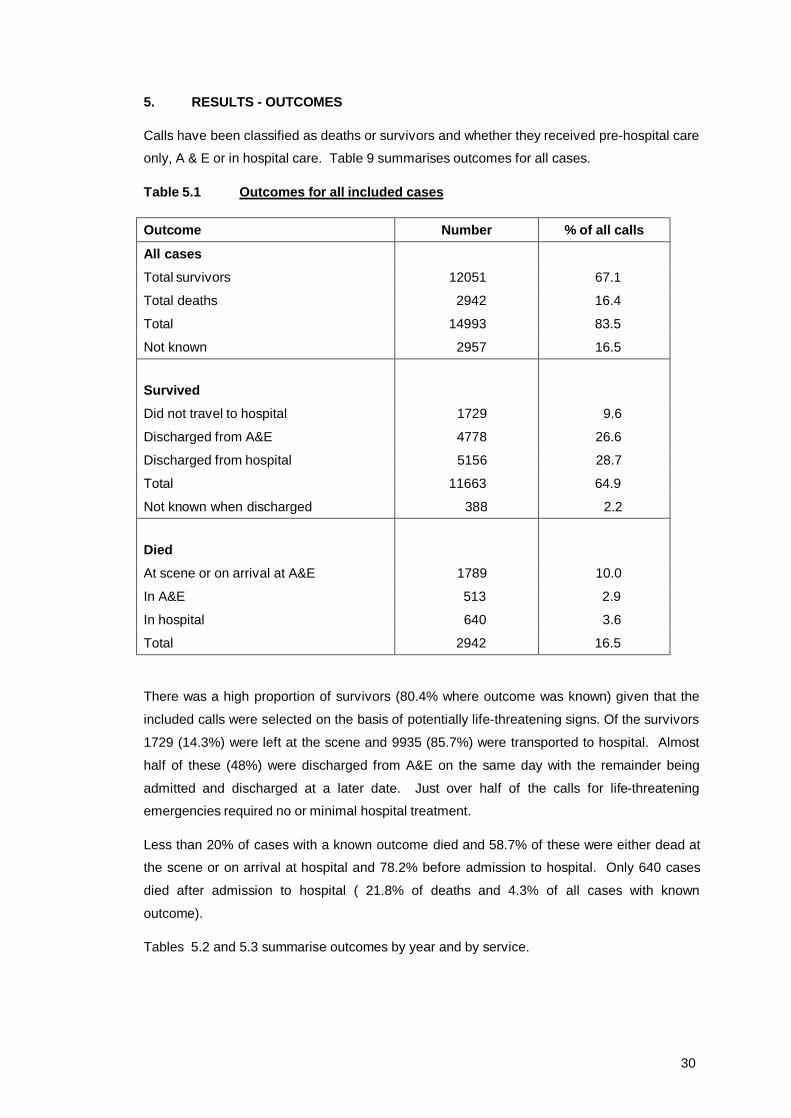
Calls have been classified as deaths or survivors and whether they received pre-hospital care
only, A & E or in hospital care. Table 9 summarises outcomes for all cases.
Table 5.1 Outcomes for all included cases
Outcome Number % of all calls
All cases
Total survivors 12051 67.1
Total deaths 2942 16.4
Total 14993 83.5
Not known 2957 16.5
Survived
Did not travel to hospital 1729 9.6
Discharged from A&E 4778 26.6
Discharged from hospital 5156 28.7
Total 11663 64.9
Not known when discharged 388 2.2
Died
At scene or on arrival at A&E 1789 10.0
In A&E 513 2.9
In hospital 640 3.6
Total 2942 16.5
There was a high proportion of survivors (80.4% where outcome was known) given that the
included calls were selected on the basis of potentially life-threatening signs. Of the survivors
1729 (14.3%) were left at the scene and 9935 (85.7%) were transported to hospital. Almost
half of these (48%) were discharged from A&E on the same day with the remainder being
admitted and discharged at a later date. Just over half of the calls for life-threatening
emergencies required no or minimal hospital treatment.
Less than 20% of cases with a known outcome died and 58.7% of these were either dead at
the scene or on arrival at hospital and 78.2% before admission to hospital. Only 640 cases
died after admission to hospital ( 21.8% of deaths and 4.3% of all cases with known
outcome).
Tables 5.2 and 5.3 summarise outcomes by year and by service.

31
Table 5.2 Patient outcomes for each study year
Year Outcome 1 2 3 4 5 Total
Survived
Did not travel to hospital
332 (10.1) 306 (9.2) 408 (15.4) 347 (12.7) 336 (11.2) 1729 (11.5)
Discharged from A&E
1051 (32.0) 1027 (30.9) 837 (31.5) 811 (29.7) 1052 (35.1) 4778 (31.9)
Discharged from hospital
1256 (38.2) 1151 (34.6) 802 (30.2) 976 (35.7) 971 (32.4) 5156 (34.4)
Discharged from A&E
1051 (32.0) 1027 (30.9) 837 (31.5) 811 (29.7) 1052 (35.1) 4778 (31.9)
Discharged from hospital
1256 (38.2) 1151 (34.6) 802 (30.2) 976 (35.7) 971 (32.4) 5156 (34.4)
Not known when discharged
32 (1.0) 131 (3.9) 85 (3.2) 56 (2.0) 84 (2.8) 388 (2.6)
Died
At scene or on arrival at A&E
365 (11.1) 420 (12.6) 334 (12.6) 342 (12.5) 328 (10.9) 1789 (11.9)
In A&E 110 (3.3) 116 (3.5) 88 (3.3) 91 (3.3) 108 (3.6) 513 (3.4)
In hospital 140 (4.3) 171 (5.1) 99 (3.7) 110 (4.0) 120 (4.0) 640 (4.3)
Total died 615 (18.7) 707 (21.4) 521 (19.7) 543 (19.9) 556 (18.5) 2942 (19.6)
Total all cases 3286 (100) 3322 (100) 2653 (100) 2733 (100) 2999 (100) 14993

32
Table 5.3 Patient outcomes for each study service
Service n (%)
Total
Outcome 1 2 3 4
Survived
Did not travel to hospital
556 (16.9) 194 (4.5) 502 (14.7) 477 (11.9) 1729 (11.5)
Discharged from A&E
904 (27.5) 1422 (33.1) 1105 (32.3) 1347 (33.7) 4778 (31.9)
Discharged from hospital
868 (26.4) 2007 (46.7) 1068 (31.2) 1213 (30.4) 5156 (34.4)
Not known when discharged
116 (3.5) 53 (1.2) 2 (0.1) 217 (5.4) 388 (2.6)
Total survived
2444 (74.3) 3676 (85.5) 2677 (78.3) 3254 (81.4) 12051 (80.4)
Died
At scene or on arrival at A&E
544 (16.6) 352 (8.2) 472 (13.8) 421 (10.5) 1789 (11.9)
In A&E 146 (4.4) 101 (2.4) 105 (3.1) 161 (4.0) 513 (3.4)
In hospital 152 (4.6) 165 (3.8) 164 (4.8) 159 (4.0) 640 (4.3)
Total died 842 (25.7) 618 (14.5) 741 (21.7) 741 (18.6) 2942 (19.6)
Total all cases
3286 (100) 4294 (100) 3418 (100) 3995(100) 14993
The distribution of outcomes remained stable over the 5 years of the study. There were some
differences between services. These are most apparent in service 2 which had a much lower
proportion of survivors who were not transported to hospital and a higher proportion who were
admitted to and subsequently discharged from hospital. In addition service 1 had a high
proportion of both deaths and survivors who were left at the scene of the incident. One
possible explanation is that the different EMD systems have different sensitivity in detecting
those cases where there is a life-threatening condition that is amenable to treatment and
there is some evidence of this in the fact that the two services with the lowest proportions of
survivors who did not travel to hospital, and the lowest proportions of deaths (services 2 & 4)
used the same EMD system (AMPDS). Other possible explanations are different policies
between ambulance services as to who should be left at scene or different hospital policies on
admission although the proportions discharged from A&E is similar for all services.
These outcomes are analysed in more detail in relation to response time in section 6 below.

33
6. RESULTS - RESPONSE TIMES AND SURVIVAL
6.1 Methods
Inclusion and exclusions
All patients attended following an A call during the study periods have been included in the
outcome analysis except
i) patients found dead at scene in whom no resuscitation was attempted.
ii) patients attended at the scene who survived but were not taken to hospital.
iii) patients who could not be followed-up because of lack of details and whose outcome
is therefore not known.
Groups i) and ii) have been excluded because we have assumed that they could not benefit
from rapid response.
Outcome
For the main analysis deaths before arrival at hospital, in A and E, or in hospital after
admission have been combined, so that the outcome being assessed is death vs. survival to
discharge. However, we have also examined deaths before admission (ie. pre-hospital + in A
and E) which may be more sensitive to response time changes.
Analysis
Crude Mortality has been modelled as a function of response time to estimate the (marginal)
benefit in terms of the reduced risk of death of improving response time by one minute. There
are three types of problem with this analysis.
Firstly, there are some missing response times, and these cases have to be excluded even
though they may not be missing at random.
Secondly, cases with long response times may have different characteristics with a different
inherent mortality risk than cases with short response times. For example, cases with long
response times may be more often in remote, rural areas with different types of incident,
population demographics and so on.
Thirdly, there is the possibility of reverse causality – in which the response times are a
function of the risk of death rather than vice-versa. This could arise if it is possible for
despatchers and drivers to act more quickly in response to calls (correctly) perceived to be
higher risk. This is not likely to happen to any great extent in our data because all these calls
were in the highest risk category, and small differences in how high the risk actually is are
very hard to gauge prior to arrival on scene.
Three strategies have been adopted to overcome these problems

34
i) Intended service analysis. Reverse causality and missing response time data can be
avoided by using an ‘intended service’ approach which is analogous to the intention-
to-treat approach in clinical trials. In this approach year is used in the analysis rather
than actual response time since response times were expected to be improving year
on year (the intended service). Analysing by year rather than response time means
that cases with missing response time data can be included and there is no possibility
of reverse causation. However, case-mix may change over time and it is still
necessary to adjust for case mix differences. Furthermore since response times
improved to a different extent in different services, analysis by service is necessary.
i) Analysis by dichotomised response time. Since all the calls were classified as A calls
they were all prioritised as needing response within 8 minutes. Considerable
pressure has been put on AS to achieve this target for 75% of category A calls.
Whilst calls might be attended to with more or less urgency if either they were going
to be responded to in less than 8 minutes or more than 8 minutes, there was no
flexibility around this threshold. Consequently it is less likely that there could be any
reverse causality around response less than or greater than 8 minutes, and we have
therefore also calculated the odds ratio of death or survival for responses ≤8 or >8
minutes.
ii) Case-mix adjustment. Both reverse causality and case-mix variation can be dealt
with to some extent by adjusting the analyses for any differences in call and patient
characteristics. We have therefore examined the relationship between outcome and
age sex service clinical category in-hours or out-of-hours weekday/weekend distance from scene to hospital.
We have adjusted the analysis of mortality vs response time for those factors with a
significant influence on outcome.
The case-mix adjusted analyses have been carried out by fitting logistic regression
models to death or survival using those covariates identified as potentially significant
influences on outcome. The fitted values from the models have also been used to
calculate the expected number of deaths, and these have been used to calculate
Standardised Mortality Ratios (SMRs) – that is the ratio between the observed and
expected number of deaths. These SMRs have been graphed and tabulated to
illustrate the results.

35
6.2 Number of cases
As reported above the outcome was known for 14993 (83.5%) of the 17950 patients included
in the study dataset. Of these 743 (5.0%) were found dead at the scene and there was no
attempt at resuscitation, and a further 2201 (14.7%) died before reaching hospital, in A and E
or in hospital (Table 6.1). Of the patients known to have survived, there were 1729 who were
attended at the scene but were not transferred to hospital because their condition did not
warrant it. Excluding these patients and those found dead at the scene there were 12521
patients with known outcomes included in the study of outcomes and response times.
Table 6.1 Numbers included in the outcomes study
Outcome N excluded N included %
Died At scene, no attempt at resuscitation 743 5.0
At scene, before A and E 1048 7.0
In A and E before admission 513 3.4
In hospital, before discharge 640 4.3
Survived Did not travel to hospital 1729 11.5
Discharged from A and E 4778 31.9
Admitted 5156 34.4
Not known disposal 386 2.6
Known outcome 2472 12521 100
Not known 2957
Total 5429 12521
6.3 Factors associated with outcome
The most important determinants of survival to discharge are the clinical condition and age of
the patient. Given these two factors we have examined the influence of time of day, day of
week, sex, service, and distance from scene to hospital (Table 6.2).

36
Table 6.2 Association between characteristics and odds of death before discharge
Characteristic Estimated odds ratio
95% CI df ∆dev1 p2
Clinical condition (see section 5) 17 5980 <0.001
Age 0 – 54 Reference 55 – 74 3.57 75 + 6.86 Missing/NK 11.0 Age3 Per year 1.03 (1.03,1.04) 1 214 <0.001
Sex Male Reference Female 1.02 (0.86,1.18) 1 0.0 p>0.54
Missing 4.03
Time of day 0800 – 1759 reference 1800 – 0759 0.84 (0.73,0.98) 1 5.4 0.02 Day of week Weekday reference Weekend 0.90 (0.76,1.05) 1 1.9 0.20
Distance from scene to hospital5
< 10kms reference
10 - 20kms 1.13 (0.92,1.43) 20 kms + 1.02 (0.81,1.27) Missing 1.03 2 1.2 0.8 Service 1. reference 2. 0.53 (0.43,0.65) 3. 0.95 (0.78,1.17) 4. 0.49 (0.40,0.61) 3 77.4 <0.001 1. ∆dev = change in deviance, approximately distributed as X2
df if there is no association with outcome.
2. p-value assuming ∆dev ~ X2. 3. 8% of cases have missing age. The average age of the known cases in the same clinical
group and service and year was imputed for them. 4. Male vs. female excluding the cases with missing sex. 5. Patients who died at the scene have been excluded from this analysis.

37
Given clinical condition and age, there was some evidence that there were still differences
between the services in outcome, but little evidence of other effects. A weak association with
time of day was found with a smaller chance of dying out-of-hours than in-hours. The small
association with sex was only due to a difference in outcomes between patients with known
sex and those with missing data, and consequently sex hasn’t been used to adjust the
outcomes for casemix.
6.4 Crude mortality
Of the 12521 patients included in this analysis of response time effects 2201 (17.6%) died,
approximately half of them before reaching hospital. The proportions dying before discharge
in each year were similar with no obvious trend (Fig 6.1).
Fig 6.1. Proportion of patients dying by year
16.717.519.318.4
16.3
0
40
1 2 3 4 5
Year
% d
ying
The proportions who died differed between services (X2 = 77.4, df = 3, p<0.001), probably
reflecting a different casemix included in the A calls reported to the study. There was no
evidence of an improvement in crude mortality over time as response times improved (Fig
6.2). Indeed in service 1 there was a dramatic leap between 1997 (15.8%) and 1999 (30.6%)
in the proportions of cases reported to the study who died - probably reflecting a change in
the way in which priority codes were allocated to calls in that service.
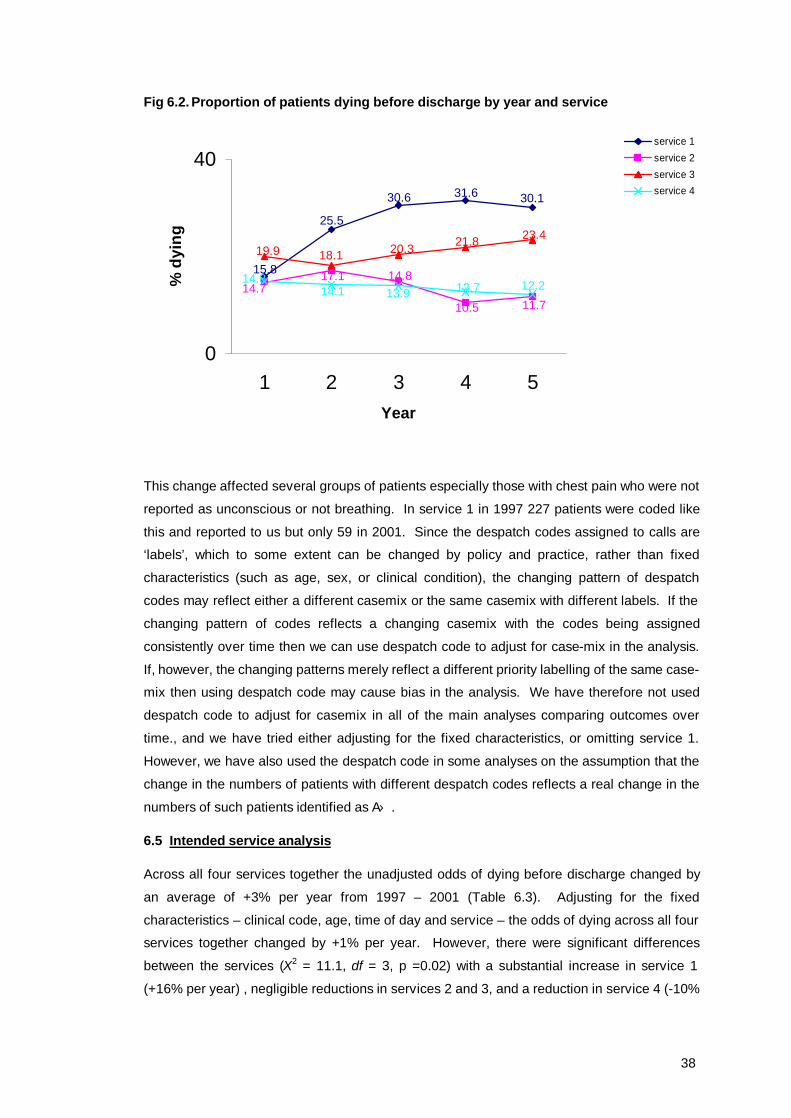
38
Fig 6.2. Proportion of patients dying before discharge by year and service
30.131.630.6
25.5
15.8
11.710.5
14.817.114.7
23.421.820.318.119.9
12.212.713.914.114.8
0
40
1 2 3 4 5Year
% d
ying
service 1service 2service 3service 4
This change affected several groups of patients especially those with chest pain who were not
reported as unconscious or not breathing. In service 1 in 1997 227 patients were coded like
this and reported to us but only 59 in 2001. Since the despatch codes assigned to calls are
‘labels’, which to some extent can be changed by policy and practice, rather than fixed
characteristics (such as age, sex, or clinical condition), the changing pattern of despatch
codes may reflect either a different casemix or the same casemix with different labels. If the
changing pattern of codes reflects a changing casemix with the codes being assigned
consistently over time then we can use despatch code to adjust for case-mix in the analysis.
If, however, the changing patterns merely reflect a different priority labelling of the same case-
mix then using despatch code may cause bias in the analysis. We have therefore not used
despatch code to adjust for casemix in all of the main analyses comparing outcomes over
time., and we have tried either adjusting for the fixed characteristics, or omitting service 1.
However, we have also used the despatch code in some analyses on the assumption that the
change in the numbers of patients with different despatch codes reflects a real change in the
numbers of such patients identified as A.
6.5 Intended service analysis
Across all four services together the unadjusted odds of dying before discharge changed by
an average of +3% per year from 1997 – 2001 (Table 6.3). Adjusting for the fixed
characteristics – clinical code, age, time of day and service – the odds of dying across all four
services together changed by +1% per year. However, there were significant differences
between the services (X2 = 11.1, df = 3, p =0.02) with a substantial increase in service 1
(+16% per year) , negligible reductions in services 2 and 3, and a reduction in service 4 (-10%

39
pa). Further adjusting these estimates for despatch code made little difference, although a
more consistent reduction of -1% to -5% was found in services 2 to 4.
Table 6.3 Estimated change in odds of dying per year
Adjusted for characteristics1 only
Service
Crude estimate
Estimates adjusted for characteristics1 and despatch code Estimates (95% CI)
1 1.22 1.13 1.16 (1.04, 1.29)
2 0.90 0.97 0.99 (0.90, 1.09)
3 1.06 0.99 1.0 (0.91, 1.10)
4 0.95 0.95 0.90 0.81, 1.01)
All 1.03 1.02 1.01 (0.96, 1.06)
Services 2, 3, 4 0.96 0.97 0.96 (0.91, 1.02)
1. Clinical code, age, and time of day.
Adjusting for the fixed characteristics, SMRs showing the ratio of the observed numbers of
deaths to the numbers predicted by the casemix adjustment model by year for all services
together are shown in Fig. 6.3, SMRs and response times in Fig 6.4, and SMRs and by
service in Fig. 6.5. There is clearly no evidence of improving response times and declining
SMRs.
As shown in Fig. 6.2 the results for service 1 probably reflect a change in prioritisation policy
between 1997 and 1999 and we have therefore re-examined these analyses. Excluding
service 1 it is estimated that there was a reduction in the odds of dying of -4% (95%CI -9%,
+2%) per year. However, there was little change in reported response times in services 2, 3
and 4 either (see Fig 6.6).
We have also examined the year-on-year change in the odds of pre--hospital death (ie. before
admission). In these analyses patients who died after being admitted to hospital are
classified as survivors. For pre-hospital death the crude odds changed by an average of
+4.5% per year, and the adjusted odds by +4.9%. Excluding service 1 the crude odds fell by -
0.9% per year, but the adjusted odds increased by +3.0%.
Thus, there is no evidence in the data that outcomes improved over the five study years.

40
Fig 6.3 SMR (and 95% confidence interval) by year for all services
98.2102.6
98.9 98.1101.7
80
100
120
1 2 3 4 5
Year
SMR
Fig 6.4 SMR and response performance by year
98.2
102.6
98.9 98.1101.7
0.490.54
0.48
0.480.59
80
100
120
1 2 3 4 5
Year
SMR
0
0.5
1
proportion response ≤ 8 mins
Fig 6.5 SMRs by service and year
80.0
100.0
120.0
1 2 3 4 5Year
SMR service 1
service 2service 3service 4
Fig 6.6 SMR and response time performance in services 2, 3, and 4 by year
102
95
101103
98
0.570.46
0.470.52
0.52
80
100
120
1 2 3 4 5
Year
SMR
0
0.5
1
proportion response ≤ 8 mins

41
6.6 Service received analysis
Number of cases
The effect of the actual response time has been estimated by examining the probability of
dying in relation to the response time achieved, adjusting for the same casemix factors used
above. Other differences in casemix between services and over time have also been
accounted for in the model by fitting a term for each service by year. In effect the model
examines the relationship between response time and the risk of dying within each service
and year cohort. Thus the data omitted from service 1 because of a possible change in
prioritisation procedures and hence casemix can be included in this analysis.
However, there are also n=202 cases with missing response times that have to be excluded,
leaving n=12319 cases for analysis.
Mortality
Death before discharge is plotted against response time in Fig 6.7. Mortality appears to fall
for response times between 1 and 8 minutes and thereafter appears steady at about 16%.
Overall, there is an estimated 1.5% decline in crude mortality per minute increase in response
time. However, adjusting for casemix this effect is reversed, and there is a non-significant
increase of +0.4% (95% CI -1.1%, +2.0%) in mortality for each minute increase in response
time.
Fig 6.7 Death before discharge by response time
0.09000.11000.13000.15000.17000.19000.21000.23000.25000.27000.2900
0.00 4.00 8.00 12.00 16.00 20.00 24.00
Response time
% d
ying
The SMR adjusted for the characteristics clinical condition, age, time of day, year and service
is plotted against response time in Fig 6.8, which also shows the lower 95% confidence limit
(LCI) and the upper limit (UPCI).
The adjusted odds of dying when the response time was greater than 8 minutes were +1.4%
higher (-13%, + 18%) than when it was less than or equal to 8 minutes. Using the cut-off

42
recommended by Pons(ref) the adjusted odds of dying when the response time was greater
than 4 minutes compared to ≤ 4 minutes were +4.1% (-22%, +39%).
Figure 6.8 SMR adjusted for characteristics by response time
0.000.160.320.480.640.800.961.121.281.441.60
0.00 4.00 8.00 12.00 16.00 20.00 24.00
Response time
SMR
LCIYMUPCISMR
Repeating these analyses for deaths before admission to hospital, there was a similar 1.5%
decline in crude mortality per minute increase in response time. Adjusting for case-mix,
however, there was weak evidence of a +2.3% (95% CI: 0.0%, +4.7%) increase in death
before admission for each extra minute it took to respond.
The adjusted odds of death before admission when the response time was > 8 minutes
compared to when it was ≤ 8 minutes were +9.7% (-13.2%, +37.1%), and when the response
time was > 4 minutes the odds were +49.8% (+0.5%, +223%) higher than when the response
time was ≤ 4 minutes.
Despatch groups
One explanation for why there is no discernible relationship between response time and
survival is that the benefit of rapid response occurs only for a very small number of patients,
and any effect is being balanced by despatchers and crews occasionally being able to
respond faster to those most at risk. We know that this reverse causality might be happening
to some extent because there is a very small but significant amount of heterogeneity between
clinical groups in their mean response times (F17, 12301 = 6.3, p<0.001) with low response times
in cardiac arrest and asphyxia for example, and higher times in patients with non-specific
signs and symptoms. Furthermore, there are significantly shorter response times for patients
unconscious, not breathing, and/or with no pulse at the time of the crew arriving on scene
compared to patients whose vital signs weren’t compromised. Of course reverse causality of

43
decreasing response times being associated with an increasing risk of death merely serves to
show how well despatchers and crews identify those most at risk even within clinical groups.
One possible way to take this into account is to examine the actual despatch codes issued by
despatchers at the time of the call. These codes are not the same for all cases in each
clinical group, indicating that a different response may be being made to different cases within
each group.
Given the clinical group, age, sex, time of day and year and service, the despatch code is a
very significant additional predictor of survival to discharge (X2 = 598, df = 25, p<0.001), and
adjusting the regression of survival on response time for the despatch code as well as the
other characteristics there is some weak evidence for an increase of +1.4% (95%CI: -0.3%,
+3.1%) in the odds of dying for each minute increase in response time. The estimated
increase in the odds of dying for response times over 8 minutes compared to response times
less than 8 minutes is now +7.5% (-8.7%, +26.5%). The SMR adjusted for despatch code as
well as the fixed characteristics is plotted against response time in Fig 6.9.
Fig 6.9 SMR adjusted for despatch code as well as other characteristics by response time
0.00
0.16
0.32
0.48
0.64
0.80
0.96
1.12
1.28
1.44
1.60
0.00 4.00 8.00 12.00 16.00 20.00 24.00
Response time
SMR
LCIYMUPCISMR
44
7. RESULTS - CLINICAL GROUPS AND OTHER OUTCOMES
7.1 Introduction
Overall there is little evidence in the data that faster response times have led to better
outcomes. This is probably due to several factors. For example,
1) Reported response times only improved slightly over the five year period and real
response time improvements may have been even smaller. Substantial
improvements were only reported in Service 1, and this service also had substantial
increases in crude mortality during the early years of the study.
2) Response times can show ‘reverse causality’ in which faster responses are delivered
to those most at risk, even with A calls.
3) The number of patients who can benefit from fast response is actually very small and
the benefit in this small group is being ‘lost’ in the large group who do not need (ie.
have no capacity to benefit from) fast response.
The latter point suggests that it might be helpful to examine response time benefits in
particular groups of patients in whom there may be capacity to benefit and this is done below.
7.2 All clinical groups
Overall, there was only very weak evidence of improving outcomes with faster response
times. Adjusting the raw data for clinical group, despatch code, age, time of day, service and
year using a logistic regression model with death at any time as the outcome, the estimated
change in the odds of dying per minute faster response time was -1.4% (95% CI +0.3%, -
3.1%). The estimated improvement in the odds of dying with responses ≤8 minutes versus
responses over 8 minutes was -7.5%(+8.7%, -26.5%).
The estimated odds of dying with response times over 8 minutes compared to ≤8 minutes are
shown in Table 7.1 estimated for each clinical category separately. There was no reliable
evidence of an improvement in outcome with short response times in any of these groups.
Indeed for asphyxiation there was some evidence of an inverse relationship. In the crude
data there were 2/14 (14.3%) deaths due to asphyxiation at response times >8 mins and
15/36 (41.7%) at response times ≤8 mins. There was a large estimated benefit in out of
hospital cardiac arrest (OHCA) with no other diagnosis with the odds of surviving doubling for
response time ≤8 mins, but because there were few survivors there was no robust evidence
of benefit. In fact, there were many other patients who suffered an OHCA, but who had other
cardiac diagnoses such as MI recorded. We have therefore examined the effect of changing
response times separately in all OHCAs below.
Other groups in whom there is capacity to benefit include trauma and severe haemorrhage
(which includes ruptured aortic aneurysms for example). In neither case was there evidence

45
of benefit, although both groups had an estimated 25% increased chance of dying with longer
response times. These groups are also examined in more detail below.
Table 7.1 Effect of slow response on survival by clinical group
Clinical Group Estimated odds of dying with response
>8 minutes
(95% CI)
1. Cardiac arrest (no other diagnosis found) 2.2 (0.60, 8.0)
2. Confirmed MI 1.0 (0.65, 1.54)
3. Other cardiac disease 0.72 (0.48, 1.06)
4. Chest pain ? cause 1.05 (0.36, 3.02)
5. Respiratory disease 0.75 (0.44, 1.28)
6. Respiratory symptoms1 - -
7. Asphyxia 0.16 (0.03, 0.90)
8. Injury/Trauma 1.27 (0.57, 2.83)
9. Poisoning 1.01 (0.22, 4.74)
10. Serious haemorrhage 1.28 (0.44, 3.72)
11. Stroke 1.21 (0.83, 1.78)
12. Collapse unresponsive 1.63 (0.88, 3.02)
13. Fits/Convulsions 1.37 (0.08, 32.8
14. Diabetes related 0.43 (0.04, 5.2)
15. Psychiatric1 - -
16. Other diagnosis 1.62 (0.94, 2.78)
17. Other signs/symptoms 0.69 (0.22, 2.13)
18. Missing/Not known 1.45 (0.92, 2.28) 1. There were too few deaths in these groups to estimate the OR.
7.3 Out-of-hospital cardiac arrest
A total of 1258 patients in whom there was attempted resuscitation were classified by the
attending paramedics as having an out-of-hospital cardiac arrest. For most of these patients
no (other) clinical diagnosis was found in A and E or hospital notes, usually because the
patient died before admission into hospital. However, 80 patients had a non-cardiac
diagnosis recorded and these patients were excluded from the analysis (see Table 7.2). No
outcome was found for a further 17 cases, leaving 1161 patients in the main analysis.
Epidemiology
The median age of the patients was 71 (IQR 60 to 79); just over two-thirds were male
(787/1148, 13NK). 999 calls for arrests which resulted in attempted resuscitation were about
twice as common during the day as during the night and they happened fairly evenly
throughout the day, though the busiest period was in the morning from 0900 – 1159 (see Fig.
7.1).

46
Table 7.2 Clinical diagnosis of out-of-hospital cardiac arrests
N % Cardiac disease Confirmed MI 46 3.7 Other cardiac disease 28 2.2 Non Cardiac disease Injury 7 0.5 Asphyxia 10 0.8 CVA 9 0.7 Other haemorrhage 54 4.3 No clinical diagnosis 11041 87.8 All 1258 100.0 1. Of these, 17 had a missing outcome.
Fig 7.1 Time of day of call for cardiac arrests
0
20
40
60
80
0.00 4.00 8.00 12.00 16.00 20.00
Hour
Freq
uenc
y
Survival
Overall 30 (2.6%) of the 1161 cardiac arrest patients survived to hospital discharge, which is
typical of that reported in the UK though much less than has been reported elsewhere, most
notably in Seattle, USA.
Crew witnessed arrests
Not all of the 1161 patients had an ambulance called because they had arrested. In 58 cases
the arrest occurred after the crew arrived at the patient. Eight of these 58 patients survived
(13.8%) compared to just 19 of the 1054 patients (1.8%) whose arrest was not witnessed by
crews (Table 7.3). We don’t know the time of arrest for these patients and hence cannot
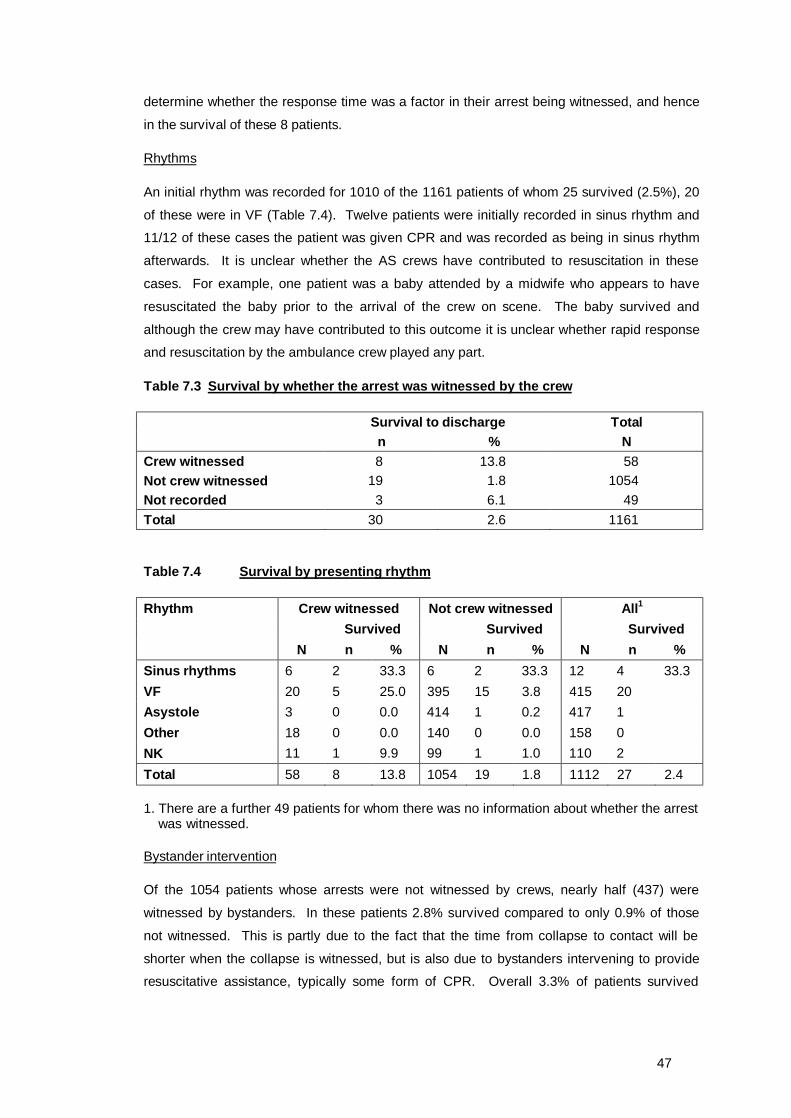
47
determine whether the response time was a factor in their arrest being witnessed, and hence
in the survival of these 8 patients.
Rhythms
An initial rhythm was recorded for 1010 of the 1161 patients of whom 25 survived (2.5%), 20
of these were in VF (Table 7.4). Twelve patients were initially recorded in sinus rhythm and
11/12 of these cases the patient was given CPR and was recorded as being in sinus rhythm
afterwards. It is unclear whether the AS crews have contributed to resuscitation in these
cases. For example, one patient was a baby attended by a midwife who appears to have
resuscitated the baby prior to the arrival of the crew on scene. The baby survived and
although the crew may have contributed to this outcome it is unclear whether rapid response
and resuscitation by the ambulance crew played any part.
Table 7.3 Survival by whether the arrest was witnessed by the crew
Survival to discharge Total n % N Crew witnessed 8 13.8 58 Not crew witnessed 19 1.8 1054 Not recorded 3 6.1 49 Total 30 2.6 1161
Table 7.4 Survival by presenting rhythm
Rhythm Crew witnessed Not crew witnessed All1 Survived Survived Survived N n % N n % N n % Sinus rhythms 6 2 33.3 6 2 33.3 12 4 33.3 VF 20 5 25.0 395 15 3.8 415 20 Asystole 3 0 0.0 414 1 0.2 417 1 Other 18 0 0.0 140 0 0.0 158 0 NK 11 1 9.9 99 1 1.0 110 2 Total 58 8 13.8 1054 19 1.8 1112 27 2.4 1. There are a further 49 patients for whom there was no information about whether the arrest was witnessed.
Bystander intervention
Of the 1054 patients whose arrests were not witnessed by crews, nearly half (437) were
witnessed by bystanders. In these patients 2.8% survived compared to only 0.9% of those
not witnessed. This is partly due to the fact that the time from collapse to contact will be
shorter when the collapse is witnessed, but is also due to bystanders intervening to provide
resuscitative assistance, typically some form of CPR. Overall 3.3% of patients survived

48
whose collapse was witnessed and who were given bystander CPR compared to 2.1% who
weren’t given CPR (Table 7.5).
Table 7.5 Bystander CPR
Survived Bystander witnessed
Bystander CPR n %
Total
Yes Yes 8 3.3 240
No 4 2.1 190
No Yes 2 1.1 188
No 3 0.8 366
Not known Yes 1 8.3 12
No 0 0.0 32
Of course the benefits of bystander CPR are even more evident for patients who were found
in VF at the time of contact, in whom 5.4% survived (Table 7.6).
Table 7.6 Bystander CPR in patients found in VF
Survived Bystander witnessed
Bystander CPR n %
Total in VF
Yes Yes 7 5.4 129
No 3 3.3 90
No Yes 2 3.2 62
No 2 2.4 83
Not known Yes 1 16.7 6
No 0 0.0 13
Response times
In the 1054 patients whose arrests were not witnessed by crews after they had arrived on
scene, 19 patients (1.8%) survived. The survival rates by response time are shown in Fig 7.2.
Survival shows the expected pattern with survival worsening with lengthening response time.
However, there were 4 survivors at response times between 8 and 12 minutes. Examining
the effect of response time in patients found in VF (Fig 7.3) shows that all the survivors at
longer response times were in VF. It also shows that short response times under 6 minutes
can lead to a survival chance over 5%. In fact 9/62 (14.5%) of patients in VF attended within
6 minutes who had bystander CPR survived (Fig 7.4), illustrating the possibilities for an
effective emergency care system to make a difference in these patients.

49
Fig 7.2 Survival in OHCA, by response time
0.0%
1.0%
2.0%
3.0%
4.0%
5.0%
≤2 ≤4 ≤6 ≤8 ≤10 ≤12 ≤14 14+
Response time
% s
urvi
val
n=1n=4
n=3n=3
n=7
n=1
Fig 7.3 Survival in OHCA of patients in VF, by response time
0.0%
2.0%
4.0%
6.0%
8.0%
10.0%
≤2 ≤4 ≤6 ≤8 ≤10 ≤12 ≤14 14+
Response time
% s
urvi
val
n=1
n=63
n=33
n=13
n=33
n=13
Fig 7.4 Survival of OHCA patients found in VF who had bystander CPR, by response time
0.0%5.0%
10.0%15.0%20.0%25.0%30.0%
≤2 ≤4 ≤6 ≤8 ≤10 ≤12 ≤14 14+
Response time
% s
urvi
val
n=33
n=13
n=13
n=5
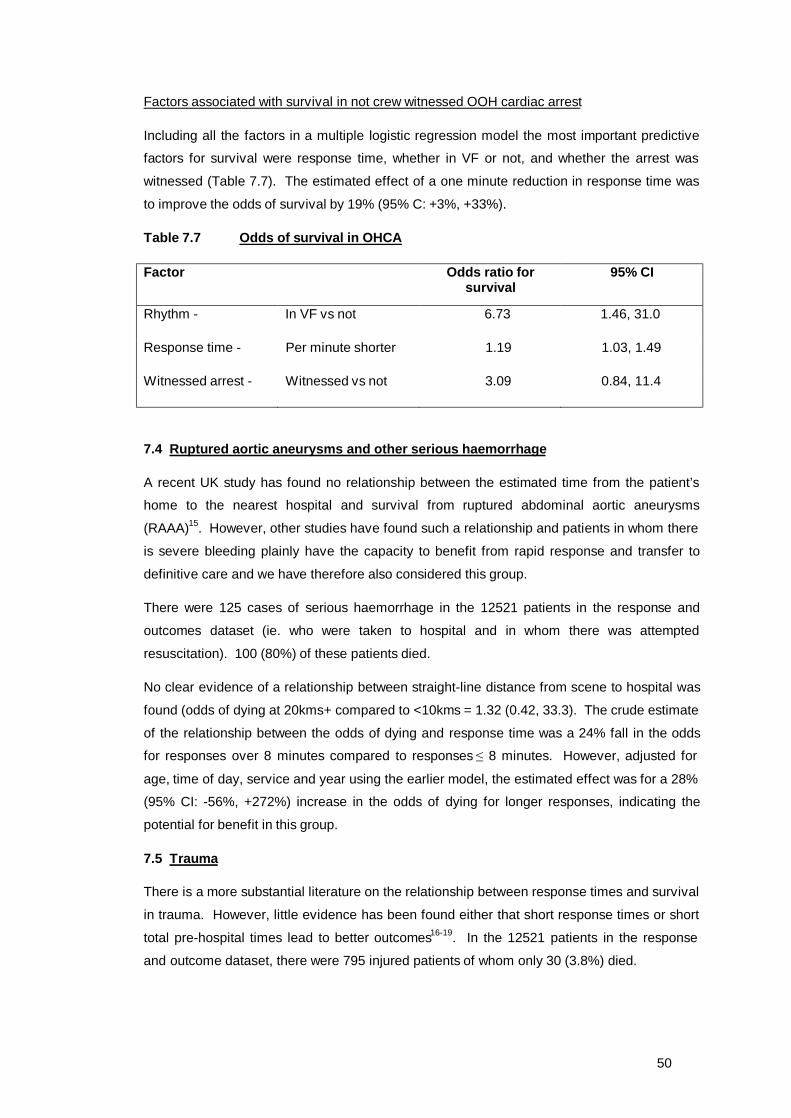
50
Factors associated with survival in not crew witnessed OOH cardiac arrest
Including all the factors in a multiple logistic regression model the most important predictive
factors for survival were response time, whether in VF or not, and whether the arrest was
witnessed (Table 7.7). The estimated effect of a one minute reduction in response time was
to improve the odds of survival by 19% (95% C: +3%, +33%).
Table 7.7 Odds of survival in OHCA
Factor Odds ratio for survival
95% CI
Rhythm - In VF vs not 6.73 1.46, 31.0
Response time - Per minute shorter 1.19 1.03, 1.49
Witnessed arrest - Witnessed vs not 3.09 0.84, 11.4
7.4 Ruptured aortic aneurysms and other serious haemorrhage
A recent UK study has found no relationship between the estimated time from the patient’s
home to the nearest hospital and survival from ruptured abdominal aortic aneurysms
(RAAA)15. However, other studies have found such a relationship and patients in whom there
is severe bleeding plainly have the capacity to benefit from rapid response and transfer to
definitive care and we have therefore also considered this group.
There were 125 cases of serious haemorrhage in the 12521 patients in the response and
outcomes dataset (ie. who were taken to hospital and in whom there was attempted
resuscitation). 100 (80%) of these patients died.
No clear evidence of a relationship between straight-line distance from scene to hospital was
found (odds of dying at 20kms+ compared to <10kms = 1.32 (0.42, 33.3). The crude estimate
of the relationship between the odds of dying and response time was a 24% fall in the odds
for responses over 8 minutes compared to responses ≤ 8 minutes. However, adjusted for
age, time of day, service and year using the earlier model, the estimated effect was for a 28%
(95% CI: -56%, +272%) increase in the odds of dying for longer responses, indicating the
potential for benefit in this group.
7.5 Trauma
There is a more substantial literature on the relationship between response times and survival
in trauma. However, little evidence has been found either that short response times or short
total pre-hospital times lead to better outcomes16-19. In the 12521 patients in the response
and outcome dataset, there were 795 injured patients of whom only 30 (3.8%) died.

51
The crude estimate was for a 6% lower odds of dying with response times over 8 minutes.
Adjusted for age, time of day, service and year the estimated odds of dying before discharge
were 27% higher for longer response times. This estimate was adjusted further for injury
severity using the ISS score, and the estimated odds of dying with response times over 8
minutes compared to under 8 minutes were -1.5% lower (-59.3%, +138%).
7.6 Summary
We have considered four clinical groups in which we expected that there might be some
discernible benefit from faster response – asphyxia, cardiac arrest, serious haemorrhage, and
trauma. There was no evidence of any significant effect in trauma, serious haemorrhage, or
asphyxia although there was an indication that there may be a potential benefit for patients
with serious haemorrhage. However, for out-of-hospital cardiac arrest we found that with
other factors taken into account a one minute reduction in response time was estimated to
increase the odds of survival to discharge by 19%.
We have also found that the arrival of a crew prior to arrest may be one of the most beneficial
interventions an ambulance service can make. In patients who have already arrested and
whose collapse is witnessed by bystanders even rapid response within a few minutes only
results in about 5 – 10% of patients being resuscitated and surviving to discharge. If the
patient is in VF and bystanders provide CPR, results may be better than this. Nevertheless,
quick response to patients in severe acute crushing chest pain may enable rapid reperfusion
preventing arrest in some patients and in those that do arrest in the presence of the crew 14%
may still be resuscitated to survive to discharge.
52
8. ECONOMIC EVALUATION
The economic evaluation of the response time policy aimed to estimate the costs of improving
response times and match these with improvements in mortality to produce an incremental
cost per life-year saved. The estimation of costs was to be split into two separate
components; pre-hospital care, and hospital care. The costs of pre-hospital care were
estimated using the four study ambulance services as case studies, with data collected via
interviews with Trust staff. This was supplemented by an analysis of national ambulance
service data collected through annual surveys. The costs of hospital care were to be
estimated by patient-level costing of the study data collected for the main part of the study.
Together, these data would give an estimate of the costs associated with the changes seen
over the study period. Further analysis was also planned to examine the costs of improving
response times further, by extrapolating the study findings.
8.1 Case studies
This work aimed to directly identify and analyse changes in ambulance service provision
specifically undertaken to reduce response times. The case studies were undertaken in West
Midlands, Berkshire, Essex and Derbyshire (now part of East Midlands Ambulance Service).
These four areas were chosen because they were about to implement priority dispatch
systems: that is, the prioritisation of all 999 calls into categories based on their level of
medical urgency.
Methods
Interviews with relevant ambulance service personnel were conducted in the four ambulance
Trusts in order to gather more detailed data on some aspects of changes in service. In
particular, the interviews attempted to: identify all planned service changes; identify the
reasons for the changes; identify all possible resource consequences of these changes; and
gather qualitative data on the effects of changes in service provision e.g., on-the-job training
which reduces time off the road for ambulance crews.
Service changes and reasons for the changes were documented to ensure transparency.
This was to reduce subjectivity in assessing the impact of the changes on improved response
times. For example, extra crews may primarily be aimed at reducing response times but
might also be required to meet increased demand.
Interviews were first conducted in the summer of 1998 and they focused on changes in
service provision during the financial year April 1997 to March 1998. A second round of
interviews was held in early 2001 asking about changes in service provision between April
1998 and March 2000.

53
Results – Service 1
Between April 1997 and March 1998 the largest item of resource use in Service 1 was the
investment in information technology which was introduced in order to assist with demand
management (Table 8.1). Other service developments were aimed at maximising the number
of crews and vehicles on the road e.g. changes to vehicle servicing and staff rotas, and these
required few resources.
In the second period, April 1998 to March 2000 stand-by locations were introduced (Table
8.2). This development was facilitated by use of system status management technology as
well as local knowledge. Planning and organising the stand-by locations was done in house.
Results – Service 2
In the first study period, only small investments were made with respect to improving
response times, with the only large initiative being funded through winter pressure monies
(Table 8.3). The other changes were funded within budget, and as such represent
improvements in efficiency.
Between April 1998 and March 2000, an investment of £2.2 million was made to recruit staff
and purchase vehicles. This was funded by local purchases and savings identified within the
service (Table 8.4). Other initiatives also continued.
Results – Service 3
From the start of the study period April 1997, Service 3 invested in increasing capacity with
the purchase of motorbikes, implementation of voluntary first responder schemes and
utilisation of some managers as first responders (Table 8.5). Other work also went into
reducing pressure on the A&E vehicles by minimising the impact of Category C and non-
urgent workload. Other smaller investments were made to improve call handling and vehicle
allocation (e.g. predictive analysis and standby points).
In the second study period, April 1998 to March 2000, capacity was increased substantially
following the investment of £1.1 million (Table 8.6). This investment followed research by
ORH that identified this sum as the amount required to meet the 75% Category A target. This
was spent on crews and vehicles. Other smaller initiatives were also expanded or continued.
Results – Service 4
Table 8.7 below shows that most of the service developments that took place between April
1997 and March 1998 were aimed at improving technical efficiency: that is, improving
response times within existing budget. Very few of the changes that were identified involved
increased spending and those that did were relatively low cost. During this period, according
to Trust personnel, the service development that had the biggest impact on improving
response times was the introduction of stand-by locations.
54
Table 8.8 identifies further changes in the service in the two-year period between April 1998
and March 2000. In this period as well as improving efficiency through such activities as
reviewing stand-by locations and using more staff as first responders substantial increases in
operational staff and vehicles were directly targeted at reducing response times.
Discussion
All services implemented multiple initiatives to improve response times, and showed great
imagination in identifying ways of attempting to achieve this. Many of the changes,
particularly in the early years of the study, were financed within budget, and as such improved
the efficiency of operation. In only two services were large investments made in operational
capacity (Services 2 and 3).
Common across the four services were improvements in call handling and vehicle location.
Most services also tried to reduce pressures on the A&E service by handling urgent and
Category C calls differently, and increasing capacity by changes to working practices (e.g.
through changes in rotas, job training, operationalising supervisors). First responder
schemes were also instituted in two of the services, as a way of increasing capacity.
However, several problems were encountered with this approach. Firstly, it was difficult to
identify changes that were implemented with the sole intention of improving response times.
Within all services, call volume was increasing, and so many changes had the dual role of
improving response times and meeting increased call volume. These two aspects of service
delivery are inseparable. Consequently, identifying the ‘pure’ cost of improved response
times is not possible using this method.
Secondly, identifying the relevant initiatives was subjective. The interconnectedness of
ambulance services meant that initiatives away from Category A calls, were frequently cited
as helping Category A response times, e.g. increasing the capacity of PTS.
Thirdly, many of the initiatives were undertaken within budget, by reallocating resources and
generating cost savings. This made it difficult to estimate costs, as budgets had not changed,
and business plans or contracts had not been drawn-up to justify the service initiative. Only in
rare cases was a cost readily identifiable with a service development (e.g. use of winter
pressure monies, or large investments in staff/vehicles). All other costs had to be pieced
together from various sources, taking up a lot of Trust time.
One consequence of these difficulties is that producing a total cost of changes implemented
to improve response times was not sensible. The data collected, however, gives a clear
picture of ambulance service ingenuity in implementing diverse changes in service to improve
response times within budget. Methodologically, it also highlights the need for an approach
that can disentangle changes in response times and changes in workload.
55
8.2 National survey of costs and response times
Identifying the costs associated with improving response times within the four services is
limited by our ability to control for confounding factors, most notably, increases in volume.
With a large enough sample, this can be done statistically through regression analysis; an
approach known as cost function analysis within the economics literature.
Methods
The key data for the analysis are cost per case and response times. Volume of calls are
included as economic theory suggests that this will heavily influence average costs.
Response time and call volume were collected from Ambulance Service Statistical Bulletins
and cost data from Trust Financial Returns, for the years 1997/8 through to 2003/4. Cost
data were adjusted to 2003/4 prices using the Hospital and Community Health Service Pay
and Prices Index, where available, and using General Domestic Product deflators elsewhere.
Of note, is that during the period studied, there were several mergers;
• Derbyshire, Nottinghamshire and Leicestershire became East Midlands Ambulance
Service (EMAS).
• Cleveland, Humberside and North Yorkshire became Tees, East and North Yorkshire
Ambulance Service (TENYAS).
• Durham and Northumbria became North East Ambulance Service (NEAS).
• Shropshire merged into West Midlands Ambulance Service.
The new services, and their pre-existing constituent services, were coded as separate
services.
Cross-sectional time-series data (or panel data) can pose some problems with estimation. A
simple pooled analysis of the data, for instance, does not take account of differences in the
underlying data generating process over time or service specific effects. The model used
therefore included effects to describe the variation between services, plus year dummies to
allow for changes in the productive process over time.
The analysis specified cost per incident attended as the dependent variable, with response
times, call volume, call volume squared and year as the independent variables. An additional
set of analyses were undertaken on the subset of services that were not involved in mergers.
Results
The data shows large increases in the percentage of category A calls responded to in less
than 8 minutes, although this is not noticeable until 2001/2 (Table 8.9). Also of note is the
steady increase in activity over the time period, and the reduction in cost per case. The
increase in the number of Ambulance Services contributing data (n) over time reflects the

56
introduction of priority despatch systems into the different Ambulance Trusts, which are
required to categorise calls into A or B.
The full model is based around a specification that reflects the study question (i.e. the impact
of response time on costs) and theoretical considerations (e.g. the common existence of
economies of scale). This shows a positive, but statistically insignificant relationship between
the main response time target – the proportion of category A calls responded to in under 8
minutes (Table 8.10, Model 1). The also appears to be a ‘u’-shaped cost curve, with Trusts
experiencing increasing, then decreasing returns to scale.
Overall the models do not produce any statistically significant coefficients with respect to the
response times, which casts doubt on the existence of clear relationships within the data.
This uncertainty is also shown by a change in the sign on ‘cata8’, when a more parsimonious
formulation is used (i.e. Model 2).
The analyses on the subset of services that did not undergo mergers has little effect on the
specification of the models other than to produce positive coefficients on the ‘cata8’ variable
for both models.
Discussion
The models show a clear relationship between volume of calls and cost per case, but not
response time. This is thought to be a product of a large amount of variability in the data,
which in turn reflects large differences that exist between services in terms of costs. Another
reason for a clear relationship not appearing is that some improvements in response times
were achieved without increases in budgets, but through efficiency gains or shifts within the
budget. It was expected that the year dummies would play an important role in describing
these changes in the underlying production function that have taken place over the time
period, but these were not statistically significant. Alternative specifications have been used
to try and take into account these changes, and as a result, clarify the relationship between
cost and response time. However, the data required for these analyses (e.g. unit hour
utilisation) are poor, and produce only minor changes to the results.
The coefficient on ‘cata8’ in Model 1 indicates a 27.1 pence rise in cost per call for each
percentage point increase in response time; using mean 2003/4 activity, this corresponds to
around £37,000 increase in the average Ambulance Trust’s annual costs. The twenty
percentage point increase in the Category A response times over the period shown in Table
8.1 therefore corresponds to a £750,000 increase per annum. The lack of statistical
significance on this coefficient, and its sensitivity to changes in specification, however, mean
that we should be extremely cautious about this interpretation. Alternative specifications
estimate cost savings from improved response times (Model 2) to £1.7 million per annum
(Model 4).

57
8.3 Patient-level costing of hospital care
This part of the study aimed to estimate a cost associated with each patient included in the
main part of the study, by applying costs to the following patient categories; (i) deaths before
arrival at hospital, (ii) deaths at hospital before admission, (iii) deaths in hospital, (iv) survivors
not taken to hospital, (v) survivors taken to hospital but not admitted, and (vi) survivors
admitted.
However, no significant differences were found in the relationship between response times,
mortality and hospital admission. Consequently, it was decided not to pursue this part of the
analysis as the policy decision would not be affected by it.
8.4 Discussion and conclusion
The economic study collected detailed case study data and analysed national ambulance
service data to assess the costs associated with improving response times. The case study
data provide vivid picture of services making changes in an attempt to improve response
times with limited additional funding (in the early years at least). These change were not
restricted to increases in capacity, but included a diverse range of initiatives touching on all
aspects of the service. However, costs attributable to improved response times could not be
estimated, primarily due to the difficulty in disentangling the impact of increased call volume
on service costs.
The analysis of national ambulance service data give a better chance of separating the
effects of response times, call volume and efficiency changes. The results showed a clear
relationship between average costs and call volume, but a less robust relationship between
average costs and response times. The preferred model (Model 1) indicates a £37,000
increase in the average Ambulance Trust’s annual costs per percentage point improvement in
response times. The lack of statistical significance on this coefficient, and its sensitivity to
changes in specification, however, mean that we should be extremely cautious about this
interpretation.
The costing of hospital care was abandoned due to the lack of a relationship between
response times and patient outcomes. Likewise, the estimation of a cost-effectiveness ratio
was not possible due to the lack of a clearly identifiable improvement in outcomes. It is
technically possible to undertake the costing of hospital care and merge it with the survey
analysis results and mortality results to estimate a cost per life-year saved (and its associated
cost-effectiveness acceptability curve). However, the results are unlikely to change the policy
implications associated with the null results with respect to mortality.
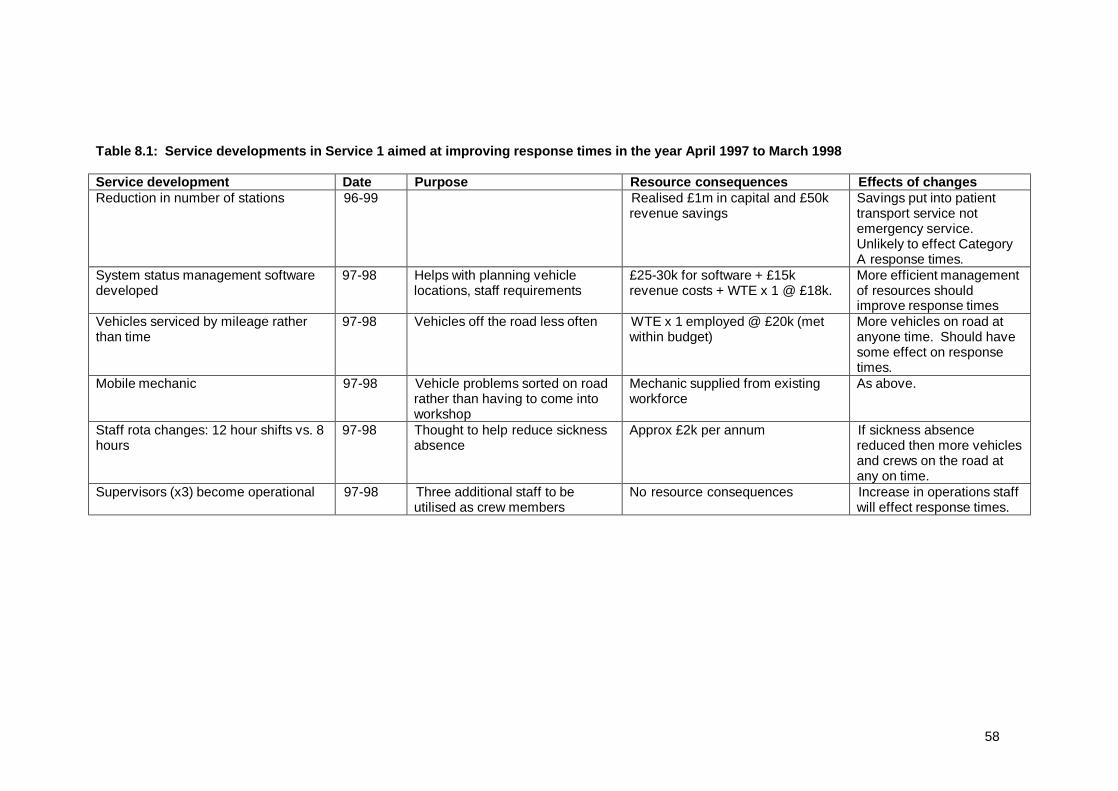
58
Table 8.1: Service developments in Service 1 aimed at improving response times in the year April 1997 to March 1998 Service development Date Purpose Resource consequences Effects of changes Reduction in number of stations 96-99 Realised £1m in capital and £50k
revenue savings Savings put into patient transport service not emergency service. Unlikely to effect Category A response times.
System status management software developed
97-98 Helps with planning vehicle locations, staff requirements
£25-30k for software + £15k revenue costs + WTE x 1 @ £18k.
More efficient management of resources should improve response times
Vehicles serviced by mileage rather than time
97-98 Vehicles off the road less often WTE x 1 employed @ £20k (met within budget)
More vehicles on road at anyone time. Should have some effect on response times.
Mobile mechanic 97-98 Vehicle problems sorted on road rather than having to come into workshop
Mechanic supplied from existing workforce
As above.
Staff rota changes: 12 hour shifts vs. 8 hours
97-98 Thought to help reduce sickness absence
Approx £2k per annum If sickness absence reduced then more vehicles and crews on the road at any on time.
Supervisors (x3) become operational 97-98 Three additional staff to be utilised as crew members
No resource consequences Increase in operations staff will effect response times.
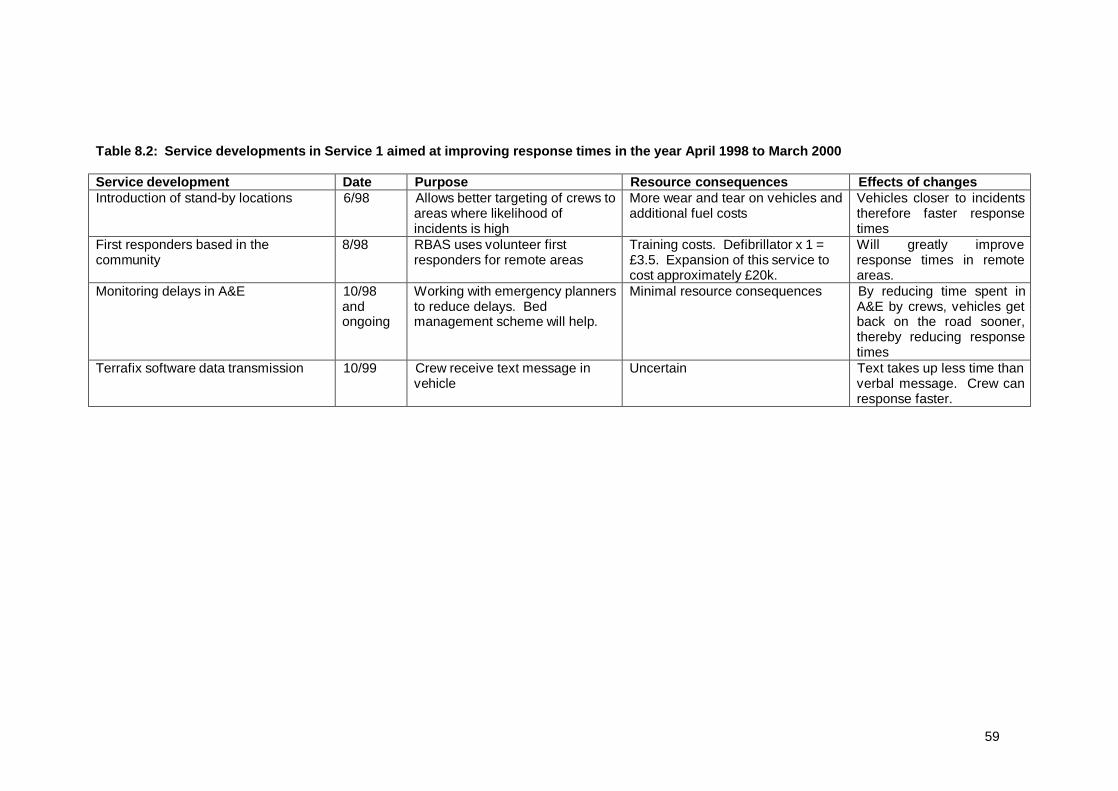
59
Table 8.2: Service developments in Service 1 aimed at improving response times in the year April 1998 to March 2000 Service development Date Purpose Resource consequences Effects of changes Introduction of stand-by locations 6/98 Allows better targeting of crews to
areas where likelihood of incidents is high
More wear and tear on vehicles and additional fuel costs
Vehicles closer to incidents therefore faster response times
First responders based in the community
8/98 RBAS uses volunteer first responders for remote areas
Training costs. Defibrillator x 1 = £3.5. Expansion of this service to cost approximately £20k.
Will greatly improve response times in remote areas.
Monitoring delays in A&E 10/98 and ongoing
Working with emergency planners to reduce delays. Bed management scheme will help.
Minimal resource consequences By reducing time spent in A&E by crews, vehicles get back on the road sooner, thereby reducing response times
Terrafix software data transmission 10/99 Crew receive text message in vehicle
Uncertain Text takes up less time than verbal message. Crew can response faster.
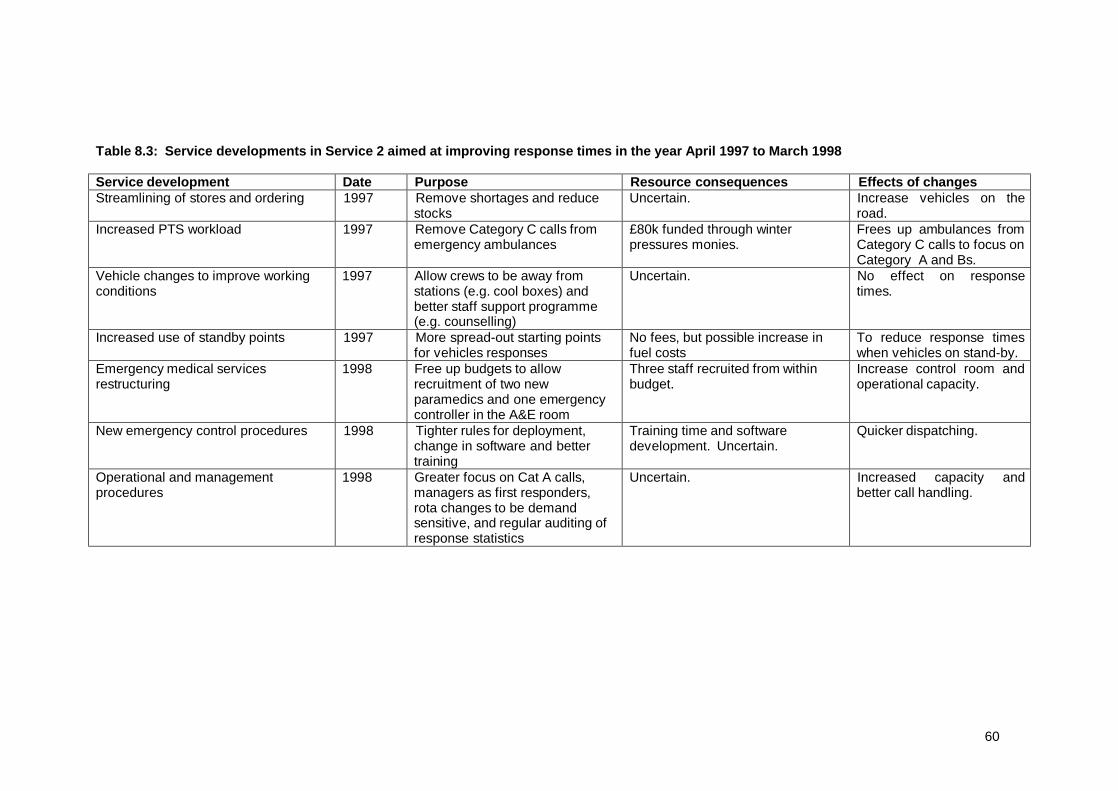
60
Table 8.3: Service developments in Service 2 aimed at improving response times in the year April 1997 to March 1998 Service development Date Purpose Resource consequences Effects of changes Streamlining of stores and ordering 1997 Remove shortages and reduce
stocks Uncertain. Increase vehicles on the
road. Increased PTS workload 1997 Remove Category C calls from
emergency ambulances £80k funded through winter pressures monies.
Frees up ambulances from Category C calls to focus on Category A and Bs.
Vehicle changes to improve working conditions
1997 Allow crews to be away from stations (e.g. cool boxes) and better staff support programme (e.g. counselling)
Uncertain. No effect on response times.
Increased use of standby points 1997 More spread-out starting points for vehicles responses
No fees, but possible increase in fuel costs
To reduce response times when vehicles on stand-by.
Emergency medical services restructuring
1998 Free up budgets to allow recruitment of two new paramedics and one emergency controller in the A&E room
Three staff recruited from within budget.
Increase control room and operational capacity.
New emergency control procedures 1998 Tighter rules for deployment, change in software and better training
Training time and software development. Uncertain.
Quicker dispatching.
Operational and management procedures
1998 Greater focus on Cat A calls, managers as first responders, rota changes to be demand sensitive, and regular auditing of response statistics
Uncertain. Increased capacity and better call handling.

61
Table 8.4: Service developments in Service 2 aimed at improving response times in the year April 1998 to March 2000 Service development Date Purpose Resource consequences Effects of changes Increased staffing and vehicles 2000 Additional staffing 115 WTE staff and 52 vehicles.
£2.2m funded from purchasers (1.5m) and savings (0.7m)
Increase capacity
Increased PTS workload 1998 onwards
Remove Category C calls from emergency ambulances
Renegotiated each year. Uncertain. Frees up ambulances from Category C calls to focus on Category A and Bs.
Standby development 1999 onwards
More spread-out starting points for vehicles responses
No fees, but possible increase in fuel costs
To reduce response times when vehicles on stand-by. To allow change in station profile.
Work based training 1998 onwards
Reduction in time taken off the road for training
Seconded trainers from operations, but increased on-road capacity
Increased capacity.
System status management 2000 onwards
To identify incident hot spots and move vehicles to that they are closer to them
Computer hardware, software, staff training and ongoing database managements.
To improve vehicle positioning and response times.

62
Table 8.5: Service developments in Service 3 aimed at improving response times in the year April 1997 to March 1998 Service development Date Purpose Resource consequences Effects of changes Upgrading the predictive analysis system
4/97 Upgrade system for better prediction of incidents
One-off £4k fee. Assist with positioning of vehicles to allow faster response times.
Increase in first response vehicles 4/97 Increase number of response vehicles
Four new motorbikes @ £10k plus equipment, insurance and training.
To reduce response times.
Introduction of standby points 1997 More spread-out starting points for vehicles responses
No fees, but possible increase in fuel costs
To reduce response times when vehicles on stand-by.
Support care crew scheme 10/97 PTS crews are trained to enable them to transfer sick patients, thereby taking pressure off the emergency ambulance service
£79k of winter pressure monies. Annual equivalent costs uncertain.
To reduce non-urgent workload of first emergency ambulances.
Improved call handling 1997 Ongoing training to improve standards and speed of call taking
Uncertain. Reduce call taking to a target of 45 seconds.
Change in manager responsibilities 1997 Some managers have become first responders, and all have performance targets.
Uncertain. Increase in number of responders and incentives to improved response times.
First responder schemes 1997 To increase the number of first responders
Five voluntary first responder schemes. Training costs plus equipment (e.g. mobile phones, defibrillators and consumables)
To reduce response times.
Research into Category C calls. 1997 To investigate ways for reducing category C calls
£60k Reductions in Category C calls will improve response times for Category A and B calls.

63
Table 8.6: Service developments in Service 3 aimed at improving response times in the year April 1998 to March 2000 Service development Date Purpose Resource consequences Effects of changes Automatic vehicle location 2000 Better positioning and allocation
of vehicles to calls. Requires better screens for vehicles and maps.
Upgraded screens £20k and better maps £80k.
Improve response times by better vehicle allocation.
Predictive analysis 1999 ORH commissioned to identify investment required to meet Category A target
£15 for research. It identified need for £1.1m more funding
Precipitated 48 more staff (see immediately below)
More staff 2000 Increase operational and control centre capacity
44 operational staff and 4 control staff. £1.1m funding as identified by ORH.
Greater capacity to reduce response times. Training not complete until Feb 2001.
Rapid response vehicles 1998-2000
Increase in number of bikes from 4 to 6. Purchased/leased 8 cars
Cost taken from £1.1 identified above.
Greater capacity to reduce response times.
Increase in dynamic standby points 2000 Position vehicles closer to incidents
Increase fuel costs Quicker response. May necessitate air conditioning in vehicles.
Support care crew scheme 1998-2000
Expansion of original scheme from 2 to 5 vehicles. Now covering 25% of doctor’s urgent calls per day.
Uncertain. Frees up ambulances from Category C calls to focus on Category A and Bs.

64
Table 8.7: Service developments in Service 4 aimed at improving response times in the year April 1997 to March 1998 Service development Date Purpose Resource consequences Effects of changes Introduction of stand-by locations: 23 in Birmingham; 18 in Coventry; and 16 in Black country
7/97 to 11/97
Allows better targeting of crew to areas where likelihood of incidents is high
£10,000 for stand-by points per annum
Vehicles closer to incidents therefore faster response times
Introduction of pre alert system 4/97 Crew alerted to a possible A or B call and set off with minimal info. Rest given on route.
Software developed in-house Speeds up activation. Can reduce response times by 45 to 60 seconds.
Introduction of caller line identify Caller’s address flashes up on operator’s screen
£5,000 per year operating costs £5,000 for cost of developing software
Reduces time taken to process a call but does not affect response time as currently defined.
Trail period of conveying patients to primary care treatment centre (PCTC)
12/97 to 3/98
Ambulance takes some category C callers to PCTC rather than A&E
These calls stay out of the 999 system thereby freeing resources for cat A calls
Criteria based dispatch codes no on computer rather than in code manuals
98 Allows operators to categorise calls faster
Speeds up activation of crews
Shared facility with fire service 98 Allows standby point in rural area of Staffordshire
Faster response times in rural areas
Commissioned external report on most cost effective way of reaching response time targets
98 To help target resources at specific developments aimed at reducing response times
Note Several other large investments were made to help improve response times, such as the implementation of a pre-alert system at around £420,000, but these took place before the start date of the evaluation.

65
Table 8.8: Service developments in Service 4 aimed at improving response times in the year April 1998 to March 2000 Service development Date Purpose Resource consequences Effects of changes Review of stand-by locations based on appropriateness using predictive analysis
98 Better use of stand-by points to improve responsiveness
Done in-house Reduced number of stand-by locations but remainder better placed
Introduction of Aqua evaluation system 98 Audits sample of 999 calls for standard of processing and ability to identify cat A calls
£8k software + £3.5 + hardware costs + one WTE operator @ £16k
By more easily identifying life threatening calls response times are improved
Locating crews at fire stations 98-00 Partnership with fire service ensures better location of crews
£5,000 (10 stns x £500) Has improved response times within the areas affected
More use of operators and support managers for first responder work
98-00 Additional support for existing first responder network
Difficult to quantify Provide additional reserves throughout peak periods
Recruitment of operational and control staff
98-00 + ongoing
Additional staff (+ vehicles see below) aimed at improving response times
£320k (£16k x 20 operational staff) + £16k x 1 control staff + training costs
Direct attempt to improve response times via additional staff and vehicles
Vehicle replacement plan in place 98-00 + ongoing
Plan to increase emergency vehicle was but more likely to focus on FRVS
Difficult to quantify marginal effect Direct attempt to improve response times via additional staff and vehicles

66
Table 8.9: Response time, cost and activity trends over time
Year n % Category A calls within 8
mins
% Category A calls within 14/19 mins
% Category B calls within 8
mins
% Category B calls within 14/19 mins
Activity ‘000s)+
Cost per case++
(£2004)
Mean 1997/8 8 53.88 95.38 49.10 93.48 85.42 202.99
1998/9 16 59.01 95.04 53.49 93.86 89.22 195.66
1999/0 20 57.23 95.61 52.62 94.29 107.15 193.43
2000/1 31 60.93 94.42 53.35 93.37 111.20 192.20
2001/2 32 73.00 95.82 58.21 93.50 119.37 191.02
2002/3 32 74.97 95.66 57.80 92.68 126.86 190.82
2003/4 31 74.97 94.92 55.92 90.54 137.66 188.82
+ Defined as the number of emergency calls resulting in a responder on scene. ++ Defined as the cost of emergency patient transport services divided by activity.

67
Table 8.10: Models of cost per case
Full sample Services not involved in mergers
Model 1 Model 2 Model 4 Model 5
N_obs 168 168 137 137
N_groups 36 36 27 27
cata8 +0.271 -0.042 +0.600 +0.106
cata1419 -0.870 - -0.572
catb8 -0.447 - -0.814
catb1419 +0.812 - +0.721
emcallsc -0.628** -0.619** -0.510 -0.442
emcallsq +0.001** +0.001** +0.001* +0.001* * = p<0.05, ** = p<0.01 Variable descriptions cata8 Percentage of category a calls
responded to in under 8 minutes
emcallsc Number of emergency calls resulting in a responder on scene
cata1419 Percentage of category a calls responded to in under 14 minutes (urban) or 19 minutes (rural)
emcallsq Number of emergency calls resulting in a responder on scene squared
catb8 Percentage of category b calls responded to in under 8 minutes
Year2-7 Year dummies for 1999/2000 onwards
catb1419 Percentage of category b calls responded to in under 14 minutes (urban) or 19 minutes (rural)

68
9. DISCUSSION AND CONCLUSIONS
Response times
We have examined response times and outcomes for calls identified as life threatening in 4
Ambulance Services across 5 years. Nearly 18,000 responses to patients were examined
from the time of introduction of the new response time standard (1996/7) up to the time that
the target of 75% of category A life-threatening calls responded to in 8 minutes was expected
to be achieved (2000/1).
During these five years, the four study services made many changes to their operations to
improve response times including, for example, better communications, and introducing fast
response vehicles and elements of system status management such as dynamic deployment
and predictive analysis.
Nevertheless, response times only improved from 47% in 8 minutes to 60% in 8 minutes, with
mean times reducing from 9:21 (mins:secs) to 8:18. There were similar small improvements
in the proportion of short response times in 5 minutes which increased from 17% to 24%.
However, overall these improvements were disappointing and, although greater gains have
been achieved in recent years, they point to the difficulties of improving response times for
selected life-threatening cases at a time when the total number of all categories of call was
increasing rapidly. Interestingly, despite these rises in call volume, the number of Category
A* calls appears to have remained relatively stable over the 5 years, suggesting that
increases are the result of more calls for less serious conditions.
There were other changes to the services, such as the merger of service 2 with neighbouring
services, and the change of EMD system midway through the study in Service 4, which may
have confused the response times picture. Furthermore, in Service 1 there were clearly
major changes in how calls were prioritised as the crude mortality rate of life-threatening A
calls reported to the study doubled from 15% to 30% between 1997 and 1999. Since there
were also substantial improvements in the response times in Service 1 over this period it is
likely that the service was focusing resources more closely on a smaller number of more
serious calls.
Targeting
The evaluation has focused on 999 calls for potentially life-threatening conditions when a
faster response may have some impact on patient outcome. To provide consistency in the
reporting of category A response time performance once call prioritisation was introduced, the
Department of Health produced a list of both AMPDS and CBD codes which were considered
to correspond to the seven condition types identified as category A calls. We have included a
sub-sample of all category A calls in which the patient was also reported as unconscious OR
not breathing OR with acute chest pain. We have termed these A* calls and it is these calls
that make up the cases included in our study in order that the study would be focused on
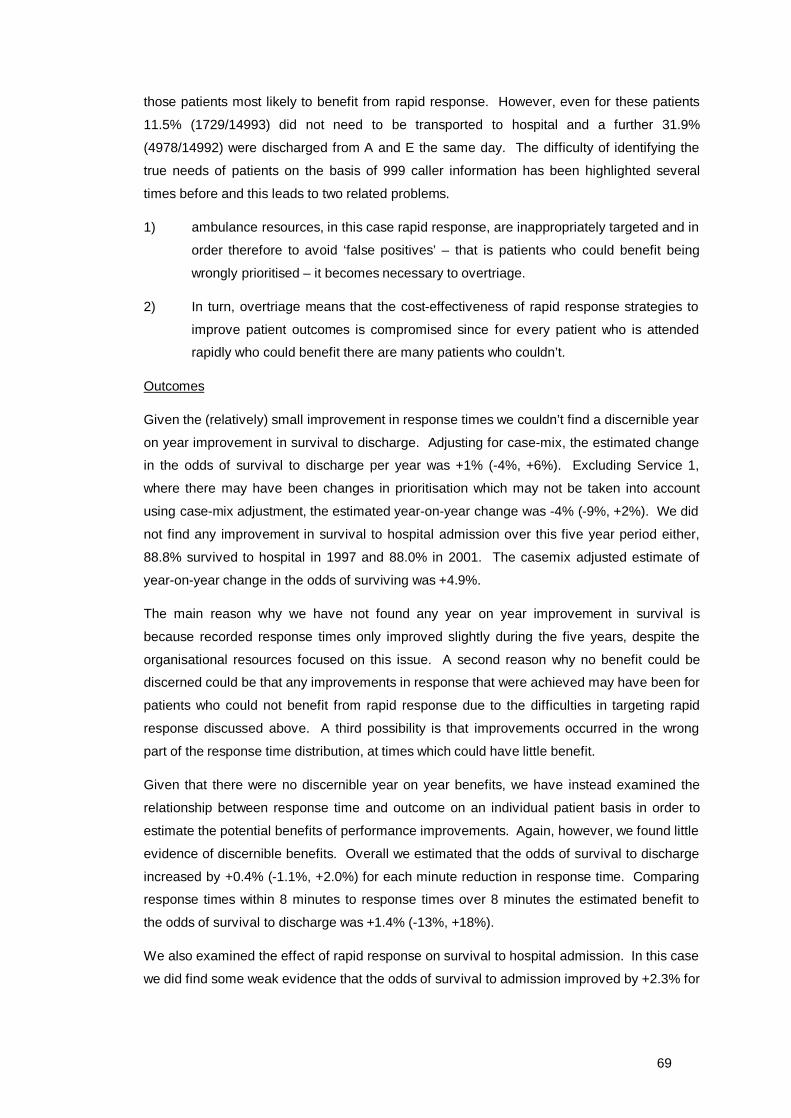
69
those patients most likely to benefit from rapid response. However, even for these patients
11.5% (1729/14993) did not need to be transported to hospital and a further 31.9%
(4978/14992) were discharged from A and E the same day. The difficulty of identifying the
true needs of patients on the basis of 999 caller information has been highlighted several
times before and this leads to two related problems.
1) ambulance resources, in this case rapid response, are inappropriately targeted and in
order therefore to avoid ‘false positives’ – that is patients who could benefit being
wrongly prioritised – it becomes necessary to overtriage.
2) In turn, overtriage means that the cost-effectiveness of rapid response strategies to
improve patient outcomes is compromised since for every patient who is attended
rapidly who could benefit there are many patients who couldn’t.
Outcomes
Given the (relatively) small improvement in response times we couldn’t find a discernible year
on year improvement in survival to discharge. Adjusting for case-mix, the estimated change
in the odds of survival to discharge per year was +1% (-4%, +6%). Excluding Service 1,
where there may have been changes in prioritisation which may not be taken into account
using case-mix adjustment, the estimated year-on-year change was -4% (-9%, +2%). We did
not find any improvement in survival to hospital admission over this five year period either,
88.8% survived to hospital in 1997 and 88.0% in 2001. The casemix adjusted estimate of
year-on-year change in the odds of surviving was +4.9%.
The main reason why we have not found any year on year improvement in survival is
because recorded response times only improved slightly during the five years, despite the
organisational resources focused on this issue. A second reason why no benefit could be
discerned could be that any improvements in response that were achieved may have been for
patients who could not benefit from rapid response due to the difficulties in targeting rapid
response discussed above. A third possibility is that improvements occurred in the wrong
part of the response time distribution, at times which could have little benefit.
Given that there were no discernible year on year benefits, we have instead examined the
relationship between response time and outcome on an individual patient basis in order to
estimate the potential benefits of performance improvements. Again, however, we found little
evidence of discernible benefits. Overall we estimated that the odds of survival to discharge
increased by +0.4% (-1.1%, +2.0%) for each minute reduction in response time. Comparing
response times within 8 minutes to response times over 8 minutes the estimated benefit to
the odds of survival to discharge was +1.4% (-13%, +18%).
We also examined the effect of rapid response on survival to hospital admission. In this case
we did find some weak evidence that the odds of survival to admission improved by +2.3% for

70
each minute faster response time, and the odds of surviving to admission were doubled for
response times within four minutes compared to response over four minutes.
It is less clear why the benefits of rapid response could not be detected for individual patients.
However, this has been noted elsewhere in a study using similar methods22 and we
hypothesise that it is because
1) response times can show ‘reverse causality’ in which faster responses are achieved
for those most at risk, even within a group of calls identified as A. There was some
evidence for this and this is a potential benefit of EMD systems which enable
despatchers to relay further information to crews as the response is happening.
Unfortunately an observational study of achieved response times and outcomes
cannot examine this benefit. However, when we tried allowing for the despatch code
in the analysis, the estimated benefits did increase and we estimated that the odds of
surviving to discharge increased by +1.4% (-0.3%, +3.1%) for each minute faster
response.
2) However, the main reason why we could not discern the benefits of faster response
was probably due to the fact that the number of patients who can benefit is actually
very small, and the benefit in this small group is being lost in the large numbers of
patients who cannot benefit. We therefore also examined the benefits in specific
groups.
Clinical groups
In line with previous studies in the UK7,20 we did find reliable evidence that faster response led
to improved survival in cardiac arrests which occurred prior to crews arriving on scene.
Allowing for all other factors including the initial rhythm, whether the arrest was witnessed, the
use of bystander CPR, as well as characteristics of the patient and service, we estimated that
the effect of a one minute reduction in response time was to improve the odds of survival by
19% (+3%, +33%).
We also found that in our whole sample of n=14993 A patients with known outcomes there
were 58 patients who had a cardiac arrest after the crew arrived on scene. Eight (14%) of
these patients survived. We have not been able to determine whether any of these survivors
resulted from rapid response.
Several previous studies have looked directly or indirectly at the relationship between
response times and outcome in other clinical groups such as trauma and ruptured aortic
aneurysms. In line with the findings from such studies we could not find any benefits in other
clinical groups such as trauma, asphyxiation, and serious haemorrhage.

71
Estimating the benefit of improved response
In the light of our findings of no overall benefits of faster response, both at a service level over
time and in individuals with different response times, except in patients with OHCA, can we
estimate what the effect of improving response times further would be?
We assume that only patients in OHCA can benefit. Excluding patients known to be in sinus
rhythm when the crew arrived, there were only 17 OHCA patients not witnessed by crews
who survived. Given that a one minute reduction in response time improves the odds of
survival by 19% we can thus estimate that a reduction in response times of one minute across
the board would have resulted in an extra 4 – 5 not crew witnessed OHCA survivors. We do
not know what the effect of response time on survival in the crew witnessed arrests was.
However, we optimistically assume that 1/8 of the survivors would not have survived if
response was one minute slower. Thus in total we estimate 5-6 extra survivors per minute
faster response. These 5 – 6 extra survivors would occur out of 14,993 A calls which is
approximately 0.04%. A typical ambulance service receives 100,000 calls per annum
resulting in patients being attended at the scene. Of these about 10% might be classified as
A calls, and thus improving response times by one minutes across the board might save an
additional 4 lives per annum in a typical ambulance service.
We can make this calculation in a different way. We have sampled approximately 105 AS
weeks, or 2 AS years, which identified 17,950 A patients. Again this results in an estimate
of about 4 extra survivors per AS per annum for a one minute reduction in response times
across the board.
We have to make this calculation assuming a reduction across the board, ie. for all A calls,
because as discussed above the priority despatch systems are not sensitive and specific
enough to focus AS resources on faster response only for OHCA patients.
Other benefits
One of the main limitations of our study is that we have only considered benefits in terms of
survival. Although there is no evidence that we know about which has identified other health
benefits in terms of reduced disability or other morbidity, there are plainly other types of
benefit for patients, carers, callers, and bystanders. In a 999 emergency in which a patient is
unconscious, not breathing, or suffering acute chest pain even a small reduction in actual
response time may give large benefits in perceived time. There may also be an associated
reduction in anxiety, distress, pain and discomfort and further research to measure if these
potential benefits are real and valuable to patients would be worthwhile.
There are other possible benefits and disbenefits. For example, if the odds of survival to
hospital (rather than to discharge) can indeed be doubled with response times ≤ 4 minutes
compared to over 4 minutes, so that more people are admitted alive even if they subsequently

72
die, then families may have the chance to see their relatives before death. However, patients
may not value short extensions like this or even consider them a disbenefit.
Economic evaluation
The economic evaluation we have undertaken aimed to assess the benefits on survival to
discharge and costs at a service level in order to examine the cost-effectiveness of improving
response times. Because there is no evidence of any such benefits we have not been able to
undertake any such evaluation. However, we have estimated that it costs an AS £37,000 for
each percentage point improvement towards the 8 minute target for response times in
category A calls. We could try to combine this estimate with the estimate of improved survival
in OHCA to produce a cost per QALY. However, because neither the cost estimate nor the
benefit estimate is robust, and because the costs incurred to achieve an improvement in
response are certain to increase with the baseline performance, the answer would be
unhelpful given current levels of performance. We also think that such an evaluation should
value all the other types of benefit described above, and currently we have no means for
doing this.
Nevertheless, for interest we show the shape of such a calculation. Figure 4.3 shows that a
one minute reduction in response times across the board would result in approximately 10%
more responses within 8 minutes. Our estimate suggests that this would cost £370,000 in an
average ambulance service. Such a reduction would lead to an estimated 4 lives being saved
(all from OHCA). The median age of these patients is 71. We do not know the average
length of survival of an OHCA patient who survives to discharge, nor their quality of life.
However, there would have to be approximately 5 QALYs gained per survivor for the cost per
QALY to meet a target threshold of £20,000 per QALY.
Limitations
There are three important limitations to this study.
1. Firstly, the study was designed to look at costs and benefits at a service level on the
assumption that the services would be substantially improving response times during
the five year period from the introduction of priority-based targets and the expected
date of achievement. During this period, however, improvements were small, and the
service level analysis could not, nor be expected to, find any effects.
2. Given this, we have had to examine the relationship between response times and
outcomes at an individual level. However, because of what we have termed ‘reverse
causality’ (which is sometimes called indication bias) it is possible that the magnitude
of the response time has been determined in part and in a few cases by the expected
outcome. Although we expect that the chance of this is small in A calls, there is
some evidence that it did happen. For example, we found shorter response times in

73
patients with no or few vital signs at arrival on scene compared to other patients.
Indication bias is very difficult to overcome even with case-mix adjustment.
3. The only benefits we have examined are in terms of survival. We have no doubt that
there were other substantial and important benefits from fast response in apparently
life-threatening incidents. For example, in terms of a reduction in anxiety, distress,
and pain.
Recommendations for further research
The findings of the study have highlighted factors that pose particular difficulties in using
differential response time standards as performance measures.
Firstly, we have demonstrated that only a small proportion of calls prioritised as category A
have a truly life-threatening, time dependant condition. As a consequence there is significant
over-triage in the categorisation process at the call handling stage and the current methods of
prioritisation are not sufficiently sensitive to identify the small number of critical cases that
require the fastest response. As the most recent DH report on NHS Ambulance Services 20
has clearly recognised there is an urgent need for “better ways of identifying the 10% who
really need an emergency response”. There are similar concerns about the ability of priority
dispatch systems to identify suitable low urgency (category C) calls that may benefit from
responses other than a lights and sirens ambulance. This issue has become more pressing
with the change in policy regarding the management and reporting of category C calls. The
priority dispatch systems currently in use were designed to categorise calls on the basis of a
simple two level assessment of need; level of care (ALS or BLS) and speed of response
(lights and sirens or not) and they fulfil this function well. However, they have been used
within the UK to try and prioritise calls into specific time based categories. In addition the
range of response options available to ambulance service dispatchers is now much greater.
Priority dispatch systems are increasingly being used to try and match patients’ clinical needs
to the most appropriate response although this is not the systems intended purpose. It is
becoming increasingly clear that a more sophisticated approach is needed to the assessment
of patients needs at the time of the emergency call and the subsequent care delivery
response.
Secondly, response time performance and the achievement, of response time standards has
been the single measure against which the quality of ambulance services has been judged.
The results of this study show that, with the exception of a very small number of individuals,
response time itself is not a factor that affects patient outcome. Response time alone is not
therefore a very useful indicator of quality, in terms of patient outcome, for the vast majority of
callers to the ambulance service. Neither is it a useful benchmark for comparing services as
it only reflects the transport element of the service and not the care provided. Use of
response time performance also forces ambulance services to organise and manage their
service around the needs of a few which can then result in an inappropriate service (for

74
example transport to hospital for conditions that, with the correct response, could be managed
at home) for many others.
The econometric analysis produced uncertain findings. This is probably due to several
reasons, although it is thought that the main reason is the lack of clear relationship and large
variations between services. At the individual service level, the cost of improving response
times is more apparent. Such analyses are better handled using simulation models, and
several of the ambulance trusts utilised external consultancies to model the resource
requirements for their services. Anecdotal evidence points to these models producing
realistic predictions, and future work looking at changes in the operational characteristics of
ambulance services, should consider simulation modelling for this.
Many of these issues are already being addressed as current policy priorities require further
research to provide a sound evidence base to inform future developments. The research
priorities now are to:
• Conduct a further rigorous and detailed investigation of the relationship between
emergency call assessment, actual clinical need, appropriate response and patient
outcome across all categories of calls
• Use this information to inform the further development of priority dispatch systems
that can more accurately determine patient need.
• Develop a system that integrates call assessment to an appropriate response. This
could entail enhancement of current systems or the development of a new system
• Identify factors in the clinical care of patients that have a true impact on patient
outcome
• Further investigate users’ views on their expectations of and what they consider to be
the important factors in providing a good quality ambulance service
• Use these to develop performance indicators for ambulance services that more
accurately reflect the contribution made to the health care process.
Policy implications
The key finding in this study mirrors that in contemporary studies in the US22,23. Rapid response
to achieve most responses within 8 minutes delivered across the board makes no discernible
difference to survival to discharge. There are, however, some details which need to be
considered before the broad policy implications can be drawn out.
Firstly, Pons22 and Blackwell23 found that there was improved survival to discharge for very
short response times ≤ 4 minutes or ≤ 5 minutes respectively. However, we have not found any
such effect. Instead we found that very short response times ≤ 4 minutes doubled the odds of
75
surviving to hospital, but not to discharge. Nevertheless, the general point is that it may only be
some parts of the response time distribution that are critical, not the whole distribution.
Equally, we have found that although there is no discernible benefit for all A calls together,
there is benefit in out of hospital cardiac arrest.
The implication of these three findings (no overall benefit, possible benefit with very short
responses, benefit in OHCA) suggests that any strategy around response time targets should
be re-focussed on achieving very short responses to OHCA. This might mean concentrating
resources in high risk areas such as urban business districts, or using fire and police
responders, for example.
Unfortunately the current targeting systems are too imprecise for such a strategy to work for
OHCA alone, and consequently given the necessary level of overtriage very short response
times may not be achievable at current resource levels for the number of calls that would be
identified.
Instead, we believe that the finding of no overall benefit from faster response points to the
conclusion that, other things being equal, attention should be re-focussed on the clinical care
provided by crews when they get to the scene rather than how fast they get there.
We know that the right care can make a difference, for example, avoiding IV fluids in bleeding
abdominal trauma, giving early thrombolysis for patients having a myocardial infarction, and
defibrillating patients in VF arrests. The results presented here show that the care provided by
crews to patients who arrest after they have arrived on scene can be effective.
Of course, there are short term and occasionally long term benefits from fast response, and for
a given level of resources response times clearly need to be minimised. However, given that
AS are now responding to 75% of A calls within 8 minutes, our results point to the conclusion
that further developments should be focused on better targeting and clinical care rather than
further response time improvements.
76
REFERENCES
1. Cummins R, Ornato J, Thies W, Pepe P. Improving survival from sudden cardiac arrest: The “Chain of Survival” Concept. A statement for health professionals from the advanced life support committee and the emergency cardiac care committee, American Heart Association. Circulation 1991; 83: 1832-47.
2. Becker L, Pepe P, Ensuring the effectiveness of community wide emergency cardiac care. Annals of Emergency Medicine 1993; 22(2): 354-365.
3. Eisenberg M, Horwood B, Cummins R, Reynolds-Haertle R, Hearne T. Cardiac arrest and resuscitation: A tale of 29 cities. Annals of Emergency Medicine 1990; 19: 179-186.
4. Waalewijn R, de Vos R, Koster R. Out of hospital cardiac arrests in Amsterdam and its surrounding areas: results from the Amsterdam resuscitation study (ARREST) in Utstein style. Resuscitation 1998; 38(3): 157-167.
5. Kette F, Sbrojavacca R, Rellini G, Capasso M, Aricidiacono D, Bernadi G, Frittitta P. Epidemiology and survival rate of out of hospital cardiac arrest in North East Italy:The F.A.C.S. study. Fruili Venezia Guilia Cardiac Arrest Co-operative Study. Resuscitation 1998; 36(3): 153-159..
6. Pell J, Sirel J, Marsden A, Ford I, Cobbe S. Effect of reducing ambulance service response times on deaths from out of hospital cardiac arrest: a cohort study. BMJ 2001; 322: 1385-1388.
7. Brison R, Davidson J, Dreyer J, Jones G, Maloney J, Munkley D, O’Connor H, Rowe B. CMAJ 1992; 147(10): 1427-1428.
8. Wright D, Bannister J, Ryder M, Mackintosh A. Comparison of two methods of transporting paramedics to cardiac arrests outside hospital. Resuscitation 1992; 23: 193-197.
9. Herlitz J, Engdahl J, Svensson L, Angquist K, Young M, Holmberg S. Factors associated with an increased chance of survival among patients suffering out of hospital cardiac arrest in a national perspective in Sweden. Am Heart J 2005; 149(1): 61-66.
10. Finn J, Jacobs I, Holman C, Oxer H. Outcome of out of hospital cardiac arrest patients in Pert, Western Australia, 1996-1999. Resuscitation 2001; 51(3): 247-255.
11. De Maio V, Stiell I, Wells G, Spaite D. Optimal defibrillation response intervals for maximum out of hospital cardiac arrest survival rates. Annals of Emergency Medicine 2003; 42(2): 242-450.
12. Chapman R. Review of ambulance performance standards, Final report of steering group. NHS Executive 1996.
13. Nicholl J, Gilhooley K, Parry G, Turner J, Dixon S. The safety and reliability of priority dispatch systems. Medical Care Research Unit 1996; University of Sheffield.
14. Nicholl J, Turner J, Cleary K. The costs and effects of the implementation of the new ambulance service response time standards. Interim report to the Department of Health. Medical Care Research Unit 1999; University of Sheffield.
15. deSouza VC, Strachan DP. Relationship between travel time to the nearest hospital and survival from ruptured abdominal aortic aneurysms: record linkage study. J. Public Health, 2005; 27(2): 165-170.
16. Pons PT, Markovchick VJ. Eight minutes or less: does the ambulance response time guideline impact trauma patients outcome? J. Emerg. Med., 2002; 23: 43-48.
17. Fiedler MD, Jones LM, Miller SF, Finley RK. A correlation of response time and results of abdominal gunshot wounds. Arch. Surg., 1986; 121: 902-904.

77
18. Pepe PE, Wyatt CH, Bickell W, Bailey ML, Mattox KL. The relationship between total prehospital time and outcome in hypotensive victims of penetrating injuries. Ann. Emerg. Med., 1987; 16: 293-297.
19. Lerner EB, Billittier AJ, Dorn JM, Wu YW. Is total out-of-hours hospital time a significant predictor of trauma patients mortality? Acad. Emerg. Med., 2003; 10: 949-954.
20. Lyon RM, Cobbe SM, Bradley JM, Grubb NR. Surviving out of hospital cardiac arrest at home: a postcode lottery? Emerg. Med. J., 2004: 21: 619-624.
21. Department of Health. Taking health care to the patients: transforming NHS Amulance Services. Department of Health. June 2005.
22. Pons PT, Hankoo S, Bludworth W, et al. Paramedic response time: does it affect patient survival? Academic Emerg. Med., 2005; 12(7): 594-600.
23. Blackwell TH, Kaufman JS. Response time effectiveness: comparison of response time and survival in an urban emergency medical services system. Acad. Emerg. Med., 2002; 9: 288-295.
78
APPENDIX 1
The Acceptability of Emergency Medical Dispatch (EMD) systems to 999 callers
Analysis of the type and nature of non-serious (category C) calls
79
The Acceptability of Emergency Medical Dispatch (EMD) systems to 999 callers
Introduction
The introduction of EMD systems to ambulance service control rooms means that there are
changes to the way requests for an emergency ambulance are handled. The caller is asked
some additional questions which allow the call taker to identify the chief complaint and assign
a level of response. In addition the call taker can give pre-arrival instructions and, where
necessary, first aid advice including basic instructions for cardiopulmonary resuscitation. The
aim of this part of the evaluation was to assess the acceptability of these changes to
members of the public who call 999 and request an ambulance.
Methods
In order to assess any changes resulting from the introduction of EMD systems the
acceptability of call taking needs to be assessed before and after the introduction of a system.
As all four study areas had already implemented priority dispatch systems prior to introduction
of prioritisation we recruited a fifth ambulance service – Greater Manchester Ambulance
Service (GMAS) – to conduct this part of the study. GMAS introduced AMPDS to their control
room during the spring of 1998. This enabled us to conduct a before and after study to elicit
the views of callers to the ambulance service.
A random sample of 500 callers to GMAS control centre during one week in January 1998
prior to the introduction of emergency medical dispatch were sent a postal questionnaire
which asked questions about the management of their actual call, any advice they were given
by the call taker including first aid advice, and their satisfaction with both the service delivered
by the control room and the ambulance crew.
The second survey of a further random sample of 500 callers was due to take place during
the corresponding week in January 1999 but winter pressures and a flu epidemic meant that
the call volume at this time was double the normal rate. This survey was instead carried out
during the first week of February.
Summary of results
The response rate was 72% (355/493) before, and 63% (297/466) after the introduction of
EMD. There was a reduction, from 81% (284/349) to 70% (200/286), in the proportion of
callers who found all the questions asked by the call-taker relevant, although this did not
adversely affect the proportion of callers who were very satisfied with the 999 call, which
increased from 78% (268/345) to 86% (247/287). The proportion of callers who reported
receiving first aid advice increased from 7% (23/323) to 43% (117/272) and general
information from 13% (41/315) to 58% (157/269). Satisfaction levels with the amount of
advice given increased, while satisfaction with response times remained stable at 76%
(254/320) very satisfied before and 78% (217/279) after EMD. The proportion of respondents
very satisfied with the service in general increased from 71% (238/336) to 79% (220/277).

80
There was evidence in respondents’ written comments of two potential problems with EMD
from the caller’s viewpoint. First, some callers were advised to take actions which were
subsequently not needed; second, a small number of callers felt that the ambulance crew did
not treat the situation as seriously as they would have liked.
Conclusions
Introducing EMD increases the amount of first aid and general advice given to callers, and
satisfaction with these aspects of the service, while maintaining satisfaction with response
times. Overall satisfaction with the service increased and there were a large number of
comments made by respondents on the ability of Emergency Medical Dispatchers to provide
a calming influence on what is perceived to be a very stressful incident. However, some
changes may be needed to prevent a small amount of dissatisfaction directly associated with
EMD, specifically the relevance of some of the questioning and general advice given.
A fuller description is given in the earlier interim report and the two peer reviewed papers that
have been published from this study:
O’Cathain A, Turner J, Withers A, Nicholl JP. Views of people who call 999 to request an
ambulance. Pre-hospital Immediate Care, 1999; 3: 131-135.
O’Cathain A, Turner J, Nicholl JP. The acceptability of an Emergency Medical Dispatch system
to people who call 999 to request and ambulance. Emergency Medical Journal 2002; 19:160-
163

81
Analysis of the type and nature of non –serious (category C) calls
Aims
The potential for alternative management strategies for low priority (category C) calls is a
critical issue for ambulance services. The aims of this study were to describe the nature and
current management of C calls and to assess alternative methods of management other than
deploying an emergency ambulance. This is an area of current policy interest as these calls
are now excluded from response time standard performance targets and management of
these calls including the use of alternative methods of response is decided by individual
services.
Methods
A random sample of 50 low priority calls (CBD ‘C’, AMPDS Alpha) from each of the four study
ambulance services was selected from all such calls during the three month period of January
to March 1998. Patients were identified from the date and time of call, vehicle call sign and
incident number, and their notes accessed at the relevant A and E department.
For each call followed up details were abstracted about the incident and A&E events
including investigations, treatment, diagnosis and outcome. Alternative management
was assessed using the Sheffield algorithm for identifying unnecessary attenders at
A and E departments.
In addition an historical sample of 120 C calls were presented to each of three NHS Direct
centres used to assess management by NHS Direct.
Results
Of the sample of 200 prospective calls, the number of A and E records which could be traced
and reviewed totalled 168. Patients were predominantly adult (90.2%) and female (60.7%)
and 96% were registered with a general practitioner. The most common primary complaint
was a fall (58.9% ) followed by minor medical conditions (20.8%). A third (30.3%) of patients
required admission to hospital and a further third required A&E treatment. Thus using the
categorisation developed in a previous MCRU study of unnecessary attendance at A and E, it
was found that although the majority of patients did need transfer to A and E, approximately
one third (54/168 = 32%) would have been judged ‘unnecessary attenders’. Of patients with
minor injury it was judged that >50% could have been managed at a minor injuries unit.
Outcomes are illustrated in figure 1.

82
Figure 1 – Outcome of attendance at A and E
10
5
10
15
20
25
30
35
40
45
50
11 2 3 4 5 6 7 8 9
1 Assessed & discharged
2 Assessed & discharged withfollow-up3 Treated & discharged
4 Treated & discharged withfollow-up5 Referred to GP
6 Admitted
7 Admitted for social reasons
8 Did not wait
9 Other (eg No A&E notes)
Of the 120 calls presented at 3 NHS Direct call centres between half and three-quarters
would have been directed to A&E for care. However 25-50% were judged not to require A&E
attendance and would have been directed to a General Practitioner or self care. There was
considerable variation between nurses in the outcome resulting from case assessment. The
overall level of agreement between the nurses using the 4 systems was fair (κ=0.375).
Between 21% and 31% of these low priority calls were triaged back to the ambulance service.
Discussion
This study has shown that category C calls represent a heterogeneous group of patients. A
third of 999 calls assigned to the lowest priority categories are admitted to hospital and a
further third need treatment in A & E.
Altogether 80%-90% would have been directed to seek professional care by NHS Direct with
a substantial proportion requiring A&E care. Thus the proportion could potentially be
managed by alternative services is small. A major issue confronting services in this area is
likely to be around the development of priority dispatch systems capable of reliably identifying
calls about patients who could be handled in alternative ways. Only then will investigating
alternative management strategies become feasible.
A fuller description is given in the earlier interim report and a peer reviewed paper has been
published from this study:
O’Cathain A, Webber E, Nichol J, Munro J, Knowles E. NHS Direct: consistency of triage
outcomes. Emerg Med J 2003; 20: 289-292.

83
APPENDIX 2
AMPDS and CBD codes used for case identification

84
CBD codes used for case identification Code Condition description 01A1 Abdominal/back pain – unconscious or not breathing 02A1 Allergic reaction - unconscious or not breathing 03A1 Animal bites - unconscious or not breathing 04A1 Bleeding - unconscious or not breathing 05A1 Breathing difficulty - unconscious or not breathing 06A1 Cardiac arrest - unconscious or not breathing 06A2 Cardiac arrest – suspected sudden death 06A3 Cardiac arrest – sudden infant death syndrome 07A1 Chest pain - unconscious or not breathing 07A2 Chest pain, short of breath/cannot talk 07A4 Chest pain, severe chest pain with sweating 08A1 Choking - unconscious or not breathing 09A1 Diabetic - unconscious or not breathing 10A1 Environmental emergency - unconscious or not breathing 11A1 Fits/convulsions - unconscious or not breathing 12A1 Gynae/miscarriage - unconscious or not breathing 13A1 Headache - unconscious or not breathing 14A1 Mental/emotional - unconscious or not breathing 15A1 Overdose/poisoning - unconscious or not breathing 16A1 Pregnancy/childbirth - unconscious or not breathing 17A1 Sick/unknown problem - unconscious or not breathing 18A1 Stroke/CVA - unconscious or not breathing 19A1 Unconscious - unconscious or not breathing 19A3 Unconscious – confirmed at time of call 21A1 Assault/trauma - unconscious or not breathing 22A1 Burns - unconscious or not breathing 23A1 Drowning - unconscious or not breathing 24A1 Falls/accident - unconscious or not breathing 25A1 Neurological/head injury 26A1 Road Traffic Accident - unconscious or not breathing 27A1 Child under 2 years – cardiac arrest 27A2 Child under 2 years - unconscious or not breathing

85
AMPDS codes used for case identification Code Condition description 09D01 Suspected cardiac arrest 09D02 Suspected respiratory arrest 10D01 Chest pain – severe respiratory distress 10D03 Chest pain – sweating/changing colour 11D01 Choking 12D03 Fits/convulsions – not breathing 13D01 Diabetic – unconscious 14D01 Drowning – unconscious 14D02 Drowning – not breathing/under water 15D01 Electrocution – unconscious 22D03 Industrial/machinery accident – life status questionable 23D01 Overdose/poisoning – unconscious 25D01 Psychiatric/suicide – hanging/strangulation 31D01 Unconscious at end of interrogation 32D01 Unknown problem – life status questionable