Response Surface Methodology for Investigating the … · second-order interactions between the...
15
Iranian Journal of Chemical Engineering Vol. 14, No. 1 (Winter 2017), IAChE Response Surface Methodology for Investigating the Effects of Hydrolysis Reaction Parameters on Molecular Structure and Performance of Polyvinyl Alcohol as Primary Suspending Agent Z. Alihemati, A. H. Navarchian * Department of Chemical Engineering, Faculty of Engineering, University of Isfahan, Isfahan, P.O. Box 81746-73441, Iran ARTICLE INFO ABSTRACT Article history: Received: 2016-04-20 Accepted: 2016-07-02 This study presents the synthesis of polyvinyl acetate (PVAc) by solution polymerization and its partial hydrolysis to polyvinyl alcohol (PVA) using alkaline alcoholysis. The influence of the molar ratio of hydrolysis catalyst to PVAc (NaOH/PVAc) and the time (t) and temperature (T) of the saponification reaction on the degree of hydrolysis and molecular weight of the PVA were investigated using response surface methodology. Statistical analysis of the results revealed that the degree of hydrolysis and molecular weight of PVA were strongly dependent on NaOH/PVAc. It was also found that the second-order interactions between the investigated parameters were not statistically significant. The optimal conditions for synthesizing PVA as a primary suspending agent were obtained as T=45 °C, t=33 min and NaOH/PVAc=0.05 for the examined system. The chemical structures of the PVAc and the optimum PVA were studied by Fourier transform infrared spectroscopy. The distribution of acetate groups in the optimum PVA was determined using 13 C nuclear magnetic resonance spectroscopy. It was found that addition of benzene as well as one-step addition of NaOH (when compared with drop-wise addition) results in more blockiness in the acetate group distribution of PVA. The performance of the optimum PVA was also investigated for a typical suspension polymerization of vinyl chloride and the particle morphology of the product was studied using scanning electron microscopy. Keywords: Polyvinyl Alcohol Hydrolysis Degree Suspending Agent Response Surface Method 1. Introduction Polyvinyl alcohol (PVA) is a semi-crystalline and water-soluble polymer with proper chemical and physical properties. This polymer is widely used in medical and petrochemical engineering industries, * Corresponding author: [email protected] 52
Transcript of Response Surface Methodology for Investigating the … · second-order interactions between the...

Iranian Journal of Chemical Engineering Vol. 14, No. 1 (Winter 2017), IAChE
Response Surface Methodology for Investigating the Effects of Hydrolysis Reaction Parameters on Molecular Structure and
Performance of Polyvinyl Alcohol as Primary Suspending Agent
Z. Alihemati, A. H. Navarchian* Department of Chemical Engineering, Faculty of Engineering, University of Isfahan, Isfahan, P.O. Box
81746-73441, Iran
ARTICLE INFO
ABSTRACT Article history: Received: 2016-04-20 Accepted: 2016-07-02
This study presents the synthesis of polyvinyl acetate (PVAc) by solution polymerization and its partial hydrolysis to polyvinyl alcohol (PVA) using alkaline alcoholysis. The influence of the molar ratio of hydrolysis catalyst to PVAc (NaOH/PVAc) and the time (t) and temperature (T) of the saponification reaction on the degree of hydrolysis and molecular weight of the PVA were investigated using response surface methodology. Statistical analysis of the results revealed that the degree of hydrolysis and molecular weight of PVA were strongly dependent on NaOH/PVAc. It was also found that the second-order interactions between the investigated parameters were not statistically significant. The optimal conditions for synthesizing PVA as a primary suspending agent were obtained as T=45 °C, t=33 min and NaOH/PVAc=0.05 for the examined system. The chemical structures of the PVAc and the optimum PVA were studied by Fourier transform infrared spectroscopy. The distribution of acetate groups in the optimum PVA was determined using 13C nuclear magnetic resonance spectroscopy. It was found that addition of benzene as well as one-step addition of NaOH (when compared with drop-wise addition) results in more blockiness in the acetate group distribution of PVA. The performance of the optimum PVA was also investigated for a typical suspension polymerization of vinyl chloride and the particle morphology of the product was studied using scanning electron microscopy.
Keywords: Polyvinyl Alcohol Hydrolysis Degree Suspending Agent Response Surface Method
1. Introduction Polyvinyl alcohol (PVA) is a semi-crystalline and water-soluble polymer with proper
chemical and physical properties. This polymer is widely used in medical and petrochemical engineering industries,
*Corresponding author: [email protected] 52

Alihemati, Navarchian
especially as a suspending agent in suspension polymerization [1-3]. Commercially, PVA is manufactured by saponification of polyvinyl acetate (PVAc). Partially hydrolyzed PVA is a copolymer of vinyl alcohol (hydrophilic group) and vinyl acetate (hydrophobic group). This means that PVA can interact with organic particles when dissolved in an aqueous phase and reduce their settling rate and therefore, is appropriate as a suspending agent. As an example, PVA can be used in the suspension polymerization of vinyl chloride monomer (VCM) in which the monomer is first dispersed in water, forming small droplets. The use of a surface-active suspending agent like PVA reduces the interfacial tension between the phases and facilitates dispersion. The suspending agent also reduces droplet size and forms a protective film, preventing the droplets from coalescing during polymerization. The properties of the resultant polyvinyl chloride (PVC) powder, including the size and shape of particles and bulk density, vary depending on the particle forming process during the polymerization. In the particle forming process, the role of PVA is very critical, where the properties of PVC powder depend mostly on the surface activity performance of PVA [4, 5]. Two different PVAs are used in suspension polymerization. The primary suspending agent with degree of hydrolysis (DH) around 70-80 % and high molecular weight (MW) is used in the initial stage of polymerization to protect the monomer droplets and prevent their coalescence. The secondary suspending agent with DH in the range of 30-60 % and lower MW plays a role in the final stage of
polymerization to prevent the polymer particle coagulation. While the former control the bulk density, the latter adjust the porosity of final PVC product [5, 6]. Several studies have indicated that the important factors in hydrolysis reaction affecting the above-mentioned properties are temperature, catalyst concentration and type of solvent used for hydrolysis reaction [7-9]. Navarchian et al. studied the effects of reaction time and temperature on degree of hydrolysis. They found that the higher DH values were obtained for the saponified samples prepared at longer reaction times and higher temperatures [8]. Soltani et al. investigated the effect of saponification time on PVA molecular weight prepared through solution polymerization. They suggested that DH of PVA was increased by increasing saponification time [10]. Lee et al. concluded that the higher DH values were obtained by increasing saponification time and temperature [11]. The final properties of PVA depend not only on the degree of hydrolysis and molecular weight, but also on the distribution pattern of acetate groups. It has been suggested that acetate and hydroxyl groups should be distributed in a block sequence along the chain to enhance the protective colloid ability of the PVA as a primary suspending agent. The blockiness in hydroxyl/acetate groups distribution of copolymer is increased by addition of some chemicals such as benzene, acetone and methyl acetate to the alcoholysis solvent [12, 13, 14]. Response surface methodology (RSM) is an efficient experimental design method for response optimization. This technique uses the
Iranian Journal of Chemical Engineering, Vol. 14, No. 1 (Winter 2017) 53

Response Surface Methodology for Investigating the Effects of Hydrolysis Reaction Parameters on Molecular Structure and Performance of Polyvinyl Alcohol as Primary Suspending Agent
smallest possible number of runs to specify statistically the influences of the different factors on the performance and determine the optimal conditions for the process [15]. Though several authors have examined the effects of reaction parameters on the quality of PVA using a “one-at-a-time” approach, there is no report available on the application of RSM for statistical analysis of the hydrolysis reaction factors influencing the structural properties of PVA as primary suspending agent. Besides, in spite of various studies on PVA synthesis and its hydrolysis reaction, no report is available investigating the effect of catalyst addition method (drop-wise versus once-addition of catalyst) on hydroxyl groups distribution. In this study, PVAc was first synthesized by solution polymerization and then converted to PVA by alkaline alcoholysis. The influences of reaction parameters on saponification reaction were statistically investigated and the optimal conditions were obtained by using RSM approach. The optimal PVA sample was investigated for its distribution of acetate groups, and its suspending performance was studied in a typical VCM suspension polymerization. The influences of the addition of benzene and NaOH addition method (drop-wise versus one-step addition) on the distribution of acetate groups were also investigated by using C nuclear magnetic resonance (C NMR) spectroscopy.
2. Experimental 2.1. Materials Vinyl acetate (VAc) monomer (>99 % purity), methanol (MeOH), sodium hydroxide (NaOH)
(>97 % purity), acetone (>99 % purity) and benzene were purchased from Merck (Germany). Vinyl acetate was freed from inhibitor by washing with 1 % aqueous solution of sodium hydroxide and distilled water [16]. The α,α'-azobisisobutyronitrile (AIBN) as initiator for VAc polymerization was obtained from Autochem (France) and was purified by recrystallization from methanol. The commercial PVA (Alcotex® B72, a primary suspending agent) with known characteristics (DH=71.5-73.5, Mv=30000 g/mol) was used as standard sample. VCM, dimyristyl peroxydicarbonate as initiator and Alcotex® 522P (a PVA with DH=55 %) used as a secondary suspension agent were supplied by Bandar Imam Petrochemical Company (Iran).
2.2. Design of experiments A Box-Behnken design was used to optimize the outcomes in this study [17, 18]. The selected factors were time and temperature of saponification and concentration of catalyst, each at 3 levels (Table 1). The design comprised 15 experimental runs as shown in Table 2. The DH value was the main response as it is well known that this property highly affects the suspending performance. Here, the viscosity-averaged molecular weight (Mv) was also measured as a second response. To avoid systematic bias, the sequence in which the runs were performed was randomized [17, 19]. The results were statistically analyzed using Design-Expert® software version 7.0.0.
2.3. Solution polymerization of VAc The polymerization of VAc was carried out in
54 Iranian Journal of Chemical Engineering, Vol. 14, No. 1 (Winter 2017)

Alihemati, Navarchian
a three-necked round bottom 250 ml flask immersed in a water bath and equipped with a mechanical stirrer, reflux condenser, and nitrogen flow. The specified amounts of VAc and methanol (volume ratio of VAc/MeOH: 3/1) were added to the reactor and its temperature was set to 60 °C under a slow stream of nitrogen gas. The initiator (AIBN/VAc molar ratio of 15:10000) was dissolved in 10 ml of methanol and added
drop wise to the reactor for initiating the polymerization reaction. The monomer/solvent and initiator/monomer ratios were selected in accordance with our previous work [9]. At the end of the reaction time (4 h), the reactor content was cooled to room temperature, precipitated in distilled water, and then dried in a vacuum oven at 60 °C for 24 h.
Table 1 Selected factors and their respective levels. Factor Unit Level 1 Level 2 Level 3 Saponification temperature (A) oC 40 50 60 Saponification time (B) min 20 40 60 NaOH/PVAc molar ratio (C) - 0.04 0.06 0.08
Table 2 Designed experiments according to the Box-Behnken method. Trial no. Factors Responses A B C DH (%) Mv (g/mol) 1 50 40 0.06 85.90 35090 2 40 40 0.04 72.00 49000 3 60 20 0.06 83.33 38540 4 40 40 0.08 90.91 32400 5 60 60 0.06 90.60 33900 6 40 20 0.06 78.18 47000 7 50 40 0.06 86.60 35050 8 60 40 0.08 94.90 31400 9 50 40 0.06 85.30 36000 10 60 40 0.04 81.72 40540 11 50 60 0.04 79.00 44000 12 50 20 0.04 69.00 57000 13 50 60 0.08 99.80 30560 14 50 20 0.08 80.80 43570 15 40 60 0.06 87.50 34900
2.4. PVAc saponification PVAc (3 g) was dissolved in 120 ml of methanol in the above-mentioned reactor. After complete dissolution of PVAc, a
NaOH/methanol solution (50/50 v/v) was added to the mixture while stirring at the predetermined temperature for the specified time. The amount of solution added was such
Iranian Journal of Chemical Engineering, Vol. 14, No. 1 (Winter 2017) 55
Response Surface Methodology for Investigating the Effects of Hydrolysis Reaction Parameters on Molecular Structure and Performance of Polyvinyl Alcohol as Primary Suspending Agent
predetermined temperature for the specified time. The amount of solution added was such that the NaOH/polymer ratio was kept at specified ratio according to Table 2. The powder was precipitated, filtered and then washed several times with methanol. The precipitate was then dried in a vacuum oven at 40 °C to reach a constant weight [10].
2.5. Suspension polymerization of vinyl chloride A 5 L jacketed stainless steel reactor was used for batch suspension polymerization of vinyl chloride using optimal sample or commercial PVA polymer (Alcotex® B72) as a primary suspending agent (0.66 g) in two separate experiments. The polymerization of VCM (1000 g) was performed at 54 °C with water/monomer=2 (w/w), and in presence of a secondary suspending agent (Alcotex® 552P: 1.2 g) and initiator (Dimyristyl peroxydicarbonate: 2.12 g). The reaction time was 400 min when the monomer pressure was reduced from 7 bar to 3.5 bar.
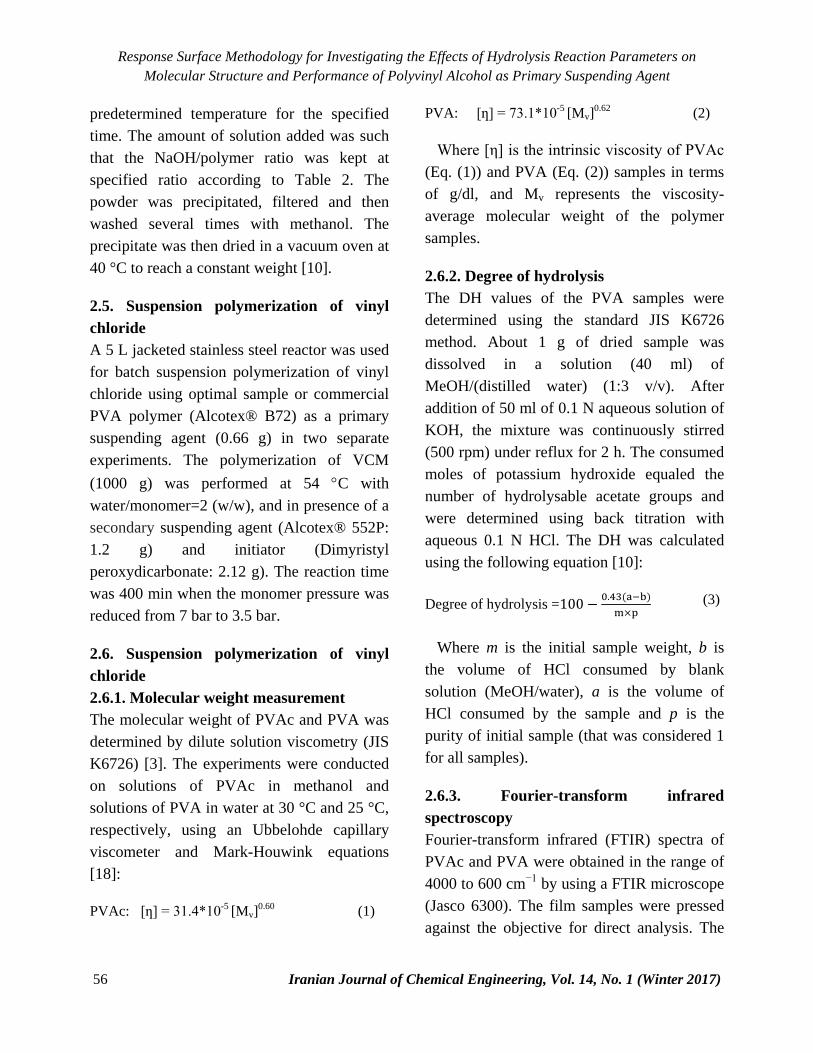
2.6. Suspension polymerization of vinyl chloride 2.6.1. Molecular weight measurement The molecular weight of PVAc and PVA was determined by dilute solution viscometry (JIS K6726) [3]. The experiments were conducted on solutions of PVAc in methanol and solutions of PVA in water at 30 °C and 25 °C, respectively, using an Ubbelohde capillary viscometer and Mark-Houwink equations [18]:
PVAc: [ƞ] = 31.4*10-5 [Mv]0.60 (1)
PVA: [ƞ] = 73.1*10-5 [Mv]0.62 (2)
Where [η] is the intrinsic viscosity of PVAc (Eq. (1)) and PVA (Eq. (2)) samples in terms of g/dl, and Mv represents the viscosity-average molecular weight of the polymer samples.
2.6.2. Degree of hydrolysis The DH values of the PVA samples were determined using the standard JIS K6726 method. About 1 g of dried sample was dissolved in a solution (40 ml) of MeOH/(distilled water) (1:3 v/v). After addition of 50 ml of 0.1 N aqueous solution of KOH, the mixture was continuously stirred (500 rpm) under reflux for 2 h. The consumed moles of potassium hydroxide equaled the number of hydrolysable acetate groups and were determined using back titration with aqueous 0.1 N HCl. The DH was calculated using the following equation [10]:
Degree of hydrolysis =100 − 0.43(a−b)m×p
(3)
Where m is the initial sample weight, b is the volume of HCl consumed by blank solution (MeOH/water), a is the volume of HCl consumed by the sample and p is the purity of initial sample (that was considered 1 for all samples).
2.6.3. Fourier-transform infrared spectroscopy Fourier-transform infrared (FTIR) spectra of PVAc and PVA were obtained in the range of 4000 to 600 cm−1 by using a FTIR microscope (Jasco 6300). The film samples were pressed against the objective for direct analysis. The
56 Iranian Journal of Chemical Engineering, Vol. 14, No. 1 (Winter 2017)
Alihemati, Navarchian
The 13C NMR spectroscopy was performed using an Ultrashield 400 MHz spectrometer
(Bruker, Germany) to study the distribution of
hydroxyl groups in the PVA chains. DMSO-d6 was used as solvent.
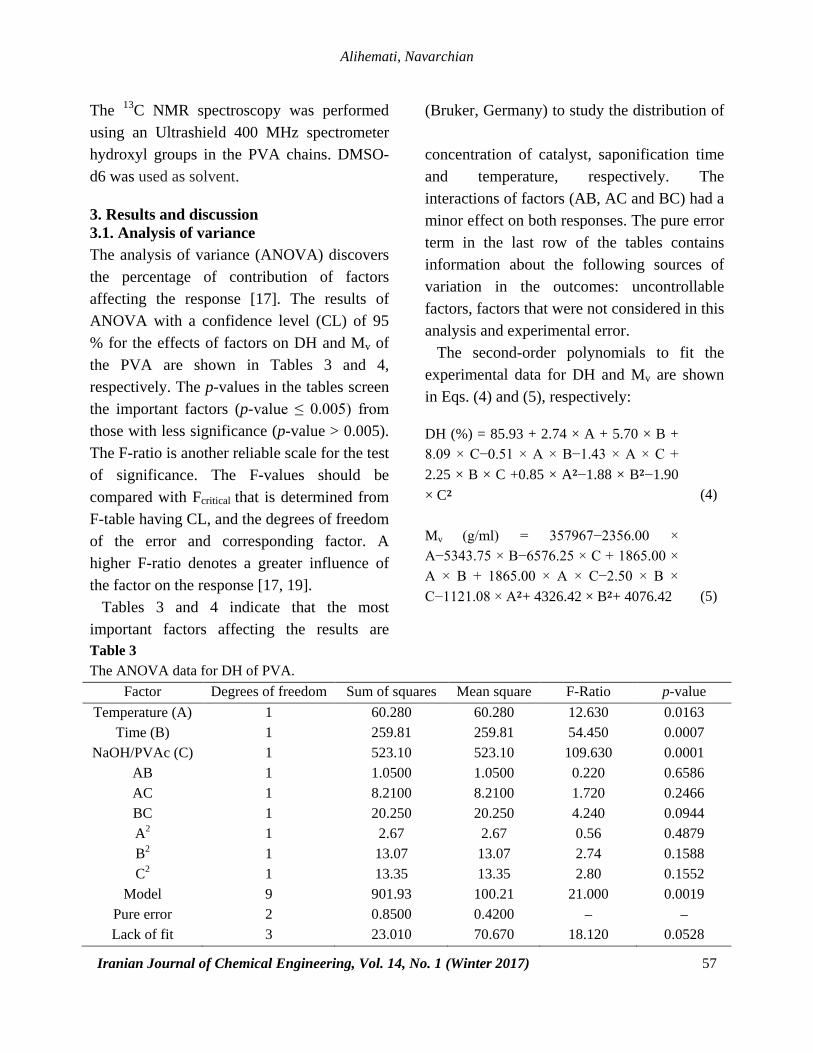
3. Results and discussion 3.1. Analysis of variance The analysis of variance (ANOVA) discovers the percentage of contribution of factors affecting the response [17]. The results of ANOVA with a confidence level (CL) of 95 % for the effects of factors on DH and Mv of the PVA are shown in Tables 3 and 4, respectively. The p-values in the tables screen the important factors (p-value ≤ 0.005) from those with less significance (p-value > 0.005). The F-ratio is another reliable scale for the test of significance. The F-values should be compared with Fcritical that is determined from F-table having CL, and the degrees of freedom of the error and corresponding factor. A higher F-ratio denotes a greater influence of the factor on the response [17, 19]. Tables 3 and 4 indicate that the most important factors affecting the results are
concentration of catalyst, saponification time and temperature, respectively. The interactions of factors (AB, AC and BC) had a minor effect on both responses. The pure error term in the last row of the tables contains information about the following sources of variation in the outcomes: uncontrollable factors, factors that were not considered in this analysis and experimental error. The second-order polynomials to fit the experimental data for DH and Mv are shown in Eqs. (4) and (5), respectively:
DH (%) = 85.93 + 2.74 × A + 5.70 × B + 8.09 × C−0.51 × A × B−1.43 × A × C + 2.25 × B × C +0.85 × A𝟐𝟐−1.88 × B𝟐𝟐−1.90 × C𝟐𝟐
(4)
Mv (g/ml) = 357967−2356.00 × A−5343.75 × B−6576.25 × C + 1865.00 × A × B + 1865.00 × A × C−2.50 × B × C−1121.08 × A𝟐𝟐+ 4326.42 × B𝟐𝟐+ 4076.42
(5)
Table 3 The ANOVA data for DH of PVA.
Factor Degrees of freedom Sum of squares Mean square F-Ratio p-value Temperature (A) 1 60.280 60.280 12.630 0.0163
Time (B) 1 259.81 259.81 54.450 0.0007 NaOH/PVAc (C) 1 523.10 523.10 109.630 0.0001
AB 1 1.0500 1.0500 0.220 0.6586 AC 1 8.2100 8.2100 1.720 0.2466 BC 1 20.250 20.250 4.240 0.0944 A2 1 2.67 2.67 0.56 0.4879 B2 1 13.07 13.07 2.74 0.1588 C2 1 13.35 13.35 2.80 0.1552
Model 9 901.93 100.21 21.000 0.0019 Pure error 2 0.8500 0.4200 – – Lack of fit 3 23.010 70.670 18.120 0.0528
Iranian Journal of Chemical Engineering, Vol. 14, No. 1 (Winter 2017) 57

Response Surface Methodology for Investigating the Effects of Hydrolysis Reaction Parameters on Molecular Structure and Performance of Polyvinyl Alcohol as Primary Suspending Agent
Table 4 The ANOVA data for Mv of PVA.
Factor Degrees of freedom Sum of squares Mean square F-Ratio p-value
Temperature (A) 1 4.475 E+007 4.475E+007 19.49 0.0069 Time (B) 1 2.284E+008 2.284E+008 99.50 0.0002
NaOH/PVAc (C) 1 3.460E+008 3.460E+008 150.70 <0.0001 AB 1 1.391E+007 1.391E+007 6.06 0.0571 AC 1 1.391E+007 1.391E+007 6.06 0.0571 BC 1 25.00 25.00 1.089E-005 0.9975 A2 1 4.461E+006 4.461E+006 2.02 0.2144 B2 1 6.911E+007 6.911E+007 30.10 0.0027 C2 1 6.136E+007 6.136E+007 26.72 0.0036
Model 9 7.792E+008 8.658E+007 37.71 0.0005 Pure error 2 5.780E+005 2.890E+005 – – Lack of fit 3 1.090E+007 3.634E+006 12.57 0.0746
Where A, B, and C represent the coded levels (1, 2 and 3) of the independent variables of temperature, time and NaOH/PVAc molar ratio, respectively. Regression parameter R2 is used to show the agreement level between the experimental responses and the responses predicted by the model. The R2 values from Eqs. (4) and (5) were 0.9742 and 0.9855, respectively, indicating relatively good agreement between the experimental and predicted data. The lack of fit parameters in Tables 3 and 4 are insignificant (p-value > 0.005), suggesting that the regression models both could adequately describe the functional relationship between the experimental factors and the response variables. The counter plot is the locus of the responses with equal values. It is a projection of three dimensional response surface plots on a plane [14, 18, 19]. Figure 1 indicates the counter plots of the three pairs of factors affecting on DH.
3.2. Effect of reaction parameters on DH and Mv The influences of saponification temperature, saponification time, and NaOH/PVAc molar ratio on DH and Mv of PVA are shown in the main effect plots in Figs. 2 and 3, respectively. It is observed in Tables 3 and 4 that DH and Mv both strongly depend on the concentration of the catalyst. At higher catalyst concentration, Mv decreases and DH increased. The first step in the saponification reaction is the attack on the carbonyl carbon atom of the acetate group by the anion of alcohol (CH3O-). Increasing the catalyst concentration decreases the activation energy of this step in the saponification reaction leading to higher reaction rate and therefore, greater DH [21]. The VAc radical tends to transfer to species in the polymerization system due to its high activity. When the chain transfers to macromolecule it results in chain branches during VAc polymerization, which usually
58 Iranian Journal of Chemical Engineering, Vol. 14, No. 1 (Winter 2017)

Alihemati, Navarchian
occurs on the carbon of acetate group (Eq. 6-a and 6-b)). During the alcoholysis reaction, these branches are separated from the main
chain by replacing the acetate with the hydroxyl group so that Mv of PVA decreases [9, 21, 22].
(6-a)
(6-b)
Figure 1. The counter plots of the three pairs of factors affecting on DH.
Iranian Journal of Chemical Engineering, Vol. 14, No. 1 (Winter 2017) 59

Response Surface Methodology for Investigating the Effects of Hydrolysis Reaction Parameters on Molecular Structure and Performance of Polyvinyl Alcohol as Primary Suspending Agent
Figure 2. The influence of saponification
temperature, saponification time and NaOH/PVAc molar ratio on the DH of PVA.
Figure 3. The influence of saponification temperature, saponification time and
NaOH/PVAc molar ratio on the Mv of PVA.
Because saponification of PVAc in alkaline solution is an endothermic reaction, increasing the saponification temperature increases the rate of reaction and therefore, increases DH (Fig. 2). On the other hand, the higher temperature may also lead to an undesired reaction. In alkaline alcoholysis at higher temperatures, the unreacted vinyl acetate monomers react with the methanol (solvent alcoholysis; Eq. (7)), leading to production of alkyl acetate and acetaldehyde. Alkyl acetate in turn reacts with catalyst used for alcoholysis (NaOH) and forms sodium acetate (Eq. (8)) [3].
ROAcCHO3CHalkalioracidROHVAc ++ → (7)
NaOAcROHO2H
NaOHROAc ++ → (8)
As observed in Fig. 2, the DH value of the PVA increases at longer saponification times [11, 23]. The number of hydroxyl groups increases with time in the polymer chain and the autocatalytic effect of these functional groups continuously increases the rate of alcoholysis [3]. Figure 4 shows the relationship between Mv and DH for various PVA samples synthesized in this work (Table 2). It is observed that the Mv declines as the DH increases. The relation between Mv and DH can be expressed by a second-order polynomial equation as observed in Fig. 4.
Figure 4. The relationship between Mv and DH of PVA.
69
76.5
84
91.5
99
1 2 3
DH
(%)
Factor levels
temperaturetimeNaOH/PVAc
30000
36750
43500
50250
57000
1 2 3
Mv
(g/m
ol)
Factor levels
tempraturetimeNaOH/PVAc
y = 22.264 x2 - 4620.5 x + 269235 R2 = 0.9619
30000
40000
50000
60000
65 70 75 80 85 90 95 100
Mv (
g/m
ol)
DH%
Temperature Time NaOH/PVAc
Temperature Time NaOH/PVAc
60 Iranian Journal of Chemical Engineering, Vol. 14, No. 1 (Winter 2017)

Alihemati, Navarchian
3.3. Optimal conditions The goal of optimization in this study was to attain a DH value in the range of 70-72 % while keeping the molecular weight as high as possible and a block sequence distribution for hydroxyl and acetate groups on the backbone for PVA as a primary suspending agent. The blockiness is usually attained when NaOH is used as a catalyst [3]. It is well known that DH value for PVA has a more significant effect than MW on the morphological characteristics of PVC. Thus, the main optimal target would be DH nominal value. As mentioned, in the early stages of reaction, the primary suspending agent protects the monomer droplets from clotting. The use of PVA with the above-mentioned range of DH, high molecular weight and block sequence of hydroxyl/acetate groups increases the bulk density of the product in a suspension polymerization [24]. Here, an 83 % weight factor was considered for DH (and 17 % for Mv) to obtain an overall evaluation criteria in optimization. The optimal conditions were obtained as T=45 °C, t=33 min and NaOH/PVAc= 0.05.
3.4. Structure characterization The representative FTIR spectra of PVAc and optimum PVA sample are shown in Fig. 5. The PVAc spectrum includes peaks at 1630–1850 cm-1 and 1200–1300 cm-1, attributed to the stretching bands of ester groups. Vinyl polymers, including PVAc and PVA, exhibit bands at 2800–3000 cm-1 that can be ascribed to the stretching vibrations of the CH and CH2 groups. The peaks that appeared at 1300–1500 cm-1 are assigned to CH/CH2 deformation
vibrations. Hydroxyl groups in the PVA showed peaks at 3200–3650 cm-1. The peak observed around 1730 cm-1 appearing in PVA is related to carbonyl group of the residual acetate groups in the PVA [25, 26].
3.5. Group sequence distribution Figure 6 indicates the 13C NMR spectra of optimum PVA samples prepared in two different alcoholysis solvent (a: in methanol, b: in methanol/benzene (3/1)). The most interesting region for study of the group sequence distribution in these spectra is the methylene region (44-47 ppm). The methylene carbon region consists of three well-resolved peaks that are ascribed to the three dyad sequences for hydroxyl and acetate groups (denoted as OH and AC, respectively). The symbols for alcohol-alcohol, alcohol-acetate and acetate-acetate, shown as (OH,OH), (OH,AC), and (AC,AC), are the mole fractions of the corresponding dyad calculated from the integrated intensities of the methylene peaks in the spectra. The block character (η) of the partially hydrolyzed PVA that is actually poly (vinyl alcohol-vinyl acetate) copolymers is obtained from the following intensity ratio as [27, 28]:
η =(OH, AC)
2 (OH)(AC)
(9)
Where η is a measure of departure from random character. Block distributions require 0≤η<1 (the smaller the η value, the more blocky the structure configuration is), for completely random cases, we have η = 1, and for alternative copolymers, 1<η≤ 2. The mole fractions of vinyl alcohol and vinyl acetate
Iranian Journal of Chemical Engineering, Vol. 14, No. 1 (Winter 2017) 61

Response Surface Methodology for Investigating the Effects of Hydrolysis Reaction Parameters on Molecular Structure and Performance of Polyvinyl Alcohol as Primary Suspending Agent
units are then expressed in terms of dyad peak intensities, as shown in the following equations:
(OH) = (OH, OH) + (OH, AC)
2
(10)
(A𝐶𝐶) = (AC, AC) + (OH, AC)
2
(11)
Figure 5. The FTIR spectra of PVAc and optimal PVA.
Figure 6. The 13C NMR spectra of optimal PVA prepared in two different alcoholysis solvents: (a)
methanol, (b) methanol/benzene (3/1). The methylene regions are expanded in both spectra for better resolution.
62 Iranian Journal of Chemical Engineering, Vol. 14, No. 1 (Winter 2017)

Alihemati, Navarchian
The η values for samples a and b are 0.5 and 0.3, respectively. The value of η was lower for sample b that means a higher blocky distribution of OH/AC groups. This is most probably because of the fact that benzene solvent has a lower dielectric constant than methanol; thus, the tendency of hydrogen bonding formation is higher for sample b and the OH groups tend to stay close together. Dielectric constants for methanol and benzene are 33 and 2.3, respectively [29]. Figure 7 shows the 13C NMR spectra of the methylene (-CH2) region (44–47 ppm) for two PVA samples (a and b) synthesized via two different alcoholysis catalyst addition (drop-wise and one-step addition, respectively) while keeping the other optimum conditions. The NMR analysis shows that the distribution depends on catalyst addition method. The η values for samples a and b are 0.36 and 0.28, respectively. It can be seen that though both PVA samples have block distribution for hydroxyl groups, the sample produced through one-step addition method has a smaller block character. In one-step addition method, more acetate groups are hydrolyzed suddenly, so due to autocatalytic effect a more blocky structure can be formed as compared with drop-wise addition [3]. In case of drop-wise addition of catalyst sodium hydroxide selects more active centers for hydrolysis and substitute acetate groups with hydroxyl groups. Due to the low concentration of catalyst at each addition interval, few numbers of these groups are hydrolyzed beside each other.
3.6. The suspending performance of optimal PVA
The suspending performance of optimal PVA (sample a) was evaluated by its role on the morphology of PVC particles in a typical suspension polymerization. The SEM analysis was used to show the shape and size of PVC particles. Figures 8(a) and 8(b) show the PVC particles produced in presence of optimal and commercial PVA suspending agents, respectively. A very similar morphology is observed for both PVC samples. The size of primary particles for the former is around 0.2 µm, while it is about 0.1 µm for the latter. A higher porosity is observed, however, for the PVC sample prepared by the suspending agent prepared in this work. This may lead to higher plasticizer absorption for PVC end product. The primary size of PVC particles corresponds to those reported in literature [5]. It should be noted that the typical size of secondary particles in PVC produced in suspension polymerization is something between 150-200 µm [30].
4. Conclusions The effects of three alcoholysis parameters on the degree of hydrolysis and molecular weight of PVA were investigated. The NaOH/PVAc ratio, reaction time and temperature had significant effects, respectively, on DH and Mv. All three factors lead to increase in DH while decreasing Mv. The degree of polymerization of PVA decreased as the DH increased. The distributions of OH/acetate groups are blockier when benzene is added to the solvent of saponification reaction. Finally, the one-step addition method for catalyst addition has positive effect on the blockiness of these groups in PVA.
Iranian Journal of Chemical Engineering, Vol. 14, No. 1 (Winter 2017) 63

Response Surface Methodology for Investigating the Effects of Hydrolysis Reaction Parameters on Molecular Structure and Performance of Polyvinyl Alcohol as Primary Suspending Agent
Figure 7. The 13C NMR spectra of methylene region of the two synthesized polyvinyl alcohols: a) drop-
wise addition of catalyst and b) one-step addition of catalyst.
Figure 8. SEM micrographs of PVC particles prepared in presence of PVA as suspending agent: a) optimal
PVA prepared as sample a in this study, b) commercial PVA (Synthomer; UK).
64 Iranian Journal of Chemical Engineering, Vol. 14, No. 1 (Winter 2017)

Alihemati, Navarchian
References [1] Erbil, Y. H., Vinyl acetate emulsion
polymerization and copolymerization with acrylic monomers, CRC Press, New York, USA, (2010).
[2] Kokabi, M., Sirousazar M. and Hassan, Z. M., “PVA–clay nanocomposite hydrogels for wound dressing”, Eur. Polym. J., 43(3), 773 (2007).
[3] Finch, C. A., Polyvinyl alcohol: Properties and applications, Wiley Publishing, London, (1973).
[4] Leszczyńska, A., Njuguna, J., Pielichowski, K. and Banerjee, J. R., “Polymer/montmorillonite nanocomposites with improved thermal properties: Part I. factors influencing thermal stability and mechanisms of thermal stability improvement”, Thermochim. Acta., 453(2), 75 (2007).
[5] Ormondroyd, S., “The influence of polyvinyl alcohol suspending agents on suspension polyvinyl chloride morphology”, Brit. Polym. J., 20(4), 353 (1988).
[6] Bao, Y. Z. and Brooks, B. W., “Influences of some polymerization conditions on particle properties of suspension polyvinyl chloride resin”, J. Appl. Polym. Sci., 85(7), 1544 (2002).
[7] Fabini, M., Bobula, S., Rusina, M., Macho, V. and Harustiak, M., “Preparation of Polyvinyl alcohol as the dispersant for suspension vinyl chloride polymerizations”, Polymer, 35(10), 2201 (1994).
[8] Navarchian, A. H., Joulazadeh, M. and Mousazadeh, S., “Application of the Taguchi approach to investigate the effects
of clay content and saponification parameters on the tensile properties of polyvinyl alcohol/clay nanocomposites”, J. Vinyl. Addit. Techn., 19(4), 276 (2013).
[9] Navarchian, A. H. and Mousazadeh, S., “The effects of reaction variables on solution polymerization of vinyl acetate and molecular weight of polyvinyl alcohol using Taguchi experimental design”, Iran. J. Polym. Sci. Technol., 22, 341 (2009).
[10] Soltani, S., Asempour, H. and Jamshidi, H., “Investigation of reaction conditions for preparation of medium molecular weight polyvinyl alcohol as emulsifier”, Iran. Polym. J., 16(7), 439 (2007).
[11] Lee, S. G., Kim, J. P., Lyoo, W. S., Kwak, J. W., Noh, S. K., Park, C. S. and Kim, J. H., “Preparation of novel syndiotactic polyvinyl alcohol microspheres through the low‐temperature suspension copolymerization of vinyl pivalate and vinyl acetate and heterogeneous saponification”, J. Appl. Polym. Sci., 95(6), 1539 (2005).
[12] Garnaik, B. and Thombre, S. M., “Self‐association through hydrogen bonding and sequence distribution in poly (vinyl acetate‐co‐vinyl alcohol) copolymers”, J. Appl. Polym. Sci., 72(1), 123 (1999).
[13] Piirma, I., Polymeric surfactants, CRC Press, New York, USA, p. 110 (1992).
[14] Olabisi, O. and Adewale, K., Handbook of thermoplastics, 2nd ed., CRC Press, New York, USA, p. 58 (1997).
[15] Myers, R. H. and Montgomery, D. C., Response surface methodology, Wiley, New York, USA, (2002).
Iranian Journal of Chemical Engineering, Vol. 14, No. 1 (Winter 2017) 65

Response Surface Methodology for Investigating the Effects of Hydrolysis Reaction Parameters on Molecular Structure and Performance of Polyvinyl Alcohol as Primary Suspending Agent
[16] Brooks, B. W. and Makanjuola, B. O., “Seeded emulsion polymerization of vinyl acetate: Order of reaction with respect to initiator”, Polymer, 23(1), 77 (1982).
[17] Roy, R. K., Design of experiments using Taguchi approach: 16 steps to product and process improvement, Wiley, New York, USA, (2001).
[18] Betianu, C., Caliman, F. A., Gavrilescu, M., Cretescu, I., Cojocaru, C. and Poulios, I., “Response surface methodology applied for Orange II photocatalytic degradation in TiO2 aqueous suspensions”, J. Chem. Technol. Biotechnol., 83(11), 1454 (2008).
[19] Montgomery, D. C., Design and analysis of experiments, Wiley, New York, USA, (2007).
[20] Brandrup, J. and Immergut, E., Polymer handbook, Willey, California, USA, (1989).
[21] Haweel, C. and Ammar, S., “Preparation of polyvinyl alcohol from local raw material”, Iraqi J. Chem. Petrol. Eng., 9, 15 (2008).
[22] Wang, B., Bao, X., Jiang, M., Ye, G. and Xu, J., “Synthesis of high‐molecular weight polyvinyl alcohol by low‐temperature emulsifier‐free emulsion polymerization of vinyl acetate and saponification”, J. Appl. Polym. Sci., 125(4), 2771 (2012).
[23] Wada, Y., Seko, N., Nagasawa, N., Tamada, M., Kasuya, K. I. and Mitomo, H., “Biodegradability of poly (3-hydroxybutyrate) film grafted with vinyl
acetate: Effect of grafting and saponification”, Radit. Phys. Chem., 76(6), 1075 (2007).
[24] Zerfa, M. and Brooks, B., “Vinyl chloride dispersion with relation to suspension polymerisation”, Chem. Eng. Sci., 51(14), 3591 (1996).
[25] Kaczmarek, H. and Podgórski, A., “The effect of UV-irradiation on polyvinyl alcohol composites with montmorillonite”, J. Photochem. Photobiol., 191(2), 209 (2007).
[26] Yu, Y. H., Lin, C. Y., Yeh, J. M. and Lin, W. H., “Preparation and properties of polyvinyl alcohol–clay nanocomposite materials”, Polymer, 44(12), 3553 (2003).
[27] Garnaik, B. and Thombre, S. M., “Self‐association through hydrogen bonding and sequence distribution in poly (vinyl acetate‐co‐vinyl alcohol) copolymers”, J. Appl. Polym. Sci., 72(1), 123 (1999).
[28] Bugada, D. C. and Rudin, A., “Characterization of polyvinyl alcohol—acetate by 13C NMR and thermal analyses”, Polymer, 25(12), 1759 (1984).
[29] Wypych, G., Handbook of solvents, ChemTec Publishing, New York, USA, (2001).
[30] Etesami, N., Nasr Esfahany, M. and Bagheri, R., “Experimental study of the effect of reflux rate during suspension polymerization on particle properties of PVC resin”. Ind. Eng. Chem. Res., 49(5), 1997 (2010).
66 Iranian Journal of Chemical Engineering, Vol. 14, No. 1 (Winter 2017)