
Responding to the challenges of sugar reduction -...
42
Responding to the challenges of sugar reduction Chee-Wai FONG (PhD, BSc Pharm) RD&A Director - Nutrition
Transcript of Responding to the challenges of sugar reduction -...

Responding to the challenges of sugar reduction
Chee-Wai FONG (PhD, BSc Pharm)
RD&A Director - Nutrition
Outline
• Sugar reduction from the general wellness and health perspective
• Global pressure for sugar taxes and the issues implementing it
• The science behind sugar perception• Novel technologies to meet the challenge• The trend towards functional food in the consumer food
market
Reducing Sugar:
Why?
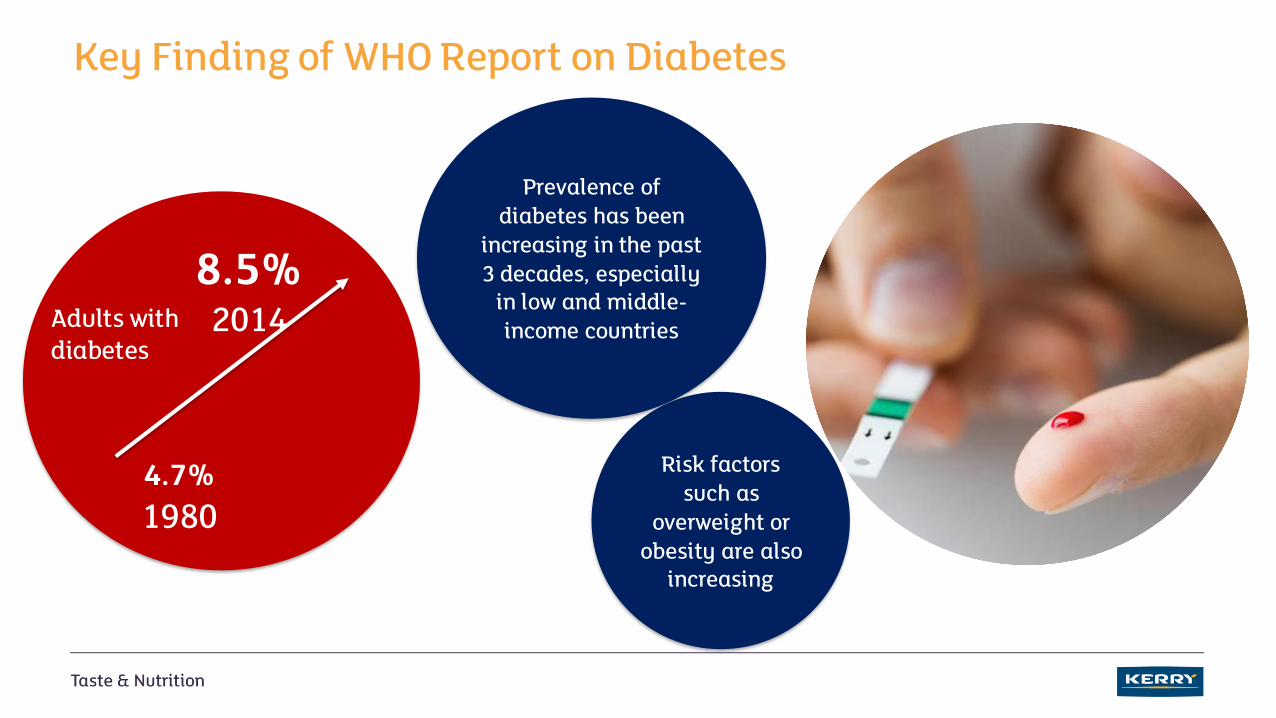
Key Finding of WHO Report on Diabetes
4.7%
1980
8.5%2014Adults with
diabetes
Prevalence of diabetes has been
increasing in the past 3 decades, especially
in low and middle-income countries
Risk factors such as
overweight or obesity are also
increasing
mintel.com
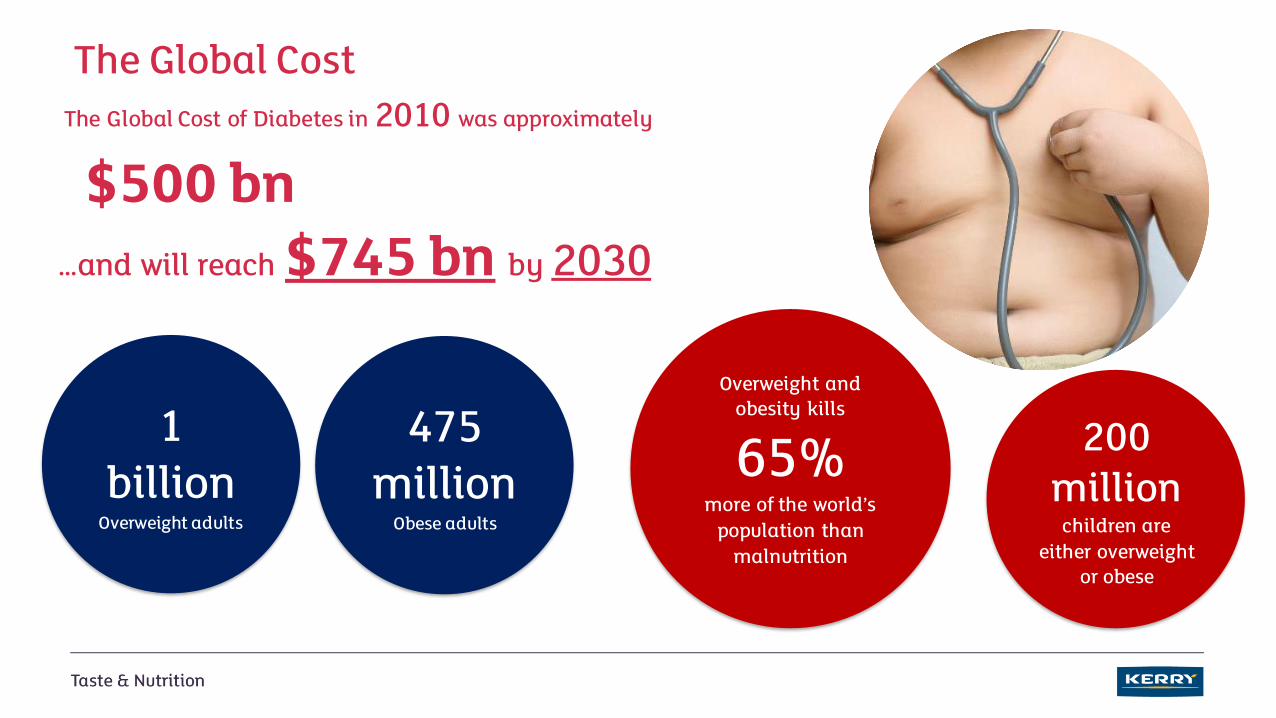
$500 bn…and will reach $745 bn by 2030
The Global Cost of Diabetes in 2010 was approximately
The Global Cost
1 billion
Overweight adults
Overweight and obesity kills
65% more of the world’s
population than malnutrition
200 million
children are either overweight
or obese
475 million
Obese adults
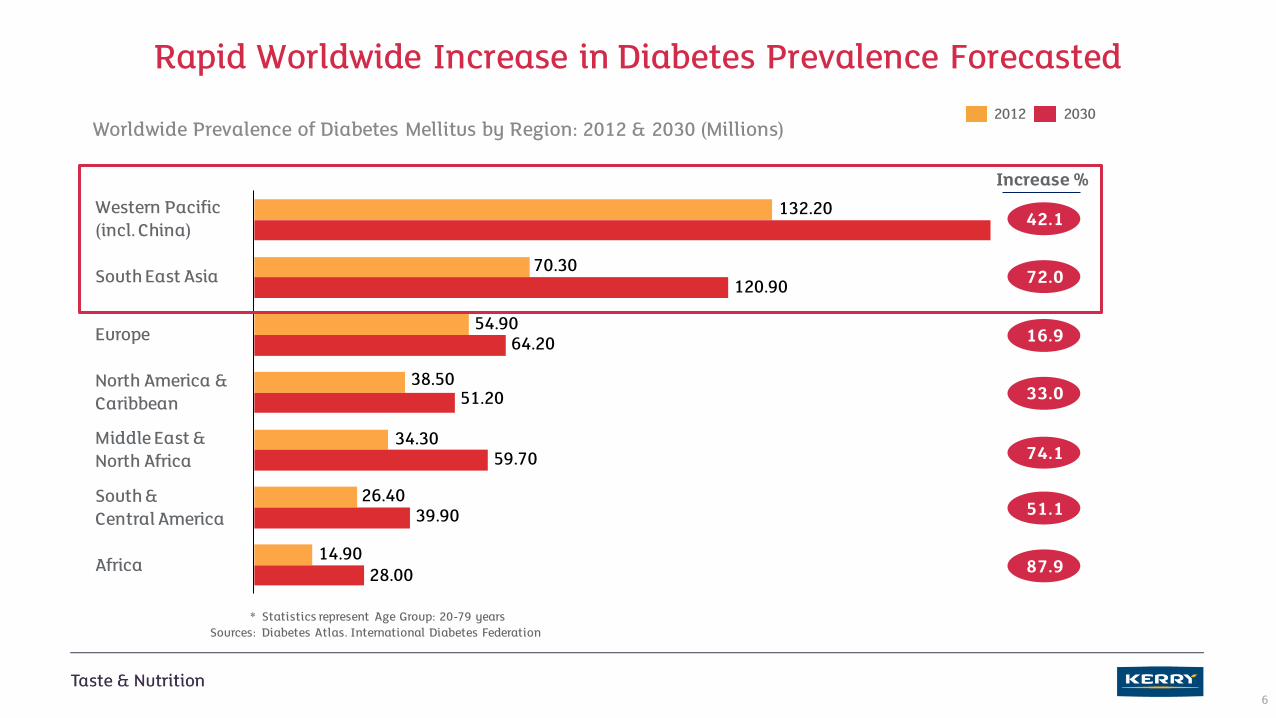
Rapid Worldwide Increase in Diabetes Prevalence Forecasted
6
Worldwide Prevalence of Diabetes Mellitus by Region: 2012 & 2030 (Millions)
132.20
70.30
54.90
38.50
34.30
26.40
14.90
120.90
64.20
51.20
59.70
39.90
28.00
Western Pacific(incl. China)
South &Central America
Africa
Middle East &North Africa
North America &Caribbean
Europe
South East Asia
20302012
Increase %
42.1
72.0
16.9
33.0
74.1
51.1
87.9
* Statistics represent Age Group: 20-79 yearsSources: Diabetes Atlas. International Diabetes Federation
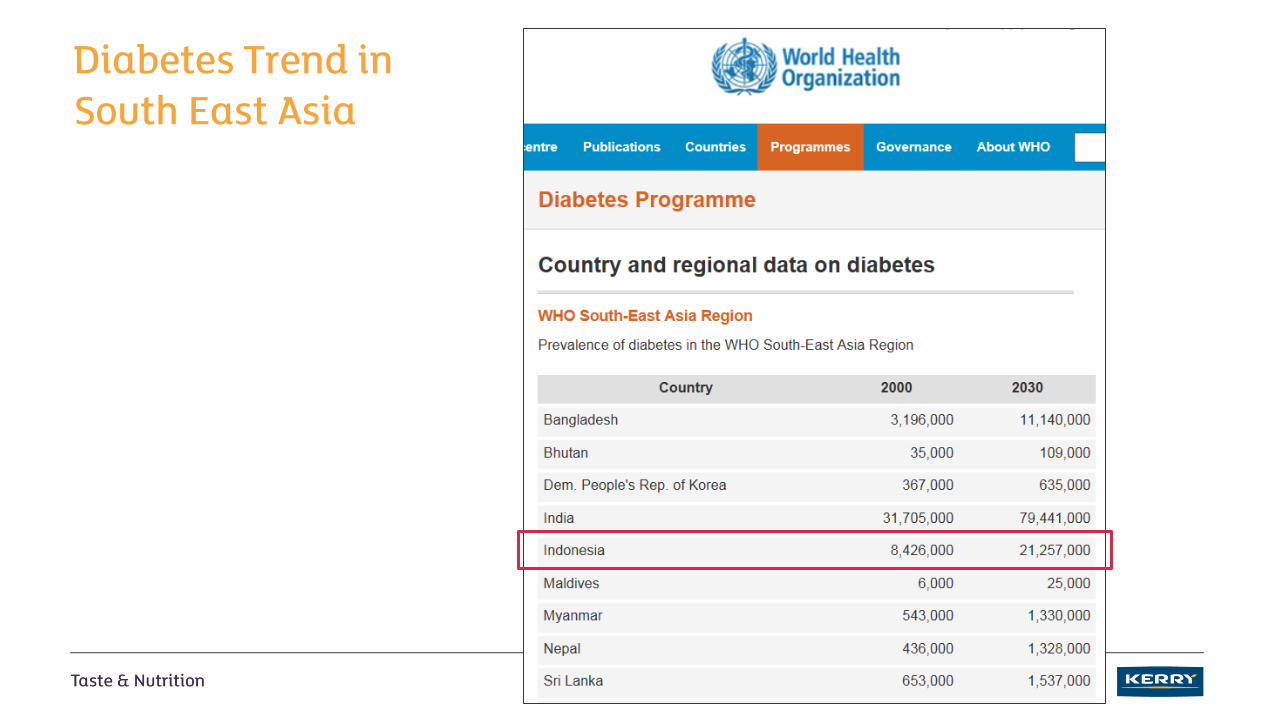
Diabetes Trend in South East Asia
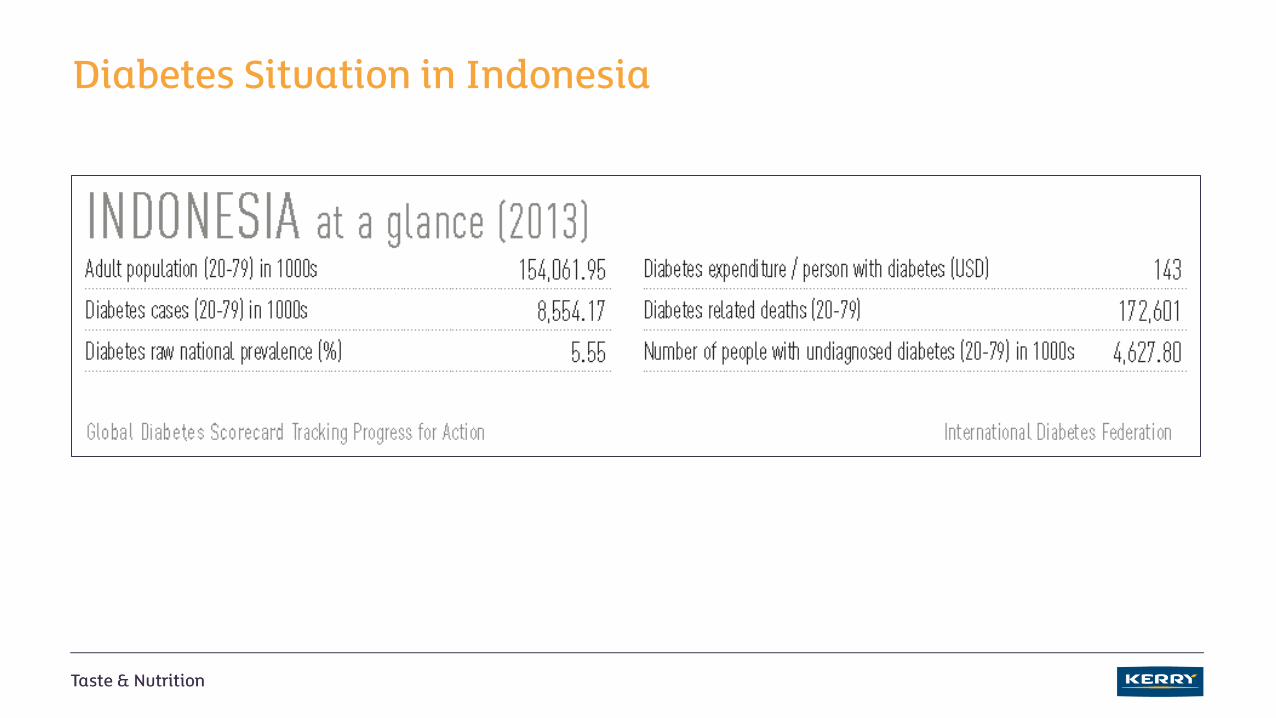
Diabetes Situation in Indonesia
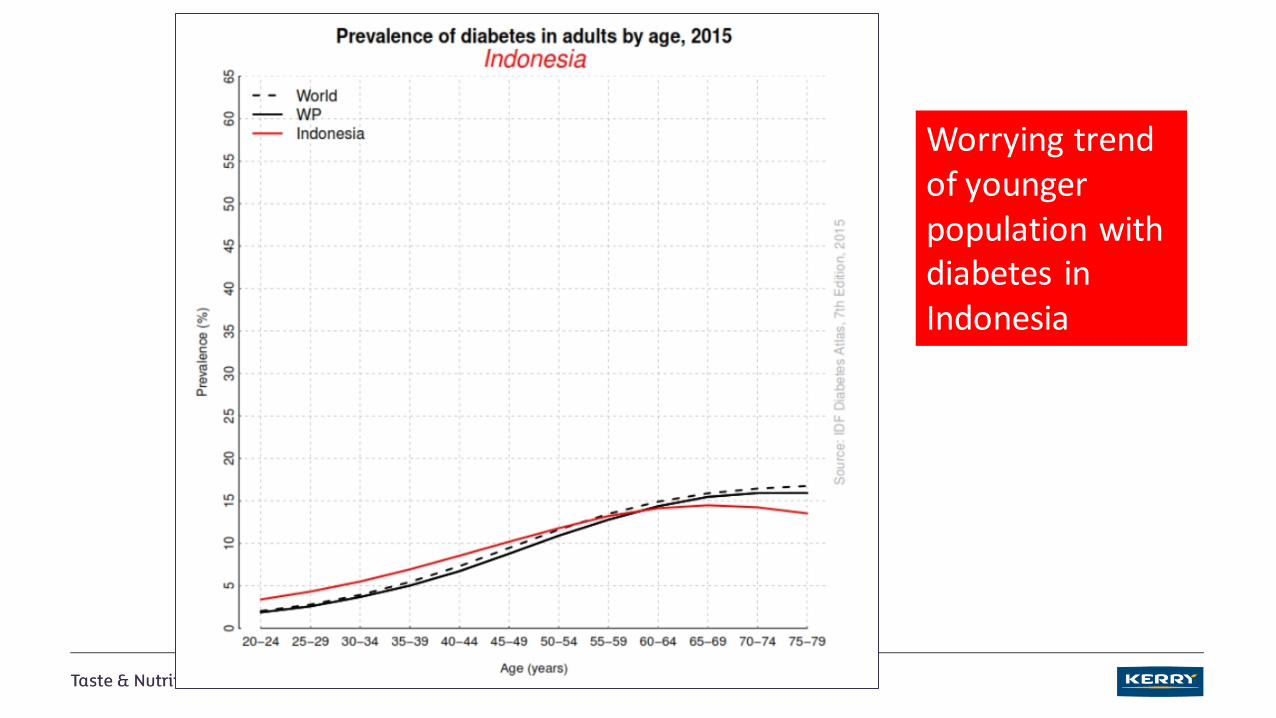
Worrying trend of younger population with diabetes in Indonesia
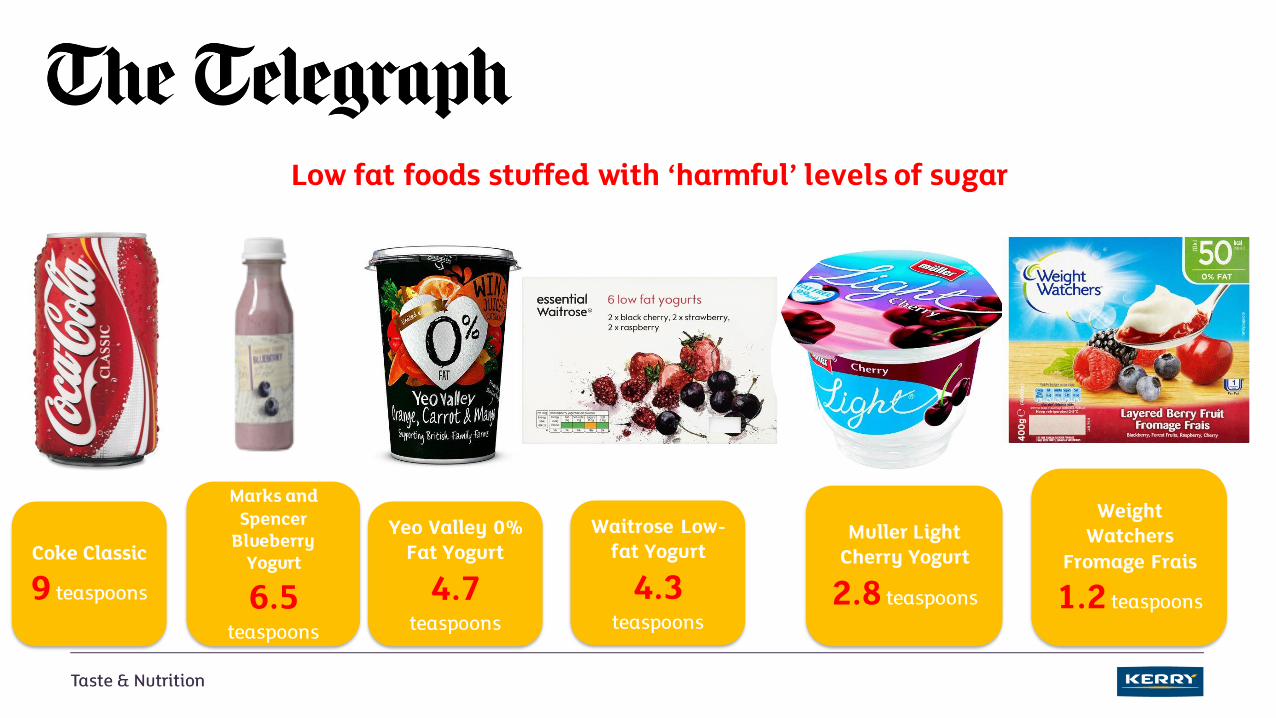
Low fat foods stuffed with ‘harmful’ levels of sugar
Coke Classic
9 teaspoons
Marks and Spencer
Blueberry Yogurt
6.5teaspoons
Yeo Valley 0% Fat Yogurt
4.7teaspoons
Waitrose Low-fat Yogurt
4.3teaspoons
Muller Light Cherry Yogurt
2.8 teaspoons
Weight Watchers
Fromage Frais
1.2 teaspoons
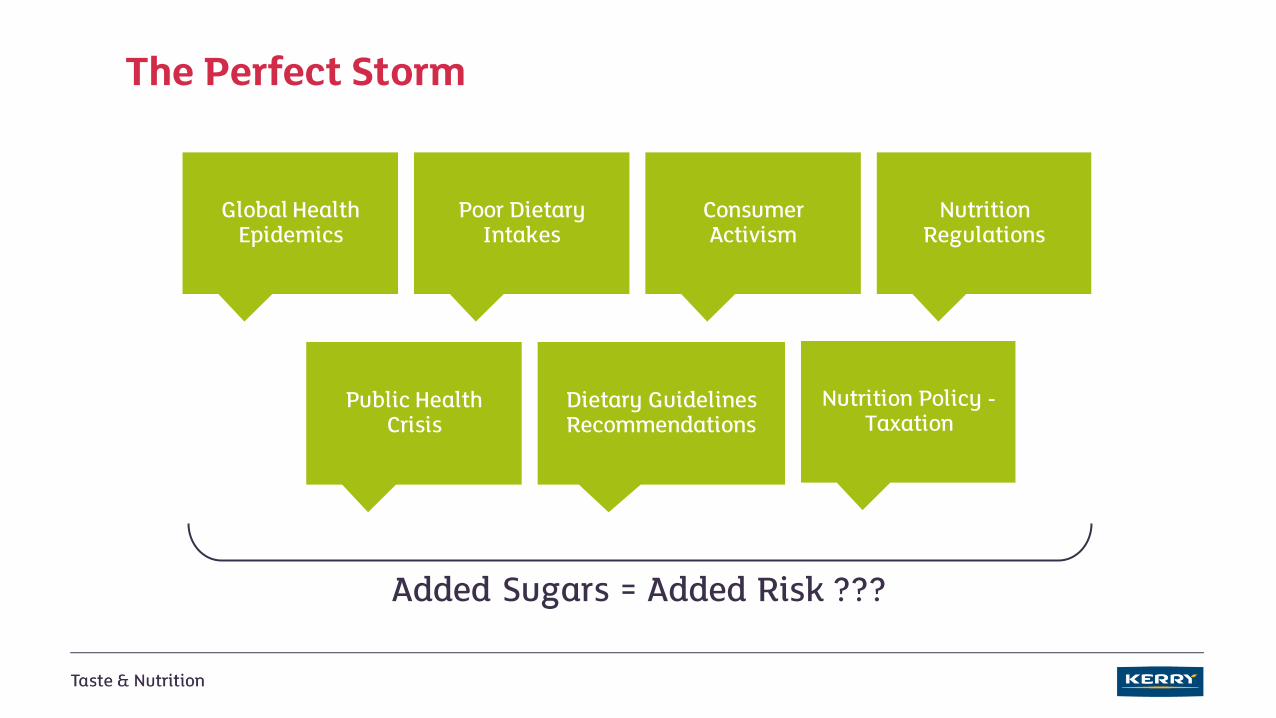
The Perfect Storm
Global Health Epidemics
Poor Dietary Intakes
Consumer Activism
Nutrition Regulations
Public Health Crisis
Dietary Guidelines Recommendations
Nutrition Policy -Taxation
Added Sugars = Added Risk ???
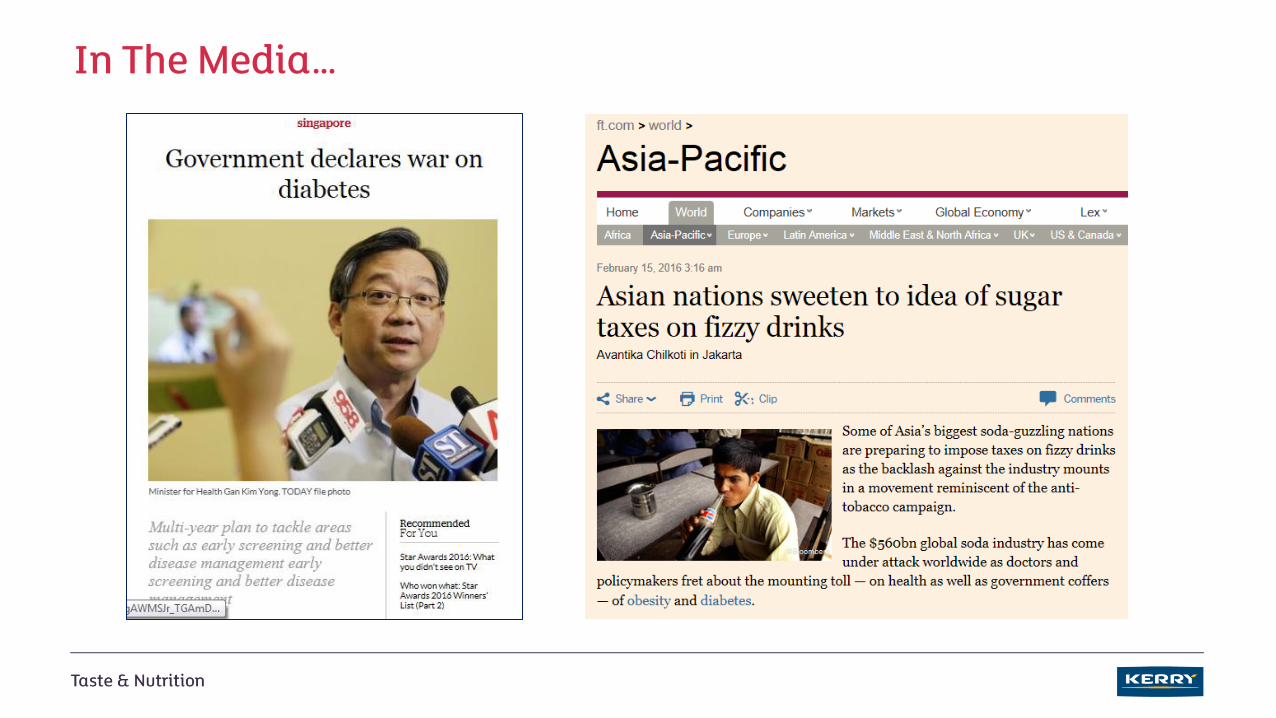
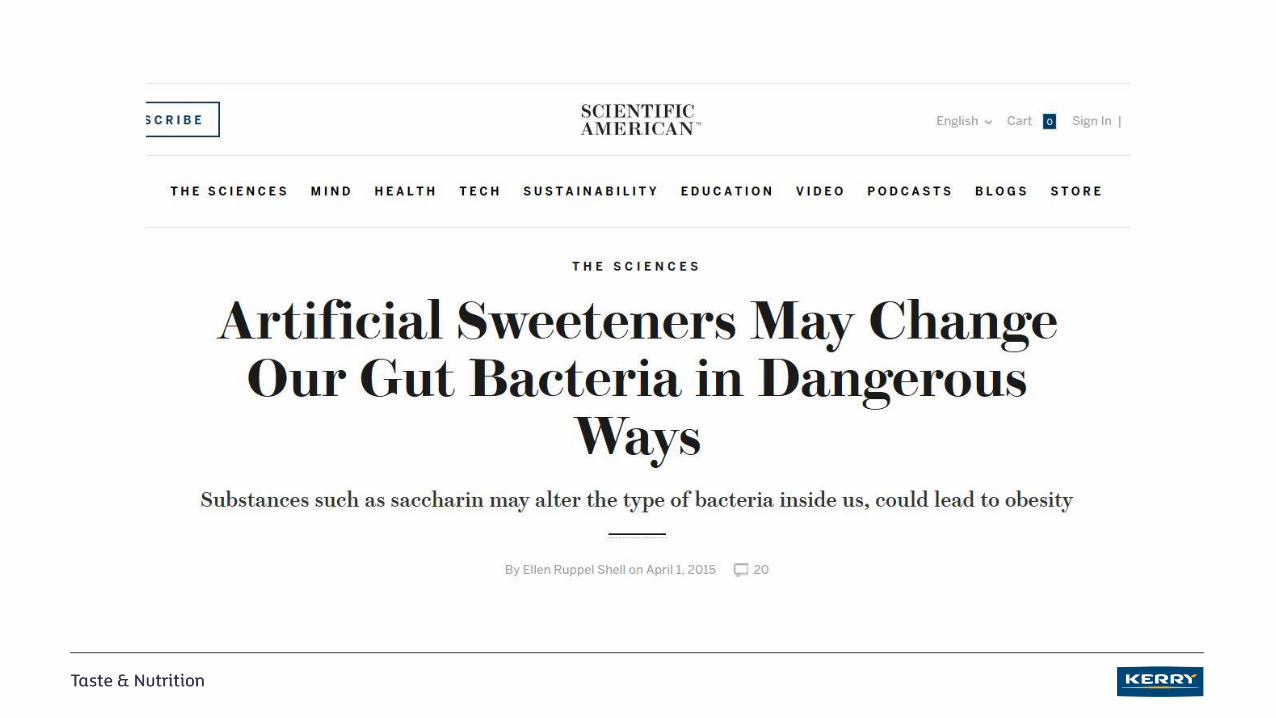
In The Media…

Reducing Sugar:
How?
Are High Intensity Sweeteners the Solution?
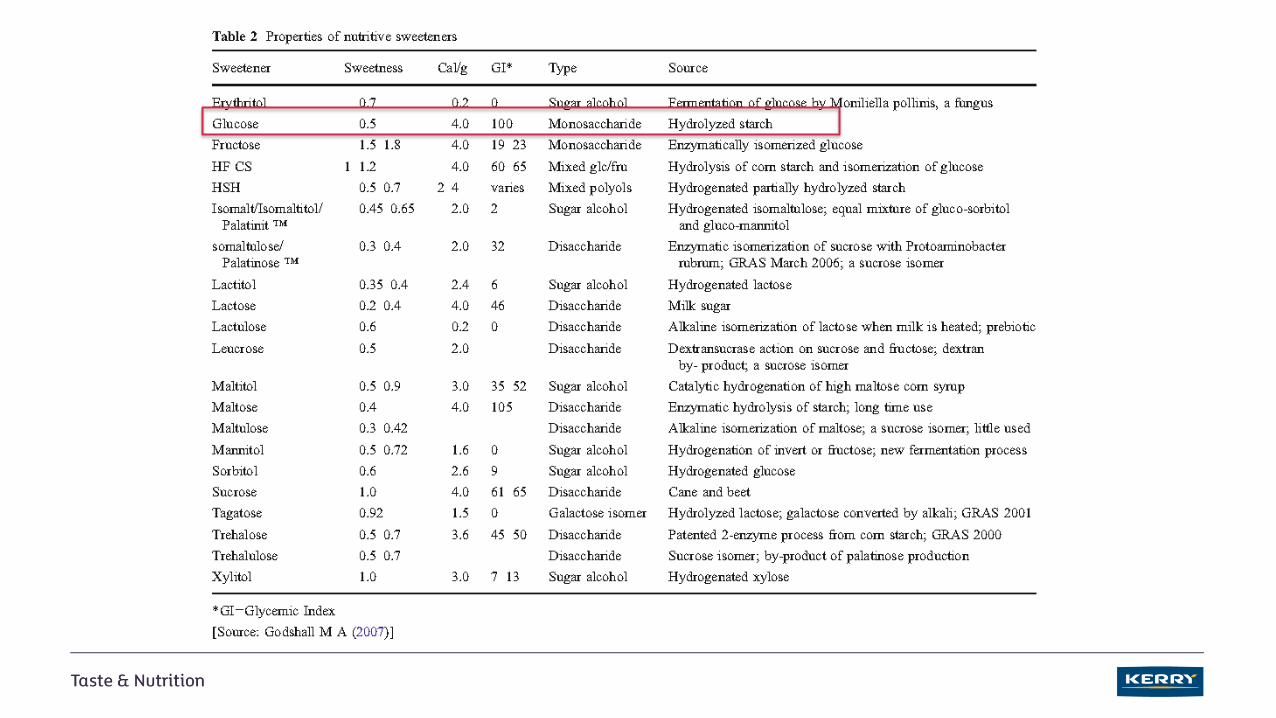
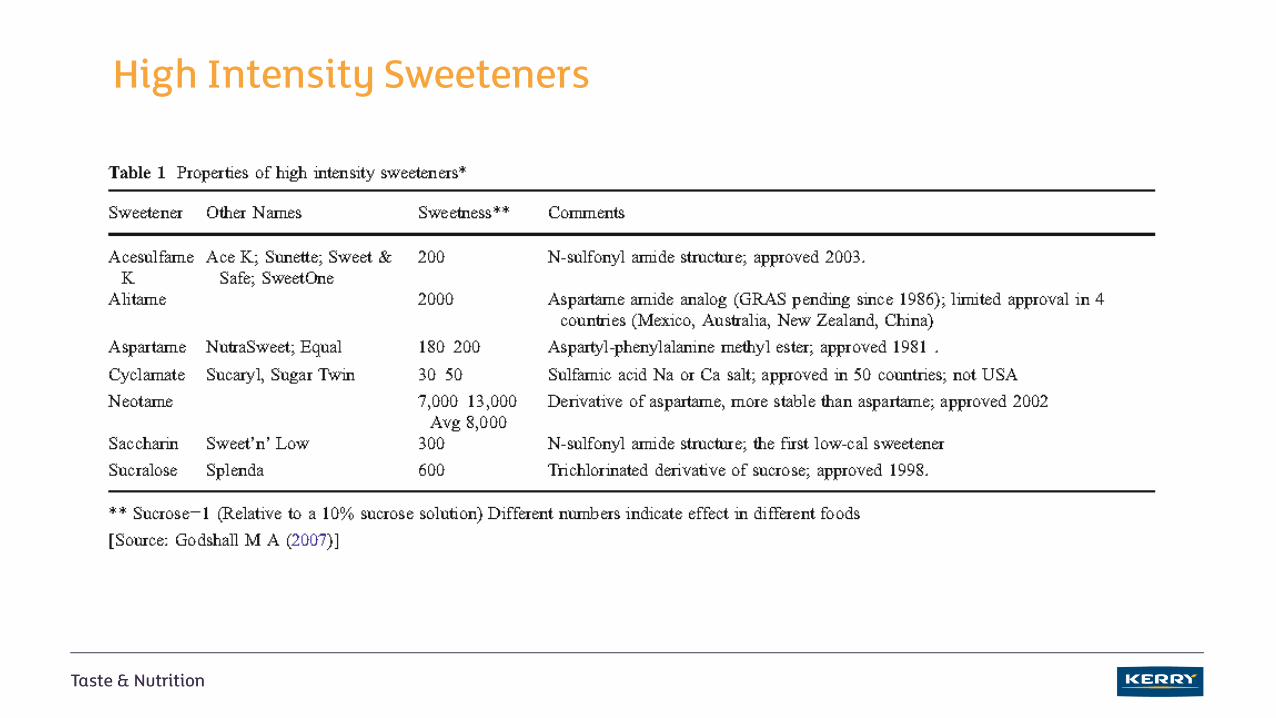
High Intensity Sweeteners
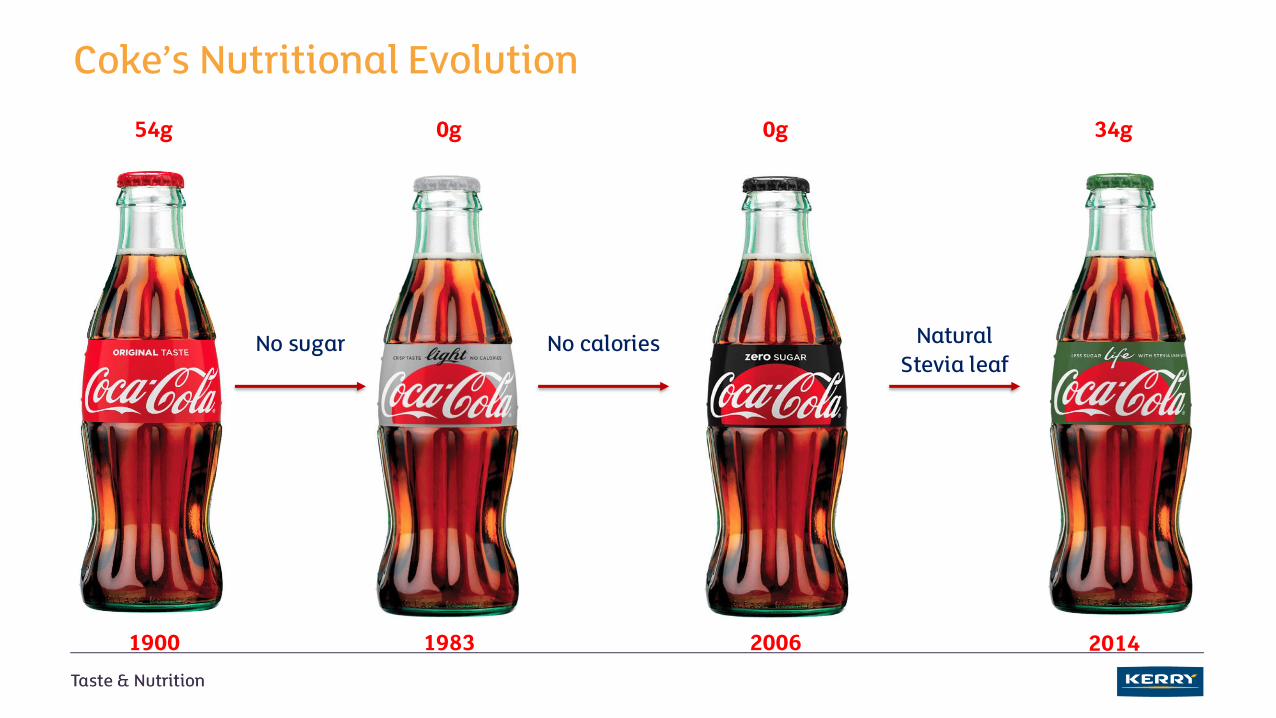
Coke’s Nutritional Evolution
54g 0g 0g 34g
1900 1983 2006 2014
No sugar No calories Natural Stevia leaf
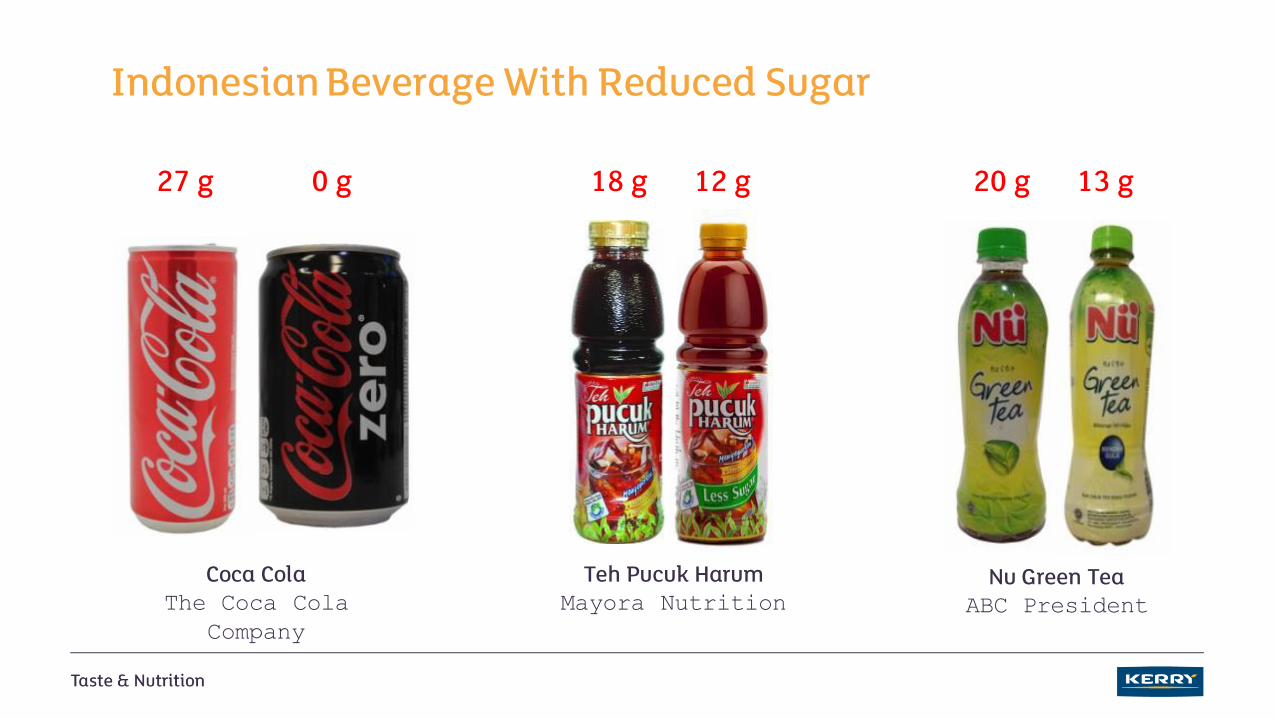
Indonesian Beverage With Reduced Sugar
Teh Pucuk HarumMayora Nutrition
18 g 12 g
Nu Green TeaABC President
20 g 13 g
Coca ColaThe Coca Cola
Company
27 g 0 g
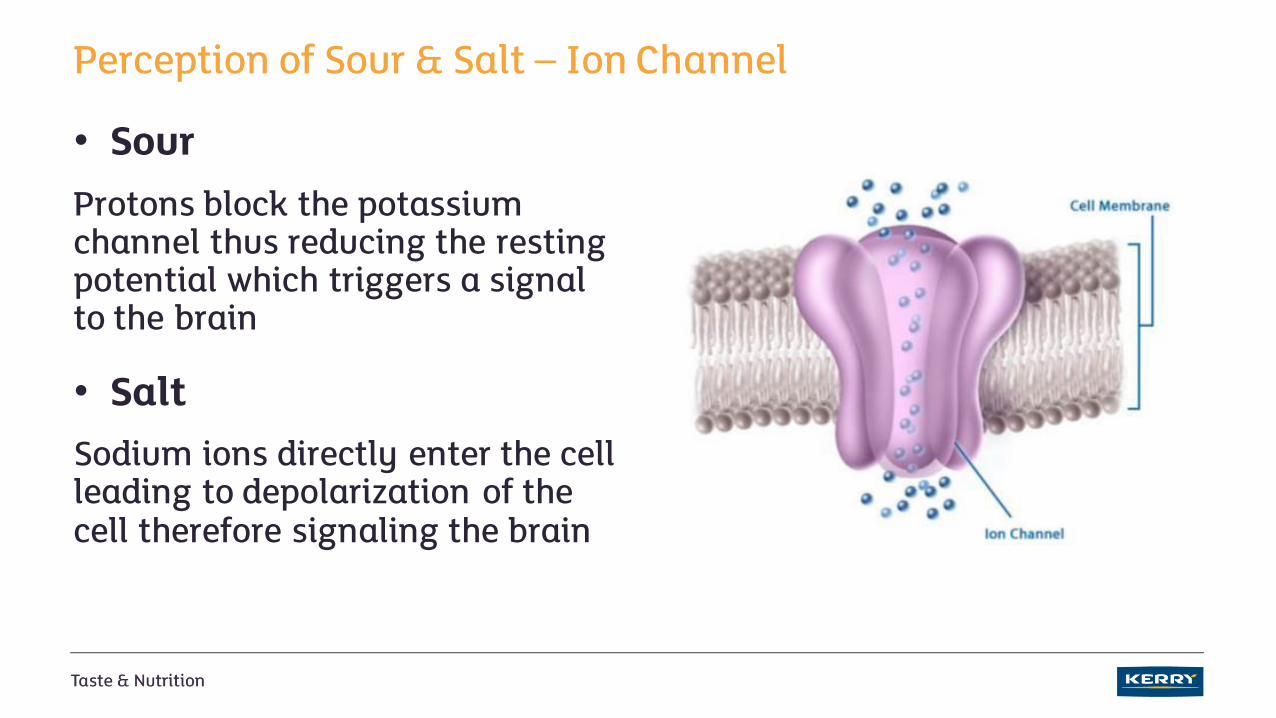
Perception of Sour & Salt – Ion Channel
• Sour
Protons block the potassium channel thus reducing the resting potential which triggers a signal to the brain
• Salt
Sodium ions directly enter the cell leading to depolarization of the cell therefore signaling the brain
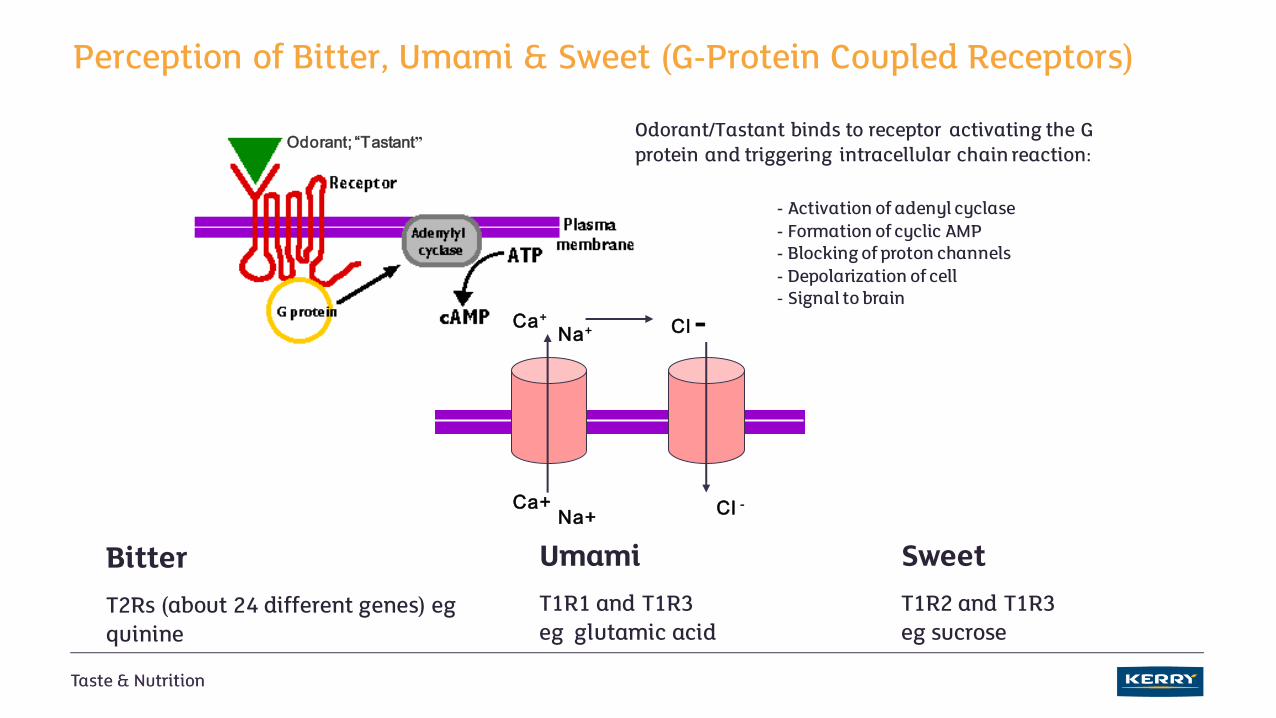
Perception of Bitter, Umami & Sweet (G-Protein Coupled Receptors)
Odorant; “Tastant”
Ca+
Na+
Cl -
Cl -
Ca+Na+
Odorant/Tastant binds to receptor activating the G protein and triggering intracellular chain reaction:
- Activation of adenyl cyclase- Formation of cyclic AMP- Blocking of proton channels- Depolarization of cell- Signal to brain
Bitter
T2Rs (about 24 different genes) egquinine
Umami
T1R1 and T1R3 eg glutamic acid
Sweet
T1R2 and T1R3 eg sucrose
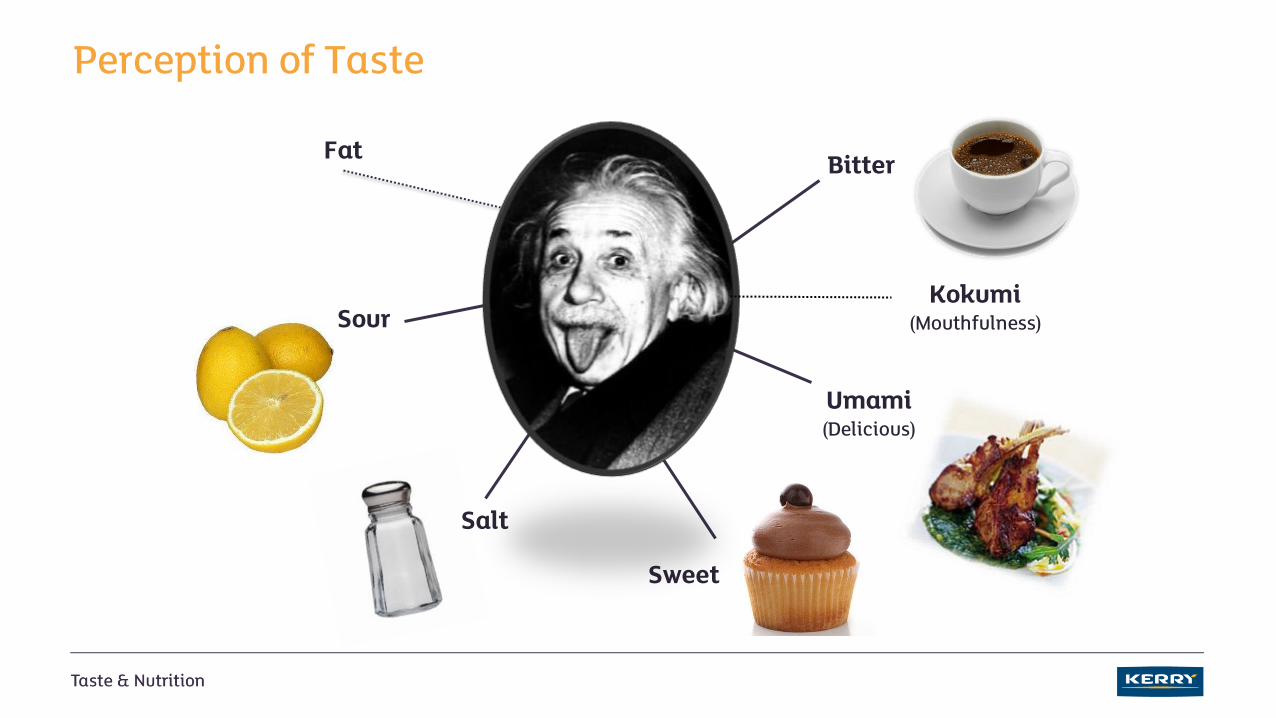
Perception of Taste
Sour
Salt
Sweet
Bitter
Umami(Delicious)
Fat
Kokumi(Mouthfulness)
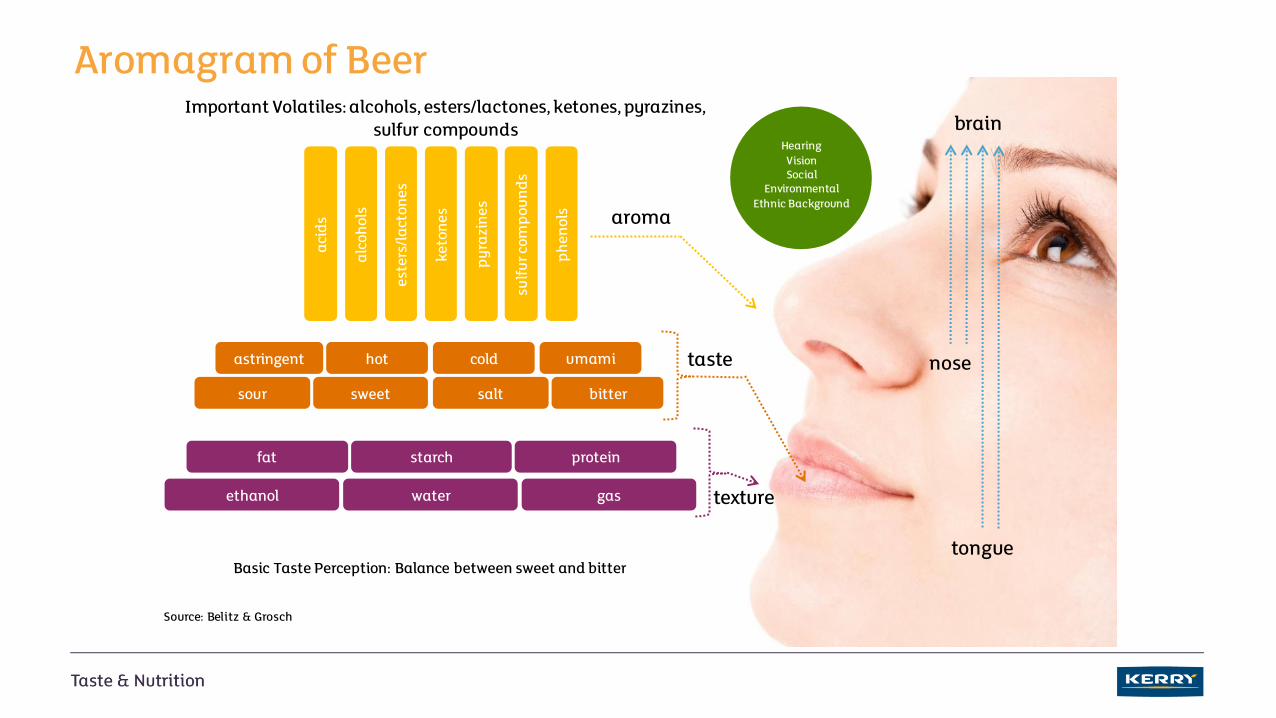
Aromagram of Beer
Basic Taste Perception: Balance between sweet and bitter
Source: Belitz & Grosch
texture
aroma
brain
taste nose
tongue
aci
ds
alc
ohol
s
este
rs/l
act
ones
keto
nes
py
razi
ne
s
sulf
ur c
om
po
un
ds
ph
enol
s
ethanol water gas
fat starch protein
sour sweet salt bitter
astringent hot cold umami
Important Volatiles: alcohols, esters/lactones, ketones, pyrazines, sulfur compounds
HearingVisionSocial
EnvironmentalEthnic Background
Functional Properties of Sugar
SweetenersTexture
MoistureMouthfeel
VolumeColor
Food Preservation
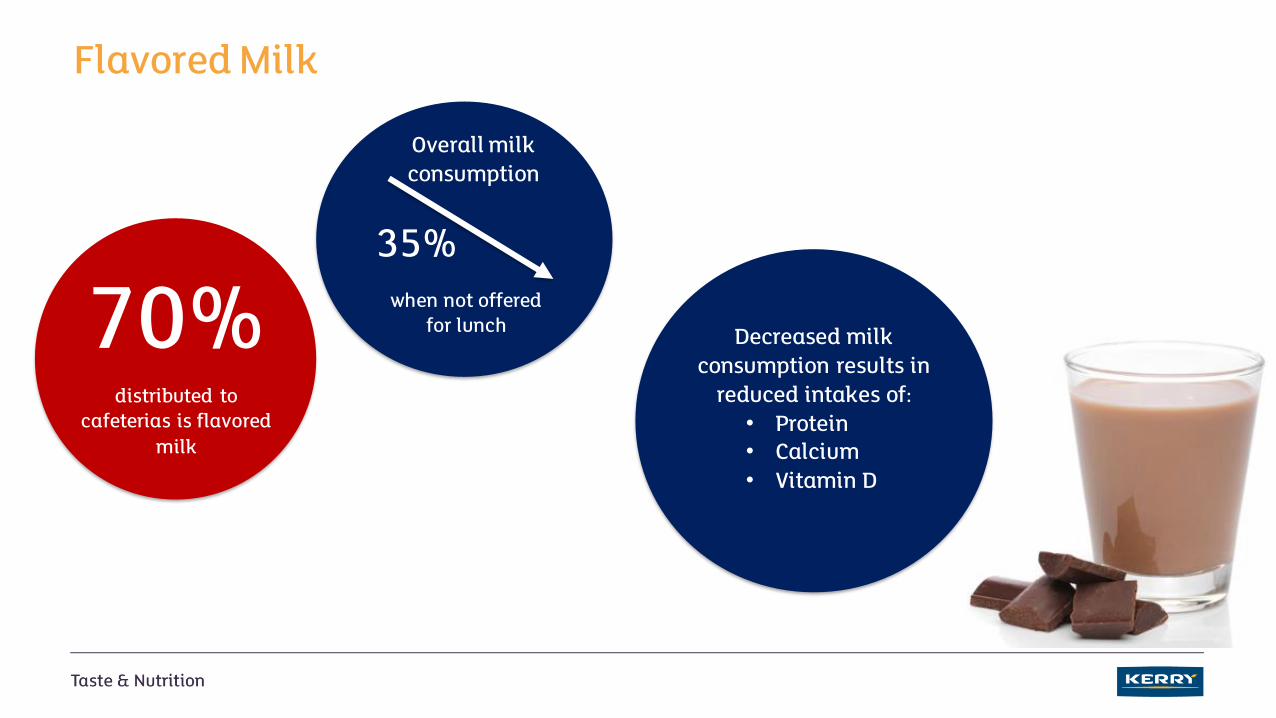
Flavored Milk
70%distributed to
cafeterias is flavored milk
35%
Overall milk consumption
when not offered for lunch
Decreased milk consumption results in
reduced intakes of:• Protein• Calcium• Vitamin D
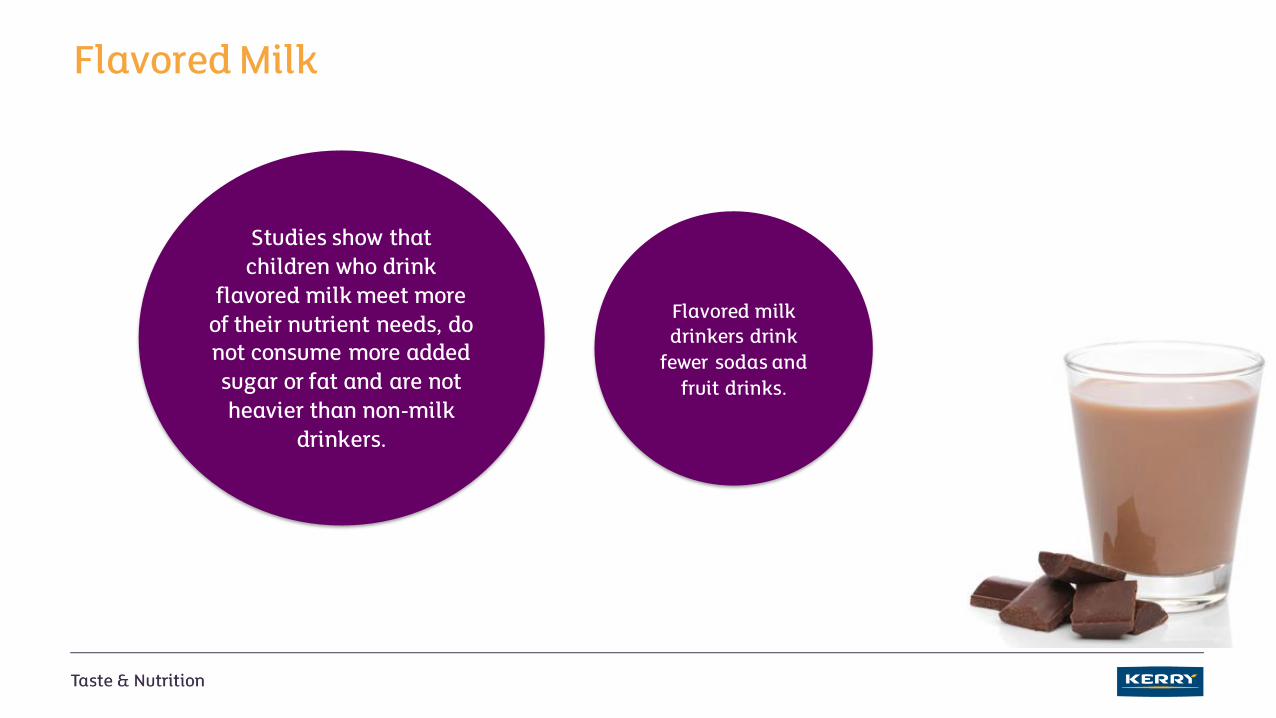
Flavored Milk
Studies show that children who drink
flavored milk meet more of their nutrient needs, do not consume more added sugar or fat and are not heavier than non-milk
drinkers.
Flavored milk drinkers drink
fewer sodas and fruit drinks.
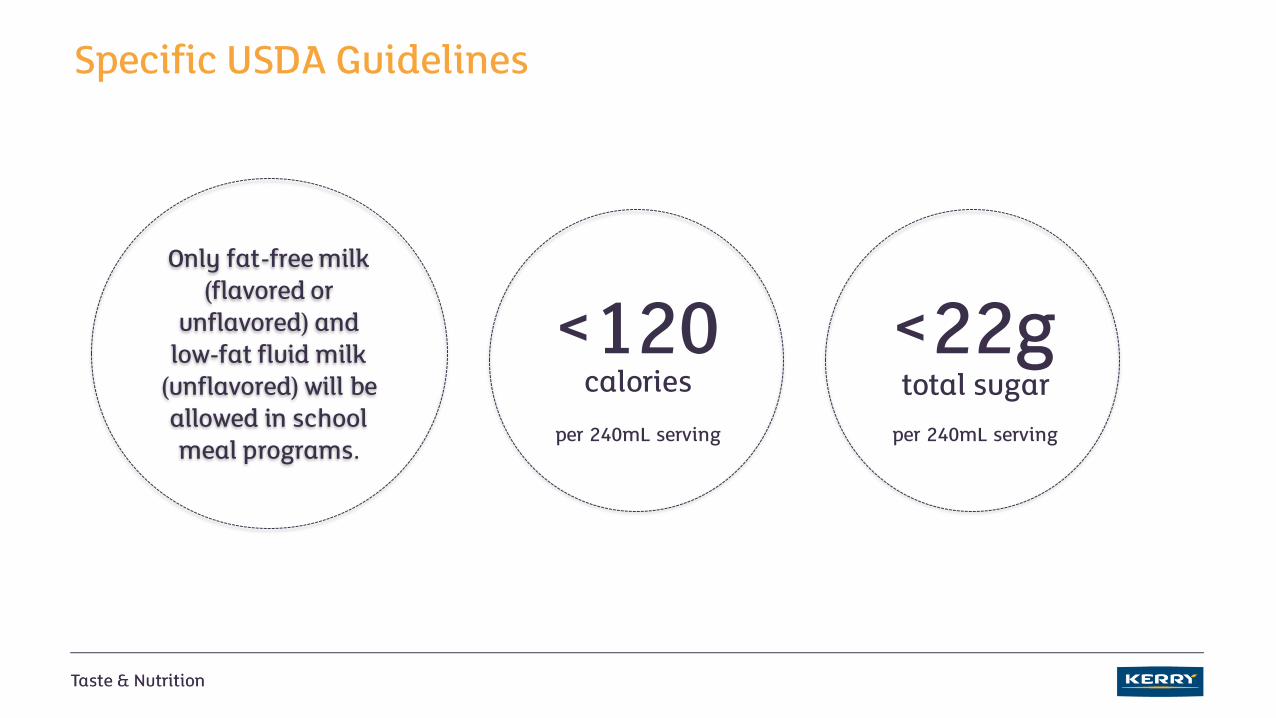
Specific USDA Guidelines
Only fat-free milk (flavored or
unflavored) and low-fat fluid milk
(unflavored) will be allowed in school meal programs.
<120calories
per 240mL serving
<22gtotal sugar
per 240mL serving
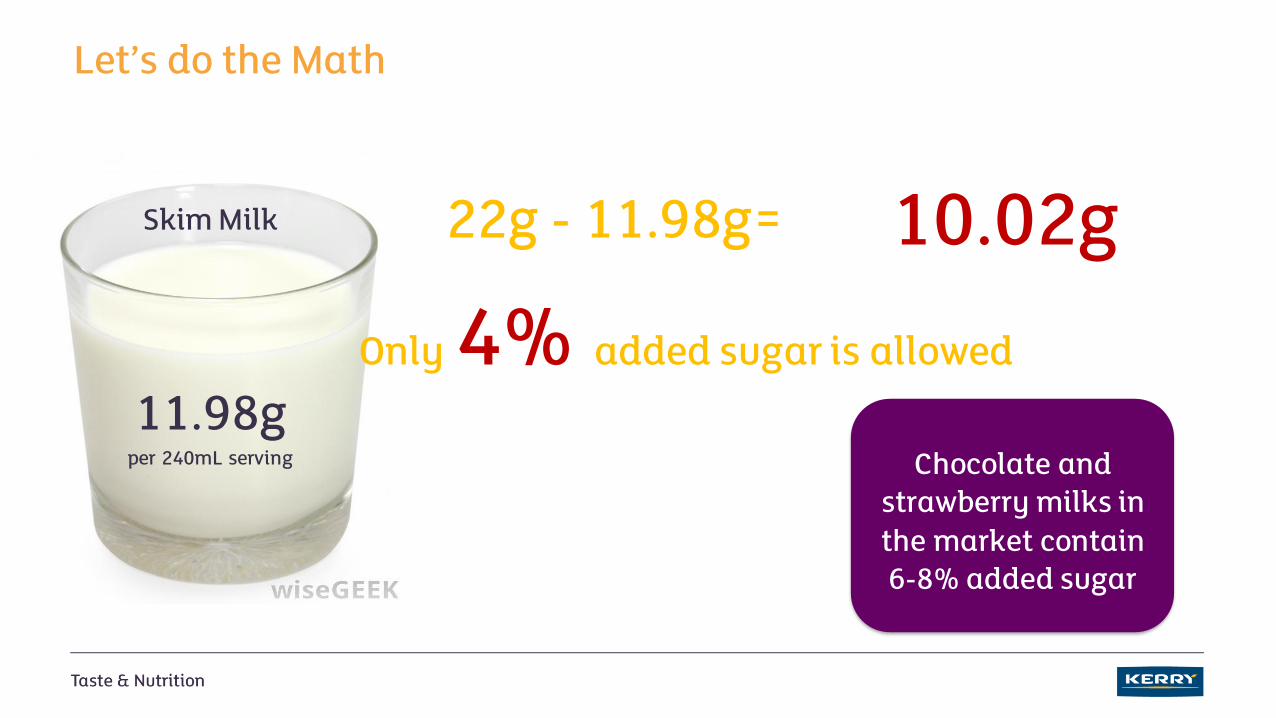
Let’s do the Math
Skim Milk
11.98gper 240mL serving
22g - 11.98g= 10.02g
Only 4% added sugar is allowed
Chocolate and strawberry milks in the market contain 6-8% added sugar
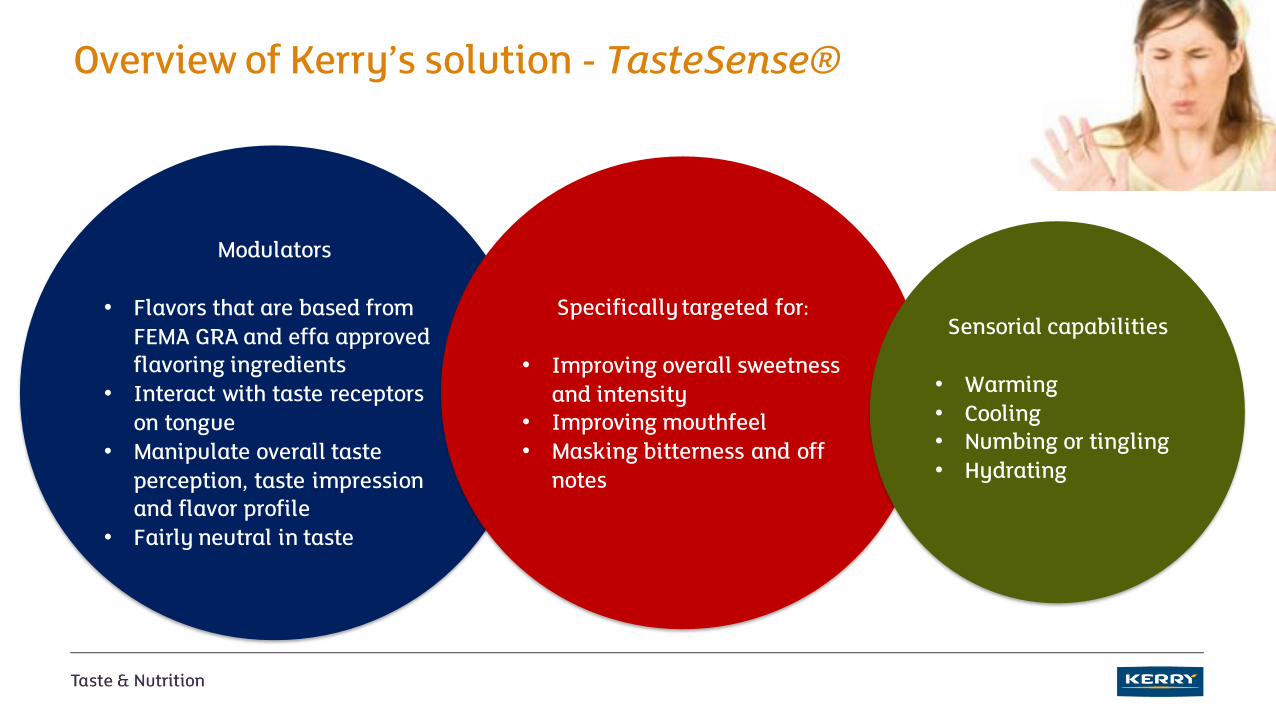
Overview of Kerry’s solution - TasteSense®
Modulators
• Flavors that are based from FEMA GRA and effa approved flavoring ingredients
• Interact with taste receptors on tongue
• Manipulate overall taste perception, taste impression and flavor profile
• Fairly neutral in taste
Specifically targeted for:
• Improving overall sweetness and intensity
• Improving mouthfeel• Masking bitterness and off
notes
Sensorial capabilities
• Warming• Cooling• Numbing or tingling• Hydrating
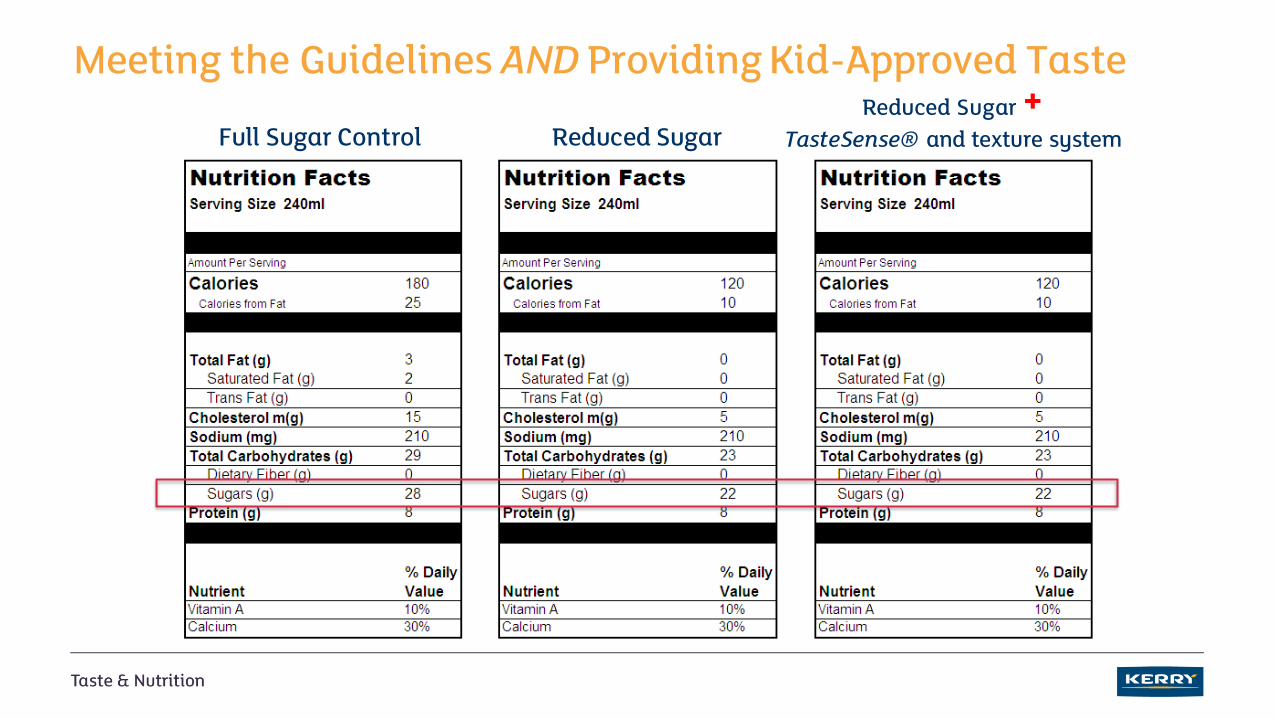
Meeting the Guidelines AND Providing Kid-Approved Taste
Full Sugar Control Reduced SugarReduced Sugar +
TasteSense® and texture system
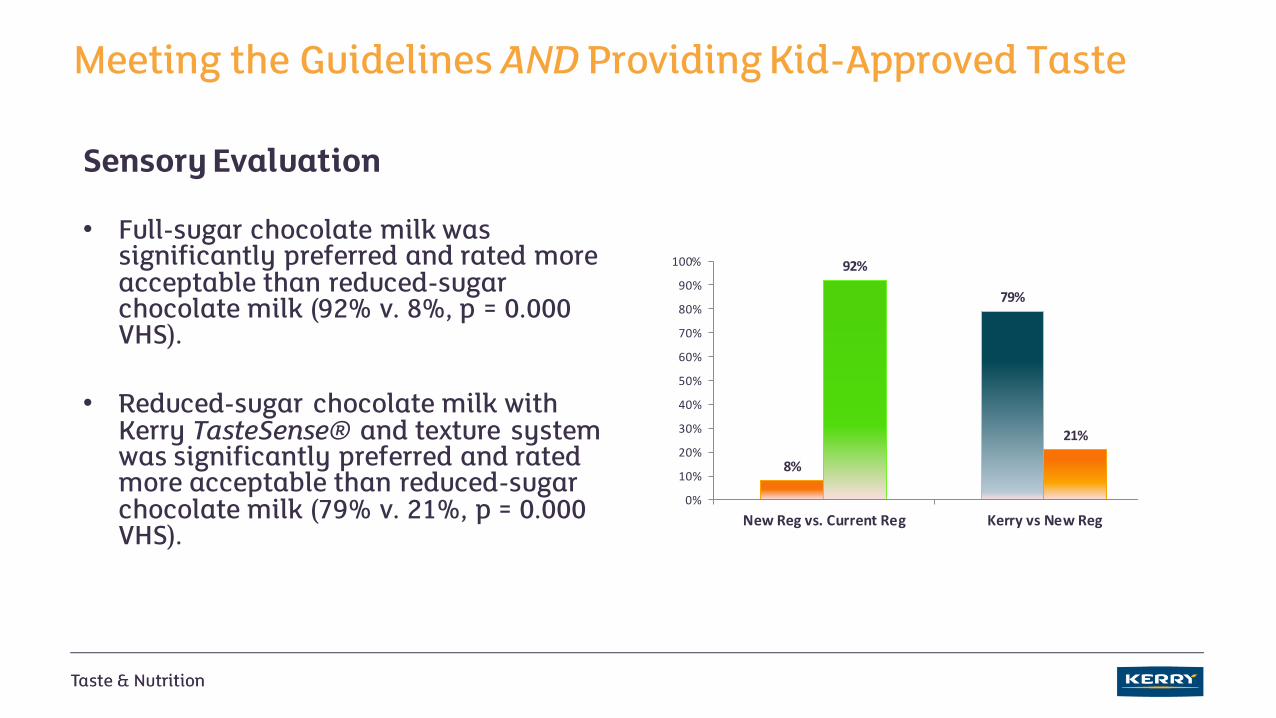
Meeting the Guidelines AND Providing Kid-Approved Taste
Sensory Evaluation
• Full-sugar chocolate milk was significantly preferred and rated more acceptable than reduced-sugar chocolate milk (92% v. 8%, p = 0.000 VHS).
• Reduced-sugar chocolate milk with Kerry TasteSense® and texture system was significantly preferred and rated more acceptable than reduced-sugar chocolate milk (79% v. 21%, p = 0.000 VHS).
8%
79%
22%
92%
21%
78%
0%
10%
20%
30%
40%
50%
60%
70%
80%
90%
100%
New Reg vs. Current Reg Kerry vs New Reg Kerry vs. Current Reg
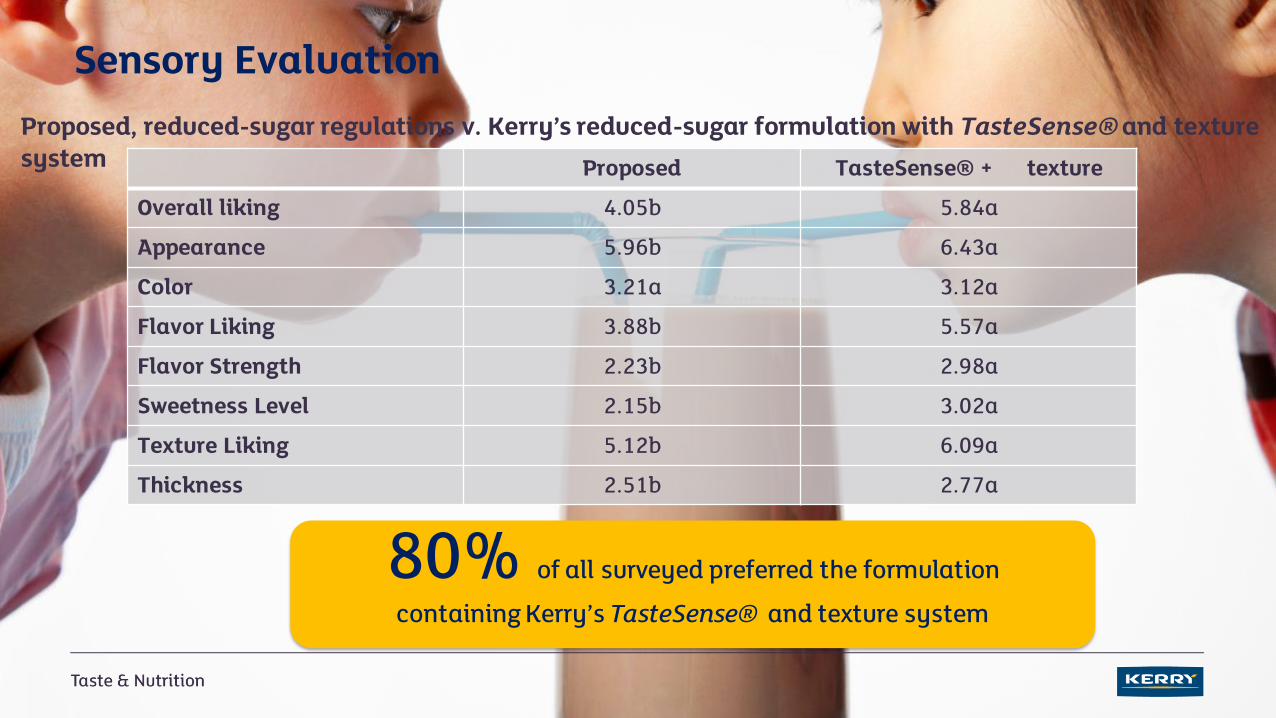
Sensory Evaluation
Proposed TasteSense® + texture
Overall liking 4.05b 5.84a
Appearance 5.96b 6.43a
Color 3.21a 3.12a
Flavor Liking 3.88b 5.57a
Flavor Strength 2.23b 2.98a
Sweetness Level 2.15b 3.02a
Texture Liking 5.12b 6.09a
Thickness 2.51b 2.77a
Proposed, reduced-sugar regulations v. Kerry’s reduced-sugar formulation with TasteSense®and texture system
80% of all surveyed preferred the formulation
containing Kerry’s TasteSense® and texture system
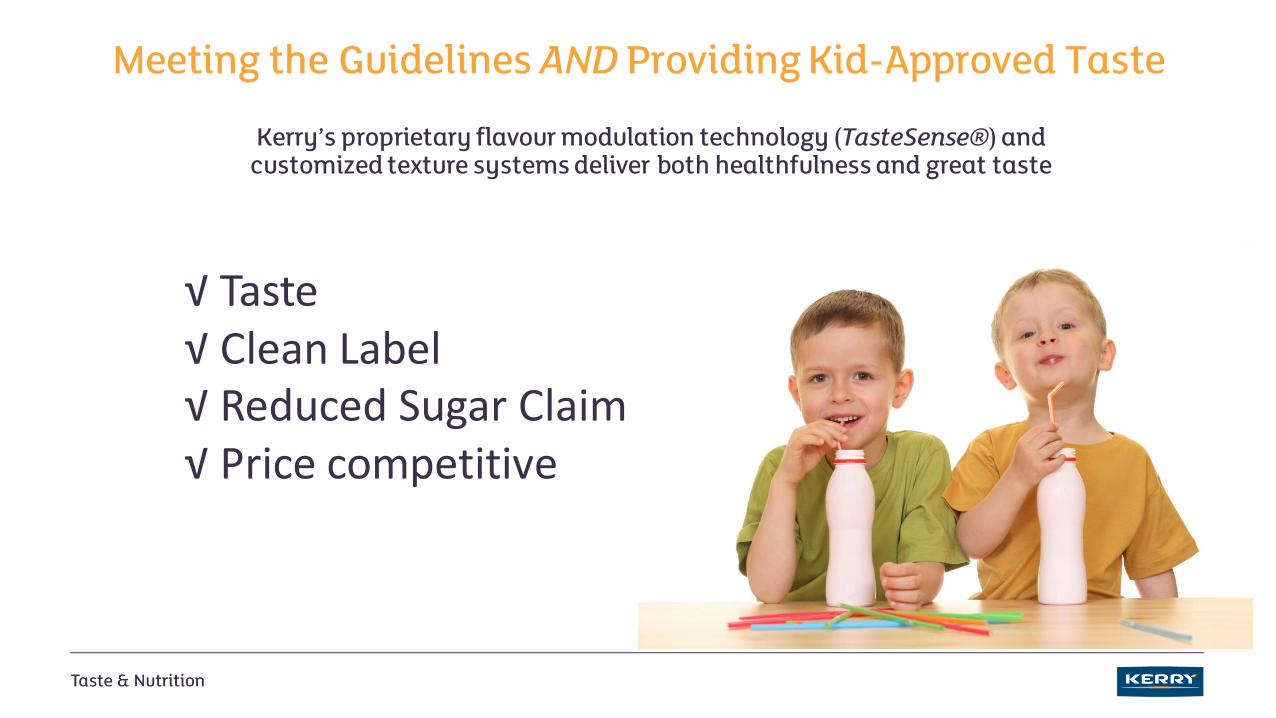
Meeting the Guidelines AND Providing Kid-Approved Taste
Kerry’s proprietary flavour modulation technology (TasteSense®) and customized texture systems deliver both healthfulness and great taste
√ Taste√ Clean Label√ Reduced Sugar Claim√ Price competitive

Reducing Sugar:
Future Directions
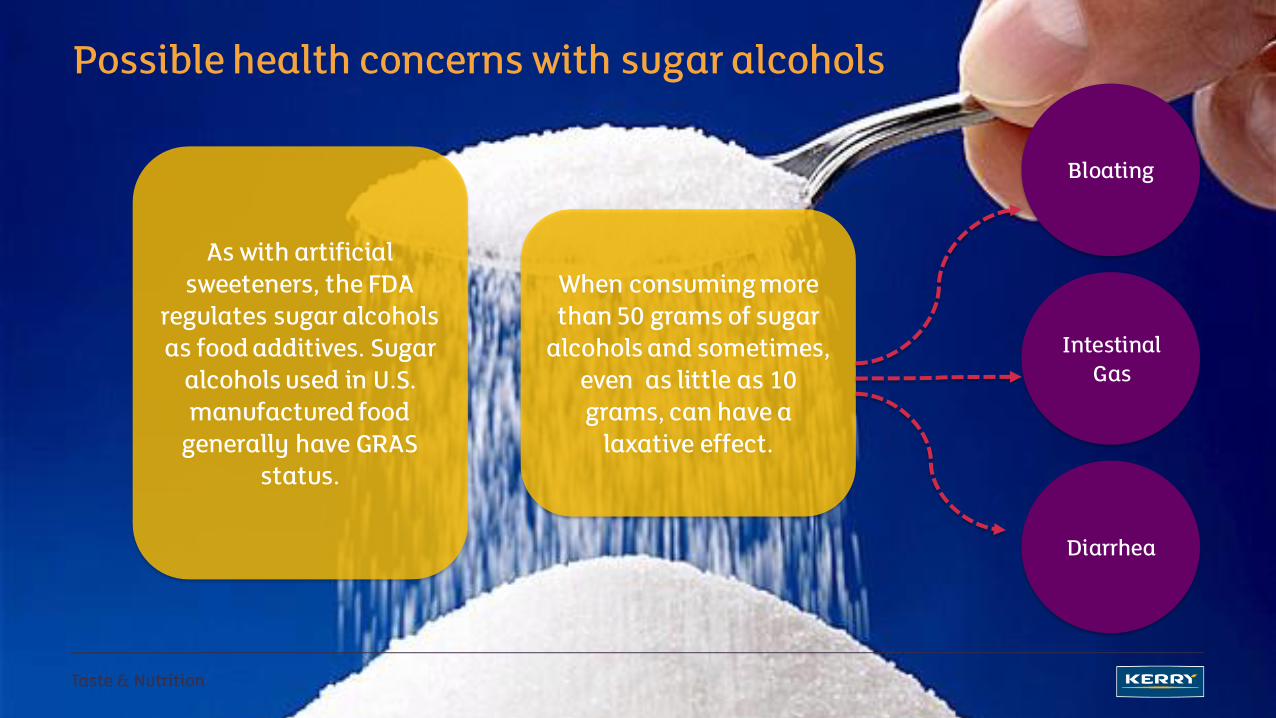
Possible health concerns with sugar alcohols
As with artificial sweeteners, the FDA
regulates sugar alcohols as food additives. Sugar
alcohols used in U.S. manufactured food
generally have GRAS status.
When consuming more than 50 grams of sugar
alcohols and sometimes, even as little as 10 grams, can have a
laxative effect.
Bloating
Intestinal Gas
Diarrhea
Eat to live or
live to eat?
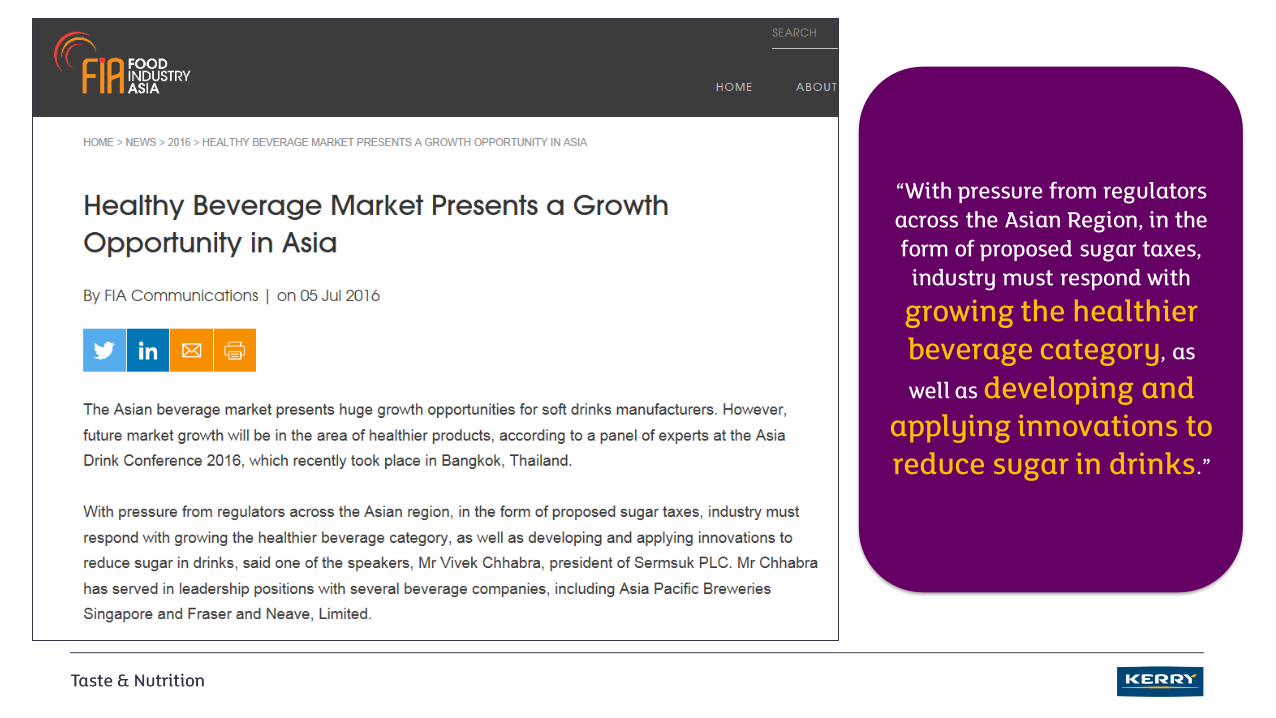
“With pressure from regulators across the Asian Region, in the form of proposed sugar taxes,
industry must respond with
growing the healthier beverage category, as
well as developing and applying innovations to reduce sugar in drinks.”
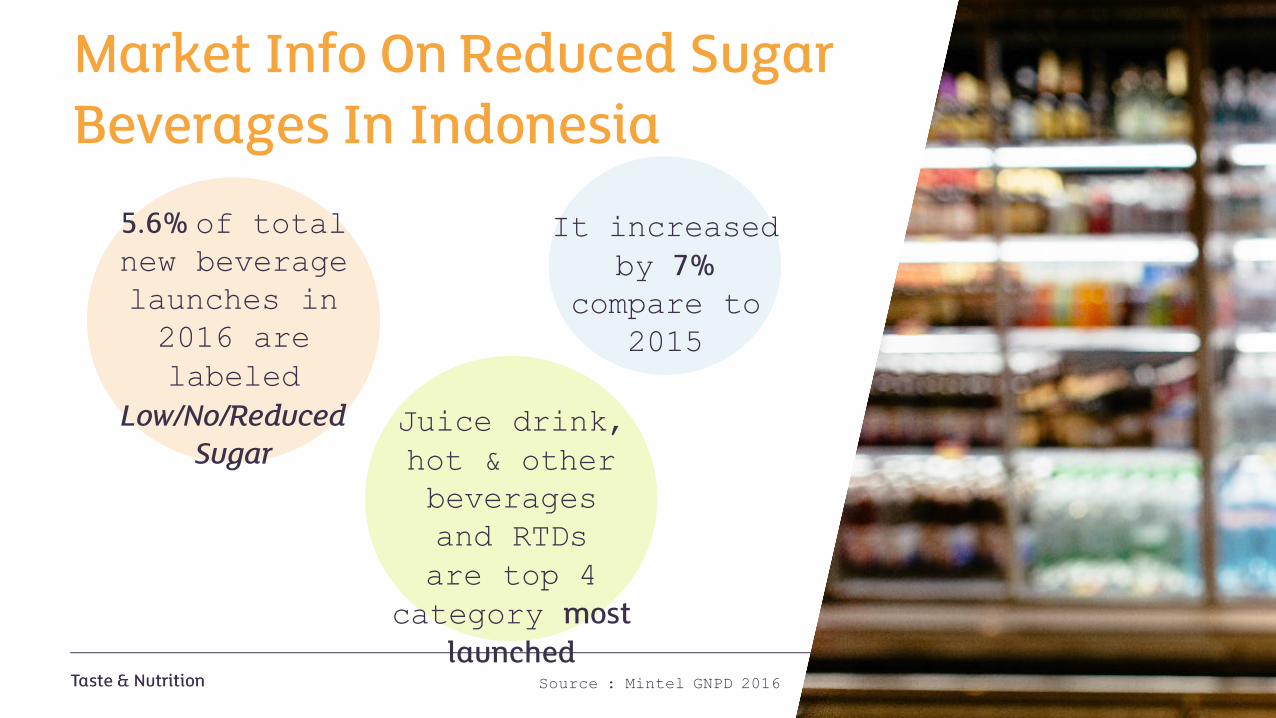
Market Info On Reduced Sugar Beverages In Indonesia
5.6% of total new beverage
launches in
2016 are
labeled
Low/No/Reduced Sugar
Source : Mintel GNPD 2016
It increased
by 7%compare to
2015
Juice drink,
hot & other
beverages
and RTDs
are top 4
category most launched
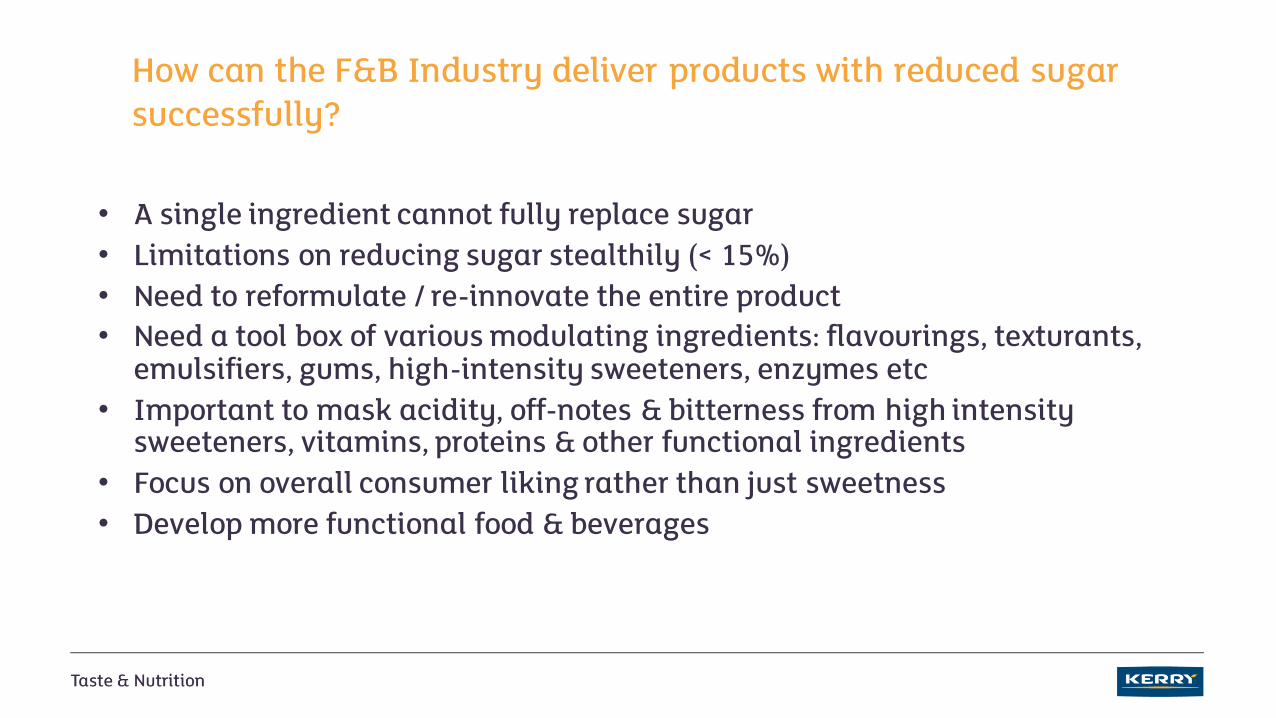
How can the F&B Industry deliver products with reduced sugar successfully?
• A single ingredient cannot fully replace sugar
• Limitations on reducing sugar stealthily (< 15%)
• Need to reformulate / re-innovate the entire product
• Need a tool box of various modulating ingredients: flavourings, texturants, emulsifiers, gums, high-intensity sweeteners, enzymes etc
• Important to mask acidity, off-notes & bitterness from high intensity sweeteners, vitamins, proteins & other functional ingredients
• Focus on overall consumer liking rather than just sweetness
• Develop more functional food & beverages
Kerryhealthandnutritioninstitute.com