Responding to the Call for Fossil-fuel Free Portfolios
13
MSCI ESG Research msci.com © 2013 MSCI Inc. All rights reserved. Please refer to the disclaimer at the end of this document 1 of 13 MSCI ESG Research Issue Brief FAQ: Responding to the Call for Fossil-fuel Free Portfolios December 2013 Responding to the Call for Fossil-fuel Free Portfolios MSCI ESG Research FAQ Updated December 2013 What is ‘fossil-free’ investing? Students, faculty, parishioners and elected officials are asking college endowments, religious institutions and state and municipal pension funds to limit or divest their holdings in fossil fuel companies in response to rising concerns about global warming. As October 2013, divestment campaigns have been launched at more than 330 U.S. colleges and universities, 40 municipal and state pension funds, and 10 religious institutions, according to 350.org, an organizing movement for this campaign. 1 What are ‘carbon stranded’ assets? The atmospheric concentration of carbon dioxide, a greenhouse gas, has risen more than 40 percent since the start of the Industrial Revolution – eclipsing 400 parts per million in May 2013. 2 Products sold by fossil fuel producers are the largest source of this CO 2 emissions growth. 3 The United Nations 2009 Copenhagen Accord on climate change recognizes “the scientific view that the increase in global temperature should be below 2 degrees Celsius.” This would require holding the atmospheric CO 2 level under 450 ppm. The world’s fossil fuel producers have carbon reserves up to five times higher than this limit would allow. Such “unburnable” carbon could negatively impact these companies if stranded carbon assets are priced into their market valuations. 4 What is Carbon Tracker? The Carbon Tracker Initiative is a project of Investor Watch, a non-profit company seeking to improve the transparency of carbon risk embedded in equity markets. Carbon Tracker has published a list of the top 100 coal companies and the top 100 oil and gas companies, assessed on the potential carbon emissions from their reserves. 5 The advocacy group 350.org has called on institutional investors to divest holdings in companies appearing on the Carbon Tracker list. 6 1 http://350.org/mission 2 Justin Gillis, “Heat-Trapping Gases Pass Milestone, Raising Fears,” The New York Times, May 10, 2013 3 International Energy Agency, “Key World Energy Statistics: 2012,” Paris, http://www.iea.org/publications/freepublications/publication/kwes.pdf 4 James Leaton, “Unburnable Carbon: Are the world’s financial markets carrying a carbon bubble?”, Carbon Tracker Initiative, Investor Watch, London, http://www.carbontracker.org/wp-content/uploads/downloads/2012/08/Unburnable-Carbon-Full1.pdf 5 http://gofossilfree.org/companies/ 6 http://gofossilfree.org/
Transcript of Responding to the Call for Fossil-fuel Free Portfolios
MSCI ESG Research msci.com © 2013 MSCI Inc. All rights reserved. Please refer to the disclaimer at the end of this document 1 of 13
MSCI ESG Research Issue Brief FAQ: Responding to the Call for Fossil-fuel Free Portfolios
December 2013
Responding to the Call for Fossil-fuel Free Portfolios
MSCI ESG Research FAQ Updated December 2013
What is ‘fossil-free’ investing? Students, faculty, parishioners and elected officials are asking college endowments, religious institutions and state and municipal pension funds to limit or divest their holdings in fossil fuel companies in response to rising concerns about global warming. As October 2013, divestment campaigns have been launched at more than 330 U.S. colleges and universities, 40 municipal and state pension funds, and 10 religious institutions, according to 350.org, an organizing movement for this campaign.1
What are ‘carbon stranded’ assets?
The atmospheric concentration of carbon dioxide, a greenhouse gas, has risen more than 40 percent since the start of the Industrial Revolution – eclipsing 400 parts per million in May 2013.2 Products sold by fossil fuel producers are the largest source of this CO2 emissions growth.3 The United Nations 2009 Copenhagen Accord on climate change recognizes “the scientific view that the increase in global temperature should be below 2 degrees Celsius.” This would require holding the atmospheric CO2 level under 450 ppm. The world’s fossil fuel producers have carbon reserves up to five times higher than this limit would allow. Such “unburnable” carbon could negatively impact these companies if stranded carbon assets are priced into their market valuations.4
What is Carbon Tracker?
The Carbon Tracker Initiative is a project of Investor Watch, a non-profit company seeking to improve the transparency of carbon risk embedded in equity markets. Carbon Tracker has published a list of the top 100 coal companies and the top 100 oil and gas companies, assessed on the potential carbon emissions from their reserves.5 The advocacy group 350.org has called on institutional investors to divest holdings in companies appearing on the Carbon Tracker list.6
1 http://350.org/mission
2 Justin Gillis, “Heat-Trapping Gases Pass Milestone, Raising Fears,” The New York Times, May 10, 2013
3 International Energy Agency, “Key World Energy Statistics: 2012,” Paris, http://www.iea.org/publications/freepublications/publication/kwes.pdf
4 James Leaton, “Unburnable Carbon: Are the world’s financial markets carrying a carbon bubble?”, Carbon Tracker Initiative, Investor Watch, London, http://www.carbontracker.org/wp-content/uploads/downloads/2012/08/Unburnable-Carbon-Full1.pdf
5 http://gofossilfree.org/companies/
6 http://gofossilfree.org/
MSCI ESG Research msci.com © 2013 MSCI Inc. All rights reserved. Please refer to the disclaimer at the end of this document 2 of 13
MSCI ESG Research Issue Brief FAQ: Responding to the Call for Fossil-fuel Free Portfolios
December 2013
Can I adopt Carbon Tracker in a portfolio management system? Carbon Tracker is intended to raise awareness about stranded carbon assets that present risk to markets and the scale of “unburnable carbon” listed on stock exchanges. It is not readily adaptable for use in a portfolio management system for the following reasons:
• Carbon Tracker is a static list. The carbon reserves data is based on reported information on proven fossil fuel reserves at the end of 2010. Verification of the stock listings of these companies and their market capitalization was completed in February 2011.
• Because of mergers and acquisitions and other corporate restructuring, at least eight of the 200 companies identified in Carbon Tracker are no longer publicly traded, according to an analysis by MSCI ESG Research in early 2013. Initial public offerings may also affect the composition of companies eligible to appear on the Carbon Tracker list.
• While Carbon Tracker associates companies with listed stock exchanges, it does not provide any company identifiers such as CUSIPs or SEDOLs.
Does MSCI offer an index that is an alternative to Carbon Tracker? MSCI does not offer an index equivalent to the Carbon Tracker list at present. However, MSCI does maintain an off-the-shelf index that tracks select energy producers in the MSCI All Country World Index Investible Market Index (MSCI ACWI IMI). The MSCI ACWI Select Energy Producers IMI Index tracks companies based on their Global Industry Classification System (GICS) codes in the following sectors:
• Coal and consumable fuels • Integrated oil & gas • Oil & gas exploration • Oil & gas refining and marketing
The MSCI ACWI Select Energy Producers IMI Index has a current coverage universe of 286 companies.7
Three of the represented sectors own fossil fuel reserves that are most applicable to the methodology set forth by Carbon Tracker. This does not include the Oil & Gas Refining and Marketing sector, which derives the majority of its revenues from “downstream” activities. These companies typically do not own sufficient “upstream” reserves to report these operations separately. When the Oil & Gas Refining and Marketing sector is extracted from MSCI ACWI Select Energy Producers IMI Index, the current coverage count is reduced to 256 companies.
Companies in the MSCI ACWI Select Energy Producers IMI Index are not ranked according to the amount of owned carbon reserves. This information can be obtained and calculated separately for ranking purposes. MSCI is incorporating such carbon reserve data in new index products that reduce portfolio exposure to potential stranded carbon assets.
7 This count is as of Oct. 24, 2013, and is subject to change.
MSCI ESG Research msci.com © 2013 MSCI Inc. All rights reserved. Please refer to the disclaimer at the end of this document 3 of 13
MSCI ESG Research Issue Brief FAQ: Responding to the Call for Fossil-fuel Free Portfolios
December 2013
What other differences are there between Carbon Tracker and the MSCI ACWI IMI and the MSCI ACWI Select Energy Producers IMI?
Of the 192 publicly traded companies in Carbon Tracker as of early 2013, 143 were included in the MSCI ACWI IMI. The matching companies in the MSCI ACWI IMI represented 95 percent of the total market capitalization of the Carbon Tracker companies, according to the recent analysis by MSCI ESG Research. The Carbon Tracker companies not represented in the MSCI ACWI IMI are mainly small and micro-cap companies; each has less than 0.15 gigatons of carbon dioxide-equivalent reserves. Consistent with the Carbon Tracker methodology, the MSCI ACWI Select Energy Producers IMI Index does not include companies primarily engaged in marketing, storage and/or transportation of fossil fuels. The MSCI ACWI Select Energy Producers IMI Index also does not include any steel and aluminum companies and electric utilities that own coal reserves. It should be noted that the Carbon Tracker list does include a small number of companies in these sectors that own metallurgical (coking) coal or combustible coal reserves. The MSCI ACWI IMI universe covers 24 developed markets and 20 emerging markets, including 8,514 listed companies as of Nov. 29, 2013. While this represents a very high percentage of energy companies that own fossil fuel reserves on a market capitalization basis, the MSCI ACWI IMI Index does not provide a complete global coverage universe of fossil energy companies.
Has MSCI conducted a back-test of the Carbon Tracker list? 8
MSCI has conducted a back-testing analysis of the Carbon Tracker list (see p. 6 of this FAQ) as well as a subset of the MSCI ACWI Select Energy Producers IMI Index. The latter analysis included all Integrated Oil and Oil & Gas Exploration companies, as defined by GICS, as well as 26 of the 34 companies represented in the Coal & Consumable Fuels sector included in this energy producers index. (The excluded companies were primarily engaged in uranium mining and ethanol fuel production.) Oil & Gas Refining and Marketing sector companies were not included in this back-testing analysis because they are not primarily engaged in developing and owning fossil fuel reserves. These exclusions reduced the analytical subset of the MSCI ACWI Select Energy Producers IMI Index to 247 companies.
9
Back-testing of this data set was performed over a time series from January 2008 through March 2013. On a market capitalization-weighted basis, these fossil fuel reserve-owning companies in the MSCI ACWI Select Energy Producers IMI Index ended the period with lower returns relative to the MSCI ACWI IMI. The companies in the Select Energy Producers IMI outperformed the MSCI ACWI IMI at the beginning of the time series, with a peak in June 2008 as crude oil prices reached an all-time high of $147 per barrel, and began to underperform in early 2012 as oil prices dropped back below $100 per barrel.
8 There are frequently material differences between back-tested or simulated performance results and actual results subsequently achieved by any investment strategy. The analysis and observations in this report are limited solely to the period of the relevant historical data, back-test or simulation. Past performance -- whether actual, back-tested or simulated -- is no indication or guarantee of future performance. None of the information or analysis herein is intended to constitute investment advice or a recommendation to make (or refrain from making) any kind of investment decision or asset allocation and should not be relied on as such. 9 At the time of this back-testing in April 2013, the MSCI ACWI Select Energy Producers IMI Index consisted of 294 companies. Extracting the Oil & Gas Refining and Market sector companies reduced the coverage count to 255 companies. Extracting other companies primarily engaged in uranium mining and ethanol fuel production reduced the final coverage count to 247 companies.
MSCI ESG Research msci.com © 2013 MSCI Inc. All rights reserved. Please refer to the disclaimer at the end of this document 4 of 13
MSCI ESG Research Issue Brief FAQ: Responding to the Call for Fossil-fuel Free Portfolios
December 2013
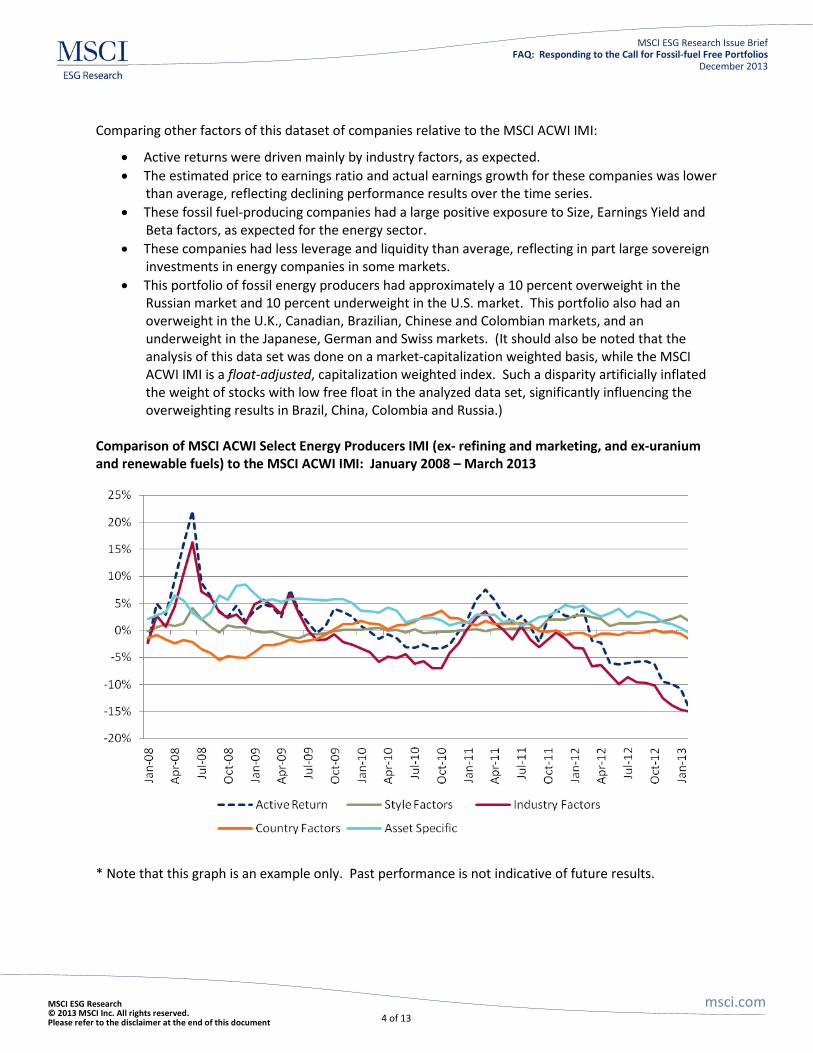
Comparing other factors of this dataset of companies relative to the MSCI ACWI IMI:
• Active returns were driven mainly by industry factors, as expected. • The estimated price to earnings ratio and actual earnings growth for these companies was lower
than average, reflecting declining performance results over the time series. • These fossil fuel-producing companies had a large positive exposure to Size, Earnings Yield and
Beta factors, as expected for the energy sector. • These companies had less leverage and liquidity than average, reflecting in part large sovereign
investments in energy companies in some markets. • This portfolio of fossil energy producers had approximately a 10 percent overweight in the
Russian market and 10 percent underweight in the U.S. market. This portfolio also had an overweight in the U.K., Canadian, Brazilian, Chinese and Colombian markets, and an underweight in the Japanese, German and Swiss markets. (It should also be noted that the analysis of this data set was done on a market-capitalization weighted basis, while the MSCI ACWI IMI is a float-adjusted, capitalization weighted index. Such a disparity artificially inflated the weight of stocks with low free float in the analyzed data set, significantly influencing the overweighting results in Brazil, China, Colombia and Russia.)
Comparison of MSCI ACWI Select Energy Producers IMI (ex- refining and marketing, and ex-uranium and renewable fuels) to the MSCI ACWI IMI: January 2008 – March 2013
* Note that this graph is an example only. Past performance is not indicative of future results.
MSCI ESG Research msci.com © 2013 MSCI Inc. All rights reserved. Please refer to the disclaimer at the end of this document 5 of 13
MSCI ESG Research Issue Brief FAQ: Responding to the Call for Fossil-fuel Free Portfolios
December 2013
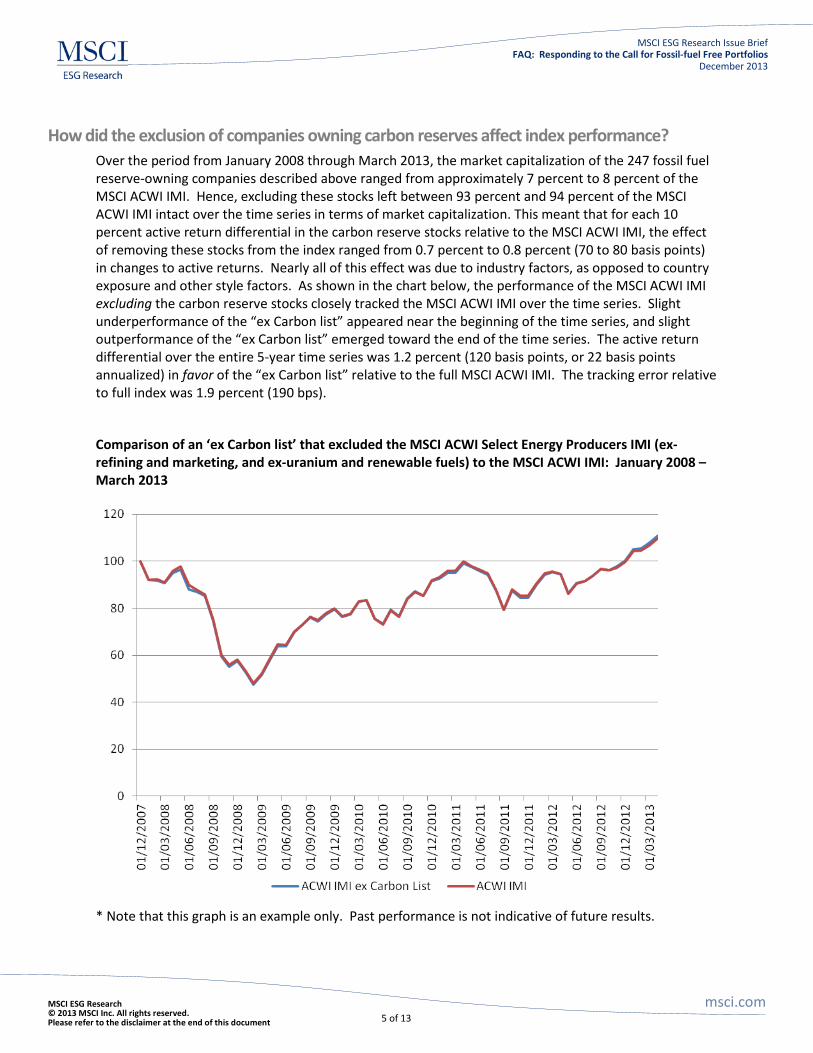
How did the exclusion of companies owning carbon reserves affect index performance?
Over the period from January 2008 through March 2013, the market capitalization of the 247 fossil fuel reserve-owning companies described above ranged from approximately 7 percent to 8 percent of the MSCI ACWI IMI. Hence, excluding these stocks left between 93 percent and 94 percent of the MSCI ACWI IMI intact over the time series in terms of market capitalization. This meant that for each 10 percent active return differential in the carbon reserve stocks relative to the MSCI ACWI IMI, the effect of removing these stocks from the index ranged from 0.7 percent to 0.8 percent (70 to 80 basis points) in changes to active returns. Nearly all of this effect was due to industry factors, as opposed to country exposure and other style factors. As shown in the chart below, the performance of the MSCI ACWI IMI excluding the carbon reserve stocks closely tracked the MSCI ACWI IMI over the time series. Slight underperformance of the “ex Carbon list” appeared near the beginning of the time series, and slight outperformance of the “ex Carbon list” emerged toward the end of the time series. The active return differential over the entire 5-year time series was 1.2 percent (120 basis points, or 22 basis points annualized) in favor of the “ex Carbon list” relative to the full MSCI ACWI IMI. The tracking error relative to full index was 1.9 percent (190 bps).
Comparison of an ‘ex Carbon list’ that excluded the MSCI ACWI Select Energy Producers IMI (ex- refining and marketing, and ex-uranium and renewable fuels) to the MSCI ACWI IMI: January 2008 – March 2013
* Note that this graph is an example only. Past performance is not indicative of future results.
MSCI ESG Research msci.com © 2013 MSCI Inc. All rights reserved. Please refer to the disclaimer at the end of this document 6 of 13
MSCI ESG Research Issue Brief FAQ: Responding to the Call for Fossil-fuel Free Portfolios
December 2013
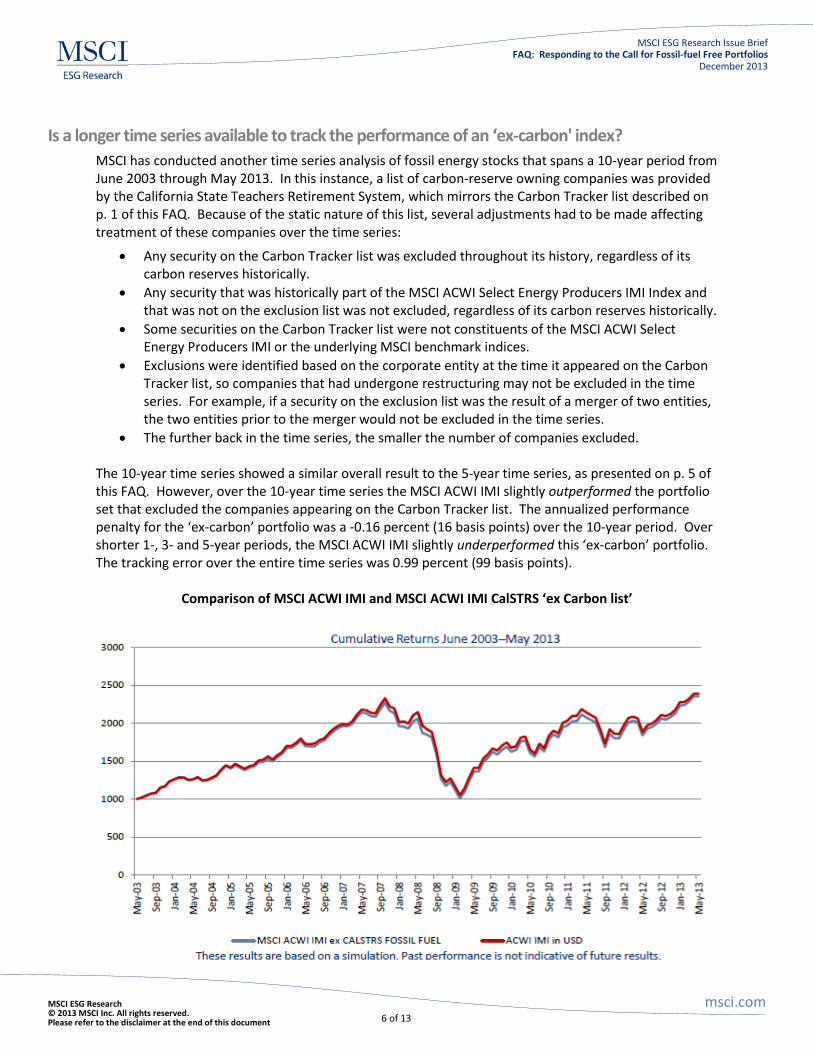
Is a longer time series available to track the performance of an ‘ex-carbon' index?
MSCI has conducted another time series analysis of fossil energy stocks that spans a 10-year period from June 2003 through May 2013. In this instance, a list of carbon-reserve owning companies was provided by the California State Teachers Retirement System, which mirrors the Carbon Tracker list described on p. 1 of this FAQ. Because of the static nature of this list, several adjustments had to be made affecting treatment of these companies over the time series:
• Any security on the Carbon Tracker list was excluded throughout its history, regardless of its carbon reserves historically.
• Any security that was historically part of the MSCI ACWI Select Energy Producers IMI Index and that was not on the exclusion list was not excluded, regardless of its carbon reserves historically.
• Some securities on the Carbon Tracker list were not constituents of the MSCI ACWI Select Energy Producers IMI or the underlying MSCI benchmark indices.
• Exclusions were identified based on the corporate entity at the time it appeared on the Carbon Tracker list, so companies that had undergone restructuring may not be excluded in the time series. For example, if a security on the exclusion list was the result of a merger of two entities, the two entities prior to the merger would not be excluded in the time series.
• The further back in the time series, the smaller the number of companies excluded. The 10-year time series showed a similar overall result to the 5-year time series, as presented on p. 5 of this FAQ. However, over the 10-year time series the MSCI ACWI IMI slightly outperformed the portfolio set that excluded the companies appearing on the Carbon Tracker list. The annualized performance penalty for the ‘ex-carbon’ portfolio was a -0.16 percent (16 basis points) over the 10-year period. Over shorter 1-, 3- and 5-year periods, the MSCI ACWI IMI slightly underperformed this ‘ex-carbon’ portfolio. The tracking error over the entire time series was 0.99 percent (99 basis points).
Comparison of MSCI ACWI IMI and MSCI ACWI IMI CalSTRS ‘ex Carbon list’
MSCI ESG Research msci.com © 2013 MSCI Inc. All rights reserved. Please refer to the disclaimer at the end of this document 7 of 13
MSCI ESG Research Issue Brief FAQ: Responding to the Call for Fossil-fuel Free Portfolios
December 2013
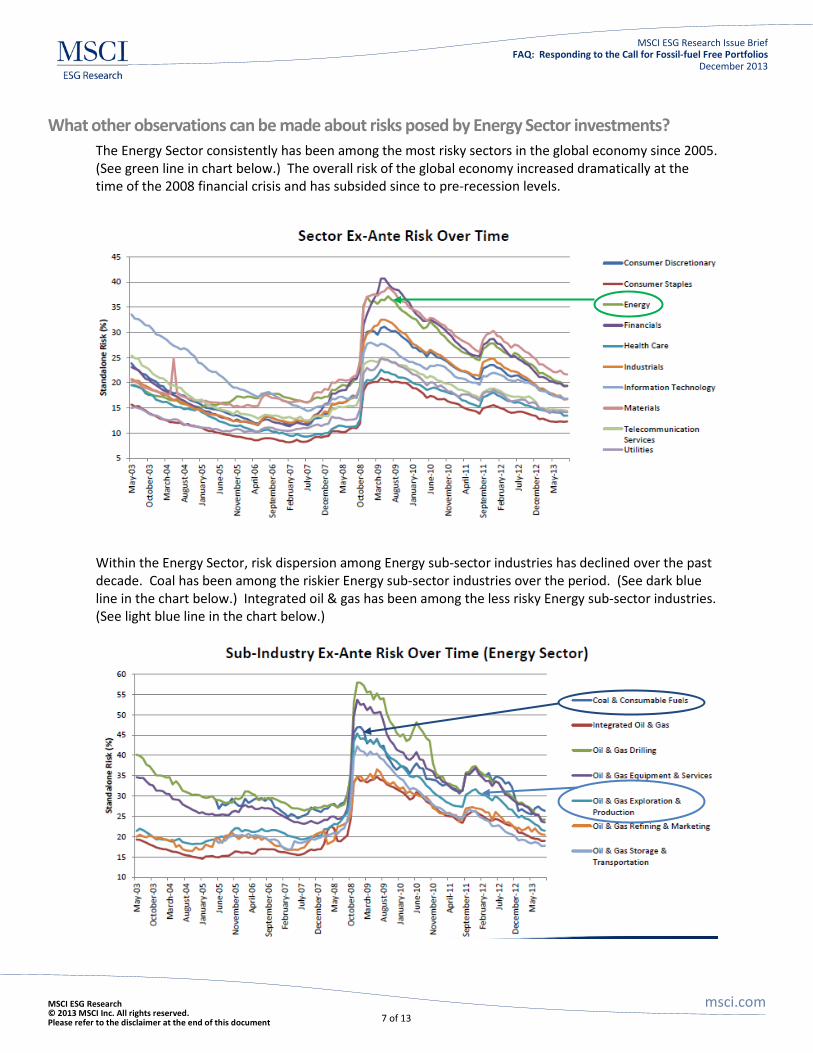
What other observations can be made about risks posed by Energy Sector investments?
The Energy Sector consistently has been among the most risky sectors in the global economy since 2005. (See green line in chart below.) The overall risk of the global economy increased dramatically at the time of the 2008 financial crisis and has subsided since to pre-recession levels.
Within the Energy Sector, risk dispersion among Energy sub-sector industries has declined over the past decade. Coal has been among the riskier Energy sub-sector industries over the period. (See dark blue line in the chart below.) Integrated oil & gas has been among the less risky Energy sub-sector industries. (See light blue line in the chart below.)
MSCI ESG Research msci.com © 2013 MSCI Inc. All rights reserved. Please refer to the disclaimer at the end of this document 8 of 13
MSCI ESG Research Issue Brief FAQ: Responding to the Call for Fossil-fuel Free Portfolios
December 2013
What conclusions can be drawn from this time series analysis of fossil energy investments? • Risk: Fossil fuel divestment has the potential to reduce overall portfolio risk because of Energy
Sector volatility.
• Performance: 1-, 3- and 5-year results were consistent between the two MSCI time series analyses, showing modest risk-adjusted outperformance from divestment over those time periods. Ten-year results showed modest risk-adjusted underperformance from divestment, primarily as a result of high oil prices in the early years of the time series.
• Investors considering fossil fuel divestment should answer the following questions:
o Since divesting of fossil fuels has the potential to reduce overall portfolio risk (because Energy is a relatively risky sector), what is the most effective way for them to allocate risk?
o How will they compensate for the impact of underweighting Energy Sector investments?
What other investment strategies are available to investors wishing to limit their exposure to carbon-stranded assets?
Beyond outright divestment, many alternative investment strategies are available to achieve optimized, low-carbon portfolios without completely eliminating exposure to the fossil energy sector. These strategies include:
• Selective divestment: Companies with the highest levels of carbon reserves relative market capitalization (or other financial performance ratios) can be sold selectively. Consideration of company management of carbon footprints and associated regulatory risks may also be taken into account through employment of Intangible Value Assessment (IVA) ratings and Carbon Key Issue data and scores available from MSCI ESG Research.
• Carbon tilts: Rather than eliminating certain companies entirely from the portfolio, those
identified as having the greatest relative exposure to carbon stranded assets can be underweighted and those with the least relative exposure may be overweighted. Once again, MSCI ESG IVA ratings and Carbon Key Issue data can be added to help set the range of portfolio weighting adjustments. Barra portfolio management analytics can be used to maintain desired sector, style and country exposures.
• Low-carbon momentum: Another approach is to overweight companies that are demonstrating
the greatest progress in reducing their exposure to carbon stranded assets and/or shrinking the size of their overall carbon footprints. This may include consideration of companies in sectors beyond those owning fossil fuel reserves. Improvements in MSCI ESG IVA ratings and Carbon Key Issue Scores can also be factored into this analysis and portfolio weighting adjustments.
• Thematic investments: Companies investing in renewable energy, other low-carbon fuel
sources, energy efficiency and other environmental innovations can be added as a positive thematic element to counterbalance reduced exposure in more carbon-intensive sectors. MSCI ESG Research tracks company involvement in all of these areas, and MSCI Indices offers
MSCI ESG Research msci.com © 2013 MSCI Inc. All rights reserved. Please refer to the disclaimer at the end of this document 9 of 13
MSCI ESG Research Issue Brief FAQ: Responding to the Call for Fossil-fuel Free Portfolios
December 2013
thematic indices with these elements, including the MSCI Global Climate Index10 MSCI Global Environment Index
and the 11
. (See Appendix 1 and 2 in this FAQ for more information.) MSCI can also provide custom indices based on GICS or company specific exclusions.
• Hybrid approaches: No one-size-fits-all approach is necessary for investors who wish to limit their carbon risk exposure in portfolios. Strategies can be developed that incorporate any or all of the elements outlined above. Consideration may also be given to new risk exposures that may be introduced as a result of portfolio rebalancing, and ways in which these risks can be mitigated through portfolio optimization strategies. These strategies also can be coupled with corporate engagement activities to address climate risk and carbon emission reductions.
For more information on carbon optimization investing strategies, please contact:
• Doug Cogan, MSCI ESG Research, [email protected] • Thomas Kuh, MSCI Index, [email protected] • Michelle Lapolla Friedman, MSCI ESG Custom Research, [email protected] • Zoltan Nagy, MSCI Applied Research, [email protected] • Dan Sinnreich, MSCI Risk Management Analytics, [email protected]
10 For August 2013 performance data on the MSCI Global Climate Index, see Appendix 1 at the end of this document. 11 For August 2013 performance data on the MSCI Global Environment Index, see Appendix 2 at the end of this document.
MSCI ESG Research msci.com © 2013 MSCI Inc. All rights reserved. Please refer to the disclaimer at the end of this document 10 of 13
MSCI ESG Research Issue Brief FAQ: Responding to the Call for Fossil-fuel Free Portfolios
December 2013
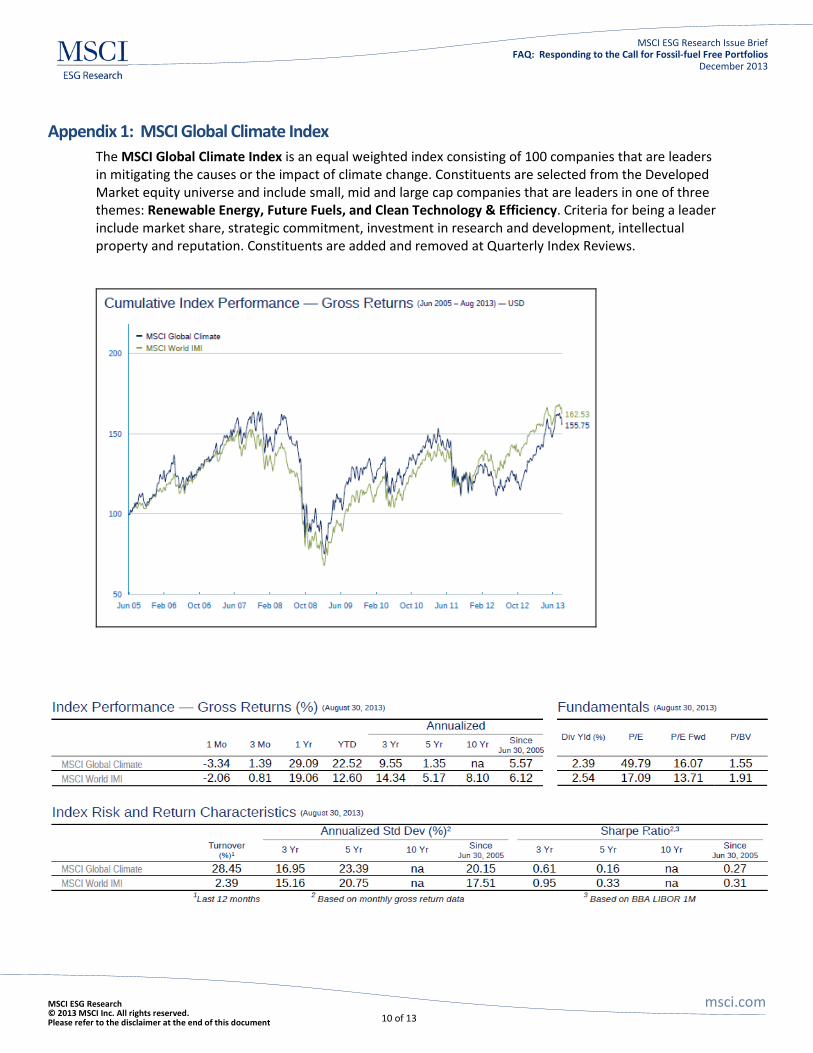
Appendix 1: MSCI Global Climate Index The MSCI Global Climate Index is an equal weighted index consisting of 100 companies that are leaders in mitigating the causes or the impact of climate change. Constituents are selected from the Developed Market equity universe and include small, mid and large cap companies that are leaders in one of three themes: Renewable Energy, Future Fuels, and Clean Technology & Efficiency. Criteria for being a leader include market share, strategic commitment, investment in research and development, intellectual property and reputation. Constituents are added and removed at Quarterly Index Reviews.
MSCI ESG Research msci.com © 2013 MSCI Inc. All rights reserved. Please refer to the disclaimer at the end of this document 11 of 13
MSCI ESG Research Issue Brief FAQ: Responding to the Call for Fossil-fuel Free Portfolios
December 2013
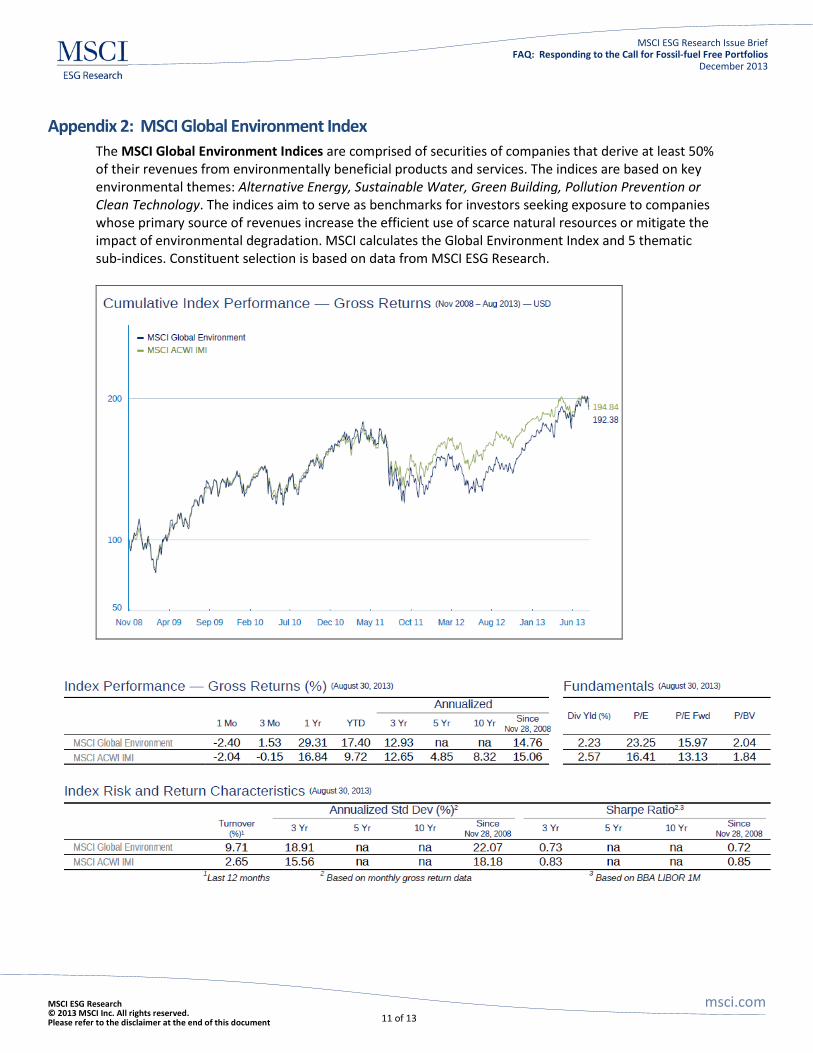
Appendix 2: MSCI Global Environment Index The MSCI Global Environment Indices are comprised of securities of companies that derive at least 50% of their revenues from environmentally beneficial products and services. The indices are based on key environmental themes: Alternative Energy, Sustainable Water, Green Building, Pollution Prevention or Clean Technology. The indices aim to serve as benchmarks for investors seeking exposure to companies whose primary source of revenues increase the efficient use of scarce natural resources or mitigate the impact of environmental degradation. MSCI calculates the Global Environment Index and 5 thematic sub-indices. Constituent selection is based on data from MSCI ESG Research.
MSCI ESG Research msci.com © 2013 MSCI Inc. All rights reserved. Please refer to the disclaimer at the end of this document 12 of 13
MSCI ESG Research Issue Brief FAQ: Responding to the Call for Fossil-fuel Free Portfolios
December 2013
About MSCI ESG Research MSCI ESG Research products and services are designed to provide in-depth research, ratings and analysis of environmental, social and governance-related business practices to companies worldwide. ESG ratings, data and analysis from MSCI ESG Research are also used in the construction of the MSCI ESG Indices. MSCI ESG Research is produced by MSCI’s indirect wholly-owned subsidiary Institutional Shareholder Services, Inc. (“ISS”). ISS is a Registered Investment Adviser under the Investment Advisers Act of 1940. For further information on MSCI ESG Research, contact [email protected], or visit www.msci.com/esg
About MSCI MSCI Inc. is a leading provider of investment decision support tools to investors globally, including asset managers, banks, hedge funds and pension funds. MSCI products and services include indices, portfolio risk and performance analytics, and governance tools.
The company’s flagship product offerings are: the MSCI indices with approximately USD 7.5 trillion estimated to be benchmarked to them on a worldwide basis1; Barra multi-asset class factor models, portfolio risk and performance analytics; RiskMetrics multi-asset class market and credit risk analytics; IPD real estate information, indices and analytics; MSCI ESG (environmental, social and governance) Research screening, analysis and ratings; ISS corporate governance research, data and outsourced proxy voting and reporting services; and FEA valuation models and risk management software for the energy and commodities markets. MSCI is headquartered in New York, with research and commercial offices around the world. 1As of March 31, 2013, as reported on July 31, 2013 by eVestment, Lipper and Bloomberg For further information on MSCI, please visit our web site at www.msci.com Americas + 1.212.804.5299 Asia Pacific + 612.9033.9339 Europe, Middle East and Africa + 44.207.618.2510
MSCI ESG Research msci.com © 2013 MSCI Inc. All rights reserved. Please refer to the disclaimer at the end of this document 13 of 13
MSCI ESG Research Issue Brief FAQ: Responding to the Call for Fossil-fuel Free Portfolios
December 2013
Disclaimer This document and all of the information contained in it, including without limitation all text, data, graphs, charts (collectively, the “Information”) is the property of MSCI Inc. or its subsidiaries (collectively, “MSCI”), or MSCI’s licensors, direct or indirect suppliers or any third party involved in making or compiling any Information (collectively, with MSCI, the “Information Providers”) and is provided for informational purposes only. The Information may not be reproduced or redisseminated in whole or in part without prior written permission from MSCI. The Information may not be used to create derivative works or to verify or correct other data or information. For example (but without limitation), the Information may not be used to create indices, databases, risk models, analytics, software, or in connection with the issuing, offering, sponsoring, managing or marketing of any securities, portfolios, financial products or other investment vehicles utilizing or based on, linked to, tracking or otherwise derived from the Information or any other MSCI data, information, products or services. The user of the Information assumes the entire risk of any use it may make or permit to be made of the Information. NONE OF THE INFORMATION PROVIDERS MAKES ANY EXPRESS OR IMPLIED WARRANTIES OR REPRESENTATIONS WITH RESPECT TO THE INFORMATION (OR THE RESULTS TO BE OBTAINED BY THE USE THEREOF), AND TO THE MAXIMUM EXTENT PERMITTED BY APPLICABLE LAW, EACH INFORMATION PROVIDER EXPRESSLY DISCLAIMS ALL IMPLIED WARRANTIES (INCLUDING, WITHOUT LIMITATION, ANY IMPLIED WARRANTIES OF ORIGINALITY, ACCURACY, TIMELINESS, NON-INFRINGEMENT, COMPLETENESS MERCHANTABILITY AND FITNESS FOR A PARTICULAR PURPOSE) WITH RESPECT TO ANY OF THE INFORMATION. Without limiting any of the foregoing and to the maximum extent permitted by applicable law, in no event shall any Information Provider have any liability regarding any of the Information for any direct, indirect, special, punitive, consequential (including lost profits) or any other damages even if notified of the possibility of such damages. The foregoing shall not exclude or limit any liability that may not by applicable law be excluded or limited, including without limitation (as applicable), any liability for death or personal injury to the extent that such injury results from the negligence or willful default of itself, its servants, agents or sub-contractors. Information containing any historical information, data or analysis should not be taken as an indication or guarantee of any future performance, analysis, forecast or prediction. Past performance does not guarantee future results. None of the Information constitutes an offer to sell (or a solicitation of an offer to buy), any security, financial product or other investment vehicle or any trading strategy. You cannot invest in an index. MSCI does not issue, sponsor, endorse, market, offer, review or otherwise express any opinion regarding any investment or financial product that may be based on or linked to the performance of any MSCI index. MSCI’s indirect wholly-owned subsidiary Institutional Shareholder Services, Inc. (“ISS”) is a Registered Investment Adviser under the Investment Advisers Act of 1940. Except with respect to any applicable products or services from ISS (including applicable products or services from MSCI ESG Research, which are provided by ISS), neither MSCI nor any of its products or services recommends, endorses, approves or otherwise expresses any opinion regarding any issuer, securities, financial products or instruments or trading strategies and neither MSCI nor any of its products or services is intended to constitute investment advice or a recommendation to make (or refrain from making) any kind of investment decision and may not be relied on as such. The MSCI ESG Indices use ratings and other data, analysis and information from MSCI ESG Research. MSCI ESG Research is produced by ISS or its subsidiaries. Issuers mentioned or included in any MSCI ESG Research materials may be a client of MSCI, ISS, or another MSCI subsidiary, or the parent of, or affiliated with, a client of MSCI, ISS, or another MSCI subsidiary, including ISS Corporate Services, Inc., which provides tools and services to issuers. MSCI ESG Research materials, including materials utilized in any MSCI ESG Indices or other products, have not been submitted to, nor received approval from, the United States Securities and Exchange Commission or any other regulatory body. Any use of or access to products, services or information of MSCI requires a license from MSCI. MSCI, Barra, RiskMetrics, IPD, ISS, FEA, InvestorForce, and other MSCI brands and product names are the trademarks, service marks, or registered trademarks of MSCI or its subsidiaries in the United States and other jurisdictions. The Global Industry Classification Standard (GICS) was developed by and is the exclusive property of MSCI and Standard & Poor’s. “Global Industry Classification Standard (GICS)” is a service mark of MSCI and Standard & Poor’s.