Resource Scheduling for Postdisaster Management in IoT ...
20
Research Article Resource Scheduling for Postdisaster Management in IoT Environment J. Sathish Kumar and Mukesh A. Zaveri Computer Engineering Department, SVNIT, Surat, India Correspondence should be addressed to J. Sathish Kumar; [email protected] Received 27 November 2018; Revised 4 February 2019; Accepted 18 February 2019; Published 20 March 2019 Guest Editor: Maurizio Casoni Copyright © 2019 J. Sathish Kumar and Mukesh A. Zaveri. is is an open access article distributed under the Creative Commons Attribution License, which permits unrestricted use, distribution, and reproduction in any medium, provided the original work is properly cited. For postdisaster management, rescue and recovery operations are very critical. It is desired that the rescue and recovery operation should be handled through efficient resource management to minimize the postdisaster effects in terms of human loss and other types of damage. Resource management requires addressing various challenging issues like scheduling and monitoring of the resources which need real time information of various activities or events occurring anytime, anywhere, and anyplace. To satisfy such requirements, Internet of ings, an advanced upcoming technology, can be utilized for resource monitoring and scheduling. In this context, we propose resource scheduling algorithm for the postdisaster management. As mentioned above various tasks of rescue and recovery operation should be carried out with different priority and there should not be deadlock while availing the resources. In our approach, we estimate the waiting time using queuing theory for the availability of the resources for different activities that are to be performed at various locations. e simulation results of the proposed method are analyzed using different standard parameters like resource utilization and the waiting time for different activities. e proposed method is further visualized through real time annotation of resources and activities represented with the help of Google maps using android based application on the smartphone. e proposed algorithm is further compared in terms of computational complexity and fairness analysis for the effective utilization of the available resources. 1. Introduction Natural disasters such as earthquakes, floods, hurricanes, volcanic eruptions, and tsunamis strike at various places on the earth every year with a great loss of human beings and the economy. United Nations International Strategy for Disaster Reduction (UNISDR) survey [1] reported that the number of disasters across the earth has been 346 during the year 2015. As a consequence of these disasters, 22,773 people lost their lives, 98.6 million people were affected, and an economic loss of USD 66.5 billion had occurred. In India alone, 38 million people were affected with different types of disasters and USD 29 million of economic damage occurred [2] during 2011-2015. From this information, it is clear that handling the disaster situation is very critical. So, there is a need for an efficient disaster management. Among all the various phases in the disaster [3, 4], the response and recovery phases are crucial for postdisaster management. For quick response and recovery, there is a need for different resources and these resources must be distributed in such a way that various activities can be performed efficiently. is leads to a need for proper resource utilization as the number of resources is limited. In this context, scheduling of resources is required for completion of different activities or tasks for postdisaster management. Scheduling of resources in the response phase is crucial because it has to perform various activities like the evacuation of the people and shiſting them to a safe location on an urgent basis. To handle disaster-related rescue operations, the real time need of various activities should be identified properly. For instance, in the context of disaster, various activities like gathering the information across the disaster places for establishing communication network are essential and critical. If a communication network is IP enabled and if it is possible to connect various resources using this IP enabled network, then it is possible to have information about the need of resources and whereabouts of various resources in real time. is information can be utilized for the distribution Hindawi Wireless Communications and Mobile Computing Volume 2019, Article ID 7802843, 19 pages https://doi.org/10.1155/2019/7802843
Transcript of Resource Scheduling for Postdisaster Management in IoT ...

Research ArticleResource Scheduling for Postdisaster Management inIoT Environment
J. Sathish Kumar and Mukesh A. Zaveri
Computer Engineering Department, SVNIT, Surat, India
Correspondence should be addressed to J. Sathish Kumar; [email protected]
Received 27 November 2018; Revised 4 February 2019; Accepted 18 February 2019; Published 20 March 2019
Guest Editor: Maurizio Casoni
Copyright © 2019 J. Sathish Kumar and Mukesh A. Zaveri. This is an open access article distributed under the Creative CommonsAttribution License, which permits unrestricted use, distribution, and reproduction in any medium, provided the original work isproperly cited.
For postdisaster management, rescue and recovery operations are very critical. It is desired that the rescue and recovery operationshould be handled through efficient resource management to minimize the postdisaster effects in terms of human loss and othertypes of damage. Resource management requires addressing various challenging issues like scheduling and monitoring of theresources which need real time information of various activities or events occurring anytime, anywhere, and anyplace. To satisfysuch requirements, Internet ofThings, an advanced upcoming technology, can be utilized for resource monitoring and scheduling.In this context, we propose resource scheduling algorithm for the postdisaster management. As mentioned above various tasks ofrescue and recovery operation should be carried out with different priority and there should not be deadlock while availing theresources. In our approach, we estimate the waiting time using queuing theory for the availability of the resources for differentactivities that are to be performed at various locations. The simulation results of the proposed method are analyzed using differentstandard parameters like resource utilization and the waiting time for different activities.The proposedmethod is further visualizedthrough real time annotation of resources and activities represented with the help of Google maps using android based applicationon the smartphone. The proposed algorithm is further compared in terms of computational complexity and fairness analysis forthe effective utilization of the available resources.
1. Introduction
Natural disasters such as earthquakes, floods, hurricanes,volcanic eruptions, and tsunamis strike at various places onthe earth every year with a great loss of human beings and theeconomy. United Nations International Strategy for DisasterReduction (UNISDR) survey [1] reported that the number ofdisasters across the earth has been 346 during the year 2015.As a consequence of these disasters, 22,773 people lost theirlives, 98.6 million people were affected, and an economicloss of USD 66.5 billion had occurred. In India alone, 38million people were affected with different types of disastersandUSD 29million of economic damage occurred [2] during2011-2015. From this information, it is clear that handling thedisaster situation is very critical. So, there is a need for anefficient disaster management.
Among all the various phases in the disaster [3, 4], theresponse and recovery phases are crucial for postdisastermanagement. For quick response and recovery, there is a
need for different resources and these resources must bedistributed in such a way that various activities can beperformed efficiently.This leads to a need for proper resourceutilization as the number of resources is limited. In thiscontext, scheduling of resources is required for completionof different activities or tasks for postdisaster management.Scheduling of resources in the response phase is crucialbecause it has to perform various activities like the evacuationof the people and shifting them to a safe location on anurgent basis. To handle disaster-related rescue operations,the real time need of various activities should be identifiedproperly. For instance, in the context of disaster, variousactivities like gathering the information across the disasterplaces for establishing communication network are essentialand critical. If a communication network is IP enabled andif it is possible to connect various resources using this IPenabled network, then it is possible to have information aboutthe need of resources andwhereabouts of various resources inreal time.This information can be utilized for the distribution
HindawiWireless Communications and Mobile ComputingVolume 2019, Article ID 7802843, 19 pageshttps://doi.org/10.1155/2019/7802843
2 Wireless Communications and Mobile Computing
and scheduling of resources for different activities. Such IPenabled network, having resources with sensor devices andRFID tag, is possible to realize using the Internet of Things(IoT). IoT technology is very influential that works basedon Internet [5–7] and can help in a great extent to meetthe requirements of the postdisaster management. In thispaper, we propose algorithm for such IoT based networks.As mentioned above with the help of IoT, it is possibleto access the information anytime, anyplace, and anywherewhich helps in decision making.
Depending on the type of activity and its impact, variousactivities should be executed in a timely and proper manner.In such scenarios, it is necessary that each activity should beassigned the priority. Based on the priority of various activi-ties, they should be given more importance while schedulingdifferent resources. For example, the hospitalization of theinjured people is having more priority compared to thereallocation of properties or handling the economic lossrelated activities. Further, the resources are scheduled so thatall activities should be addressed with minimum waitingtime for completing the respective activities. For estimatingthe waiting time of the various activities, queuing theory isexplored. Oftentimes, disaster activities might take place inan overlapped manner with respect to time. This situationleads to a set of requests simultaneously for many resourcesby different activities at various locations which results indeadlock or race conditions. If rescue operations are notcarried out at right time, the situation may deteriorate.From the above discussion, it is clear that efficient resourcescheduling for various activities is necessary and challenging.In this context, we propose the priority based resourcescheduling algorithm in this paper.
Themain contribution and novelty of our paper is that wepropose a resource scheduling algorithm in IoT environmentfor postdisaster management, by considering the priorities ofthe activities and to avoid deadlock conditions, with optimumnumber of resource centers by estimating minimum waitingtime using queuing theory. For evaluating our proposedmethod, a case study is conducted in Surat city of India,by emulating the affected area, for considering differentactivities to be completedwith the given number of resources.The algorithm output is visualized on android based applica-tion using Google map. The resource monitoring at variousactivities can be carried out effectively.The proposed queuingmodel is evaluated with respect to resource utilization andwaiting time with the different number of resource centersby varying the arrival rate and service rate of activities. Theproposed approaches are compared with the standard set ofparameters like fairness in the allocation of resources forutility and computational complexity.
The rest of the paper is organized as follows. Related workis presented in Section 2. Section 3 introduces the problemformulation. The system model based on queuing theory forevaluating thewaiting time for resource scheduling is detailedin Section 4. The proposed resource scheduling algorithm isdescribed in Section 5 and in Section 6, the simulation resultsare presented. Section 7 concludes the paper with referencesat the end.
2. Related Work
In this section, the review of overall postdisastermanagementresource scheduling and allocation of various approachesis explored. A study conducted by Fraunhofer Gesellschafton emergency and disaster management systems [8, 9]concludes that, besides the information and communicationmanagement, the other areas which are critical in disastermanagement task are viz., visualization, decision support,optimization and simulation, geographic information sys-tems (GIS), simulation, and training. Two important activi-ties in disaster situations are logistics support and evacuation.Various approaches related to evacuation have been reportedin the literature [10, 11].The approaches related to the logisticshave been explored in [10, 12–15]. A generic approach tohandle the disastermanagement has been proposed in [16, 17]using greedy and game theoretic basedmodels. Regarding theresource allocation and scheduling during disaster situations,various approaches have been proposed in [18–21]
Optimal resource allocation in emergency managementwas carried outwith the help of agent-based systemusing costallocation by creating events with a severity of the disastersat various levels and verified with Pareto optimality test in[18]. This approach is not suitable for handling resourceallocation for concurrent emergency events, in which theoccurrence time of different events could overlap with eachother. Resource allocation model with two stages with vul-nerability analysis has been proposed in [20]. The approachproposed in [20] works at rescue team level. The higherauthorities may not be able to coordinate the tasks efficientlydue to lack of the information. For postdisaster management,centralized and distributed coordination is required. But fordisaster management, as the whole task is very complex,the top level decision must be incorporated for designingthe response strategy which was lacking in [20]. Dynamicscheduling based optimized resource allocation has beenproposed in [21] using the genetic algorithm. The approachin [21] may not be suitable for varying the situations andfor real time resource mapping as various critical factors arenot considered and further, it lacks in terms of integrationof various modules required for disaster management. In[22], scheduling using priorities transportation agency inhurricane recovery has been proposed.
For disasters like earthquake, the resource allocationapproach has been optimized for emergency responseusing dynamic combinatorial optimization model [23]. Theapproach in [23], specifically proposed to handle earthquakesituation, might not be suitable for other kinds of disasters.Distribution in humanitarian relief usingmixed integer linearprogramming approach has been proposed in [24] usingdifferent parameters like transportation cost and a numberof days needed to rescue. The approach reported in [24] mayincrease computational complexity if an optimized solutionis required for a given situation. Allocation and schedulingof rescue units in natural disaster management has been pro-posed in [25] using Monte-Carlo based heuristic approach.As stated in [25], the performance could be improved bycoordinating and collaborating over the autonomous agents.

Wireless Communications and Mobile Computing 3
For flood-related disasters, an approach for logistics prepa-ration in an uncertain environment has been proposed in[26]. Similarly, for urgent relief in disaster situation based ondemand, for logistics distribution has been proposed in [27].
In the literature, for handling emergency response sce-narios the queuing theory has been used to address variousissues. In [28], a detailed survey has been carried out fordisaster management operations. Queuing theory has beenexplored for health care management services in [29–34].Queuing theory based model [29] has been proposed for thepatients requiring an immediate emergency cardiac response.Likewise, in [30], using queuing theory method, approachhas been proposed for enhancing hospital emergency service.These approaches lack the integration of various processesand the automation of the complete system. In [31], atechnique has been suggested to analyze the completion timefor responding in case of accidents and emergency situations,which can be utilized by the respective departments of theUK government. In [31], it is stated that as the arrival rateof patients increases, then the system becomes unstablein estimating the targets of such accidents. Similarly, theallocation of various resources in ICU (intensive care unit)of the hospitals during busy times of emergency has beenexplored in [32]. As per the study carried out in [32],the allocation of resources in disaster situations yieldeduncertain results due to randomness and unpredictability.Kristin Fitzgerald et al. [33] proposed a queue-based Monte-Carlo analysis in disaster situations for decision making toexecute the rescue operations by the hospital managementas fast as possible. In [33], the waiting time for the patientsto get the nursing resource as demanded was evaluated. Inthe approach proposed in [33], worst case scenarios havenot been considered. For disaster circumstances, the solutionto handle worst case scenarios is very much crucial andneeded at the highest priority. Likewise, in [34], the queuingtheory has been exploited to make the analysis for managingthe hospital systems during emergency times efficiently. Thewaiting time for the patients for availing the treatment wasnot discussed in [34].
The approaches that have been discussed so far give aglimpse of the resource scheduling and allocation in disas-ter management situations, but to understand the currentscenarios, we explored various approaches that have beenrecently proposed [35–40]. The resource allocation approachfor postdisaster management in the context of IoT hasbeen proposed by considering the priorities of both variousactivities and resources using stable matching approach [35].Likewise, resource allocation for maximum utilization of theresources using maximum bipartite graph theory has beenproposed in the context of IoT for postdisaster management[36]. In both approaches of [35, 36], the estimating of thewaiting time for allocation and number of resource centers tobe utilized has not been detailed. The approach to optimizethe decisions related to logistics in a collaborative way forthe flood disaster situation has been proposed [37]. But, it isreported in that the proposed model is not able to managethe differences between the various organizations involvedfor rescue and their utilization to an essential required place[37]. Likewise, an approach for postdisaster humanitarian
logistics in the context of proving the medical assistanceteams has been proposed [38]. However, few limitationsare reported that the classification of various types of reliefmedical supplies is not carried out and while dispatchingthe logistics, heterogeneous vehicle routing problem is notaddressed. Further, resource scheduling approach is pro-posed in the IoT environment for postdisaster management[39]. But, the drawback in this approach [39] is that theestimating of the waiting time for various tasks and resourcesis not addressed. An approach for allocation of the resourcesduring simultaneous disasters has been proposed [40]. Theyperformed the risk analysis with resource constraints formeeting the given targets and estimated the financial aspectswith different budgets and further the political effects havebeen considered.
From the above literature, it is clear that there is ascope for an efficient resource scheduling algorithm forpostdisaster management. In this context, we propose analgorithm which considers the different critical parametersfor allocation and scheduling of the resources in an effectivemanner. The proposed scheduling algorithm along with theproblem formulation is described in the following sections.
3. Problem Formulation
For postdisaster management, the rescue and recovery oper-ations are very crucial and to carry out these operationsresources are required. Having limited number of resources,for various task accomplishment, resource scheduling mustbe done in an efficient manner. Scheduling of the resourcescan be performed using the number of parameters. In thispaper, we consider two parameters, namely, the priority of theactivities and the expected completion time of an activity.Thecompletion time of any activity depends upon the resourceavailability. In such case, the resource availability is verycrucial and must be handled efficiently. In this context, itis very important to find out time duration after which theresource may be available for a given task or activity. Thistime duration can be considered as a waiting time. So, itis necessary to estimate a waiting time for resources and itindirectly provides a measure for the completion time of anactivity. In our proposed algorithm, we estimate the waitingtime for the availability of the resources that is required fora specific activity. Generally, various resources are dispatchedfromdifferent locations in the affected region.These locationsare considered as resource centers. At the beginning ofany rescue operation, various resources are distributed fromdifferent resource centers. It is very important to decidethe number of resource centers that should be establishedto cover the maximum affected area. Similarly, the disasteraffected area should be divided into subareas or zones foreffective rescue operations. Each zone may have at least oneresource center. In this context, the required optimal numberof resource centers needs to be estimated for the postdisastermanagement activities.
In brief, from the above discussion, the waiting time forthe availability of a resource and the number of resourcecenters required to carry out rescue operation are significant

4 Wireless Communications and Mobile Computing
and this operation should be performed in a very efficientand effective manner. In this view, we exploit a very standardapproach, queuing theory, for estimating a waiting time andthe number of resources and using these estimated param-eters, the resource scheduling algorithm is introduced. It isalso required that the various activities should be completedin a particular order, which leads to a situation where thegiven activities should be completedwith a particular prioritywhich may be preassigned. The waiting time evaluation andestimating the optimal number of resource centers and thepriority assigned to different activities are the key parametersfor effective and efficient postdisaster management. Further,the scheduling of the resources must be done in a fairmanner avoiding the race conditions or starving amongthe activities. For scheduling, a large number of methodshave been reported in the literature which is detailed in therelated work section. Among various scheduling algorithmssurveyed, we explore Banker’s algorithm [41, 42] for ourproposed scheduling algorithm. Our proposed algorithm isenhanced in such a way that it should meet the requiredconditions like the priority of a given task or activity. Inthe literature, Banker’s algorithm has been used for processscheduling in the operating system. Earlier, we have proposeda scheduling approach [43] for postdisaster managementusing Banker’s algorithm. In this paper, our earlier proposedalgorithm is enhanced by incorporating the parameters,namely, the priority of the task and waiting time for theavailability of the resources for resource scheduling.
From the above discussion, for our proposed system,we address mainly three issues which are very importantand crucial for rescue and response operations as a part ofpostdisaster management. These three issues are the numberof resource centers to be utilized and resource schedulingof the respective activities by considering the prioritiesand scheduling them without deadlock conditions. For thispurpose, the disaster affected region may be divided intoregions or zones for effective activity management. All theavailable resources are to be visualized at the top level as agroup. In this context, the problem formulation is representedin the form of a graphmodel with various resources and theirinterconnections in the form of activities.
Let us say that there are 𝑙 activities and 𝑚 resources inthe system. These activities say 𝑎1, 𝑎2, . . . , 𝑎𝑙 can be denotedby 𝑎𝑖, where (1 ≤ 𝑖 ≤ 𝑙). Likewise, the resource of 𝑗 type istermed as 𝑟𝑗, where (1 ≤ 𝑗 ≤ 𝑚). In the system, it is assumedthat the number of similar types of resources is available,i.e., if a particular resource 𝑟𝑗 is available with 𝑘 number ofquantities, then we define it as 𝑘 instances of 𝑟𝑗. The numberof instances of 𝑘 varies from one resource to other resources.This information is available at the time of planning. Forexample, three ambulances are present in a system consideredas three instances of resource type ambulance.
In a graph 𝐺, each node is labeled, either, as an activitynode or a resource node.The node is represented as an activ-ity node, 𝑎𝑖, and resource node, 𝑟𝑗. These particular activitynodes and resource nodes are interconnected through theedges. In real practice, the rescue and response operationhave to perform the number of tasks. Each task consists ofdifferent activities which results in dependencies among the
L1
L2
L3
L4
;1 ;2 ;3
Figure 1: Illustration of improper scheduling.
activities for completing a task. In our proposed system, thedependency among the activities is handled at the schedulinglevel. In this view, the typical graph using activities andresources looks like as shown in Figure 1. To make graphrepresentation simpler, the different instances of resourcesare also represented as graph nodes and these instances arerepresented by black dots within the resource node itself. It isassumed in this example that there is no activity dependency.So, the activity nodes are not interconnected. Figure 1 reflectsthe same, where 𝑟1 and 𝑟3 have one instance each, whereas 𝑟2and 𝑟4 have two and three instances, respectively.
As pointed out earlier, various tasks consist of differentactivities and each activity requires a set of resources. It mayresult in deadlock or race condition among the differentactivities. Asmentioned, the dependency among the activitiesis handled by the scheduling algorithm but it is necessaryto map these dependencies in the graph of activities andresources nodes. The scheduling algorithm is devised insuch a way that it should help in resolving the deadlock orrace conditions. In such cases, it may happen that differentactivities require the same set of resources for completing thetask. As each activity needs a set of resources that need tobe scheduled, the allocation of resources to the activities andscheduling themmust be handled simultaneously to avoid thedeadlock or race situations. It is important to note that, in ourproposed systems, we take care of this critical requirementthrough the graph which helps the scheduling algorithm forfair allocation. In this view, the resource dependencies amongthe activities are represented through directional edges inthe graph. The arrow from an activity node to the resourcenode indicates that a particular activity needs that resource.The arrow from resource node instance to activity nodeindicates that a particular instance of the resource is allocatedto that activity. Indirectly, this representation of activities andresources allows one to find a cycle or deadlock situationsor race conditions at a given instance of time. All thesedirectional edges represent the demand in the allocation at agiven instance of time and that demand varies with the time.

Wireless Communications and Mobile Computing 5
The major contribution of this work is to represent thedemand and the allocation of the resources and dependen-cies among the activities, through the directional graph.This makes our graph dynamic which actually representsa dynamic network of resources. This graph representationagain helps the management authority at a given instanceof time for monitoring the resources and activities andhence, the task at any level can be performed with ease.As shown in Figure 1, activity 𝑎1 needs resource 𝑟1 whichis currently allocated to activity 𝑎2. Similarly, two instancesof 𝑟2 are allocated to activities 𝑎1 and 𝑎2, respectively. Butthe same instance resource 𝑟2 is required by the activity𝑎3. As there is no additional instance of 𝑟2 available, itcannot be allotted to activity 𝑎3. This requires an effectiveand efficient scheduling. The demand and allocation arerepresented as a directed graph 𝐺 = (𝑉, 𝐸), where 𝑉 is aset of vertices that indicates the activities and resources and𝐸 ⊆ {{𝑎𝑖, 𝑟𝑗} | 𝑎𝑖, 𝑟𝑗 ∈ 𝑉, 𝑎𝑖 = 𝑟𝑗} defines the potentialallocation edges. Any resource scheduling algorithm shouldperform the scheduling of resources among the activities in afair manner. There should not be any deadlock situation orrace condition which results in the starvation of resourceswhich holds the complete system in a standstill condition.So, it is important to schedule the different activities andallocate the resources based on some additional informationor the number of parameters. These parameters should bechosen in such a way that it should lead to a very effective andefficient resource allocation and scheduling for postdisastermanagement activities.
These parameters are utilization of the optimum numberof resource centers, evaluating the waiting time for avail-ability of the resources for completing a particular task,i.e., waiting time for a particular resource, and resourcescheduling discussed earlier with the priority of differentactivities. In this view, the system must have a methodologyto incorporate these three parameters in resource allocationand scheduling. The postdisaster management requires realtime dynamic decision making. For supporting the dynamicdecision making using these three parameters, it is necessaryto evaluate them in real time, i.e., based on the demand ofthe allocations. Considering this fact, the best solution thatone has is based on queuing theory. In this context, oursystem is modeled using queuing theory for evaluating theseparameters. In the following section, we describe the queuingbased modeling using the above parameters.
4. Queuing Theory Based System Model
In the literature, the queuing theory has been very wellexploited for the problem of demand and supply or producerand consumer based applications. For demand and supplybased applications, the system has the number of serviceproviders and the number of service users. In queuing theory,various parameters like arrival rate of service user and servicerate, length of the requests in the queue, and waiting timeof the requests in the queue are very critical and modeledbased on statistical distribution. In the context of postdisastermanagement, the task and activities are the services to the
user or consumer, whereas resources act as a service provideror producer. In this view, the queuing theory based modelinghelps in designing the robust system which not only providesan optimal solution but allows one to complete the requiredtask in an effective and efficient manner. The performance ofthe queuing based systemdepends on the number of availableresources, i.e., service centers or servers in the system and thelength of the requests in the queue. Consequently, these twoparameters decide the waiting time for the availability of aresource for a particular activity. As discussed earlier, theseresources are distributed and located at various places in thedisaster affected area.
The queuing system is represented using Kendall’s nota-tion [28].TheKendall’s notation consists of four variables thatdefine the system parameters. The standard Kendall’s nota-tion is given as M/M/C/K; then these parameters are definedas arrival rate/service rate/number of servers/capacity ofeach queue. For instance, if the arrival rate is representedas 𝜆/hour and the service rate as 𝜇/hour, with 1 server ofthe capacity of 10 items in the queue being hold, then theKendall’s notation can be given as //1/10. In the context of thedisastermanagement, the various activities are requesting theresources to accomplish the given job. Hence, the resourcesare acting as servers and activities are waiting in the queueto get served by the resources. These resources are availablein various resource centers. Therefore, the queuing theory inour system is defined as arrival rate of requests by variousactivities/service rate of the resources/number of resourcecenters/number of activities waiting in the queue.
Generally, the number of requests is not known inadvance. In such a case, the queuing system can be modeledusing an infinite number of requests. Similarly, for servingthese requests, the resources available in the system areconsidered to be finite. The arrival rate and the service rateare modeled based on different probabilistic distributions.For instance as shown in the above notation, 𝑀/𝑀/𝐶/𝐾represents themodeling of arrival rate as Poisson distribution𝑀 as the first parameter, followed by the second parameterfor service rate which is modeled as exponential distribution𝑀. 𝐶 is the number of resources centers which are availablein the system and 𝐾 is the number of requests arrivingto the system by various activities. The reason for usingPoisson distribution for arrival rate is because it involvesmemoryless waiting time until the arrival of the next requestin nonoverlapping time intervals that are probabilisticallyindependent.
For the postdisaster management, we explore the queu-ing theory and model the system accordingly. Postdisastermanagement consists of various tasks to be accomplished.These tasks are decomposed into different activities and eachactivity requires a set of resources for its completion. Forour system, an arrival rate of the requests is nothing butthe arrival of activities for different resources. The request isoriginated by a particular activity for a given task. Similarly,a service rate of different requests is nothing but a particularresource utilized by a particular activity of a given task. Asdiscussed in the problem formulation, the service rate, i.e., thetime for which a resource is utilized by an activity affects ordecides when the same resource will be available to another

6 Wireless Communications and Mobile Computing
activity, which is considered as a waiting time for the nextactivity to acquire that same resource. In a queuing theory,this waiting time is also modeled similarly to the servicerate; i.e., if the service rate is modeled using exponentialdistribution, then waiting time also follows an exponentialdistribution. The main aim of our work is to distribute theresources to different activities with minimum waiting time.In this context, we model our system using queuing theoryto estimate the optimal number of resource centers requiredto minimize the overall waiting time for all the activities inthe system.These resource centers can be utilized for efficientresource scheduling. The queuing system based modeling isdetailed as below.
In this paper, for modeling the system using queuingtheory, we define four parameters. These parameters arerelated to (i) the number of requests that arrive for differentresources at resource centers, (ii) the service rate or executiontime for completing the requests, (iii) the length of the queuefor holding these requests for different resources at resourcecenters, and (iv) the capacity of the systems which is ameasure of how many requests can be handled by the systemat a given time, i.e., the number of the requests in a queue andthe number of requests in a service or execution and overalltime from entry to exit of a request through the system.Here, the system consists of the number of resource centersand each resource center has a number of resources. In this
context, these four parameters are, namely, categorized as (i)the length of the activities in the queue to hold the numberof requests that are coming to the system, (ii) the waitingtime for the activities in the queue as the resources and theresource centers are busywith serving the other activities, (iii)the length of the total activities which is the capacity of thesystem holding the number of requests in the queue as well asin the service, and (iv) the waiting time of the total numberof the activities which reflects the duration from entry toexit through the system. Determining the optimal number ofresource centers and the waiting time for the requests usingthe queuing model based on the above four parameters isdetailed as below. Now, the total number of activities in thesystem is defined in
Total number of activities in the system
= Activities arrival rate/Resources service rate1 − Activities arrival rate/Resources service rate
(1)
Since the length of the system, total number of activities in thesystem, is known, the number of activities that are waiting inthe queue, waiting time of the all the activities, and waitingtime in the queue can be determined using Little’s equation[28] as shown in
Total number of activities in the system = Total number of activities in the queue
+ Expected number of activities are being served by the resources(2)
Waiting time in the queue = Total number of activities in the queueActivities arrival rate
(3)
Waiting time of all activties = Total number of activitiesActivities arrival rate
(4)
The example of the single resource center is explained with anexample in Appendix A.
The abovemodel is derived using a single resource center.The waiting time for the availability of resources for differentactivities which are served by a single resource helps furtherto design the system with multiple resource centers. In realpractice, there are many areas in the affected region wherethe different tasks are to be performed and only one resource
center is not sufficient. Using the above model which isderived for a single resource center can be extended formultiple resource centers so that the waiting time for theavailability of different resources for different activities ofvarious tasks can be minimized and the rescue and recoveryoperation can be executed efficiently. In this context, thequeuing system is modeled with number of resource centersthat can be determined by the following equation
Total Number of Activities in the queue
= Activities arrival rate/Resources service rateNumber of Resource Centers+1𝑃0(Number of Resource Centers − 1)! (Number of Resource Centers − Activities arrival rate/Resources service rate)2
(5)
where, 𝑃0 is the probability that there is no queue. Equation(5) represents the relationship between the length of therequests in the queue and the number of resource centers.
The optimal number of resource centers can be evaluated byverifying by (5) =1, i.e., no waiting time. It means that as soonas the requests come, they will be processed which depicts an
Wireless Communications and Mobile Computing 7
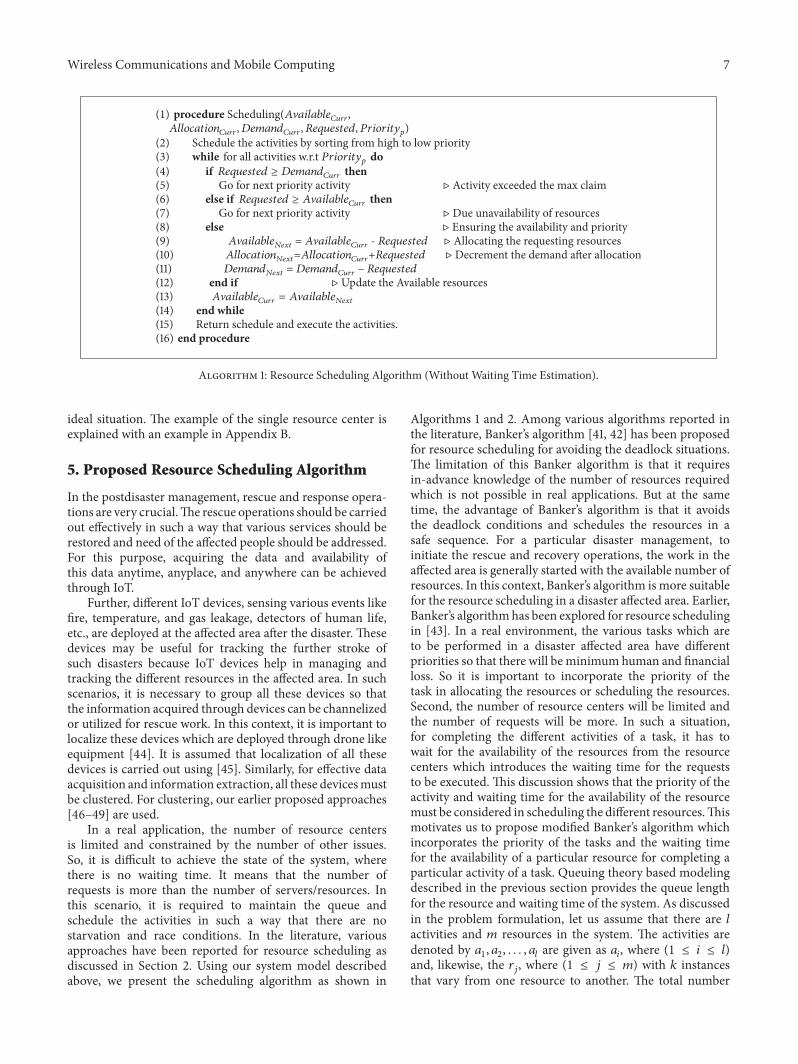
(1) procedure Scheduling(𝐴V𝑎𝑖𝑙𝑎𝑏𝑙𝑒𝐶𝑢𝑟𝑟,𝐴𝑙𝑙𝑜𝑐𝑎𝑡𝑖𝑜𝑛𝐶𝑢𝑟𝑟, 𝐷𝑒𝑚𝑎𝑛𝑑𝐶𝑢𝑟𝑟, 𝑅𝑒𝑞𝑢𝑒𝑠𝑡𝑒𝑑, 𝑃𝑟𝑖𝑜𝑟𝑖𝑡𝑦𝑝)
(2) Schedule the activities by sorting from high to low priority(3) while for all activities w.r.t 𝑃𝑟𝑖𝑜𝑟𝑖𝑡𝑦𝑝 do(4) if 𝑅𝑒𝑞𝑢𝑒𝑠𝑡𝑒𝑑 ≥ 𝐷𝑒𝑚𝑎𝑛𝑑𝐶𝑢𝑟𝑟 then(5) Go for next priority activity ⊳ Activity exceeded the max claim(6) else if 𝑅𝑒𝑞𝑢𝑒𝑠𝑡𝑒𝑑 ≥ 𝐴V𝑎𝑖𝑙𝑎𝑏𝑙𝑒𝐶𝑢𝑟𝑟 then(7) Go for next priority activity ⊳ Due unavailability of resources(8) else ⊳ Ensuring the availability and priority(9) 𝐴V𝑎𝑖𝑙𝑎𝑏𝑙𝑒𝑁𝑒𝑥𝑡 = 𝐴V𝑎𝑖𝑙𝑎𝑏𝑙𝑒𝐶𝑢𝑟𝑟 - 𝑅𝑒𝑞𝑢𝑒𝑠𝑡𝑒𝑑 ⊳ Allocating the requesting resources(10) 𝐴𝑙𝑙𝑜𝑐𝑎𝑡𝑖𝑜𝑛𝑁𝑒𝑥𝑡=𝐴𝑙𝑙𝑜𝑐𝑎𝑡𝑖𝑜𝑛𝐶𝑢𝑟𝑟+𝑅𝑒𝑞𝑢𝑒𝑠𝑡𝑒𝑑 ⊳ Decrement the demand after allocation(11) 𝐷𝑒𝑚𝑎𝑛𝑑𝑁𝑒𝑥𝑡 =𝐷𝑒𝑚𝑎𝑛𝑑𝐶𝑢𝑟𝑟 – 𝑅𝑒𝑞𝑢𝑒𝑠𝑡𝑒𝑑(12) end if ⊳ Update the Available resources(13) 𝐴V𝑎𝑖𝑙𝑎𝑏𝑙𝑒𝐶𝑢𝑟𝑟 = 𝐴V𝑎𝑖𝑙𝑎𝑏𝑙𝑒𝑁𝑒𝑥𝑡(14) end while(15) Return schedule and execute the activities.(16) end procedure
Algorithm 1: Resource Scheduling Algorithm (Without Waiting Time Estimation).
ideal situation. The example of the single resource center isexplained with an example in Appendix B.
5. Proposed Resource Scheduling Algorithm
In the postdisaster management, rescue and response opera-tions are very crucial.The rescue operations should be carriedout effectively in such a way that various services should berestored and need of the affected people should be addressed.For this purpose, acquiring the data and availability ofthis data anytime, anyplace, and anywhere can be achievedthrough IoT.
Further, different IoT devices, sensing various events likefire, temperature, and gas leakage, detectors of human life,etc., are deployed at the affected area after the disaster. Thesedevices may be useful for tracking the further stroke ofsuch disasters because IoT devices help in managing andtracking the different resources in the affected area. In suchscenarios, it is necessary to group all these devices so thatthe information acquired through devices can be channelizedor utilized for rescue work. In this context, it is important tolocalize these devices which are deployed through drone likeequipment [44]. It is assumed that localization of all thesedevices is carried out using [45]. Similarly, for effective dataacquisition and information extraction, all these devicesmustbe clustered. For clustering, our earlier proposed approaches[46–49] are used.
In a real application, the number of resource centersis limited and constrained by the number of other issues.So, it is difficult to achieve the state of the system, wherethere is no waiting time. It means that the number ofrequests is more than the number of servers/resources. Inthis scenario, it is required to maintain the queue andschedule the activities in such a way that there are nostarvation and race conditions. In the literature, variousapproaches have been reported for resource scheduling asdiscussed in Section 2. Using our system model describedabove, we present the scheduling algorithm as shown in
Algorithms 1 and 2. Among various algorithms reported inthe literature, Banker’s algorithm [41, 42] has been proposedfor resource scheduling for avoiding the deadlock situations.The limitation of this Banker algorithm is that it requiresin-advance knowledge of the number of resources requiredwhich is not possible in real applications. But at the sametime, the advantage of Banker’s algorithm is that it avoidsthe deadlock conditions and schedules the resources in asafe sequence. For a particular disaster management, toinitiate the rescue and recovery operations, the work in theaffected area is generally started with the available number ofresources. In this context, Banker’s algorithm is more suitablefor the resource scheduling in a disaster affected area. Earlier,Banker’s algorithmhas been explored for resource schedulingin [43]. In a real environment, the various tasks which areto be performed in a disaster affected area have differentpriorities so that there will be minimum human and financialloss. So it is important to incorporate the priority of thetask in allocating the resources or scheduling the resources.Second, the number of resource centers will be limited andthe number of requests will be more. In such a situation,for completing the different activities of a task, it has towait for the availability of the resources from the resourcecenters which introduces the waiting time for the requeststo be executed. This discussion shows that the priority of theactivity and waiting time for the availability of the resourcemust be considered in scheduling the different resources.Thismotivates us to propose modified Banker’s algorithm whichincorporates the priority of the tasks and the waiting timefor the availability of a particular resource for completing aparticular activity of a task. Queuing theory based modelingdescribed in the previous section provides the queue lengthfor the resource and waiting time of the system. As discussedin the problem formulation, let us assume that there are 𝑙activities and 𝑚 resources in the system. The activities aredenoted by 𝑎1, 𝑎2, . . . , 𝑎𝑙 are given as 𝑎𝑖, where (1 ≤ 𝑖 ≤ 𝑙)and, likewise, the 𝑟𝑗, where (1 ≤ 𝑗 ≤ 𝑚) with 𝑘 instancesthat vary from one resource to another. The total number

8 Wireless Communications and Mobile Computing
(1) procedureWaiting Time Estimation(Arrival rate, Service rate and Number of Resource Centers)(2) while for 𝑖 in all activities 𝑎𝑖 do(3) Calculate the values as per equation (1) to (5). ⊳ Estimate waiting time for activities(4) Determine the optimal number of resource centers using (5)(5) Verify the waiting time is ≈ 0 using multiple resource centers.(6) end while(7) Call Algorithm 1;(8) end procedure
Algorithm 2: Resource Scheduling Algorithm (With Waiting Time Estimation using QueuingTheory).
of resources of type 𝑗 required by an activity 𝑖 over thetime to complete the activity is represented as 𝐷𝑒𝑚𝑎𝑛𝑑𝑖𝑗.Similarly, the number of resources of type 𝑗 allocated to anactivity 𝑎𝑖 is indicated by 𝐴𝑙𝑙𝑜𝑐𝑎𝑡𝑖𝑜𝑛𝑖𝑗. This representationleads to the two-dimensionalmatrices demand and allocationrepresents the current state of the requests for a particularresource and number of resources in service. As the requestsarrive for the different resources from the different activities,𝐷𝑒𝑚𝑎𝑛𝑑𝑖𝑗 varies. As the resources are allocated to a particularactivity, 𝐴𝑙𝑙𝑜𝑐𝑎𝑡𝑖𝑜𝑛𝑖𝑗 is updated. As discussed earlier for aresource type 𝑟𝑗, the number of currently available instancesis stored in 𝐴V𝑎𝑙𝑖𝑎𝑏𝑙𝑒𝑗. The particular type of the resourcemay be required by different activities of different tasks. Soit is not possible to allocate all the available resources for aparticular activity at a givenmoment of time.The𝐴𝑙𝑙𝑜𝑐𝑎𝑡𝑒𝑑𝑖𝑗is the number of resources of type 𝑗 currently allocated toactivity 𝑎𝑖 against its 𝐷𝑒𝑚𝑎𝑛𝑑𝑖𝑗. So, additional resources oftype 𝑗 required by an activity 𝑎𝑖 for its completion are storedin 𝑅𝑒𝑞𝑢𝑒𝑠𝑡𝑒𝑑𝑖𝑗. With these definitions, now we are able toverify the resources that are available and can be allocatedimmediately. The first criterion checks the requested numberof resources that should be less than the available numberof resources; i.e., the additional required resources are lessthan the total available resources which can be represented as(6). The proposed algorithm fulfills the essential conditionsof the activities and verifies the availability of the requestedresources using the given equation
𝑙
∑𝑖=1
𝑚
∑𝑗=1
𝑅𝑒𝑞𝑢𝑒𝑠𝑡𝑒𝑑𝑖𝑗 ≤𝑚
∑𝑗=1
𝐴V𝑎𝑖𝑙𝑎𝑏𝑙𝑒𝑗 (6)
for 𝑙 number of activities, i.e., 𝑎𝑖 where i=1 to 𝑙, and𝑗 number of different types of resources 𝑟𝑗 where 𝑗 variesfrom 1 to 𝑚. This criterion presents that a particular activityneeds a different type of the resources for its completion; i.e.,the equation indicates that the total number of additionalresources required by the different activities is less than thetotal number of available different resources. Similarly, thesecond criterion states that the demand is more than theavailable resources; then the request is placed in the queue.This can be as shown in
𝑚
∑𝑖=1
𝑟𝑖 ≤𝑙
∑𝑖=1
𝑚
∑𝑗=1
𝐷𝑒𝑚𝑎𝑛𝑑𝑖𝑗 (7)
for 𝑙 number of activities, i.e., 𝑎𝑖 where i=1 to 𝑙, and 𝑗 numberof different types of resources 𝑟𝑗 where 𝑗 varies from 1 to𝑚.
With these formulations, the algorithm is representedwith a simpler resource scheduling algorithm based onBanker’s method with priority assigned to each activity. Theflowchart of the proposed algorithm is shown in Figure 2 andcorresponding pseudocode is depicted inResource SchedulingAlgorithm 1. In the proposed algorithm, the subscript 𝐶𝑢𝑟𝑟and 𝑁𝑒𝑥𝑡 are used with the different notations to representthe current value of that variable and the value available forthe next iteration, respectively. For example, 𝐴V𝑎𝑖𝑙𝑎𝑏𝑙𝑒𝑁𝑒𝑥𝑡 =𝐴V𝑎𝑖𝑙𝑎𝑏𝑙𝑒𝐶𝑢𝑟𝑟 -𝑅𝑒𝑞𝑢𝑒𝑠𝑡𝑒𝑑 represents the number of resourcesof a particular type available for the next iterations which canbe evaluated by subtracting the additionally required numberof resources by a particular activity from the currentlyavailable number of resources of a particular type.
In this context, two variants of proposed algorithm arepresented for resource scheduling.The first variant considersonly the priority assigned to the activity without consideringevaluation of waiting time for availability of a resource.Second, we represent scheduling algorithmwhere the priorityassigned to different activities andwaiting time for availabilityof a particular resource is also considered which makes ourresource scheduling algorithm dynamic and elegant. Algo-rithm 1 presents resource scheduling algorithm consideringthe priority of the task or activity on hand and Algorithm 2estimates the waiting time for the resource availability forcompleting different activities using queuing theory and callsAlgorithm 1. To evaluate the waiting time in the queue,parameters like arrival rate, service rate, and number ofresource centers are important and essential. In our proposedapproach, by keeping number of resource centers constant,we observe the waiting time by increasing the service ratefor different arrival rates. The same information is presentedas a flowchart in Figure 3 and corresponding pseudocode isshown in Algorithm 2. Upon the observation with differentarrival rates, the optimum number of resource centers canbe utilized. After the resource centers are finalized, thescheduling algorithm is called for the resource allocation forvarious activities.
The time complexity of the proposed Resource SchedulingAlgorithm 1 is 𝑂(𝑎2𝑟) with utmost 𝑎 possible activities and 𝑟resources, whereas the brute force approach time complexityis 𝑂(𝑎!/(𝑎 − 𝑟)!). For 𝑎 number of activities and 𝑟 numberof resources, the enumeration in FCFS approach [50] is 𝑎𝑃𝑟which is equal to (𝑎!/(𝑎 − 𝑟)!). Therefore, the proposed

Wireless Communications and Mobile Computing 9
Schedule the activities by sorting from high to low
Start
Input
Stop
Return the schedule and excute the activities
: , !FFI=;NCIH , $?G;H> , Requested, 0LCILCNSJ
While(for all activitiesw.r.t 0LCILCNSJ)
if (Requested >= )
Yes
Yes
Update the available resources
No
No
Go for next priority activity
Go for next priority activity
because it exceeds maximum claim
because unavailability of resources
if(Requetsed >= )
!P;CF;<F?#OLL=!P;CF;<F?.?RN
!P;CF;<F?.?RN= -Requested
!FFI=;NCIH.?RN= +Requested
$?G;H>.?RN= -R equested
!P;CF;<F?=OLL
!P;CF;<F?=OLL
!P;CF;<F?=OLL
=OLL
!FFI=;NCIH=OLL
=OLL
$?G;H>=OLL
$?G;H>=OLL
Figure 2: Flowchart of the Proposed Resource Scheduling Algorithm 1.
resource scheduling algorithm using Banker’s strategy givesoptimal results compared with the brute force approach.
6. Simulation Results
In this section, the simulation result is presented in threesubsections. The first subsection presents the evaluation ofqueuing based proposed system whereas second subsectiondescribes the result of evaluation of proposed priority basedscheduling algorithm. The simulation results are carried outfor evaluating the proposed queuing theory based system.The simulations are performed using different scenarios forevaluating the waiting time and determining the optimum
number of resource centers given queuing system parameterslike arrival rate and service rate. In each scenario, the aimis to minimize waiting time and complete different activitiesof various tasks required for rescue and recovery operationfor postdisaster management. Efficient scheduling of variousresources through different resource centers should be allo-cated in an optimal way. A case study is presented havingdifferent emergency locations in the area where differentactivities are to be performed using Googlemap. For this casestudy, the number of resource centers with different typesof resources is considered. These resources are required byvarious activities of different tasks that are to be performedfor rescue and recovery operations.The proposed scheduling

10 Wireless Communications and Mobile Computing
Start
Stop
Call Algorithm1
Verify the waiting time is
Determine the optimal number ofresource centers using equation5
approximately = 0
Input: Arrival rate, Service rateand number of reosurce centers
Calculate the values asper equations 1 to 5
Output: Expected Waiting Time
While(for i in all activities ai)
Figure 3: Flowchart of the Proposed Resource Scheduling Algo-rithm 2.
algorithm outcomes are depicted in the visual form usingthe developed application on the android platform whichcan be deployed for postdisaster management. For the actualimplementation purpose, we designed and created our ownandroid application using API:19 Android 4.4 (KitKat) [51].In the third subsection, the comparative analysis is pre-sented. The proposed algorithm is evaluated and comparedwith existing approaches reported in the literature. Theperformance analysis is carried out using different standardparameters, algorithm computational complexity time, andfairness in resource allocation and scheduling.
6.1. Evaluation of the Queuing Based System. For demon-strating the robustness of our queuing theory based sys-tem, the proposed model is evaluated in terms of resourceutilization and waiting time with the different number ofresource centers and activities. For ease of understanding,we used few notations to represent the various parameters,such as arrival rate of the activities= 𝜆, service rate of theresources = 𝜇, number of resource centers =𝐶, and resourceutilization=𝜌 = 𝜆/𝜇. With these notations, the simulationsare performed in different scenarios. Initially, the resourceutilization is evaluated by keeping the number of resourcecenters constant. For the given number of resource centers,
the simulations are performed by varying the arrival rateof requests originating from different emergency locationsfor various activities. The resource utilization is plotted withrespect to increasing rate of service for different requests thatarrive at resource centers. It is shown in Figure 4.
It is clearly observed from Figure 4 that the resourceutilization decreases as the service rate increases for differentarrival rates. As the number of resource centers increases,the resource utilization decreases which can be visualizedfrom Figure 4. As shown in Figure 4, as the resourcecenter increases from 1, 2, 3, and 5, the maximum resourceutilization decreases from 1.0, 0.5, 0.35, and 0.2. Similarly,another parameter that is evaluated is the waiting time. Forthe different arrival rates, the waiting time for availability ofthe resource for different activities is plotted with respect toincreasing rate of service which is shown in Figure 5.
As the service rate increases, the waiting time decreasesfor different arrival rates. Further, the waiting time is decreas-ing as the number of resource centers is increasing. As shownin Figure 5, as the resource centers increase from 1, 2, and3 the maximum waiting time decreases. The correspondingvalues for resource centers 1, 2, and 3 are 1.0 hrs, 0.025 hrs, and0.003 hrs, respectively. Also, it is observed that if the numberof resource centers is increased more than 3, the waitingtime of the various activities is almost zero as the servicerate increases. Based on the above experimental results, it isobserved that as the number of resource centers increases, thewaiting time for availability of the resource is decreasing. Butat the same time, the cost of the capital amount for settingup the resource centers increases as the 𝐶 increases. Hence,there should be a tradeoff in utilizing the optimum numberof resource centers such that thewaiting time for the activitiescan be handled effectively.
6.2. Evaluation of Proposed Resource Scheduling Method.For evaluating the proposed modified Banker algorithm forresource scheduling, the real scenario is emulated as a casestudy. The Google map is used to show different emergencylocations in the area chosen for emulation. These are theareas of local city, Surat, of the state Gujarat in India. Thecomplete visualization of resource scheduling is executedthrough the android application developed for smartphonedevices. The idea is on-site application can be used in caseof disaster and various resource centers can be monitoredin real time. All devices which are part of resources may beIP enabled and may serve as IoT devices. These IoT devicesnow can be monitored through our developed applicationanywhere and anytime. This is the advantage of having IoTenabled environment for postdisaster management. All thetasks and various activities of these tasks along with theirutilization of various resources can be monitored using asimple mobile device. The network can be accessed using asimple plugged router as an access point in the affected area.The proposed modified Banker algorithm is implementedon android platform for online monitoring of the completenetwork. The resource scheduling scenario is tested andanalyzed. The various screenshots of execution of resourcescheduling method are presented using Google map [52].

Wireless Communications and Mobile Computing 11
Arrival rate, =10=20=30=40=50
1500 50 200100 250 300Service Rate ()
0.0
C=1,
0.2
0.4
0.6
0.8
1.0
Reso
urce
Util
izat
ion
()
(a) Single Resource Center
1500 50 200100 250 300Service Rate ()
0.00.10.20.30.40.50.60.70.80.91.0
Arrival rate, =10=20=30=40=50
C=2,
Reso
urce
Util
izat
ion
()
(b) Two Resource Centers
1500 50 200100 250 300Service Rate ()
Arrival rate, =10=20=30=40=50
C=3,
0.000.050.100.150.200.250.300.350.400.450.500.550.600.650.700.750.800.850.900.951.00
Reso
urce
Util
izat
ion
()
(c) Three Resource Centers
1500 50 200100 250 300Service Rate ()
Arrival rate, =10=20=30=40=50
C=5,
0.0
0.2
0.4
0.6
0.8
1.0
Reso
urce
Util
izat
ion
()
(d) Five Resource Centers
Figure 4: Resource Utilization of Various Resource Centers.
The resource scheduling is evaluated by consideringdifferent areas of Surat city as emergency locations. Let usassume that the resources are requested by different tasks atemergency locations that are local areas, namely, VR Mall,Big-bazaar, SVNIT, Adajan, and Athwa Gate. The resourcesare requested from the different resource centers located atdifferent areas of the city, namely, Adajan, Majura gate, andKatargam. The locations of emergency places and resourcescenters are visualized using Google map. These locationsare shown in Figure 6. Figure 6(a) represents the particularscreenshot where the emergency locations and resource
center places are listed. Figure 6(b) displays the locations ofresource centers using Google map. Figure 6(c) shows theemergency locations in the Surat city.
For compact visualization on a small screen of the mobiledevice, the symbols are assigned as R1, R2, andR3 for resourcecenters. Similarly, the emergency places are assigned names𝐴0, 𝐴1, 𝐴2, 𝐴3, and 𝐴4. These 𝐴0, 𝐴1, 𝐴2, 𝐴3, and 𝐴4 mayrepresent the different tasks or activities at respective placesor locations.This representation is shown in Figure 7. Variousactivities of different tasks to be performed at emergencylocations require a different number of resources from the

12 Wireless Communications and Mobile Computing
1500 50 200100 250 300Service Rate ()
0.0
0.2
0.4
0.6
0.8
1.0
Wai
ting
time (
hrs)
Arrival rate, =10=20=30=40=50
C=1,
(a) Single Resource Center
1500 50 200100 250 300Service Rate ()
Arrival rate, =10=20=30=40=50
C=2,
0.000
0.005
0.010
0.015
0.020
0.025
Wai
ting
time (
hrs)
(b) Two Resource Centers
1500 50 200100 250 300Service Rate ()
Arrival rate, =10=20=30=40=50
C=3,
0.0000
0.0005
0.0010
0.0015
0.0020
0.0025
0.0030
Wai
ting
time (
hrs)
(c) Three Resource Centers
Figure 5: Waiting Time of Various Activities.
respective resource center which is represented as two-dimensional entries in the matrix form. As discussed inthe proposed algorithm section, these two parameters areincorporated for better resource allocation and scheduling,i.e., the priority of the activity and the waiting time for theavailability of the resource for an activity. To minimize thewaiting time for the availability of the resources for differentactivities, we utilized queuing based modeling which isincorporated in the proposed resource scheduling algorithmand the simulation is carried out.
Let us assume that there are 3 types of resources, say,𝑟1, 𝑟2, and 𝑟3 with 10, 5, and 7 instances of each resource,
respectively. These resources 𝑟1, 𝑟2, and 𝑟3 are available atresource centers R1, R2, andR3, respectively. Let the resourcesbe allocated to 5 activities, say, 𝐴0, 𝐴1, 𝐴2, 𝐴3, and 𝐴4. Asshown in Figure 7(a), at place 𝐴0, activities have resources(𝑟1, 𝑟2, 𝑟3)=(0 1 0) initially allocated from resource centersR1, R2, and R3. Similarly, at location 𝐴1, activities have beenallocated resources (𝑟1, 𝑟2, 𝑟3)=(2 0 0) initially. At other places,𝐴2 has (3 0 2), 𝐴3 has (2 1 1), and 𝐴4 has (0 0 2) resourcesinitially allocated. The additional requirement of resourceby each activity is shown in Figure 7(b); i.e., at place 𝐴0,activities have demand of resources (𝑟1, 𝑟2, 𝑟3)=(7 5 3) fromresource centers R1, R2, and R3, respectively. Similarly, at

Wireless Communications and Mobile Computing 13
(a) Details of resource centers and emer-gency locations
(b) Resource Centers on Google map (c) Emergency locations on Google map
Figure 6: Google Map Representation.
(a) Resource allocation values (b) Maximum resource required (c) Available resource values
Figure 7: Input details of location and values for all tasks.
other emergency locations, 𝐴1 needs (3 2 2), 𝐴2 needs (9 02), 𝐴3 needs (2 2 2), and 𝐴4 needs (4 3 3) additional numberof resources from A, B, and C resource centers. After initialallocation, the available numbers of resources at resourcecentersA, B, andC are 3, 3, and 2, respectively, which is shownin Figure 7(c). The resource centers and emergency locationswhich are listed in Figure 6(a) are represented using Googlemap and are displayed in Figure 8(a).
Now, the execution of our proposed resource schedulingalgorithm results in resource scheduling of resources fordifferent activities, in a safe sequence, avoiding deadlock
and race conditions which are shown in Figure 8(b). UsingBanker’s algorithm for resource scheduling, the execution ofvarious activities scheduled at different emergency locationsis represented by the sequence of numbers 1, 3, 4, 0, and 2 inFigure 8(b).This sequence number represents the emergencylocation places and without priorities. That is, the activitiesare scheduled at places𝐴1,𝐴3,𝐴4 𝐴0 and𝐴2 in sequence. Soactivity at place 𝐴1 is executed first followed by the activitiesat place𝐴3. Then, activities at place𝐴4 are executed followedby activities at 𝐴0 and 𝐴2. In terms of actual locations ofthe Surat city, the resource is allocated to Athwa Gate first,

14 Wireless Communications and Mobile Computing
(a) Resource centers and activity representa-tion
(b) Safe Sequence Scheduling
Figure 8: Scheduling of activities without priorities.
followed by VR Mall, Big-bazaar, SVNIT, and Adajan insequence. After the allocations of resources at these placesin sequence as discussed above the sequence of execution atdifferent places is shown with a blue marker in Figure 8(b).
Afterward, the simulation result is presented whereanother parameter, i.e., the priority of the activity, is incor-porated for resource scheduling. The visual representationassignment of the priority to different activities is shown inFigure 9(a). The activities at place 𝐴0 are assigned lowestpriority whereas the activities at place 𝐴3 are assignedthe highest priority compared to other places. The outputof resource scheduling method, with two parameters, thewaiting time for availability of the resource for differentactivities and the priority of the activity, is displayed inFigure 9(b).
The resource scheduling for different activities at differentplaces using the proposed method results in a differentsequence of places for executing different activities. Thesequence is now, 3, 1, 2, 4, and 0, as shown in Figure 9(b).This sequence indicates that the scheduling of the activitiesat place 𝐴3 should be executed first due to the higherpriority, followed by activities at place 𝐴1. The activities atplace 𝐴2 are having higher priority than the activities atplace 𝐴3. Because the requested number of resources is 9from resource center A by activities at place 𝐴2 it is notpossible to allocate those many resources as the availablenumber of resources is only 5. Due to nonavailability of thesufficient number of resources, the next priority activities atplace 𝐴1 are executed. Afterward, the activities at place 𝐴2,followed by the activities at place 𝐴4 and the activities atplace𝐴0, are executed in sequence. Using this sequence, now,
the resources are allocated to VR Mall, followed by AthwaGate, Adajan, Big-bazaar, and SVNITplaces, respectively.Thesequence of places for execution of different activities usingour resource scheduling method is shown with a blue markerin Figure 9(b). This demonstrates that, using our prioritybased resource scheduling algorithm, it is possible to executethe different activities at different places without deadlockor any race conditions for availing different resources and itresults in a safe sequence of activity execution across differentplaces.
6.3. Comparative Analysis. For demonstrating the efficacy ofour proposed algorithm, the performance analysis is carriedout by comparing our approaches with different algorithmsreported in the literature [10, 35, 36, 50]. The approachesproposed for resource allocation with first come first served(FCFS) strategy [50], greedy strategy [10], stable matchingapproach [35], and maximum bipartite graph approach [36]are considered for our comparison purpose.Theperformanceis compared using the standard parameters [53], that is, fair-ness in resource allocation and execution time for completingthe different activities.
The proposed approaches are devised in such a way thatmaximum utilization of the resources is achieved. For eachactivity, the resources were allocated withmaximum fairness.Jain et al. [53] proposed a technique tomeasure the fairness byquantifying it. The fairness is given by the following equation
𝑓 (𝑋) =[∑𝑙𝑖=1 𝑎𝑖]
2
𝑛×𝑙
∑𝑖=1
𝑎2𝑖 (8)

Wireless Communications and Mobile Computing 15
(a) Priority values (b) Safe Sequence Scheduling
Figure 9: Scheduling of Activities with Priorities.
where 0 ≤ 𝑓(𝑋) ≤ 1 is fairness measure of resourceallocation. 𝑋 = (𝑎1, 𝑎2, . . . , 𝑎𝑙) represents the number ofresources 𝑎𝑖 allocated to activity 𝑖. There are 𝑙 activitiesassumed. A large value of 𝑓(𝑋) represents fairer resourceallocation from the system perspective. The correspondingresult is shown in Figure 10. It is observed that the fairnessof Algorithm 1 is better than the other approaches compared.Due to the additional parameter of priority, Algorithm 2 givesless fairness in the allocation of resources than Algorithm 1.From this figure it is clear that the fairness achieved usingresource scheduling methods using priority of activities andwaiting time for availability of the resource for differentactivities is much higher compared to that of other methodsreported in the literature.
We also analyze the proposed algorithm in terms of com-putational complexity for critical time analysis and response.As discussed earlier, for the proposed Resource SchedulingAlgorithm 1, the time complexity is 𝑂(𝑎2𝑟) with utmost 𝑎possible activities and 𝑟 resources. But brute force approachtakes 𝑂(𝑎!/(𝑎 − 𝑟)!). Also, the greedy approach proposedin [10] takes 𝑂(𝑟2𝑎 log 𝑎) because of the sorting of theactivities. The time complexity of stable matching approachis 𝑂(𝑎𝑟) whereas maximum bipartite graph approach takes𝑂(𝑝𝑞) where 𝑝 = |𝑎| + |𝑟| and 𝑞 = |𝐸|, i.e., number ofedges. The comparative results of computational complexitytime analysis are shown in Figure 11, which helps us todetermine the proposed algorithm results better than bruteforce approach [50] which is FCFS and greedy approach[10]. It is observed that stable matching algorithm takes lesstime followed by simple Banker’s algorithm which takes lesstime among all the approaches compared. Because of the
complexity consideration for queuing theory, Algorithm 2takes more time than Algorithm 1.
7. Conclusion
Resource scheduling and activity management are crucialduring disaster circumstances. The functionality of IoT inthe IP-network formation for communications in real timemonitoring helps in effective tracking and utilization of theavailable resources. The empirical results show that usingqueuing theory helps to determine the optimal number ofresource centers. Based on the usage of optimum resourcecenters, the proposed algorithm schedules the resources byconsidering the priority of the activities depending on thesituational requirements. The proposed algorithm is furtherverified by taking a case study of Surat city and demonstratedusing real time android application with the help of Googlemaps. The proposed approaches are evaluated in terms offairness and computational complexity time analysis, whichshows better results than the approaches reported in theliterature. The proposed algorithm can be further extendedas future work for dealing with the response time of eachresource at respective resource center which, in turn, affectsthe performance of the overall system.
Appendix
A. Single Server Resource Center
To illustrate the single resource centers with an example,assume the arrival rate of the activity is 8 per hour and service

16 Wireless Communications and Mobile Computing
Number of Activities5 10 20 40 50 1008
Comparative Fairness Analysis
FCFS [50]Greedy [10]Maximum BiPartite Graph[36]Stable Matching [35]Algorithm1Algorithm2
0.1
0.2
0.3
0.4
0.5
0.6
0.7
0.8
0.9
1
Fairn
ess
Figure 10: Fairness Comparative Analysis.
Number of Activities4 10 20 40 50 70 80 150 200 250 300
Comparative Computational Complexity Time Analysis
FCFS [50]Greedy [10]Maximum BiPartite Graph[36]Stable Matching [35]Algorithm1Algorithm2
0
100
200
300
400
500
600
Exec
utio
n Ti
me (
Sec)
Figure 11: Algorithm Computational Complexity Time Analysis.
rate of resources is given as 9 per hour; then we have thefollowing.
(i) Now, 𝑃0 = 1−𝜌 = 0.111. 11.1% of the times there is noactivity in the system.
(ii) Theprobability that the resources are not available canbe determined by 1 = 𝑃0 = 𝜌 = 0.88.Therefore, 88.8%of the times the resources are busy.
(iii) The probability that there is no queue is determinedby 𝑃0(𝑛𝑜 𝑞𝑢𝑒𝑢𝑒) = 𝑃0 + 𝑃1 = 0.11 + 𝜌𝑃0 = 0.111(1 +

Wireless Communications and Mobile Computing 17
0.88) = 0.2098. So, 21% of the times there will be noqueue.
(iv) The probability of 10 activities in the system, P(10 inthe system), 𝑃10 = 𝜌10𝑃0 = 0.8810 ∗ 0.11 = 0.0341.So, 3.4% times, out of 10 activities in the system, 1 isgetting served and 9 are waiting for the service.
(v) The probability of at least 2 or more activities in thesystem is given by 𝑃(𝑛 ≥ 2) = 𝑃2 + 𝑃3 + . . . + 𝑃∞ =1−𝑃0+𝑃1 = 1−0.2098 = 0.7902. So, 79% of the timesthere will be 2 or more activities in the system.
(vi) The waiting time of the system is 1 hour.
B. Multiple Server Resource Center
To illustrate the multiple resource centers with an example,assume the arrival rate of the activity is 10 per hour andservice rate of resources is given as 6 per hour and thenumber of resource centers is 2; then, activities arrival rate/(Numner of resource centers ∗ service rate of resources) =10/12 = 0.833 < 1.
(i) Now, 𝑃0 = 0.0909. So, 9.1% of the times there is noactivity in the system.
(ii) The probability that both resources are free suchthat an activity is assigned is given by 𝑃(𝐴𝑐𝑡𝑖V𝑖𝑡𝑦𝑔𝑒𝑡𝑠 𝑎 𝑟𝑒𝑠𝑜𝑢𝑟𝑐𝑒) = 𝑃0 + 𝑃1 = 0.2424. So, 24.24% ofthe times the activity gets the resources.
(iii) The probability that there is no queue is determinedby𝑃0(𝑛𝑜 𝑞𝑢𝑒𝑢𝑒) = 𝑃0+𝑃1+𝑃2 = 0.11+𝜌𝑃0+𝜌2𝑃0/2 =0.389. So, 39% of the times there will be no queue.
(iv) Waiting time = 0.6 hr.The waiting time is 36 minutes.
Data Availability
None of the included data is available online.
Conflicts of Interest
The authors declare that there are no conflicts of interestregarding the publication of this article.
Acknowledgments
This work is supported by the Ministry of Electronics andInformation Technology (MeiTY), funded by Government ofIndia under the Grant No. 13(4)/2016-CC&BT.
References
[1] M.Wahlstrom and D. Guha-Sapir,TheHuman Cost ofWeather-Related Disasters 1995-2015, UNISDR, Geneva, Switzerland,2015, https://www.unisdr.org/files/46796 cop21weatherdisaster-sreport2015.pdf.
[2] “Data collection Survey for Disaster Prevention in India,” Japan,2015, http://open jicareport.jica.go.jp/pdf/12245155.pdf.
[3] M. Muaafa, A. L. Concho, and J. E. Ramirez-Marquez, “Emer-gency Resource Allocation for Disaster Response: An Evolu-tionary Approach,” 2014.
[4] L. Pearce, “Disaster management and community planning,and public participation: how to achieve sustainable hazardmitigation,” Natural Hazards, vol. 28, pp. 211–228, 2003.
[5] G. M. Lee, N. Crespi, J. K. Choi, and M. Boussard, “Internet ofthings,” inEvolution of Telecommunication Services, pp. 257–282,Springer, 2013.
[6] J. Gubbi, R. Buyya, S. Marusic, and M. Palaniswami, “Internetof Things (IoT): a vision, architectural elements, and futuredirections,” Future Generation Computer Systems, vol. 29, no. 7,pp. 1645–1660, 2013.
[7] L. Yang, S. H. Yang, and L. Plotnick, “How the internet ofthings technology enhances emergency response operations,”Technological Forecasting & Social Change, vol. 80, no. 9, pp.1854–1867, 2013.
[8] A.Meissner, T. Luckenbach, T. Risse, T. Kirste, and H. Kirchner,“Design challenges for an integrated disaster managementcommunication and information system,” in Proceedings of theFirst IEEE Workshop on Disaster Recovery Networks (DIREN’02), vol. 24, pp. 1–7, 2002.
[9] G. Studie, “Market analyse katastrophen-und not fall manage-ment systeme,” Kaiserslautern, 2002.
[10] L. Ozdamar and W. Yi, “Greedy neighborhood search fordisaster relief and evacuation logistics,” IEEE Intelligent Systems,vol. 23, no. 1, pp. 14–23, 2008.
[11] T. J. Cova and R. L. Church, “Modelling community evacuationvulnerability using GIS,” International Journal of GeographicalInformation Science, vol. 11, no. 8, pp. 763–784, 1997.
[12] A. M. Caunhye, X. Nie, and S. Pokharel, “Optimization modelsin emergency logistics: a literature review,” Socio-EconomicPlanning Sciences, vol. 46, no. 1, pp. 4–13, 2012.
[13] H.O.Mete andZ. B. Zabinsky, “Stochastic optimization ofmed-ical supply location and distribution in disaster management,”International Journal of Production Economics, vol. 126, no. 1, pp.76–84, 2010.
[14] G. Barbarosolu, L. Ozdamar, and A. Cevik, “An interactiveapproach for hierarchical analysis of helicopter logistics indisaster relief operations,” European Journal of OperationalResearch, vol. 140, no. 1, pp. 118–133, 2002.
[15] E. T. Erdemir, R. Batta, P. A. Rogerson,A. Blatt, andM. Flanigan,“Joint ground and air emergency medical services coveragemodels: a greedy heuristic solution approach,”European Journalof Operational Research, vol. 207, no. 2, pp. 736–749, 2010.
[16] E. Rolland, R. A. Patterson, K. Ward, and B. Dodin, “Decisionsupport for disaster management,” Operations ManagementResearch, vol. 3, no. 1-2, pp. 68–79, 2010.
[17] A. C. Chapman, R. A. Micillo, R. Kota, and N. R. Jennings,“Decentralised dynamic task allocation: a practical game:theoretic approach,” in Proceedings of the 8th InternationalConference on Autonomous Agents and Multiagent Systems, vol.2, pp. 915–922, 2009.
[18] J. Zhang, M. Zhang, F. Ren, and J. Liu, “An innovation approachfor optimal resource allocation in emergency management,”IEEE Transactions on Computers, 2016.
[19] S. Babashetty, A. G. Kurian, and R. Vonna, “Multi-tenant disas-ter recovery management system and method for intelligentlyand optimally allocating computing resources betweenmultiplesubscribers,” (Jul. 26 2016), uS Patent 9,400,718.

18 Wireless Communications and Mobile Computing
[20] C. Zhang, X. Liu, Y. Jiang, B. Fan, and X. Song, “A two-stageresource allocation model for lifeline systems quick responsewith vulnerability analysis,” European Journal of OperationalResearch, vol. 250, no. 3, pp. 855–864, 2016.
[21] S. Chang, M. Ichikawa, H. Deguchi, and Y. Kanatani, “A generalframework of resource allocation optimization and dynamicscheduling,” SICE Journal of Control, Measurement, and SystemIntegration, vol. 10, no. 2, pp. 77–84, 2017.
[22] J. H. Lambert and C. E. Patterson, “Prioritization of scheduledependencies in hurricane recovery of transportation agency,”Journal of Infrastructure Systems, vol. 8, no. 3, pp. 103–111, 2002.
[23] F. Fiedrich, F. Gehbauer, and U. Rickers, “Optimized resourceallocation for emergency response after earthquake disasters,”Safety Science, vol. 35, no. 1, pp. 41–57, 2000.
[24] B. Balcik, B. M. Beamon, and K. Smilowitz, “Last mile distribu-tion in humanitarian relief,” Journal of Intelligent TransportationSystems: Technology, Planning, and Operations, vol. 12, no. 2, pp.51–63, 2008.
[25] F. Wex, G. Schryen, S. Feuerriegel, and D. Neumann, “Emer-gency response in natural disaster management: allocation andscheduling of rescue units,” European Journal of OperationalResearch, vol. 235, no. 3, pp. 697–708, 2014.
[26] M.-S. Chang, Y.-L. Tseng, and J.-W. Chen, “A scenario planningapproach for the flood emergency logistics preparation problemunder uncertainty,” Transportation Research Part E: Logisticsand Transportation Review, vol. 43, no. 6, pp. 737–754, 2007.
[27] J. B. Sheu, “An emergency logistics distribution approach forquick response to urgent relief demand in disasters,” Trans-portation Research Part E: Logistics and Transportation Review,vol. 43, no. 6, pp. 687–709, 2007.
[28] N. Altay and W. G. I. Green III, “OR/MS research in disas-ter operations management,” European Journal of OperationalResearch, vol. 175, no. 1, pp. 475–493, 2006.
[29] A. M. De Bruin, A. C. Van Rossum, M. C. Visser, and G.M. Koole, “Modeling the emergency cardiac in-patient flow:an application of queuing theory,” Health Care ManagementScience, vol. 10, no. 2, pp. 125–137, 2007.
[30] L.Mayhew andD. Smith, “Amulti-class queuing network analy-sis methodology for improving hospital emergency departmentperformance,” Health Care Management Science, vol. 11, no. 1,pp. 11–21, 2008.
[31] J. K. Cochran andK. T. Roche, “Using queuing theory to analysethe governments 4-h completion time target in accident andemergency departments,” Computers & Operations Research,vol. 36, no. 5, pp. 1497–1512, 2009.
[32] M. L. McManus, M. C. Long, A. Cooper, and E. Litvak,“Queuing theory accurately models the need for critical careresources,” Anesthesiology, vol. 100, no. 5, pp. 1271–1276, 2004.
[33] K. Fitzgerald, L. Pelletier, and M. A. Reznek, “A queue-basedmonte carlo analysis to support decision making for imple-mentation of an emergency department fast track,” Journal ofHealthcare Engineering, vol. 2017, Article ID 6536523, 8 pages,2017.
[34] G. R. Rodrıguez Jauregui, A. K. Gonzalez Perez, S. HernandezGonzalez, and M. D. Hernandez Ripalda, “Analysis of theemergency service applying the queueing theory,” Contadurıay Administracion, vol. 62, no. 3, pp. 733–745, 2017.
[35] J. S. Kumar, M. A. Zaveri, and M. Choksi, “Activity basedresource allocation in IoT for disaster management,” in Pro-ceedings of the International Conference on Future InternetTechnologies and Trends, pp. 215–224, Springer, 2017.
[36] J. S. Kumar andM. A. Zaveri, “Graph-based resource allocationfor disaster management in IoT environment,” in Proceedingsof the Second International Conference on Advanced WirelessInformation, Data, and Communication Technologies, pp. 1–12,ACM, 2017.
[37] O. Rodrguez-Espndola, P. Albores, and C. Brewster, “Dis-aster preparedness in humanitarian logistics: a collaborativeapproach for resourcemanagement in floods,”European Journalof Operational Research, vol. 264, no. 3, pp. 978–993, 2018.
[38] S.Wang, F. Liu, L. Lian, Y. Hong, andH. Chen, “Integrated post-disaster medical assistance team scheduling and relief supplydistribution,” International Journal of Logistics Management,2018.
[39] H. Gamitl, J. S. Kumar, andM. A. Zaveri, “Resource monitoringand scheduling for post disaster management using internet ofthings,” in Proceedings of the 3rd IEEE International Conferencefor Convergence in Technology, pp. 1–5, 2018.
[40] X. V. Doan and D. Shaw, “Resource allocation when planningfor simultaneous disasters,” European Journal of OperationalResearch, vol. 274, no. 2, pp. 687–709, 2019.
[41] M. Lawley, S. Reveliotis, and P. Ferreira, “The application andevaluation of banker’s algorithm for deadlock-free buffer spaceallocation in flexible manufacturing systems,” InternationalJournal of Flexible Manufacturing Systems, vol. 10, no. 1, pp. 73–100, 1998.
[42] H.Madduri and R. Finkel, “Extension of the banker’s algorithmfor resource allocation in a distributed operating system,”Information Processing Letters, vol. 19, no. 1, pp. 1–8, 1984.
[43] J. S. Kumar, M. A. Zaveri, and M. Choksi, “Task based resourcescheduling in IoT environment for disaster management,”Procedia Computer Science, vol. 115, pp. 846–852, 2017.
[44] M. A. Zaveri, J. S. Kumar, S. Kumar, andM. Choksi, “Collabora-tive data processing and resource optimization for post disastermanagement and surveillance using internet of things,” Tech.Rep., Ministry of Electronics and Information Technology,2016.
[45] S. K. Pandey and M. A. Zaveri, “Localization for collaborativeprocessing in the internet of things framework,” in Proceedingsof the Second International Conference on IoT in Urban Space,pp. 108–110, ACM, 2016.
[46] J. S. Kumar and M. A. Zaveri, “Clustering for collaborativeprocessing in IoTnetwork,” inProceedings of the Second Interna-tional Conference on IoT in Urban Space, pp. 95–97, ACM, 2016.
[47] J. S. Kumar and M. A. Zaveri, “Hierarchical clustering fordynamic and heterogeneous Internet ofThings,” Procedia Com-puter Science, vol. 93, pp. 276–282, 2016.
[48] J. S. Kumar and M. A. Zaveri, “Graph based clustering for two-tier architecture in Internet of Things,” in Proceedings of the ofIEEE International Conference on Internet of Things (iThings)and IEEE Green Computing and Communications (GreenCom)and IEEE Cyber, Physical and Social Computing (CPSCom) andIEEE Smart Data (SmartData), pp. 229–233, 2016.
[49] J. S. Kumar and M. A. Zaveri, “Clustering approaches for prag-matic two-layer IoT architecture,”Wireless Communications andMobile Computing, vol. 2018, Article ID 8739203, 16 pages, 2018.
[50] L. K. Comfort, K. Ko, and A. Zagorecki, “Coordination inrapidly evolving disaster response systems:The role of informa-tion,” American Behavioral Scientist, vol. 48, no. 3, pp. 295–313,2004.
[51] Android 4.4 APIs, 2018, https://developer.android.com/about/versions/android-4.4.

Wireless Communications and Mobile Computing 19
[52] G. Svennerberg, Beginning Google Maps API 3, Apress, 2010.[53] D. C. R. Jain and W. Hawe, “A quantitative measure of fairness
and discrimination for resource allocation in shared systems,”Technical Report DEC-TR-301, Digital Equipment Corpora-tion, 1984.

International Journal of
AerospaceEngineeringHindawiwww.hindawi.com Volume 2018
RoboticsJournal of
Hindawiwww.hindawi.com Volume 2018
Hindawiwww.hindawi.com Volume 2018
Active and Passive Electronic Components
VLSI Design
Hindawiwww.hindawi.com Volume 2018
Hindawiwww.hindawi.com Volume 2018
Shock and Vibration
Hindawiwww.hindawi.com Volume 2018
Civil EngineeringAdvances in
Acoustics and VibrationAdvances in
Hindawiwww.hindawi.com Volume 2018
Hindawiwww.hindawi.com Volume 2018
Electrical and Computer Engineering
Journal of
Advances inOptoElectronics
Hindawiwww.hindawi.com
Volume 2018
Hindawi Publishing Corporation http://www.hindawi.com Volume 2013Hindawiwww.hindawi.com
The Scientific World Journal
Volume 2018
Control Scienceand Engineering
Journal of
Hindawiwww.hindawi.com Volume 2018
Hindawiwww.hindawi.com
Journal ofEngineeringVolume 2018
SensorsJournal of
Hindawiwww.hindawi.com Volume 2018
International Journal of
RotatingMachinery
Hindawiwww.hindawi.com Volume 2018
Modelling &Simulationin EngineeringHindawiwww.hindawi.com Volume 2018
Hindawiwww.hindawi.com Volume 2018
Chemical EngineeringInternational Journal of Antennas and
Propagation
International Journal of
Hindawiwww.hindawi.com Volume 2018
Hindawiwww.hindawi.com Volume 2018
Navigation and Observation
International Journal of
Hindawi
www.hindawi.com Volume 2018
Advances in
Multimedia
Submit your manuscripts atwww.hindawi.com


![Deep Reinforcement Learning for Delay-Oriented IoT Task ...arXiv:2010.01471v1 [cs.LG] 4 Oct 2020 1 Deep Reinforcement Learning for Delay-Oriented IoT Task Scheduling in Space-Air-Ground](https://static.fdocuments.us/doc/165x107/60c26d845a9a2b0b2278619c/deep-reinforcement-learning-for-delay-oriented-iot-task-arxiv201001471v1-cslg.jpg)