Resistivity, Magnetic Susceptibility and Sediment ...
62
W&M ScholarWorks W&M ScholarWorks Reports 2017 Resistivity, Magnetic Susceptibility and Sediment Characterization Resistivity, Magnetic Susceptibility and Sediment Characterization of the York River Estuary in Support of the Empirical Investigation of the York River Estuary in Support of the Empirical Investigation of the Factors Influencing Marine Applications of EMI (Year 2 of of the Factors Influencing Marine Applications of EMI (Year 2 of SERDP Project MR-2409) Final Report. SERDP Project MR-2409) Final Report. Grace M. Massey Virginia Institute of Marine Science Carl T. Friedrichs Virginia Institute of Marine Science Follow this and additional works at: https://scholarworks.wm.edu/reports Part of the Fresh Water Studies Commons, Hydrology Commons, Oceanography Commons, and the Sedimentology Commons Recommended Citation Recommended Citation Massey, G. M., & Friedrichs, C. T. (2017) Resistivity, Magnetic Susceptibility and Sediment Characterization of the York River Estuary in Support of the Empirical Investigation of the Factors Influencing Marine Applications of EMI (Year 2 of SERDP Project MR-2409) Final Report.. Virginia Institute of Marine Science, College of William and Mary. https://doi.org/10.21220/V5QS3Z This Report is brought to you for free and open access by W&M ScholarWorks. It has been accepted for inclusion in Reports by an authorized administrator of W&M ScholarWorks. For more information, please contact [email protected].
Transcript of Resistivity, Magnetic Susceptibility and Sediment ...

W&M ScholarWorks W&M ScholarWorks
Reports
2017
Resistivity, Magnetic Susceptibility and Sediment Characterization Resistivity, Magnetic Susceptibility and Sediment Characterization
of the York River Estuary in Support of the Empirical Investigation of the York River Estuary in Support of the Empirical Investigation
of the Factors Influencing Marine Applications of EMI (Year 2 of of the Factors Influencing Marine Applications of EMI (Year 2 of
SERDP Project MR-2409) Final Report. SERDP Project MR-2409) Final Report.
Grace M. Massey Virginia Institute of Marine Science
Carl T. Friedrichs Virginia Institute of Marine Science
Follow this and additional works at: https://scholarworks.wm.edu/reports
Part of the Fresh Water Studies Commons, Hydrology Commons, Oceanography Commons, and the
Sedimentology Commons
Recommended Citation Recommended Citation Massey, G. M., & Friedrichs, C. T. (2017) Resistivity, Magnetic Susceptibility and Sediment Characterization of the York River Estuary in Support of the Empirical Investigation of the Factors Influencing Marine Applications of EMI (Year 2 of SERDP Project MR-2409) Final Report.. Virginia Institute of Marine Science, College of William and Mary. https://doi.org/10.21220/V5QS3Z
This Report is brought to you for free and open access by W&M ScholarWorks. It has been accepted for inclusion in Reports by an authorized administrator of W&M ScholarWorks. For more information, please contact [email protected].

lv
VIMS Subcontract Resistivity, Magnetic Susceptibility and Sediment Characterization of the York River in Support of the Empirical Investigation of the Factors Influencing
Marine Applications of EMI (Year 2) SERDP Project MR-‐2409
Final Report – January 2017 VIMS Report CHSD-‐2017-‐01
Prepared for:
Nova Research, Inc. 1900 Elkin Street, Suite 230 Alexandria, VA 22208
In accordance with the terms of Purchase
Order B1345 under Nova Research, Inc. Prime Contract Number
N00173-‐14-‐D-‐2001
Grace M. Massey and Carl T. Friedrichs Phone: 804-‐684-‐7206, 7204; Fax: 804-‐684-‐7250
Email: [email protected] ; [email protected]
Department of Physical Sciences Virginia Institute of Marine Science

i
TABLE OF CONTENTS
Page
TABLE OF CONTENTS………………………………………………………………….i LIST OF TABLES………………………………………………………………………...ii LIST OF FIGURES……………………………………………………………………... iii 1. SUMMARY……..…………………………………………………………………….. 1 2. INTRODUCTION…………………………………………………………………….. 1 3. METHODS AND RESULTS…………………………………………………………. 2 3.1. Study Site and Sample Collection………………………...………………… 3 3.2. TEM sensor and water column data collection…..…………...………….... 5 2.3.1 Water Column CTD…………………………………………………….... 6 2.3.2 Water Column Velocity Profiles using ADCP……………………….... 7 3.3. Site Characterization of Bottom Sediment………...……………….…..….... 7 3.3.1 X-‐ray Cores…………………………………………………………..……. 8 3.3.2 TFS/TVS, Moisture and Grain-‐Size Distribution……………….….. 10 3.3.3 Seafloor Erodibility using Gust Microcosm…………………………. 13 3.3.4 Electrical Resistivity……………………………………………………. 16 3.3.5 Magnetic Susceptibility………………………………………………... 19 3. ACKNOWLEDGEMENTS..………………………………………………………….... 20 3. REFERENCES………………..………………………………………………………….... 20

VIMS Final Report for Nova Research, Inc. ii
LIST OF TABLES Table Page 1 EMI and Sediment Station Log………………….…………………….... 4 A2.1 Suspended Particulate Matter (SPM) Concentrations….…………..... 40 A2.2.A-‐D Temperature, Conductivity and Salinity Profiles…………………..…....44 A2.3.A-‐C Burst Averaged ADCP Water Speed, Direction and Backscatter……..…45 A2.4 Sediment Percent Grain-size and Organic Matter……………….……....48 A2.5.A-‐B Sediment Percent Moisture, Volatile Solids and Fixed Solids……..…....49 A2.6.A-‐B Sediment GUST Microcosm Erodibility……………………….…..…....51 A2.7.A-‐B Sediment Resistivity………………………………………………..…....53 A2.7C Core Surface Water for Sediment Resistivity……………………………56

VIMS Final Report for Nova Research, Inc. iii
LIST OF FIGURES
Figure Page 1 Study sites are along the York River estuary, a tributary of the Chesapeake Bay and into the Pamunkey River, the southern tributary of the York River ……...….3 2 Deployment of TEM sensor on board the R/V Elis Olsson……………………….5 3 Collection of bottom sediment with GOMEX box-core on board the R/V Heron..8 4 X-ray core with rubber bottom piece to seal bottom of core and foam rubber to protect top of the sediment captured in core………………………………....... 9 5 Sediment core extruded and sampled at 1-cm intervals from subcores to be later analyzed at the lab for percentage of total fixed solids (TFS), total volatile solids (TVS), and grain size. Water content (percent moisture) is equal to 100-TFS. TVS is a proxy for percent organic matter………………………………………........ 12 6A UGEMS dual core Gust microcosm system as arranged during an erosion experiment…………………………………………………………………………………………..… 14 6B Example of stress applied to microcosm and associated response to eroded material recorded by the turbidimeter for GI and YT cores………………….....… 14 6C Close-‐up of sediment suspension in a Gust microcosm with water circulation pattern highlighted by arrows……………………..………………………………………..… 14 7A Northwest Metasystems resistivity meter with Omega Data Acquisition System and resistivity and temperature probes ………………...…………………………………..… 17 7B Northwest Metasystems resistivity probe and calibrated Omega temperature probe ………………...…………………………………………………………………………..……………..… 17 8 Bartington Magnetic susceptibility core logging sensor (110 mm inside diameter) and the MS3 meter module mounted on stand…………………….…………….18 A1.1 In situ salinity and temperature water column profiles obtained at station locations of bottom sediment collection…………………………………………………... 23 A1.2 In situ conductivity and calculated resistivity water column profiles obtained at station locations coincident of bottom sediment collection…………………...... 24

VIMS Final Report for Nova Research, Inc. iv
A1.3 Burst Average water velocity profiles……………………………………...……25 A1.4 X-ray image and depth averaged intensity of sediment core from Goodwin Island (GI) location (core X5699) ……………………………...................................... 26 A1.5 X-ray image and depth averaged intensity of sediment core from Gloucester Point (GP) location (core X5666) …………...……………………………………...... 27 A1.6 X-ray image and depth averaged intensity of sediment core from Clay Bank (CB) location (core X5660) …………………………………………...……………... 28 A1.7 X-ray image and depth averaged intensity of sediment core from Ferry Point (FP) location (core X5680) ………………………………..…………………...…..... 29 A1.8 X-ray image and depth averaged intensity of sediment core from Pamunkey Muddy (PM) location (core X5672) ………………………………...………..... 30 A1.9 X-ray image and depth averaged intensity of sediment core from Pamunkey Sandy (PS) location (core X5691) …………………………………………....... 31 A1.10 A-D) % TFS, associated percent TVS and moisture of the total wet sample for 1 cm intervals from Goodwin Island (GI) station S5696, respectively. Water content (percent moisture) is equal to 100-TFS. TVS is a proxy for percent organic matter. D) Percent >850 microns, sand, silt and clay size class particles for each 1 cm interval of disaggregated sample on a total dry weight basis. Organic content (org) for each size class is plotted to the right of its fixed fraction…………………………………………………………………….…..... 32 A1.11. A-D) % TFS, associated percent TVS and moisture of the total wet sample for 1 cm intervals from Gloucester Point (GP) station S5665, respectively. Water content (percent moisture) is equal to 100-TFS. TVS is a proxy for percent organic matter. D) Percent >850 microns, sand, silt and clay size class particles for each 1 cm interval of disaggregated sample on a total dry weight basis. Organic content (org) for each size class is plotted to the right of its fixed fraction……………………………………………………………………......... 33 A1.12 A-D) % TFS, associated percent TVS and moisture of the total wet sample for 1 cm intervals from Clay Bank (CB) station S5657, respectively. Water content (percent moisture) is equal to 100-TFS. TVS is a proxy for percent organic matter. D) Percent >850 microns, sand, silt and clay size class particles for each 1 cm interval of disaggregated sample on a total dry weight basis. Organic content (org) for each size class is plotted to the right of its fixed fraction………...….34

VIMS Final Report for Nova Research, Inc. v
A1.13 A-D) % TFS, associated percent TVS and moisture of the total wet sample for 1 cm intervals from Ferry Point (FP) station S5678, respectively. Water content (percent moisture) is equal to 100-TFS. TVS is a proxy for percent organic matter. D) Percent >850 microns, sand, silt and clay size class particles for each 1 cm interval of disaggregated sample on a total dry weight basis. Organic content (org) for each size class is plotted to the right of its fixed fraction…………………………………………………………………………...35 A1.14 A-D) % TFS, associated percent TVS and moisture of the total wet sample for 1 cm intervals from Pamunkey Mud (PM) station S5696, respectively. Water content (percent moisture) is equal to 100-TFS. TVS is a proxy for percent organic matter. D) Percent >850 microns, sand, silt and clay size class particles for each 1 cm interval of disaggregated sample on a total dry weight basis. Organic content (org) for each size class is plotted to the right of its fixed fraction………………………………………………………………..………... 36 A1.15 A-D) % TFS, associated percent TVS and moisture of the total wet sample for 1 cm intervals from Pamunkey Sand (PS) station S5686, respectively. Water content (percent moisture) is equal to 100-TFS. TVS is a proxy for percent organic matter. D) Percent >850 microns, sand, silt and clay size class particles for each 1 cm interval of disaggregated sample on a total dry weight basis. Organic content (org) for each size class is plotted to the right of its fixed fraction……………………………………………………………………..…… 37 A1.16 The eroded mass of sediment as a function of critical shear stress, calculated from the stresses applied by the Gust microcosm to the cores, for each of the six sites……………………………..………………………………………………………..… 38 A1.17 Average resistivity as a function of depth for all 6 sediment characterization stations……………………………………………………………………………..……………………39 A1.18 Average and standard deviation of magnetic susceptibility as a function of depth for all six sites (from January 2015 Final Report)…………... 40

VIMS Final Report for Nova Research, Inc. 1
1. SUMMARY Vessel and personnel support was provided for a series of cruises to three salinity regimes along the York River. Data and samples from a standard suite of hydrographic and sedimentological measurements, as well as electrical resistivity and magnetic susceptibility, were collected and analyzed for each location. These cruises provided opportunities to obtain information that is being used to quantify the unique marine contributions to the early time TEM noise, including conductivity variations in the water and variability in bottom sediment properties in real marine environments, for use in the parallel modeling and electromagnetic-induction sensor work ongoing in the same project. Data collected during Year 1 of this project were used to select the appropriate locations to provide a range of conductivity and sediment conditions. 2. INTRODUCTION The objective of this component of SERDP Project MR-2409 was to conduct field measurements to aid in the determination of the electromagnetic induction (EMI) response to the water column and underlying sediments in the York River estuary, which includes water column and sediment properties similar to many underwater environments of interest to unexploded ordinance detection.
Many active and former military installations have ranges and training areas that include adjacent water environments such as ponds, lakes, rivers, estuaries, and coastal ocean areas. In other sites, training and testing areas were deliberately situated in water environments. Disposal and accidents have also generated significant munitions contamination in the coastal and inland waters in the United States. On land, the Environmental Security Technology Certification Program (ESTCP) Classification Pilot Program has demonstrated that the advanced electromagnetic induction (EMI) sensor arrays emerging from research sponsored by the Strategic Environmental Research and Development Program (SERDP) and ESTCP can be used to reliably detect and classify buried unexploded ordnance (UXO) at real munitions response sites under operational conditions. The marine environment introduces complexities in the response of these sensor systems, which can adversely affect performance. This project provides a comprehensive research study of the factors affecting the performance of advanced EMI sensor arrays in the marine environment.
The overall objective of the SERDP project MR-2409 is to begin to consider the fundamental physics that underlies UXO / Clutter classification performance in the underwater environment. During the first year of this project, sediment samples were collected and analyzed for magnetic susceptibility and electrical resistivity along the York River, VA. Complementary data and samples were also collected from a standard suite of hydrographic and sedimentological measurements. This work was used to choose appropriate locations during Year 2 of this project, described in this report, to field-test the EMI sensor arrays. (Note that there was a delay of several months between the end of Year 1 work and the start of Year 2 work. Thus the Year 2 final report is dated more than 12 months after the Year 1 final report.) At each location, a standard suite of hydrographic and sedimentological measurements, including magnetic susceptibility and

VIMS Final Report for Nova Research, Inc. 2
electrical resistivity, have been collected to provide real-world hydrodynamic and sediment characteristics for use in the parallel modeling and electromagnetic-induction sensor work ongoing in the same project.
3. METHODS AND RESULTS The objective of the Year 1 effort work was to gather background environmental information for field sites along the York River, VA, in support of NRL’s efforts as part of SERDP project MR-2409, Empirical Investigation of the Factors Influencing Marine Applications of EMI. In the first year, as part of this same project, a transient electromagnetic induction (TEM) sensor array was adapted for marine environments. The background response of the TEM sensor is expected to be altered by the conductivity of the water column as well as to bottom sediment characteristics (particularly grain size, percent moisture, magnetic susceptibility and electrical resistivity). Through decades of research by the Coastal Hydrodynamics and Sediment Dynamics Lab (CHSD) at the Virginia Institute of Marine Science (VIMS), the hydrography and sediments of the York River estuary have been well characterized (e.g. [1] and references therein). However, electrical resistivity and magnetic susceptibility were not a part of sediment characteristics routinely analyzed. Therefore, in the first year, the standard operation procedures were developed for sediment magnetic susceptibility and electrical resistivity with instrumentation obtained for this project. The methods were then tested for sediment from diverse sites (muddy and sandy) within at least one low, one high and one mid- conductivity regime for a total of 6 sites. Cores analyzed from these sites, for a suite of standard sedimentological parameters including magnetic susceptibility and electrical resistivity, were used to choose the appropriate Year 2 field sites for TEM deployment starting in June 2016. The TEM sensors, during tank tests conducted in Year 1 by our collaborators, were found capable of providing response data that can support target classification is a seawater-type environment, therefore as part of the Year 2 objectives, our collaborators conducted a series of measurements of the background response and its variability as a function of height above the bottom at various locations along the York River, chosen to span a range of conditions that could be found at marine munitions sites. Data were collected using the two TEM sensors mounted on a rigid plastic grid, and ancillary measurements of water column and bottom sediment properties were collected to help classify and interpret the results. The purpose of these field measurements is to quantify the uniquely marine contributions to the early time TEM noise including unsteadiness in the sensor elevation, surface waves, conductivity variations in the water and variability in bottom sediment properties in real marine environments. They will also indicate the extent to which the seawater, as a function of depth, attenuates the late time noise.

VIMS Final Report for Nova Research, Inc. 3
3.1 Study Site and Sample Collection Field data were collected at a series of sites along the York River estuary (Figure 1 and Table 1). The salinity at these sites ranged from < 1 PSU to > 22 PSU. At three of the sites, the seafloor sediment type consisted of mostly mud and silt and the other three were more fine sand and sandy mud. Figure 1 shows the eight sample locations marked on the map with orange triangles. The three sample locations in the high salinity regime, near the mouth of the river, are identified as Goodwin Island (GI), Gloucester Point (GP) and Naval Weapons Station (NWS). They are located 4.2, 13.7 and 13.8 km upriver from the mouth of the York River. The mid-‐salinity regime stations are identified as Clay Bank (CB) and Ferry Pier (FP), located 27.3 km and 31.7 km respectively. The low-‐salinity regime stations in the Pamunkey River, the southern tributary of the York, are identified as West Point (WP), Pamunkey Sand (PS) and Pamunkey Mud (PM). They are located 56.1, 62.2 km and 67.6 km from the mouth of the York.
Figure 1. Study sites are along the York River estuary, a tributary of the Chesapeake Bay and into the Pamunkey River, the southern tributary of the York River. Site locations are marked with orange triangles. Figure created in Google Earth.
NWS

VIMS Final Report for Nova Research, Inc. 4
Table 1.YR160623 - YR160920 June 23 - Sep 20, 2016 SERDP EMI/Sediment Station Log
Expected Station Hobo Cruise Station Date Time Location Sed Type Code Lattitude Longitude depth CTD Cast TSS ADCP Water Level
EST 37 deg N -76 deg W (m)YR160623 23-Jun 620 Clay Bank Mud CB 20.5176 37.5808 5.18 1
5656 648 20.5520 37.6609 1 1YR160624 24-Jun 708 Clay Bank Mud CB 20.5200 37.5780 5.19 1
5657 720 GUST Grain Size/Moisture5658 742 GUST Grain Size/Moisture5659 806 X-ray Magnetic Susp/Resistivity5660 840 X-ray Magnetic Susp/Resistivity5661 915 3
917 15662 759 20.5825 37.6662 1 2
YR160701 1-Jul 610 Gloucester Pt Mud GP 15.1800 30.6420 4.6 15663 756 GUST Magnetic Susp/Resistivity5664 GUST Magnetic Susp/Resistivity5665 826 X-ray Grain Size/Moisture5666 846 X-ray Grain Size/Moisture
1255 15.1860 30.6420 4.37 15667 1300 35668 617 15.1921 30.6347 1 1
YR160706 6-Jul 820 Pamunkey Mud PM 34.0320 51.3660 4.29 15669 825 GUST Grain Size/Moisture5670 839 GUST Grain Size/Moisture5671 852 X-ray Magnetic Susp/Resistivity5672 901 X-ray Magnetic Susp/Resistivity5673 915 35674 916 GUST
926 33.8460 51.3720 6.25 15676 850 34.1007 50.3470 1 1
YR160706_2 6-Jul 957 West Point Mud WP 32.8500 49.0620 4.16 15675 1001 3
1123 32.8200 49.0380 15677 1026 32.7771 49.0179 1 1
YR160714 14-Jul 636 Ferry Point Sand/Mud FP 22.5720 38.4780 4.12 15678 720 Grain Size/Moisture5679 728 X-ray Grain Size/Moisture5680 759 GUST X-ray5681 758 35682 807 Magnetic Susp/Resistivity
841 22.5420 38.4660 5.53 15683 636 22.5455 38.4413 2 1
YR160721 21-Jul 728 Pamunkey Sand/Mud PS 31.9740 52.6140 3.46 15684 756 GUST5685 820 GUST5686 834 Grain Size/Moisture5687 8555688 904 X-ray5689 912 Magnetic Susp/Resistivity5690 920 35691 925 X-ray
949 32.0460 52.5420 45692 941 31.9817 52.5961 2 1
YR160721_2 21-Jul 1102 Ferry Point Sand/Mud FP2 22.5780 38.5320 6.75 15693 3
YR160805 8-Aug 523 Goodwin Island Sand/Mud GI 13.7040 24.9900 4.4 15695 545 GUST Grain Size/Moisture5696 602 GUST5697 610 Magnetic Susp/Resistivity5698 615 Magnetic Susp/Resistivity5699 619 X-ray Grain Size/Moisture5700 632 35701 633 X-ray
642 13.6980 24.9900 4.485706 1 1
YR160920 5735 20-Aug 1033 Naval Weapons Mud NWS 15.4201 30.8492 5.9 1 15736 10405737 1050 1
1057 15.4149 30.8396 1
GOMEX Sub Cores
No GPS

VIMS Final Report for Nova Research, Inc. 5
There were two vessels utilized for this study. The R/V Elis Olsson, a 29 ft. Monarch, was used to deploy the TEM sensor and to collect water column velocity profiles. The R/V Heron, a 26 ft. Garvey was used to collect bottom sediment for site characterization, temperature and salinity profiles and water samples for suspended solids concentrations at 3 depths in the water column. Red entries on Table 1 indicate work done on the R/V Elis Olsson and black entries indicate work done on the R/V Heron. 3.2 TEM sensor and water column data collection The R/V Elis Olsson was anchored at each site while the TEM sensor, paired with a small pressure transducer, was profiled up and down through the water column from the stern davit (Figure 2). The TEM data are the responsibility of our collaborators. A HOBO water level sensor was mounted on the frame to record the depth of the sensors during deployment. An Acoustic Doppler Current Profiler (ADCP) was mounted at the bow to measure current speed and direction from near surface to the bottom for the time the vessel was at anchor. At several sites, a series of TEM experiments were repeated to account for site variability by letting out the anchor line to move the vessel to a different location within the site.
Figure 2. Deployment of TEM sensors on board the R/V Elis Olsson

VIMS Final Report for Nova Research, Inc. 6
On the R/V Heron, anchored within 30 meters of the R/V Elis Olsson, conductivity/temperature/depth (CTD) profiles were collected twice, once when first arriving at a location and again toward the end of the sample period. Three water column samples were collected at each location and were later analyzed back at the lab for suspended sediment concentrations (Table A2.1). One sample was collected about a meter off the bottom, a second was collected about a meter from the surface, and the third was collected at a mid-depth. 2.3.1 Water Column CTD A YSI Castaway-‐CTD was used to obtain conductivity, temperature, and depth, profiles in the water column. The Castaway software, using the 1978 Practical Salinity Scale (PSS-‐78), derives salinity. Resistivity was calculated by taking the inverse of the conductivity. Table 1 identifies which box core station the cast was taken coincident with and the maximum depth as recorded by the Castaway. The conductivity and temperature sensors of the Castaway are located in a flow-‐through channel along the back of the housing. The pressure sensor passes through the housing at the top of the battery cap. The system is hydrodynamically designed to free fall at a rate of about 1 m/s. A six-‐electrode flow-‐through conductivity cell with zero external field coupled with a rapid response thermistor attain high measurement accuracies. Salinity and temperature accuracies, according to the manufacturer, are 0.1 PSU and 0.05 oC, respectively (YSI, 2010). The Castaway samples at a rate of 5 Hz and internally converts the raw CTD data into a processed profile for each cast. Pressure is corrected for the ambient atmospheric pressure by collecting pressure data at the start and end of the cast while the system is in the air. The air pressure is subtracted from the raw pressure data to get a measure of water pressure only. Since the Castaway is designed to be a flow through system, a rate of change versus time, basically the vertical speed of the system through the water, is calculated for each sample in the data file. If the rate of change in the pressure is less than 0.025 decibars/sec the system is considered to be stationary and the associated sample is discarded. The conductivity data are de-‐spiked to remove erratic measurements near the water surface that can be caused by air bubbles in the conductivity flow cell or measurements made when the system is only partially submerged. After de-‐spiking, the software averages separately the temperature and conductivity from the down cast samples and the up cast samples into 0.3 decibar bins (YSI, 2010). Figure A1.1 (Tables A2.2A-‐D) shows the salinity and temperature water column profiles obtained at each of the station locations of bottom sediment collection. Blue and cyan lines are sites near the mouth of the York River estuary, red and magenta lines are sites from the mid-‐reaches of the estuary and green lines are from within the Pamunkey River, a tributary of the York River. Solid lines indicate locations of sandier bottom sediments and dashed lines indicate locations where the bottom sediments are mostly muddy. Figure A1.2, using the same identification system, shows the conductivity profiles and the calculated resistivity profiles. Specific

VIMS Final Report for Nova Research, Inc. 7
conductivity, i.e., conductivity adjusted to 25 oC by the software program, is also available. The lowest conductivity measured in the water column, during this sampling period, was sampled at PM (0.03 S/m) and the highest conductivity measured in the water column was at NWS (~3.8 S/m). These corresponded to salinities of 0.12 PSU at 27 oC at PM and 23.5 PSU at 25.9 oC at NWS. Stations for bottom sediment collection are normally visited ± 1 hour of slack tide, as too much current interferes with the penetration of the GOMEX box core into the seafloor. Upriver station times were originally chosen to occur within an hour before slack after ebb tide in order to sample the lowest salinities possible, and the stations times for locations at the river mouth were chosen to occur with in an hour of slack after a flood tide to obtain the highest salinities possible. 2.3.2 Water Column Velocity Profiles using ADCP At each location, while the TEM was deployed, a “burst” of data was collected with a SONTEK 1200 KHz Acoustic Doppler Current Meter mounted on the bow of the vessel. The burst was averaged for each depth to determine the average water velocity profile during the sample period (Tables 4.1-‐4.3). These tables also include burst-‐averaged direction and acoustic backscatter for each of the stations as identified in Table 1. At Ferry Point (FP), three bursts were taken on July 14th. These are differentiated by the start time of the burst. At Pamunkey Sand (PS), two bursts were collected on July 21st. These are also differentiated by the start time of the burst. Figure A1.3 (Tables A2.3A-‐C) shows the average water velocity was less than 20 cm/s throughout most of the profile for the stations downriver of Ferry Point (FP). The exception was the top 2 meters at Clay bank where the velocity increased to over 30 cm/s on the surface. At West Point (WP), upriver of FP, the velocity ranged 30-‐45 cm/s, with the depths between 2-‐3.5 meters being the highest. The highest velocities were measured in the Pamunkey, and both stations had a profile where the velocity decreased with depth. At PS the velocity ranged from 33 cm/s on the surface and decreased to 18 cm/s on the bottom. During the second burst collected at the same station, the velocity had dropped to less than 6 cm/s throughout the water column. The highest velocities measured were at Pamunkey Mud (PM) with 49 cm/s on the surface and 29 cm/s on the bottom. 3.3 Site Characterization of Bottom Sediment The R/V Heron was also used to collect sediment samples to document the bottom sediment properties. A series of seafloor sediment grab samples were collected at each site using a GOMEX box core (Figure 3). This box core, at muddy sites, will typically capture sediment to about 30 cm depth with the sediment water interface

VIMS Final Report for Nova Research, Inc. 8
preserved. At sandier sites, even with more weight added, the box core typically does not penetrate as deep into the seafloor. Each grab sample is given a unique station number and the time and the location of the vessel is recorded (Table 1). Two sub-‐cores, also identified in Table 1 and described with its associated analysis section, are typically taken from the same grab sample. The sediment from each site was analyzed back at the lab for: grain-‐size distribution, percent moisture, magnetic susceptibility, resistivity, X-‐ray analysis and Gust erodibility. At each sample location a CTD cast of the water column was also taken. The methodology and results for each parameter are reported below.
3.3.1 X-‐ray Cores At each location X-‐ray sub-‐cores were extracted from a box core sediment sample. Table 1 indicates which GOMEX grab station number they were collected from. At most locations, two X-‐ray cores were extracted from different box core samples. Often at sandy sites there are large shell or gravel pieces that do not allow the bottom of the box core to close, causing what we refer to as a “blow-‐out”. This is where all the sediment rushes out the space created by a shell, or other debris, in the jaws of the of the box core. If this occurs, we will more forward or backward on
Figure 3. Collection of bottom sediment with GOMEX box-core on board the R/V Heron

VIMS Final Report for Nova Research, Inc. 9
the anchor and try again. At some sites it may take several blow-‐outs before we are able to collect a good grab sample. The X-‐ray cores are 30 cm long X 15 cm wide X 2.5 cm deep Plexiglass rectangle cores (Figure 4). One face-‐plate is removable and the top and bottom are open. The core is inserted length-‐wise into the sediment captured by the GOMEX, leaving about 5 cm of the top of the core above the sediment water interface. The removable face-‐plate is slid down the groves designed to capture a rectangle of sediment 11 cm wide X 2.2 cm deep X as long as the core is inserted into the sediment. A piece of foam rubber is placed in the top of the core to prevent debris falling into the core during extraction. The core is sealed on the bottom with a plastic covered piece of Plexiglas, which is held into place with electrical tape. Transport allows a slow seep of water from the top of the core so the core can be laid down lengthwise for the X-‐ray back at the lab. The X-‐ray source is a MinXray HF100 high frequency diagnostic unit and the digital image is captured on a Toshiba X-‐ray flat panel. All images were shot with the X-‐ray source set at 50 kV and 0.2 mAs/sec. All X-‐ray images (Figures A1.4-‐A1.9) are the same width to allow visual comparison between them. Image processing in Matlab was used to digitally average across each image, and the known pixel/width ratio allowed for accurate depth measurements to be determined. The intensity units are arbitrary because the blackest pixel in each image is set to zero and the whitest is set to 255 before averaging. These intensity units, however, allow for a relative comparison within each image. The whiter areas (higher intensity units) are due to denser particles and darker areas (lower intensity units) are due to less dense particles. Unless there are strong visual differences between the two X-‐ray images and their associated intensity profiles,
Figure 4. X-ray core with rubber bottom piece to seal bottom of core and foam rubber to protect top of the sediment captured in core

VIMS Final Report for Nova Research, Inc. 10
only one for each station is presented here. All images taken and their associated profiles will be available in the archived data set. There are distinct patterns within the X-‐ray images for each site. The X-‐ray image from Goodwin Island (GI), station X5699 (Figure A1.4B) shows some evidence of finer sediment near the surface (top 0.5-‐1.5 cm) evidenced dark patches and by the slightly lower average intensity values (Figure A1.4A). While the intensity profile looks very homogeneous throughout the most of the core below ~1.5 cm there is some dark patches showing evidence to pockets finer sediment to about 4.5 cm. The slight increase seen at the bottom of the intensity profile shows a layer that is almost all coarser material. The X-‐ray image from Gloucester Point (GP), station X5666 (Figure A1.5B) shows fine scale laminations of coarse and fine material to about 8 cm down core. The intensity profile to that depth looks relatively well mixed, meaning there are no big pockets of finer or coarser material (Figure 1.5A). Below 8 cm, the sediment becomes coarser and contains clam shells and shell hash and the intensity profile, while higher than the top 8 cm, looks well mixed. Clay Bank, CB, stations X5660 (Figures A1.6B) X-‐ray images show approximately equal parts of finer and coarser material “swirled” together below 12 cm, possibly due to past bioturbation. Some laminations are visible above this depth and are evident in the sharp changes in the X-‐ray intensity in Figure A1.6A. Thicker laminations are evident in the Ferry Point, FP, station X5680 X-‐ray images and associated intensity unit figures than seen at Clay Bank (Figures A1.7A and B). Figures A1.8A and B show a series of layers of coarser and finer material. This indicates the Pamunkey Muddy, PM, station X5672 is a physically dominated location. There is some evidence of marine flora; however they are not active enough to mix the layers before experiencing burial. The Pamunkey Sand, PS, station X5691 (Figures A1.9 A and B) appears to have coarser grained material than that seen at PM, mixed together with fine grain material. The percentages of the constituents of coarser and finer material that create the patterns seen the above X-‐rays will be quantified in the next section. 3.3.2 Total Fixed Solids, Total Volatile Solids, Moisture and Grain-‐size At most locations two sub-‐cores, to be analyzed for total fixed solids (TFS), total volatile solids (TVS), moisture and grain size distribution, were extracted from two separate box core sediment samples and consolidated. Table 1 indicates which GOMEX grab station number they were collected from. However, at Pamunkey Sand (PS) only one sub-‐core was collected. PS had one sub-‐core collected because of the

VIMS Final Report for Nova Research, Inc. 11
difficulty experienced collecting good GOMEX grab samples. Several “blow-‐outs” were experienced at sandy sites where large shell or gravel pieces did not allow the bottom of the box core to close. At some sites it may take several blow-‐outs before we are able to collect a good grab sample. Each sub-‐core was extruded and sliced at 1-‐cm intervals (Figure 5). The corresponding interval for both cores were consolidated and stored in airtight containers for later analysis at the lab. Immediately upon return to the lab, an aliquot of each sample was weighed in a pre-‐weighed tin dish and placed into a 103-‐105 deg C oven over night. The dried sample was weighed and returned to the oven for at least one hour and reweighed. This process was repeated until two consecutive weights agreed to within 0.0005 g. The dried weight divided by the wet weight X100 gives the percent total solids (TS). The percent of the weight lost upon drying is the water content of the sediment layer, also called the percent moisture (% moisture = 100-‐TS). The TS sample was then muffled at 550 deg C for at least 1 hr, placed in a 103-‐105 deg oven to cool and weighed as above until a stable weight was found. This weight divided by the wet weight of the sample X100 gives the percent total volatile solids (TVS). This is sometimes used as proxy for percent organic matter present. Total Fixed Solids (TFS) can be found by subtracting TVS from the TS. Figures A1.10A-‐A1.15A display the percent fixed solids of the total sample at cm intervals down core. Figures A1.10B-‐A1.15B display the percent volatile solids down core and Figures A1.10C-‐A1.15C display the percent moisture down core. Grain size, as percent >850 microns, sand, silt, and clay were determined by sieve and pipette methods (Plumb 1981). An aliquot of each sample was sonicated for at least one hour, after the addition of 10 ml of a surfactant solution (51g Sodium Metaphosphate and 0.3g Sodium Bicarbonate/liter), to break up bonds between the individual particles. The sample was then wet sieved first through a 850-‐micron sieve to collect the fraction of sample including large shell, gravel, very coarse sand, and debris particles and rinsed into a small pre-‐weighted beaker. A second 63-‐micron sieve placed under the first captured the sand size fraction < 850 microns and was rinsed into a second pre-‐weighted beaker. The water that passed through the sieves, containing the silt and clay size material, was put into a graduated cylinder and diluted to 1 liter. Following Plumb (1981), two fractions of this solution were pipetted and dried in two weighed tin trays. All four fractions were then dried in a 103-‐105 deg oven until a steady weight was obtained. The percent of each fraction (>850 micron, sand, silt, and clay) was calculated by dividing the dried weight of that fraction by the total (X100). The fractions were then muffled in a 550 deg oven, cooled in the 103-‐105 oven and weighed until a steady weight was obtained. The resultant weight of each divided by the total dried weight found above (X100) provides the percent organic matter for each fraction.

VIMS Final Report for Nova Research, Inc. 12
Figure 5. Sediment core extruded and sampled at 1-cm intervals from subcores to be later analyzed at the lab for percentage of total fixed solids (TFS), total volatile solids (TVS), and grain size. Water content (percent moisture) is equal to 100-TFS. TVS is a proxy for percent organic matter Figures A1.10D-‐A1.15D display the >850 micron, Sand, Silt and Clay fractions down core. The percent organic material (ORG) associated with each fraction is displayed to the right of that fraction. The larger shell bits, gravel and debris (>850 micron) and the organic material are displayed with the two darker shades of blue. The two lighter shades of blue represent the sand size particulates and their associated organic material. The silt size particulates are represented by green and its organic material is orange. Clay size particulates are represented by red and the associated organic material is a darker shade of red. Goodwin Island (GI), stations 5696 and 5699 and Gloucester Point (GP), stations 5665 and 5666 (Figures A1.10 and A1.11, respectively) are both from the high conductivity regime at the mouth of the estuary (see Table 1). GI is distinctly the “sandier” of the two with over 80 % sand throughout most of the core. There is slightly more clay than silt in all of the layers. The top 4 cm has more silt and clay and percent moisture (28-‐31%) than the rest of the core (22-‐25% moisture). The top 2 cm also has the least amount of fixed solids (68-‐71%) as compared to the rest of the core (74-‐77%) and the most organic material, TVS, (0.8%) compared to 0.64-‐75% in the rest of the core. There is about the same amount of organic material is associated with the clay fraction as the silt fraction.

VIMS Final Report for Nova Research, Inc. 13
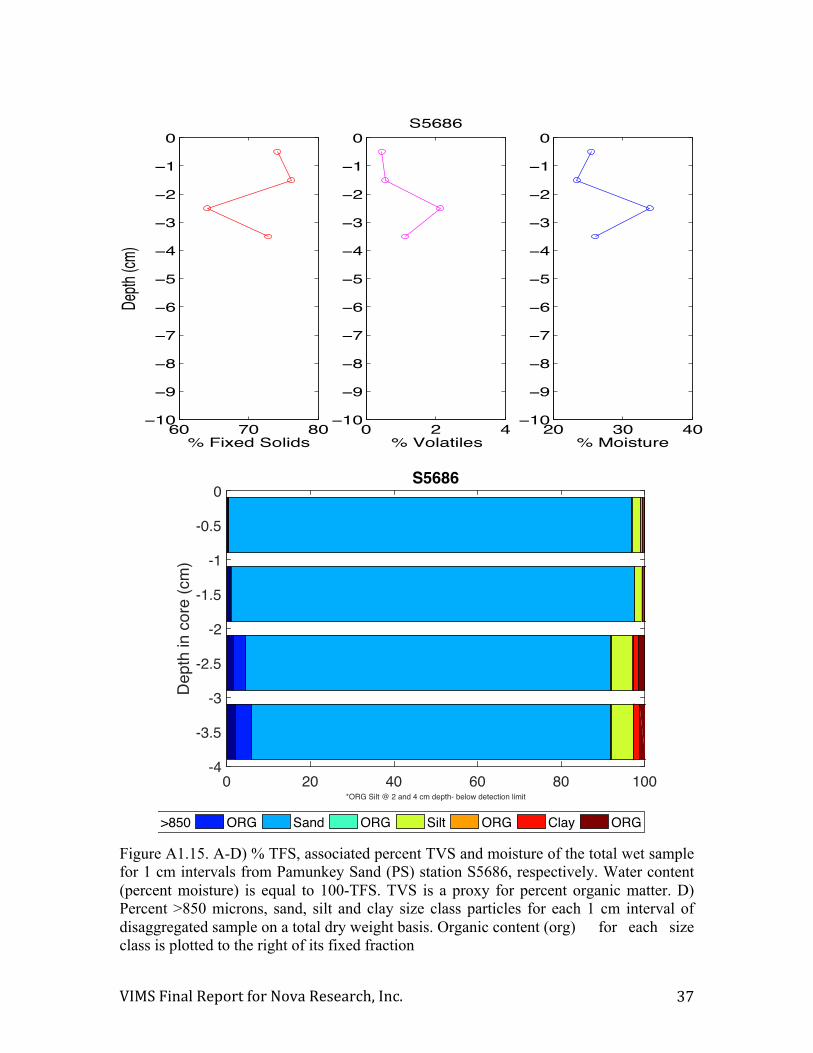
The “muddier” of these two stations is GP (Figure A1.11). The total fixed solids range from 24-‐53%, less than GI throughout the core indicating more water retained in the pore spaces of the sediment (73-‐44%). The site, however, is sandier further down core than expected for a “muddy site” (31-‐52% below 4 cm.) The percent sand increased throughout the core from surface to depth. There tends to be more silt than clay with TVS in the top 4 cm, ranging from 2.5-‐2.6% and 2.2-‐2.3% throughout the rest of the core. Claybank (CB), stations S5657 and S5658, and Ferry Point (FP), stations S5678 and S5679 (Figures A1.12 and A1.13, respectively) are from the mid-‐conductivity regime in the middle reaches of the estuary (see Table 1). CB is the “muddy site” with less than 10 percent sand throughout the core and TFS ranging from only 28 -‐38%. The TVS range from 2.4-‐2.7% with most of the organic matter associated with the clay fraction, however organic material is also associated with the silt fraction throughout the whole core. FP, the “sandier site” for this regime is composed of over 75% sand throughout the core and as much as 90% the top 4 cm. The TFS, consistent with being a sandier site, ranges from 53-‐77%. The TVS ranges from 0.7-‐1.6%, with most associated with the clay fraction. Pamunkey Sand (PS), station S5686, and Pamunkey Mud (PM), station S5669 and S5670 (Figures A1.14 and A1.15, respectively) are from the low conductivity regime in the Pamunkey river, a tributary of the York (see Table 1). PM is the “muddy site” with less than 12% sand 2-‐4 cm in the core and is dominated by the silt fraction. There is a thin sandy layer on the surface of 43% and below 4 cm the core gets sandier again (30-‐64%). The TFS profile reflects the layering of sand and mud with the lowest in the muddy region (24-‐28 %) and 35-‐50% in the sandy regions. The TVS is the highest seen at any location and ranges from 2.1-‐3.0%. Most of the organic material is associated with the clay fraction. PS, the “sandier site” for this regime is composed of over 85% sand throughout the core and as much as 96% in the 2 cm. The TFS, again consistent with being a sandier site, ranges from 64-‐76%. The TVS ranges from 0.45-‐2.1% with most associated with the larger than 850 micron size class in the bottom 2 cm. This is the only place this holds true. 3.3.3 Seafloor Erodibility using Gust Microcosm
For each station, 35-‐cm long bottom sediment sub-‐cores were obtained from the GOMEX box core (see Table 1) along with 60 liters of site water, from within a meter of the bottom, using a submersible pump. Two cores (10-‐cm inside diameter) from each site, except Ferry Point (FP) where only one was collected, were brought back to the lab for immediate erodibility analysis using an UGEMS Gust erosion

VIMS Final Report for Nova Research, Inc. 14
0 1000 2000 3000 4000 5000 6000 7000 8000 9000 100000
50
100
record number
turb
idity
(NTU
)
S5474 and S5477 prelim turbiditydespiked
0.01 PA
0.05 PA
0.1 PA
0.2 PA
0.3 PA
0.45 PA
0.6 PA
S5474 GIS5474 YT
0 1000 2000 3000 4000 5000 6000 7000 8000 9000 100000
200
400
disk
rota
tion
(RP
M)
Figure 6. (A) UGEMS dual core Gust microcosm system as arranged during an erosion experiment. (B) Example of stress applied to microcosm and associated response to eroded material recorded by the turbidimeter for GI and YT cores. (C) Close-‐up of sediment suspension in a Gust microcosm with water circulation pattern highlighted by arrows (photo by P. Dickhudt)
VIMS Final Report for Nova Research, Inc. 15
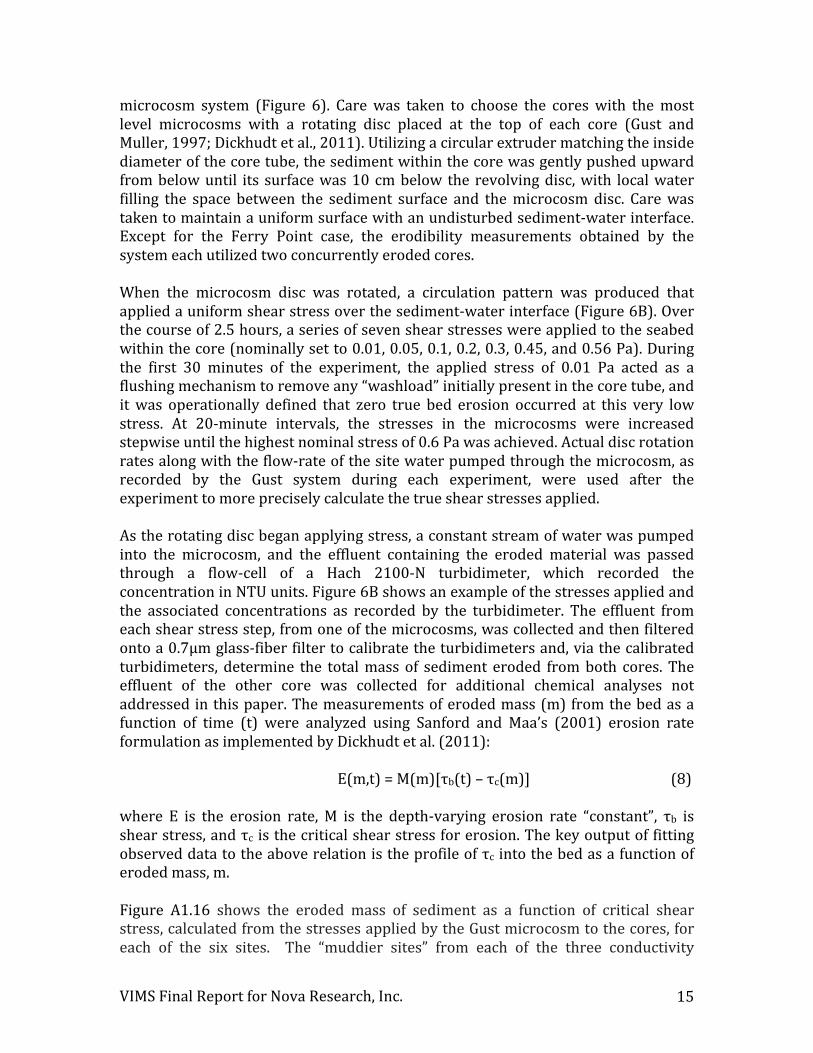
microcosm system (Figure 6). Care was taken to choose the cores with the most level microcosms with a rotating disc placed at the top of each core (Gust and Muller, 1997; Dickhudt et al., 2011). Utilizing a circular extruder matching the inside diameter of the core tube, the sediment within the core was gently pushed upward from below until its surface was 10 cm below the revolving disc, with local water filling the space between the sediment surface and the microcosm disc. Care was taken to maintain a uniform surface with an undisturbed sediment-‐water interface. Except for the Ferry Point case, the erodibility measurements obtained by the system each utilized two concurrently eroded cores.
When the microcosm disc was rotated, a circulation pattern was produced that applied a uniform shear stress over the sediment-‐water interface (Figure 6B). Over the course of 2.5 hours, a series of seven shear stresses were applied to the seabed within the core (nominally set to 0.01, 0.05, 0.1, 0.2, 0.3, 0.45, and 0.56 Pa). During the first 30 minutes of the experiment, the applied stress of 0.01 Pa acted as a flushing mechanism to remove any “washload” initially present in the core tube, and it was operationally defined that zero true bed erosion occurred at this very low stress. At 20-‐minute intervals, the stresses in the microcosms were increased stepwise until the highest nominal stress of 0.6 Pa was achieved. Actual disc rotation rates along with the flow-‐rate of the site water pumped through the microcosm, as recorded by the Gust system during each experiment, were used after the experiment to more precisely calculate the true shear stresses applied. As the rotating disc began applying stress, a constant stream of water was pumped into the microcosm, and the effluent containing the eroded material was passed through a flow-‐cell of a Hach 2100-‐N turbidimeter, which recorded the concentration in NTU units. Figure 6B shows an example of the stresses applied and the associated concentrations as recorded by the turbidimeter. The effluent from each shear stress step, from one of the microcosms, was collected and then filtered onto a 0.7µm glass-‐fiber filter to calibrate the turbidimeters and, via the calibrated turbidimeters, determine the total mass of sediment eroded from both cores. The effluent of the other core was collected for additional chemical analyses not addressed in this paper. The measurements of eroded mass (m) from the bed as a function of time (t) were analyzed using Sanford and Maa’s (2001) erosion rate formulation as implemented by Dickhudt et al. (2011): E(m,t) = M(m)[τb(t) – τc(m)] (8) where E is the erosion rate, M is the depth-‐varying erosion rate “constant”, τb is shear stress, and τc is the critical shear stress for erosion. The key output of fitting observed data to the above relation is the profile of τc into the bed as a function of eroded mass, m. Figure A1.16 shows the eroded mass of sediment as a function of critical shear stress, calculated from the stresses applied by the Gust microcosm to the cores, for each of the six sites. The “muddier sites” from each of the three conductivity

VIMS Final Report for Nova Research, Inc. 16
regimes show more erodibility than the “sandier sites” within the same conductivity regime, as expected. However, the sediment surface at the Gloucester Point (GP) is just barely more erodible. This could be due to the almost 10% sand in the fine scale laminations in the top cm. 3.3.4 Electrical Resistivity A custom resistivity meter and two resistivity probes were commissioned and obtained from Northwest Metasystems, Bainbridge Island, WA, and the standard operations procedure was developed in the previous year of this project. The electronics and probes were designed to be similar to those described in Wheatcroft (2002). Wheatcroft lent his extensive knowledge and experience in the construction of the new generation Resistivity Meter and two Wenner-style probes (Figure 8A). A resistivity probe is connected to the front of the meter via 4 banana plugs. Output from the meter (in volts), when the probe and a collocated calibrated temperature probe (Figure 8B) is placed in a water solution or sediment core, is captured with software associated with the attached Omega Data Acquisition System (OMB-DAQ-54). The meter is designed with 3 gains: “high” gain is designed for 35 ppt seawater to register a mid-range voltage. The medium and low gains were set centered around 10X and 100X dilutions from seawater, (3.5 and 0.35 ppt) respectively. The temperature probe is an Omega calibrated temperature probe (ID VT970320-042), which is accurate to ±0.17 oC within 0-40 oC. The 5-mm wide Wenner-style, resistivity probes were constructed with 1/32” glass/epoxy to provide strength in the probe without minimal disruption of the sediment when inserted into a core The probes were fashioned, after Andrews (1981), with 4 insolated wires imbedded, spaced 1 mm apart, within the glass/epoxy probe. An additional 1/16” deep glass/epoxy section was added to the top part of the probes for added stability. The imbedded wires within the probes are 36 AWG Constantan. The probe manufacturer has found Constantan wire to provide the most stable resistivity results. The manufacturer suggests cleaning the probe-tip with 600 grit sandpaper between samples to prevent any corrosion/biofilm or other contamination build-up creating erratic results. A series of salinity solutions (5, 10, 15, 20 and 25 ppt) was used to determine the K value for the Northwest Metasystems resistivity probe before analysis of the two cores from each location, except Ferry Point (FP) where only one was collected. An aliquot of each salinity solution was poured into a core tube. A YSI 6600 CTD was used to directly measure the salinity, temperature, conductivity, resistivity and total dissolved solids just prior to collecting ER readings with a resistivity probes. One minute of CTD readings (12 total) were averaged and used to determine the standard deviation of these parameters. Approximately 1 minute of raw resistivity readings, sampled at 5 Hz, was recorded for each solution using a resistivity probe with the meter set first on the high gain. The

VIMS Final Report for Nova Research, Inc. 17
collocated temperature probe was used to record temperature readings, for each solution. The mean and standard deviation was calculated for each one-minute sample of Figure 7. (A) Northwest Metasystems resistivity meter with Omega Data Acquistion System and resistivity and temperature probes (B) Northwest Metasystems resistivity probe and calibrated Omega temperature probe (blue top).

VIMS Final Report for Nova Research, Inc. 18
Figure 8. Bartington Magnetic susceptibility core logging sensor (110 mm inside diameter) and the MS3 meter module mounted on stand.

VIMS Final Report for Nova Research, Inc. 19
resistivity readings. The K coefficients are expected to be the slope and intercept of the averaged measured resistivity plotted against the known resistivity for the solutions as measured by the YSI CTD. Figure A1.17A shows the average resistivity measured as a function of depth for all sediment characterization stations except Pamunkey Mud (PM). PM was plotted separately in Figure A1.17B because of the much higher resistivity values measured at that station (See Tables A2.7A and B). Prior to collecting resistivity measurements with the Northwest probe, measurements of the water overlying the sediment in the core (temperature, conductivity, resistivity and salinity) were collected with a YSI CTD. These measurements are represented on the plots as the station marker types along the black dotted line at +3 cm. This depth is not exact, as the CTD samples were not taken as a specific depth. There is, however, a good chance that the water surface interface could have been disturbed in the sampling process, so the CTD measurements are not expected to be exactly the same as those measured with the Northwest probe. They do show agreement in terms of the order of magnitude. Resistivity in the surface water as measured by the CTD shows the order of stations from low to high resistivity to be: Goodwin Island (GI), Gloucester Point (GP), Ferry Point (FP), Claybank (CB), Pamunkey Sand (PS) and Pamunkey Mud (PM). The average resistivity measured by the CTD for the water overlying the core at each of these stations is 28.4, 30.2, 34.4, 40.1 330 and 2640 ohm-‐cm, respectively (Table A2.7C). The probe results are generally consistent with the CTD. However, the GI probe indicates somewhat high values in the water, and the FP probe suggests anomalously low values in the bed. The resistivity for PS drops more than 150 ohm-‐cm down core, possibly due to memory in the pore water of higher salinities from a previous flood tide. The Pamumkey Mud (PM) resistivities between the two cores collected at that station were different enough to cause a see-‐saw affect in the average down core. This is possibly due the two cores being collected at different locations within the sampling site and slight changes in salinity near zero makes a big difference in the resistivity results. 3.3.5 Magnetic Susceptibility A standard operating procedure (SOP) was developed for the measurement of dimensionless magnetic susceptibility (χvol) within a sediment core. A Bartington Magnetic susceptibility core logging sensor (110 mm inside diameter) and the MS3 meter module (S/N 373), which allows PC control of the sensor, was received the first week of September, 2014. A stand was fabricated in house to hold the sensor to allow for sampling at 1 cm intervals along the core (Figure 7). The program ‘Bartsoft’ was provided to collect the data. A MS2C calibration standard (S/N 772) was also received. The known value of the standard is 382 × 10-‐5 SI @ 22 OC (303 × 10-‐6 CGS @ 22 OC). Units of SI can be converted to electromagnetic CGS units using the following: χvol (SI) = χvol(CGS) × 4 π (1)

VIMS Final Report for Nova Research, Inc. 20
All sediment core data, using the MS3, were collected in raw SI units at steady 22.5 OC and corrected using the value of 0.6988 determined by the Bartsoft software to account for the difference in the sensor diameter of 110 mm and the inside diameter of the core tubes (sediment sample diameter) of 88 mm. The samples collected at each of the locations in Year 2 of this study were not analyzed according to SOP. The SOP calls for zeroing the instrument in air before EACH reading. The technician responsible for analyzing for this parameter neglected this step leading to readings MUCH higher than expected. Verification with an additional core showed that the reading should be on the order of 5 X 10-‐5 SI. The samples analyzed for the 2015 (Year 1) final report followed SOP were on the order of 5 X 10-‐5 SI and similar along the river. Therefore that figure is included in this Year 2 report for reference. Figure A1.18 shows preliminary corrected χvol of a series of sediment cores collected on September 3, 2014 from 5 sites (stations 5410, 5411, 5412, 5414 and 5415) along the York River system (see Table 1 in the January 2015 Year 1 final report). S5409 was collected at the higher salinity mouth of the estuary, and S5415 was collected in the lower salinity regime of the Pamunkey River. The other stations were from various locations spaced between the two. The sensor was zeroed in air before each reading. Distance “0” down the core is the sediment water interface. Positive numbers are height above the interface (readings in water), and negative numbers are height below the interface (readings in sediment). The dotted line shows the corrected SI readings along an empty core. The mean along 10 cm of the empty core tube is -‐0.52 x 10-‐5 SI with a standard deviation 0.10 x 10-‐5 SI. 4. ACKNOWLEDGEMENTS This work, on SERDP project MR02409 (YR2), would not have been possible without the assistance of Ph.D. student Danielle Tarpley. Her skill as captain of the vessel while collecting the samples and leadership in the lab are without compare. Many other students also participated in the efforts including: Ph.D. student Jessica Turner and REU student Cristin Wright. Additional help in the field was provided Wayne Reisner, Tim Gass, and Graham Broadwell, of the VIMS Field Operations Center.

VIMS Final Report for Nova Research, Inc. 21
5. REFERENCES Andrews, D., and Bennett, A.: 1981. Measurements of diffusivity near the sediment-‐water interface with a fine-‐scale resistivity probe. Geochimica et Cosmochimica Acta, 45(11), 2169-‐2175. Bartington. (2014). Operation Manual for Bartsoft for Windows. Received with MS3 Clesceri, L. S., Greenberg, A. E. and Eaton, A. D.: 1998, Standard Methods for the Examination of Water and Wastewater, 20th ed., American Public Health Association, Washington, D.C. Dickhudt, P. J., Friedrichs, C. T., & Sanford, L. P., 2011. Mud matrix solids fraction and bed erodibility in the York River estuary, USA, and other muddy environments. Continental Shelf Research, 31(10), S3-‐S13. Friedrichs, C.T., 2009, “York River physical oceanography and sediment transport,” In: K.A. Moore and W.G. Reay, (eds.), A Site Profile of the Chesapeake Bay National Estuarine Research Reserve, Virginia, Journal of Coastal Research Special Issue 57, pp. 17-22. Gust, G., & Müller, V. (1997). Interfacial hydrodynamics and entrainment functions of currently used erosion devices. In N. Burt, R. Parker, & J. Watts (Eds.), Cohesive sediments – Proc. 4th nearshore and estuarine cohesive sediment transport conference INTERCOH '94, Wallingford, 1994. (pp. 149–174). Chichester, UK: Wiley Hem, J. D.: 1985, Study and Interpretation of the Chemical Characteristics of Natural Water, 3rd ed., U.S. Geological Survey Water-‐Supply Paper 2254. Hyashi, M. (2004). Temperature-‐electrical conductivity relation of water for environmental monitoring and geophysical data inversion. Environmental Monitoring and Assessment 96: 119–128. Keller, G. V. and Frischknecht, F. C.: 1966, Electrical Methods in Geophysical Prospecting, Pargamon Press, Oxford. Landviser. (2013) Landmapper ERM-‐01 User manual, Theory and Case Studies. Retrieved from www.landviser.com. Matthess, G.: 1982, The Properties of Groundwater, John Wiley & Sons, New York. Millero, F. J.: 2001, The Physical Chemistry of Natural Waters, Wiley-‐Interscience, New York.

VIMS Final Report for Nova Research, Inc. 22
Plumb, R.H Jr. 1981. Procedures for Handling and Chemical Analysis of Sediment and Water Samples. Technical Report EPA/CE-‐81-‐1. Great Lakes Laboratory, State University College at Buffalo, Buffalo, NY. pp 403. Sanford, L. P. and Maa. J.P., 2001. A Unified erosion formulation for fine sediments. Marine Geology, 179 (1-‐2) pp 9-‐23. Sorensen, J. A. and Glass, G. E.: 1987, ‘Ion and temperature dependence of electrical conductance for natural waters’, Analyt. Chem. 59, 1594−1597. Wheatcroft, R.A., 2002. In situ measurements of near-‐surface porosity in shallow-‐water marine sands. IEEE Journal of Oceanic Engineering 27, 561–570. YSI (2010). CastAway-‐CTD User’s Manual-‐ July 2010, Appendix A. Principles of Operation. www.sontek.com

VIMS Final Report for Nova Research, Inc. 23
0 5 10 15 20 25−7
−6
−5
−4
−3
−2
−1
0
Salinity (PSU)
Dep
th (
m)
25 25.5 26 26.5 27 27.5 28 28.5 29 29.5 30−7
−6
−5
−4
−3
−2
−1
0
Temp (deg C)
Dep
th (
m)
GIGPNWSCBFPFP2WPPSPM
Appendix 1 - Data Figures and Tables Appendix 1 includes the data tables for all of the parameters collected this summer other than the HOBO water level results. The water level results are tied directly with the TEM deployments so were provided directly to our collaborator separately and are not included here. Figure A1.1. In situ salinity and temperature water column profiles obtained at station locations identified in Table 1. Blue and cyan lines are sites near the mouth of the York River Estuary, red and magenta lines are sites from the mid-reaches of the river and green and black lines are from within the Pamunkey River, a tributary of the York River. Solid lines indicate locations of sandier bottom sediments and dashed lines indicate locations where the bottom sediments are mostly muddy.

VIMS Final Report for Nova Research, Inc. 24
0 0.5 1 1.5 2 2.5 3 3.5 4−7
−6
−5
−4
−3
−2
−1
0
Conductivity (S/m)
Dep
th (
m)
0 5 10 15 20 25 30 35−7
−6
−5
−4
−3
−2
−1
0
Calculated Resistivity (Ohm.m)
Dep
th (
m)
GIGPNWSCBFPFP2WPPSPM
Figure A1.2. In situ conductivity and calculated resistivity water column profiles obtained at station locations coincident of bottom sediment collection. Blue and cyan lines are sites near the mouth of the York River Estuary, red and magenta lines are sites from the mid-reaches of the river and green and black lines are from within the Pamunkey River, a tributary of the York River. Solid lines indicate locations of sandier bottom sediments and dashed lines indicate locations where the bottom sediments are mostly muddy.

VIMS Final Report for Nova Research, Inc. 25
0 5 10 15 20 25 30 35 40 45 50−5
−4.5
−4
−3.5
−3
−2.5
−2
−1.5
−1
water velocity (cm/s)
Dep
th (m
)
GIGPCBFP 0636FP 0704FP 0726WPPS 0811PS 0941PM
Figure A1.3. Burst average water velocity profiles obtained at station locations identified in Table 1. Blue and cyan lines are sites near the mouth of the York River Estuary, red and magenta lines are sites from the mid-reaches of the river and green and black lines are from within the Pamunkey River, a tributary of the York River. Solid lines indicate locations of sandier bottom sediments and dashed lines indicate locations where the bottom sediments are mostly muddy. FP and PS were sampled multiple times on the same day as indicated by the times in the legend. FP had 3 bursts on the same day, differentiated by time (a dotted line was used instead of a solid line for FP 0726am to keep the color consistent)

VIMS Final Report for Nova Research, Inc. 26
Intensity Units0 50 100 150 200 250
Sed
imen
t Dep
th (
cm)
-9
-8
-7
-6
-5
-4
-3
-2
-1
0X5699
Intensity Units0 50 100 150 200 250
Sedim
ent D
epth (cm
)
-20
-15
-10
-5
0X5666
Figure A1.4. X-ray image and depth averaged intensity of sediment core from Goodwin Island (GI) location (core X5699)

VIMS Final Report for Nova Research, Inc. 27
Intensity Units0 50 100 150 200 250
Se
dim
en
t D
ep
th
(cm
)
-20
-15
-10
-5
0X5666
Figure A1.5. X-ray image and depth averaged intensity of sediment core from Gloucester Point (GP) location (core X5666)
Sediment Depth (cm)

VIMS Final Report for Nova Research, Inc. 28
Intensity Units0 50 100 150 200 250
Sedim
ent D
epth (cm
)
-20
-18
-16
-14
-12
-10
-8
-6
-4
-2
0X5660
Figure A1.6. X-ray image and depth averaged intensity of sediment core from Clay Bank (CB) location (core X5660)
Sediment Depth (cm)

VIMS Final Report for Nova Research, Inc. 29
Intensity Units0 50 100 150 200 250
Sedim
ent D
epth
(cm
)
-20
-15
-10
-5
0X5680
Intensity Units0 50 100 150 200 250
Sedim
ent D
epth (cm
)
-20
-15
-10
-5
0X5666
Sediment Depth (cm)
Figure A1.7. X-ray image and depth averaged intensity of sediment core from Ferry Point (FP) location (core X5680)

VIMS Final Report for Nova Research, Inc. 30
Intensity Units0 50 100 150 200 250
Se
dim
en
t D
ep
th
(cm
)
-20
-15
-10
-5
0X5672
Sediment Depth (cm)
Figure A1.8. X-ray image and depth averaged intensity of sediment core from Pamunkey Mud (PM) location (core X5672). Cracks at surface were due to drying of the core before X-ray could be taken.

VIMS Final Report for Nova Research, Inc. 31
Intensity Units0 50 100 150 200 250
Se
dim
en
t D
ep
th (
cm
)
-20
-15
-10
-5
0X5691
Intensity Units0 50 100 150 200 250
Sedim
ent D
epth (cm
)
-20
-15
-10
-5
0X5666
Sediment Depth (cm)
Figure A1.9. X-ray image and depth averaged intensity of sediment core from Pamunkey Sand (PS) location (core X5691)

VIMS Final Report for Nova Research, Inc. 32
60 70 80−10
−9
−8
−7
−6
−5
−4
−3
−2
−1
0De
pth (c
m)
% Fixed Solids0.7 0.8 0.9
−10
−9
−8
−7
−6
−5
−4
−3
−2
−1
0
% Volatiles
S5696
20 30 40−10
−9
−8
−7
−6
−5
−4
−3
−2
−1
0
% Moisture
Figure A1.10. A-D) % TFS, associated percent TVS and moisture of the total wet sample for 1 cm intervals from Goodwin Island (GI) station S5696, respectively. Water content (percent moisture) is equal to 100-TFS. TVS is a proxy for percent organic matter. D) Percent >850 microns, sand, silt and clay size class particles for each 1 cm interval of disaggregated sample on a total dry weight basis. Organic content (org) for each size class is plotted to the right of its fixed fraction

VIMS Final Report for Nova Research, Inc. 33
0 20 40 60 80 100
Dep
th in
cor
e (c
m)
-10
-8
-6
-4
-2
0S5665
>850 ORG Sand ORG Silt ORG Clay ORG
20 40 60−10
−9
−8
−7
−6
−5
−4
−3
−2
−1
0De
pth (c
m)
% Fixed Solids2 2.5 3
−10
−9
−8
−7
−6
−5
−4
−3
−2
−1
0
% Volatiles
S5665
40 60 80−10
−9
−8
−7
−6
−5
−4
−3
−2
−1
0
% Moisture
Figure A1.11. A-D) % TFS, associated percent TVS and moisture of the total wet sample for 1 cm intervals from Gloucester Point (GP) station S5665, respectively. Water content (percent moisture) is equal to 100-TFS. TVS is a proxy for percent organic matter. D) Percent >850 microns, sand, silt and clay size class particles for each 1 cm interval of disaggregated sample on a total dry weight basis. Organic content (org) for each size class is plotted to the right of its fixed fraction

VIMS Final Report for Nova Research, Inc. 34
0 20 40 60 80 100
Dep
th in
cor
e (c
m)
-10
-8
-6
-4
-2
0S5657
>850 ORG Sand ORG Silt ORG Clay ORG
20 30 40−10
−9
−8
−7
−6
−5
−4
−3
−2
−1
0De
pth (c
m)
% Fixed Solids2.6 2.8
−10
−9
−8
−7
−6
−5
−4
−3
−2
−1
0
% Volatiles
S5657
50 60 70−10
−9
−8
−7
−6
−5
−4
−3
−2
−1
0
% Moisture
Figure A1.12. A-D) % TFS, associated percent TVS and moisture of the total wet sample for 1 cm intervals from Clay Bank (CB) station S5657, respectively. Water content (percent moisture) is equal to 100-TFS. TVS is a proxy for percent organic matter. D) Percent >850 microns, sand, silt and clay size class particles for each 1 cm interval of disaggregated sample on a total dry weight basis. Organic content (org) for each size class is plotted to the right of its fixed fraction

VIMS Final Report for Nova Research, Inc. 35
ORG Silt @ 5 and 8 cm depth- under detection limit, ORG >850 @ 6 cm depth- under detection limit0 20 40 60 80 100
Dep
th in
cor
e (c
m)
-8
-7
-6
-5
-4
-3
-2
-1
0S5678
>850 ORG Sand ORG Silt ORG Clay ORG
40 60 80−10
−9
−8
−7
−6
−5
−4
−3
−2
−1
0De
pth (c
m)
% Fixed Solids0 1 2
−10
−9
−8
−7
−6
−5
−4
−3
−2
−1
0
% Volatiles
S5678
20 40 60−10
−9
−8
−7
−6
−5
−4
−3
−2
−1
0
% Moisture
Figure A1.13. A-D) % TFS, associated percent TVS and moisture of the total wet sample for 1 cm intervals from Ferry Point (FP) station S5678, respectively. Water content (percent moisture) is equal to 100-TFS. TVS is a proxy for percent organic matter. D) Percent >850 microns, sand, silt and clay size class particles for each 1 cm interval of disaggregated sample on a total dry weight basis. Organic content (org) for each size class is plotted to the right of its fixed fraction

VIMS Final Report for Nova Research, Inc. 36
0 20 40 60 80 100
Dep
th in
cor
e (c
m)
-10
-8
-6
-4
-2
0S5669
>850 ORG Sand ORG Silt ORG Clay ORG
20 40 60−10
−9
−8
−7
−6
−5
−4
−3
−2
−1
0De
pth (c
m)
% Fixed Solids2 2.5 3
−10
−9
−8
−7
−6
−5
−4
−3
−2
−1
0
% Volatiles
S5669
40 60 80−10
−9
−8
−7
−6
−5
−4
−3
−2
−1
0
% Moisture
Figure A1.14. A-D) % TFS, associated percent TVS and moisture of the total wet sample for 1 cm intervals from Pamunkey Mud (PM) station S5696, respectively. Water content (percent moisture) is equal to 100-TFS. TVS is a proxy for percent organic matter. D) Percent >850 microns, sand, silt and clay size class particles for each 1 cm interval of disaggregated sample on a total dry weight basis. Organic content (org) for each size class is plotted to the right of its fixed fraction
VIMS Final Report for Nova Research, Inc. 37
*ORG Silt @ 2 and 4 cm depth- below detection limit0 20 40 60 80 100
Dep
th in
cor
e (c
m)
-4
-3.5
-3
-2.5
-2
-1.5
-1
-0.5
0S5686
>850 ORG Sand ORG Silt ORG Clay ORG
60 70 80−10
−9
−8
−7
−6
−5
−4
−3
−2
−1
0De
pth (c
m)
% Fixed Solids0 2 4
−10
−9
−8
−7
−6
−5
−4
−3
−2
−1
0
% Volatiles
S5686
20 30 40−10
−9
−8
−7
−6
−5
−4
−3
−2
−1
0
% Moisture
Figure A1.15. A-D) % TFS, associated percent TVS and moisture of the total wet sample for 1 cm intervals from Pamunkey Sand (PS) station S5686, respectively. Water content (percent moisture) is equal to 100-TFS. TVS is a proxy for percent organic matter. D) Percent >850 microns, sand, silt and clay size class particles for each 1 cm interval of disaggregated sample on a total dry weight basis. Organic content (org) for each size class is plotted to the right of its fixed fraction

VIMS Final Report for Nova Research, Inc. 38
0.1 0.2 0.3 0.4 0.5
−0.2
0
0.2
0.4
0.6
0.8
1
1.2
1.4
1.6
Taucr (Pa)
Erod
ed M
ass
(Kg/
m2 )
CB ACB BGP AGP BPM APM BFP AGI AGI BPS APS B
Figure A1.16. The eroded mass of sediment as a function of critical shear stress, calculated from the stresses applied by the Gust microcosm to the cores, for each of the six sites

VIMS Final Report for Nova Research, Inc. 39
0 50 100 150 200 250 300 350−14
−12
−10
−8
−6
−4
−2
0
2
4
Resistivity (Ohm−cm)
Depth
(cm)
GIGPCBFPPS
0 500 1000 1500 2000 2500 3000 3500−14
−12
−10
−8
−6
−4
−2
0
2
4
Resistivity (Ohm−cm)
Depth
(cm)
PM
Figure A1.17. A) Average resistivity as a function of depth for all sediment characterization stations except PM. The Northwest resistivity probe was calibrated with a series for salinity solutions against measurements taken directly with a YSI 6600 CTD. Zero is the sediment water interface. Positive numbers are height above the interface (readings in water) and negative numbers are height below the interface (readings in sediment). Markers at 3 cm depth, along black dotted line, indicate resistivity of water overlying sediment in core, taken with YSI6600 CTD. B) Average resistivity as a function of depth for sediment characterization station PM

VIMS Final Report for Nova Research, Inc. 40
−15 −10 −5 0 5 10 15−12
−10
−8
−6
−4
−2
0
2
4
6
Magnetic Susceptibility (SI X 10−5)
dist
ance
dow
n co
re (c
m)
GIYTCBFPPSPM
Figure A1.18. Average and standard deviation of magnetic susceptibility as a function of depth for all six sites. Sensor zeroed in air before each reading. Distance “0” down the core is the sediment water interface. Positive numbers are height above the interface (readings in water) and negative numbers are height below the interface (readings in sediment). Magnetic susceptibility of an empty core is indicated with a dotted line. (This figure is Figure 43 from Year l Final Report of this project published in January 2015 as the SOP was not adhered to for samples collected in 2016 – the sensor was not zeroed in air before each reading so the results were unreliable.)

VIMS Final Report for Nova Research, Inc. 41
Table 2.
Suspended Particulate Matter (SPM) Concentrations
Cruise Desc. Station Water Sample Sample
Code depth depth ID TSPM<60 FSPM<60 VSPM<60 TSPM>60 FSPM>60 VSPM>60 TSPM FSPM VSPM
m m mg/L mg/L mg/L mg/L mg/L mg/L mg/L mg/L mg/L
(from Castaway (Approx
CTD) marked line)
YR160624 Clay Bank Mud CB 5.18 1 5657T 38.50 24.00 14.50 *** *** *** 38.50 24.00 14.50
2 5657M 44.50 28.50 16.00 *** *** *** 44.50 28.50 16.00
4 5657B 59.50 41.00 18.50 *** *** *** 59.50 41.00 18.50
YR160701 Gloucester Pt Mud GP 4.60 1 5667T 19.17 15.33 3.83 0.00 0.00 0.00 19.17 15.33 3.83
2 5667M 24.17 20.17 4.00 0.00 0.00 0.00 24.17 20.17 4.00
3.5 5667B 55.00 45.25 9.75 0.00 0.00 0.00 55.00 45.25 9.75
YR160706 Pamunkey Mud PM 4.30 1 S5673T 26.32 18.16 8.16 *** *** *** 26.32 18.16 8.16
2 S5673M 32.67 21.00 11.67 *** *** *** 32.67 21.00 11.67
3.5 S5673B 41.33 30.00 11.33 *** *** *** 41.33 30.00 11.33
YR160706_2 West Point Mud WP 4.16 1 S5675T 28.95 20.26 8.68 *** *** *** 28.95 20.26 8.68
2 S5675M 31.39 21.67 9.72 *** *** *** 31.39 21.67 9.72
3.5 S5675B 77.63 61.58 16.05 *** *** *** 77.63 61.58 16.05
YR160714 Ferry Point Sand/Mud FP 4.10 1 S5681T 18.00 11.83 6.17 *** *** *** 18.00 18.00 6.17
2 S5681M 13.33 9.50 3.83 0.27 0.18 0.09 13.61 9.68 3.92
3.5 S5681B 27.33 21.33 6.00 0.20 0.20 *** 27.53 21.53 6.00
YR160721 Pamunkey Sand/Mud PS 3.50 1 S5690T 19.50 15.75 3.75 *** *** *** 19.50 15.75 3.75
2.5 S5690M 17.75 13.75 4.00 *** *** *** 17.75 13.75 4.00
3 S5690B 56.75 47.00 9.75 0.58 0.38 0.19 57.33 47.38 9.94
YR160805 Goodwin Island Sand/Mud GI 4.40 1 S5700T 11.00 7.75 3.25 *** *** *** 11.00 7.75 3.25
2 S5700M 11.25 8.25 3.00 *** *** *** 11.25 8.25 3.00
4 S5700B 12.38 8.75 3.63 *** *** *** 12.38 8.75 3.63
YR160920 Naval Weapons Mud NWS 5.90 0.1 S5737 12.17 9.50 2.67 *** *** *** 12.17 9.50 2.67
** Below Detection Limit
Suspended Particulate Matter (SPM) >0.7 microns
Appendix 2 – Data Tables
Table A2.1

VIMS Final Report for Nova Research, Inc. 42
Table 3.1
Temperature, Conductivity and Salinity profiles (from Castaway CTD)
Depth Temperature Conductivity Salinity Depth Temperature Conductivity Salinity Depth Temperature Conductivity Salinity Depth Temperature Conductivity Salinity Depth Temperature Conductivity Salinity
(m) (deg C) (μS/cm) (PSU) (m) (deg C) (μS/cm) (PSU) (m) (deg C) (μS/cm) (PSU) (m) (deg C) (μS/cm) (PSU) (m) (deg C) (μS/cm) (PSU)
0.15 25.43 24414.41 14.68 0.15 25.20 24506.49 14.81 0.15 25.35 24398.26 14.69 0.15 25.81 30525.02 18.60 0.15 26.13 30944.50 18.75
0.46 25.43 24417.25 14.68 0.46 25.19 24616.79 14.89 0.46 25.32 24406.51 14.70 0.45 25.78 30564.75 18.63 0.45 26.10 30965.77 18.77
0.76 25.40 24541.21 14.77 0.76 25.16 24640.21 14.91 0.76 25.31 24423.64 14.72 0.76 25.79 30682.95 18.71 0.76 26.08 31025.75 18.82
1.06 25.37 24719.64 14.89 1.06 25.14 24663.48 14.93 1.06 25.28 24458.27 14.75 1.06 25.82 30761.74 18.75 1.06 26.05 31116.15 18.89
1.37 25.36 24918.34 15.03 1.37 25.11 24741.11 14.99 1.37 25.22 24606.67 14.87 1.36 25.86 30945.40 18.86 1.36 26.03 31207.96 18.96
1.67 25.37 24978.79 15.07 1.67 25.09 24850.62 15.07 1.67 25.21 24674.09 14.92 1.67 25.86 31136.37 18.98 1.67 25.99 31422.28 19.13
1.97 25.37 25139.15 15.17 1.97 25.08 24912.44 15.12 1.97 25.19 24748.18 14.97 1.97 25.86 31438.06 19.19 1.97 25.93 31660.03 19.31
2.28 25.37 25169.82 15.19 2.28 25.08 24989.23 15.17 2.28 25.16 24871.42 15.06 2.27 25.83 31642.28 19.34 2.27 25.90 31805.72 19.42
2.58 25.37 25251.32 15.25 2.58 25.09 25080.70 15.23 2.58 25.14 25012.61 15.17 2.57 25.75 31802.75 19.48 2.57 25.84 31881.04 19.49
2.88 25.37 25311.44 15.29 2.89 25.10 25132.83 15.26 2.88 25.09 25365.36 15.41 2.88 25.67 32097.03 19.71 2.88 25.82 31911.00 19.52
3.19 25.37 25391.50 15.34 3.19 25.10 25179.86 15.29 3.19 25.06 25536.65 15.54 3.18 25.57 32452.10 20.00 3.18 25.82 31913.83 19.53
3.49 25.36 25456.85 15.38 3.49 25.11 25198.32 15.30 3.49 25.05 25547.31 15.55 3.48 25.51 32480.71 20.04 3.48 25.80 31930.90 19.54
3.80 25.36 25503.63 15.42 3.80 25.12 25211.22 15.30 3.80 25.05 25550.14 15.55 3.78 25.48 32539.99 20.10 3.78 25.79 31951.16 19.57
4.10 25.35 25542.33 15.44 4.10 25.11 25230.12 15.32 4.10 25.05 25580.56 15.57 4.09 25.46 32747.20 20.25 4.09 25.76 31966.91 19.59
4.40 25.35 25544.16 15.45 4.40 25.11 25229.87 15.32 4.40 25.05 25603.24 15.59 4.39 25.42 32887.29 20.36 4.37 25.77 31960.30 19.58
4.71 25.35 25547.31 15.45 4.71 25.09 25235.35 15.33 4.71 25.03 25630.49 15.61 4.56 25.43 32911.47 20.37
5.01 25.34 25638.34 15.51 5.15 25.11 25252.40 15.33 5.01 25.02 25774.38 15.71
5.18 25.34 25638.18 15.51 5.37 25.02 25857.68 15.77
4.56
YR160701/ 0854
Gloucester Pt Mud
GP_160701_0854
4.36
YR160624 / 0918
Clay Bank Mud
YR160701/ 0659
Gloucester Pt Mud
GP_160701_0659CB_160624_0918
YR160624 / 0708
Clay Bank Mud
CB_160624_0708
5.15
Cruise / Time (EST) YR160623 / 0620
Desc. Clay Bank Mud
5.37
Station Code CB_160623_0620
Water depth (m) 5.18
Table A2.2A

VIMS Final Report for Nova Research, Inc. 43
Table 3.2
Temperature, Conductivity and Salinity profiles (from Castaway CTD)
Depth Temperature Conductivity Salinity Depth Temperature Conductivity Salinity Depth Temperature Conductivity Salinity Depth Temperature Conductivity Salinity Depth Temperature Conductivity Salinity
(m) (deg C) (μS/cm) (PSU) (m) (deg C) (μS/cm) (PSU) (m) (deg C) (μS/cm) (PSU) (m) (deg C) (μS/cm) (PSU) (m) (deg C) (μS/cm) (PSU)
0.15 27.23 266.65 0.12 0.15 27.23 1226.86 0.58 0.15 27.89 4975.33 2.51 0.15 28.90 24408.87 13.63 0.15 29.33 24163.29 13.36
0.46 27.09 269.44 0.13 0.46 27.00 1222.81 0.58 0.46 27.67 4969.96 2.52 0.46 28.89 25144.73 14.08 0.46 29.21 24466.43 13.58
0.77 27.06 270.21 0.13 0.77 26.98 1251.31 0.60 0.77 27.22 4938.59 2.52 0.76 28.85 25700.47 14.44 0.76 29.11 24799.83 13.81
1.08 27.05 270.88 0.13 1.07 26.94 1359.39 0.65 1.07 27.05 5025.80 2.58 1.06 28.82 25992.14 14.63 1.07 29.07 25285.16 14.12
1.38 27.04 270.35 0.13 1.38 26.93 1423.28 0.68 1.38 27.06 5156.57 2.65 1.37 28.79 26301.86 14.83 1.37 28.98 25806.07 14.46
1.69 27.05 270.14 0.13 1.69 26.93 1454.25 0.70 1.69 27.04 5373.09 2.77 1.67 28.72 26677.43 15.08 1.67 28.88 26217.66 14.75
2.00 27.05 269.86 0.13 2.00 26.93 1490.04 0.72 1.99 27.02 5431.27 2.80 1.98 28.65 27261.19 15.46 1.98 28.80 26650.17 15.04
2.30 27.05 270.65 0.13 2.30 26.92 1527.31 0.74 2.30 27.00 5654.42 2.93 2.28 28.62 27410.75 15.57 2.28 28.69 27194.79 15.41
2.61 27.05 273.83 0.13 2.61 26.92 1564.89 0.76 2.61 26.98 5880.86 3.05 2.58 28.58 27626.71 15.71 2.58 28.54 27729.52 15.79
2.92 27.04 275.27 0.13 2.92 26.92 1599.23 0.77 2.91 26.96 5982.19 3.11 2.89 28.56 27717.27 15.78 2.89 28.41 28226.15 16.15
3.23 27.04 274.88 0.13 3.22 26.92 1626.85 0.79 3.22 26.96 6036.33 3.14 3.19 28.52 27918.70 15.92 3.19 28.26 28732.83 16.51
3.53 27.04 274.81 0.13 3.53 26.92 1658.43 0.80 3.53 26.94 6053.77 3.15 3.50 28.50 28017.46 15.98 3.50 28.14 29395.32 16.98
3.84 27.04 274.85 0.13 3.84 26.92 1758.37 0.85 3.83 26.94 6068.33 3.16 3.80 28.46 28128.42 16.07 3.80 27.98 29973.81 17.40
4.15 27.04 274.93 0.13 4.15 26.92 1838.31 0.89 4.16 26.93 6064.61 3.16 4.11 28.45 28210.52 16.12 4.10 27.80 30226.99 17.63
4.45 27.04 274.93 0.13 4.45 26.92 1894.84 0.92 4.41 27.73 30407.38 17.77
4.76 27.03 276.07 0.13 4.71 27.68 30586.09 17.91
5.07 27.03 276.45 0.13 5.01 27.63 30673.17 17.98
5.38 27.03 277.08 0.13 5.32 27.58 30716.01 18.03
5.68 27.03 277.26 0.13 5.52 27.58 30701.94 18.02
5.99 27.03 277.43 0.13
6.25 27.03 274.98 0.13
YR160714 / 0841
Ferry Point Sand/Mud
FP_160714_0841
5.52
Cruise
Desc.
Station Code
Water depth (m)
YR160706_2 / 1023
West Point Mud
WP_160706_1023
4.16
YR160714 / 0636
Ferry Point Sand/Mud
FP_160714_0636
4.11
YR160706 / 0926
Pamunkey Mud
PM_160706_0926
6.25
YR160706 / 0941
Pamunkey Mud
PM_160706_0941
4.45
Table A2.2B

VIMS Final Report for Nova Research, Inc. 44
Table 3.3
Temperature, Conductivity and Salinity profiles (from Castaway CTD)
Depth Temperature Conductivity Salinity Depth Temperature Conductivity Salinity Depth Temperature Conductivity Salinity Depth Temperature Conductivity Salinity Depth Temperature Conductivity Salinity
(m) (deg C) (μS/cm) (PSU) (m) (deg C) (μS/cm) (PSU) (m) (deg C) (μS/cm) (PSU) (m) (deg C) (μS/cm) (PSU) (m) (deg C) (μS/cm) (PSU)
0.15 29.84 5174.06 2.51 0.15 30.46 3189.81 1.49 0.15 29.01 31454.08 17.96 0.15 27.63 37323.57 22.33 0.15 28.07 37328.30 22.13
0.46 29.81 5219.33 2.54 0.46 30.27 3146.21 1.47 0.45 28.93 31446.11 17.98 0.45 27.64 37317.68 22.32 0.45 28.07 37330.32 22.13
0.77 29.81 5211.57 2.53 0.77 30.18 3120.98 1.46 0.76 28.89 31456.66 18.01 0.76 27.64 37312.65 22.32 0.76 28.07 37327.22 22.12
1.07 29.81 5246.96 2.55 1.08 30.09 3076.89 1.44 1.06 28.77 31496.45 18.08 1.06 27.64 37323.72 22.32 1.06 28.07 37329.11 22.13
1.38 29.80 5326.97 2.59 1.38 30.04 3036.41 1.42 1.36 28.67 31548.10 18.15 1.36 27.64 37334.95 22.33 1.36 28.06 37333.73 22.13
1.69 29.79 5397.76 2.63 1.69 30.01 3001.58 1.41 1.67 28.62 31617.94 18.21 1.66 27.63 37332.28 22.33 1.66 28.05 37331.84 22.14
1.99 29.79 5461.38 2.66 2.00 29.99 3002.51 1.41 1.97 28.43 31895.94 18.46 1.96 27.63 37334.80 22.34 1.96 28.04 37322.59 22.14
2.30 29.79 5534.97 2.70 2.30 30.00 3004.95 1.41 2.27 28.26 32142.02 18.68 2.27 27.62 37331.17 22.34 2.27 28.04 37338.31 22.15
2.61 29.79 5591.50 2.73 2.61 30.00 3013.32 1.41 2.58 28.19 32246.39 18.78 2.57 27.62 37318.70 22.33 2.57 28.04 37345.37 22.15
2.92 29.80 5620.67 2.75 2.92 30.00 3024.85 1.42 2.88 28.13 32303.03 18.84 2.87 27.62 37322.53 22.33 2.87 28.03 37358.31 22.16
3.22 29.80 5662.27 2.77 3.23 30.01 3027.02 1.42 3.18 28.10 32329.31 18.87 3.17 27.62 37326.52 22.34 3.17 28.03 37337.22 22.15
3.53 29.80 5689.24 2.78 3.53 30.00 3026.19 1.42 3.49 28.10 32329.03 18.87 3.48 27.62 37354.09 22.35 3.48 28.04 37355.30 22.16
3.84 29.80 5704.09 2.79 3.84 30.00 3025.90 1.42 3.79 28.09 32346.69 18.88 3.78 27.62 37125.94 22.20 3.78 28.03 37366.75 22.17
4.14 29.81 5770.10 2.82 4.00 30.01 3023.99 1.42 4.09 28.07 32391.98 18.92 4.08 27.62 37187.21 22.24 4.08 28.03 37356.17 22.16
4.45 29.81 5783.81 2.83 4.40 28.05 32535.89 19.02 4.34 27.62 37382.55 22.37 4.48 28.02 37353.42 22.16
4.76 29.81 5807.28 2.84 4.70 28.03 32592.97 19.06
5.06 29.81 5819.71 2.85 5.00 28.01 32652.77 19.11
5.37 29.81 5866.89 2.87 5.30 28.00 32702.21 19.14
5.70 29.81 5880.44 2.88 5.61 27.99 32804.31 19.22
5.91 27.99 32817.71 19.23
6.21 27.99 32824.17 19.23
6.52 27.97 32789.76 19.21
6.75 27.98 32725.02 19.17
YR160805 / 0642
Desc. Pamunkey Sand/Mud Pamunkey Sand/Mud Ferry Point Sand/Mud Goodwin Island Sand/Mud Goodwin Island Sand/Mud
Cruise YR160721 / 0728 YR160721 / 0949 YR160721_2 / 1102 YR160805 / 0523
GI_YR160805_0642
Water depth (m) 5.70 4.00 6.75 4.34 4.48
Station Code PM_YR160721_0728 PM_YR160721_0949 FP_YR160721_1102 GI_YR160805_0523
Table A2.2C

VIMS Final Report for Nova Research, Inc. 45
Table 3.4
Temperature, Conductivity and Salinity profiles (from Castaway CTD)
Depth Temperature Conductivity Salinity Depth Temperature Conductivity Salinity
(m) (deg C) (μS/cm) (PSU) (m) (deg C) (μS/cm) (PSU)
0.15 25.55 37282.32 23.32 0.15 25.67 37403.34 23.35
0.45 25.54 37283.19 23.33 0.45 25.66 37379.02 23.33
0.75 25.54 37291.92 23.33 0.75 25.67 37390.95 23.34
1.06 25.56 37295.78 23.33 1.06 25.68 37424.60 23.35
1.36 25.61 37379.02 23.36 1.36 25.69 37443.21 23.36
1.66 25.66 37471.03 23.39 1.66 25.70 37457.45 23.37
1.96 25.69 37521.60 23.41 1.96 25.70 37456.33 23.37
2.26 25.73 37594.30 23.44 2.26 25.69 37441.29 23.36
2.57 25.75 37632.94 23.46 2.57 25.70 37451.02 23.36
2.87 25.77 37653.98 23.47 2.87 25.70 37457.88 23.37
3.17 25.80 37714.02 23.49 3.17 25.70 37456.34 23.36
3.47 25.83 37784.83 23.52 3.47 25.73 37494.38 23.38
3.77 25.86 37822.02 23.54 3.77 25.75 37544.66 23.40
4.07 25.88 37836.51 23.54 4.07 25.77 37581.14 23.41
4.38 25.88 37847.63 23.54 4.38 25.81 37637.50 23.44
4.68 25.89 37852.96 23.54 4.68 25.82 37654.66 23.44
4.98 25.89 37852.21 23.54 4.98 25.83 37680.25 23.45
5.28 25.89 37851.81 23.54 5.28 25.84 37704.47 23.46
5.58 25.89 37846.16 23.54 5.58 25.84 37703.29 23.46
5.92 25.89 37859.71 23.55 5.96 25.85 37709.56 23.46
Water depth (m) 5.92
YR160920 / 0657
Naval Weapons Station Mud
NWS_YR160920_0657
5.96
Cruise YR160920 / 0633
Desc. Naval Weapons Station Mud
Station Code NWS_YR160920_0633
Table A2.2D

VIMS Final Report for Nova Research, Inc. 46
Table 4.1 intensity scale factor = 0.43 dB/count
Burst Averaged ADCP Water Column Speed, Direction and Acoustic Backscatter
Depth Speed Direction backscatter Depth Speed Direction backscatter Depth Speed Direction backscatter Depth Speed Direction backscatter
(m) (cm/s) (deg) (dB) (m) (cm/s) (deg) (dB) (m) (cm/s) (deg) (dB) (m) (cm/s) (deg) (dB)
1.06 35.98 128.20 93.15 1.06 31.62 131.88 91.33 1.06 6.92 218.23 86.07 1.06 48.69 222.07 102.98
1.31 32.59 125.72 93.75 1.31 27.94 135.03 91.13 1.31 7.50 217.30 86.23 1.31 45.30 222.38 103.63
1.56 33.43 124.57 93.88 1.56 22.93 130.27 90.10 1.56 2.93 215.10 85.40 1.56 44.64 223.37 103.10
1.81 31.60 121.48 93.73 1.81 19.87 132.11 89.17 1.81 2.92 194.96 84.70 1.81 45.74 222.00 102.60
2.06 28.41 119.64 93.13 2.06 17.43 131.90 88.33 2.06 2.15 311.47 83.77 2.06 42.56 222.96 102.00
2.31 26.85 120.42 93.75 2.31 15.58 131.97 88.87 2.31 4.37 5.17 84.30 2.31 39.96 221.92 102.70
2.56 24.98 118.96 94.20 2.56 16.19 131.81 89.10 2.56 6.99 353.95 84.73 2.56 39.65 221.00 103.30
2.81 25.09 121.54 94.53 2.81 17.37 136.63 89.27 2.81 9.00 356.01 85.43 2.81 39.31 224.00 103.85
3.06 24.01 119.84 94.70 3.06 15.51 129.92 89.43 3.06 10.71 3.03 86.17 3.06 36.13 221.47 104.45
3.31 22.25 116.49 94.88 3.31 14.85 139.94 89.87 3.31 7.13 0.73 86.67 3.31 33.21 218.58 105.08
3.56 22.04 120.13 94.95 3.56 14.16 138.26 90.40 3.56 6.19 343.68 86.83 3.56 28.67 221.01 105.83
3.81 21.15 119.80 95.00 3.81 10.18 133.06 90.87 3.81 5.60 342.64 87.23 3.81 26.97 218.80 107.18
4.06 17.05 124.92 98.58 4.06 10.71 127.59 91.13
4.31 7.85 124.08 91.40
4.56 7.24 141.88 91.97
4.81 4.83 122.79 107.63
Pamunkey Mud
Cruise / Time (EST) YR160623 / 0648 YR160624 / 0759 YR0701/ 0617 YR160706 / 0850
Gloucester Pt Mud
3.81
Desc. Clay Bank Mud Clay Bank Mud
3.81
Station Code CB_23 CB_24 GP PM
Water depth (m) 4.06 4.81
Table A2.3A

VIMS Final Report for Nova Research, Inc. 47
Table 4.2 intensity scale factor = 0.43 dB/count
Burst Averaged ADCP Water Column Speed, Direction and Acoustic Backscatter
Depth Speed Direction backscatter Depth Speed Direction backscatter Depth Speed Direction backscatter Depth Speed Direction backscatter
(m) (cm/s) (deg) (dB) (m) (cm/s) (deg) (dB) (m) (cm/s) (deg) (dB) (m) (cm/s) (deg) (dB)
1.06 38.07 352.02 80.65 1.06 3.93 62.26 98.13 1.06 1.05 256.16 84.63 1.06 6.69 177.32 87.80
1.31 41.06 353.22 80.75 1.31 14.16 323.52 93.83 1.31 7.08 317.45 82.48 1.31 1.72 174.60 86.70
1.56 41.88 351.47 80.33 1.56 7.63 332.41 89.18 1.56 12.39 328.94 80.45 1.56 2.77 297.90 82.85
1.81 43.28 354.76 79.63 1.81 18.46 356.43 85.28 1.81 14.45 331.49 78.70 1.81 6.77 328.52 79.45
2.06 42.89 354.11 78.88 2.06 13.21 354.37 83.08 2.06 17.33 328.53 78.33 2.06 11.03 321.97 77.50
2.31 44.88 353.12 80.25 2.31 16.18 344.62 83.13 2.31 15.18 332.84 79.08 2.31 10.05 319.62 77.85
2.56 45.46 353.50 82.85 2.56 19.26 348.02 83.08 2.56 14.43 321.74 79.93 2.56 7.68 319.26 77.65
2.81 44.91 354.99 86.23 2.81 17.45 333.87 83.35 2.81 12.58 326.03 80.73 2.81 10.27 318.78 77.90
3.06 43.25 352.35 91.48 3.06 16.54 354.21 83.98 3.06 9.25 323.92 80.85 3.06 8.73 318.45 77.90
3.31 43.30 353.32 95.15 3.31 9.85 328.89 84.10 3.31 10.84 322.75 80.68 3.31 6.62 321.86 77.78
3.56 39.81 352.95 97.65 3.56 11.19 342.99 84.80 3.56 10.07 313.69 80.88 3.56 4.31 321.56 78.20
3.81 35.76 351.77 99.70 3.81 8.39 343.46 85.85 3.81 7.36 322.13 82.08 3.81 3.18 340.23 79.00
4.06 31.64 352.95 111.98 4.06 6.81 339.76 89.18 4.06 1.67 295.09 95.93 4.06 0.90 318.23 80.93
4.31 9.39 155.22 110.40
YR160714 / 0636 YR160714 / 0704 YR160714 / 0726YR160706_2 / 1026
West Point Mud
WP
4.06
Cruise / Time (EST)
Desc. Ferry Point Sand/Mud Ferry Point Sand/Mud Ferry Point Sand/Mud
4.31
Station Code FP_0636 FP_0704 FP_0726
Water depth (m) 4.06 4.06
Table A2.3B

VIMS Final Report for Nova Research, Inc. 48
Table 4.3 intensity scale factor = 0.43 dB/count
Burst Averaged ADCP Water Column Speed, Direction and Acoustic Backscatter
Depth Speed Direction backscatter Depth Speed Direction backscatter Depth Speed Direction backscatter
(m) (cm/s) (deg) (dB) (m) (cm/s) (deg) (dB) (m) (cm/s) (deg) (dB)
1.06 33.09 224.78 103.38 1.06 0.90 197.43 92.43 1.06 6.43 340.03 87.08
1.31 32.91 225.40 103.38 1.31 1.18 128.56 92.90 1.31 6.3 339.54 86.23
1.56 31.23 222.47 102.55 1.56 2.38 173.22 92.00 1.56 7.63 337.78 84.45
1.81 32.30 222.52 101.63 1.81 1.51 84.68 91.13 1.81 7.17 334.64 82.63
2.06 28.65 221.26 100.83 2.06 2.95 98.55 90.43 2.06 6.84 330.1 80.85
2.31 28.49 220.56 101.35 2.31 3.92 131.72 90.93 2.31 5.99 326.48 80.30
2.56 26.23 221.10 101.80 2.56 4.69 69.02 91.35 2.56 6.33 325.04 79.80
2.81 24.58 220.94 102.18 2.81 5.66 25.98 91.78 2.81 7.05 331.68 79.20
3.06 21.78 221.11 102.53 3.06 4.37 32.13 92.10 3.06 9.29 331.97 78.93
3.31 18.50 225.75 102.93 3.31 4.63 18.03 92.48 3.31 8.21 318.71 78.60
3.56 17.54 219.97 109.10 3.56 6.02 38.08 93.18 3.56 8.67 327.13 78.43
3.81 9.6 327.42 79.30
4.06 10.49 248.26 107.80
3.56
Cruise / Time (EST) YR160805 / 0659
3.56
Pamunkey Sand/Mud
PS_0811 PS_0941
Pamunkey Sand/Mud
YR160721 / 0811 YR160721 / 0941
Desc. Goodwin Island Sand/Mud
Station Code GI
Water depth (m) 4.06
Table A2.3C

VIMS Final Report for Nova Research, Inc. 49
Table 5
Sediment Percent Grainsize and Oganic Matter (by dry weight)
Core >850 >850 Sand Sand Silt Silt Clay Clay
Depth Organic Organic Organic Orgainic
(cm) (%) (%) (%) (%) (%) (%) (%) (%)
0.5 0.18 0.01 3.28 0.40 39.69 0.79 45.88 9.77
1.5 0.00 0.00 2.94 0.13 46.32 0.42 39.51 10.68
2.5 0.00 0.00 3.75 0.18 50.24 0.18 34.29 11.37
3.5 0.00 0.00 5.77 0.24 44.48 0.93 39.06 9.51
4.5 0.05 0.00 8.14 0.18 45.02 0.30 36.14 10.17
5.5 0.03 0.01 9.40 0.17 45.89 1.75 33.54 9.21
6.5 0.00 0.00 8.36 0.17 42.21 0.67 39.26 9.33
7.5 0.00 0.00 6.97 0.47 39.89 0.90 43.28 8.50
8.5 0.00 0.00 4.84 0.07 42.37 0.75 42.92 9.05
9.5 0.17 0.01 5.64 0.20 42.12 1.04 41.91 8.92
0.5 0.00 0.00 9.90 0.11 49.84 1.66 29.18 9.30
1.5 0.04 0.00 11.64 2.47 47.69 0.25 28.87 9.04
2.5 0.00 0.02 13.36 0.14 47.15 0.16 29.49 9.70
3.5 0.00 0.02 17.37 0.15 45.19 0.46 27.90 8.91
4.5 0.33 0.01 31.24 0.17 36.15 1.08 24.23 6.79
5.5 0.97 0.03 35.57 0.22 34.46 0.57 21.77 6.41
6.5 0.27 0.02 43.03 0.34 29.08 1.05 21.95 5.25
7.5 4.33 0.13 45.92 0.39 21.13 0.88 22.83 4.39
8.5 4.01 0.04 48.50 0.22 25.08 1.05 16.91 4.20
9.5 0.88 0.02 51.87 0.40 23.73 0.19 18.51 4.41
0.5 0.00 0.05 43.41 1.15 24.38 1.36 23.40 6.26
1.5 0.06 0.01 11.40 1.04 40.75 2.55 34.95 9.24
2.5 0.00 0.00 3.26 0.44 51.26 2.21 31.06 11.76
3.5 0.00 0.00 3.92 0.88 46.35 1.82 36.47 10.56
4.5 0.03 0.01 29.55 0.58 32.54 1.20 28.72 7.36
5.5 0.08 0.03 48.44 0.43 21.53 0.55 23.85 5.08
6.5 0.00 0.03 63.98 0.77 16.31 0.00 14.52 4.33
7.5 0.00 0.00 63.00 0.58 15.74 0.65 15.99 4.04
8.5 0.01 0.01 58.93 0.45 18.84 0.63 16.64 4.50
9.5 0.01 0.03 63.62 0.71 16.44 0.50 15.05 3.64
0.50 0.00 0.00 62.09 0.27 19.44 0.29 12.33 5.59
1.50 0.04 0.03 73.12 0.21 13.34 0.09 9.92 3.25
0.5 0.59 0.01 75.74 0.14 15.49 0.38 4.35 3.30
1.5 0.86 0.01 76.46 0.09 14.35 0.22 4.57 3.45
2.5 0.90 0.02 81.32 0.08 10.65 0.08 4.31 2.64
3.5 0.94 0.00 87.13 0.05 7.37 0.18 2.58 1.75
4.5 0.65 0.03 89.85 0.07 6.07 0.00 1.97 1.77
5.5 0.40 0.00 89.70 0.05 6.62 0.50 1.54 1.20
6.5 0.64 0.05 89.58 0.06 5.84 0.10 2.33 1.41
7.5 0.86 0.17 89.98 0.11 5.58 0.00 1.83 1.51
0.5 0.24 0.26 96.39 0.09 1.98 0.44 0.44 0.17
1.5 0.80 0.22 96.45 0.08 1.79 0.00 0.46 0.60
2.5 1.49 3.05 87.27 0.22 4.91 0.30 1.09 1.66
3.5 2.11 3.81 85.92 0.15 5.20 0.00 1.46 1.50
0.5 0.07 0.01 83.10 0.14 4.38 1.34 9.72 1.24
1.5 0.17 0.01 83.42 0.14 4.65 0.96 9.37 1.27
2.5 0.01 0.00 82.98 0.09 4.74 1.18 9.64 1.37
3.5 0.50 0.03 81.40 0.10 5.19 1.63 9.67 1.47
4.5 0.06 0.00 84.82 0.10 4.10 1.31 8.35 1.25
5.5 0.01 0.01 84.93 0.09 4.39 1.14 8.29 1.14
6.5 0.00 0.01 86.73 0.13 3.42 1.02 7.43 1.26
7.5 0.00 0.00 88.93 0.17 3.04 0.61 6.48 0.77
surface 0.08 0.01 7.90 0.13 48.79 0.61 32.90 9.58
YR160706 / 0926
Gloucester Pt Mud
GP
4.56
Cruise / Time (EST)
Desc.
Station Code
Water depth (m)
YR0701/ 0659
YR160624 / 0708
Clay Bank Mud
CB
5.15
4.11
YR160721 / 0728
Pamunkey Sand/Mud
PS
Pamunkey Mud
PM
6.25
YR160714 / 0636
Ferry Point Sand/Mud
YR160706_2 / 1023
West Point Mud
WP
4.16
FP
5.70
YR160805 / 0523
5.92
Goodwin Island Sand/Mud
GI
4.34
YR160920 / 0633
Naval Weapons Station Mud
NWS
Table A2.4

VIMS Final Report for Nova Research, Inc. 50
Table 6.1
Sediment Percent Moisture, Volitile Solids and Fixed Solids (by wet weight)
Depth Moisture Volitle Solids Fixed Solids Depth Moisture Volitle Solids Fixed Solids Depth Moisture Volitle Solids Fixed Solids Depth Moisture Volitle Solids Fixed Solids
(cm) (%) (%) (%) (cm) (%) (%) (%) (cm) (%) (%) (%) (cm) (%) (%) (%)
0.5 69.26 2.42 28.32 0.5 73.23 2.49 24.28 0.5 62.49 2.34 35.17 0.5 60.60 1.65 37.75
1.5 67.72 2.56 29.72 1.5 68.40 2.65 28.95 1.5 69.37 2.81 27.82 1.5 41.34 1.62 57.04
2.5 68.34 2.53 29.13 2.5 67.21 2.51 30.28 2.5 73.17 2.97 23.86
3.5 63.63 2.60 33.77 3.5 64.38 2.50 33.12 3.5 71.63 2.99 25.38
4.5 61.73 2.65 35.62 4.5 59.09 2.33 38.59 4.5 61.97 2.75 35.28
5.5 60.79 2.66 36.55 5.5 55.76 2.29 41.95 5.5 52.73 2.31 44.96
6.5 59.78 2.74 37.48 6.5 52.62 2.24 45.14 6.5 48.87 2.11 49.02
7.5 59.35 2.65 38.00 7.5 49.45 2.25 48.31 7.5 47.56 2.09 50.35
8.5 60.45 2.65 36.90 8.5 45.39 2.19 52.41 8.5 49.18 2.15 48.67
9.5 61.75 2.69 35.56 9.5 44.30 2.20 53.50 9.5 47.53 2.11 50.36
5.15 4.56 6.25 4.16
Cruise / Time (EST) YR160624 / 0708 YR0701/ 0659 YR160706 / 0926 YR160706_2 / 1023
GP PM WP
Desc. Clay Bank Mud Gloucester Pt Mud Pamunkey Mud West Point Mud
Water depth (m)
Station Code CB
Table A2.5A

VIMS Final Report for Nova Research, Inc. 51
Table 6.2
Sediment Percent Moisture, Volitile Solids and Fixed Solids (by wet weight)
Depth Moisture Volitle Solids Fixed Solids Depth Moisture Volitle Solids Fixed Solids Depth Moisture Volitle Solids Fixed Solids Depth Moisture Volitle Solids Fixed Solids
(cm) (%) (%) (%) (cm) (%) (%) (%) (cm) (%) (%) (%) (cm) (%) (%) (%)
0.5 45.77 1.57 52.66 0.5 25.47 0.45 74.09 0.5 31.12 0.80 68.08 0.5 63.25 3.01 33.74
1.5 39.54 1.52 58.94 1.5 23.36 0.55 76.09 1.5 28.05 0.80 71.15
2.5 34.32 1.33 64.35 2.5 33.85 2.13 64.03 2.5 24.78 0.75 74.48
3.5 27.48 1.00 71.52 3.5 26.04 1.12 72.84 3.5 24.60 0.79 74.61
4.5 23.95 0.82 75.23 4.5 23.60 0.71 75.69
5.5 24.21 0.89 74.90 5.5 22.44 0.69 76.87
6.5 22.36 0.72 76.91 6.5 22.10 0.63 77.26
7.5 22.40 0.83 76.77 7.5 22.12 0.64 77.24
YR160714 / 0636
Ferry Point Sand/Mud
FP
4.11
GI NWS
4.34 5.92
Station Code
Water depth (m)
Cruise / Time (EST)
Desc. Goodwin Island Sand/Mud Naval Weapons Station Mud
YR160721 / 0728
Pamunkey Sand/Mud
PS
5.70
YR160805 / 0523 YR160920 / 0633
Table A2.5B

VIMS Final Report for Nova Research, Inc. 52
Table 7.1
Sediment GUST Microcosm Erodability
c Tau applied Tau applied
(Pa) Core A Core B Core A Core B (Pa) Core A Core B Core A Core B (Pa) Core A Core B Core A Core B
0.01 0.08 0.08 0.00 0.00 0.01 0.08 0.08 0.00 0.00 0.01 0.08 0.08 0.00 0.00
0.05 0.08 0.08 0.00 0.00 0.05 0.08 0.08 0.00 0.00 0.05 0.08 0.08 0.00 0.00
0.11 0.10 0.09 0.06 0.05 0.11 0.08 0.08 0.01 0.01 0.10 0.08 0.09 0.02 0.08
0.22 0.15 0.16 0.34 0.19 0.22 0.10 0.08 0.03 0.02 0.22 0.17 0.17 0.11 0.21
0.33 0.23 0.23 0.71 0.58 0.33 0.12 0.10 0.04 0.04 0.32 0.27 0.28 0.19 0.35
0.47 0.32 0.31 1.29 1.17 0.47 0.14 0.20 0.06 0.07 0.47 0.40 0.39 0.28 0.57
0.56 0.40 0.43 1.73 1.65 0.55 0.22 0.27 0.08 0.10 0.54 0.47 0.47 0.34 0.72
Tau Critical (Pa) Eroded Mass (Kg/m^2) Tau Critical (Pa) Eroded Mass (Kg/m^2)Tau Critical (Pa) Eroded Mass (Kg/m^2)
Station Code CB GP PM
Water depth (m) 5.15 4.56 6.25
Cruise / Time (EST) YR160624 / 0708 YR0701/ 0659 YR160706 / 0926
Desc. Clay Bank Mud Gloucester Pt Mud Pamunkey Mud
Table A2.6A

VIMS Final Report for Nova Research, Inc. 53
Table 7.2
Sediment GUST Microcosm Erodability
Tau applied Tau applied Tau applied
(Pa) Core A Core B Core A Core B (Pa) Core A Core B Core A Core B (Pa) Core A Core B Core A Core B
0.01 0.08 0.00 0.01 0.01 0.00 0.01 0.08 0.08 0.00 0.00
0.05 0.08 0.00 0.05 0.01 0.01 0.05 0.08 0.08 0.00 0.00
0.10 0.10 0.02 0.1 0.02 0.01 0.10 0.08 0.10 0.00 0.01
0.22 0.20 0.05 0.2 0.02 0.02 0.22 0.17 0.18 0.03 0.03
0.32 0.30 0.09 0.3 0.02 0.02 0.32 0.27 0.28 0.07 0.06
0.47 0.41 0.12 0.45 0.04 0.06 0.47 0.41 0.41 0.13 0.12
0.54 0.44 0.14 0.55 0.03 0.04 0.54 0.48 0.45 0.17 0.20
4.34
YR160805 / 0523
Goodwin Island Sand/Mud
results estimated
from Solids collected
GUST file not created
Tau Critical (Pa) Eroded Mass (Kg/m^2)
GI
Tau Critical (Pa) Eroded Mass (Kg/m^2)Tau Critical (Pa) Eroded Mass (Kg/m^2)
Station Code PS
Water depth (m) 5.70
Cruise / Time (EST) YR160721 / 0728
Desc. Pamunkey Sand/Mud
FP
4.11
YR160714 / 0636
Ferry Point Sand/Mud
Table A2.6B

VIMS Final Report for Nova Research, Inc. 54
Table A2.7A
Sediment Resistivity
Depth Mean Stand Dev Depth Mean Stand Dev Depth Mean Stand Dev
(cm) (Ohm-cm) (Ohm-cm) (cm) (Ohm-cm) (Ohm-cm) (cm) (Ohm-cm) (Ohm-cm)
5 40.75 4.07 5 27.11 4.60 5 3019.08 958.49
2 38.49 2.92 2 26.35 0.76 2 3151.76 557.51
0 38.58 0.99 0 34.21 6.10 0 960.33 2452.82
-1 41.13 0.99 -1 26.99 2.65 -1 2769.13 NaN
-2 42.35 4.35 -2 31.04 5.28 -2 1650.57 1442.67
-3 40.07 4.40 -3 28.52 7.07 -3 2468.61 135.66
-4 40.17 5.59 -4 32.71 4.52 -4 805.97 1967.01
-5 41.31 4.37 -5 29.00 5.83 -5 3289.79 2727.10
-6 44.14 1.64 -6 25.23 1.90 -6 543.88 2229.48
-7 40.76 0.80 -7 23.32 0.07 -7 1761.21 721.95
-8 39.39 2.81 -8 32.02 6.48 -8 2848.17 NaN
-9 41.72 11.97 -9 26.42 2.66 -9 922.85 144.27
-10 37.11 5.42 -10 20.31 3.60 -10 1241.18 NaN
-11 33.76 8.43 -11 25.03 5.43
-12 32.23 8.41 -12 29.93 11.31
-13 33.05 8.62 -13 30.76 12.24
Table A2.7B
Sediment Resistivity
Depth Mean Stand Dev Depth Mean Stand Dev Depth Mean Stand Dev
(cm) (Ohm-cm) (Ohm-cm) (cm) (Ohm-cm) (Ohm-cm) (cm) (Ohm-cm) (Ohm-cm)
5 72.93 5 124.31 5 88.33 2.85
2 22.08 2 225.35 2 57.86 22.05
0 15.75 0 184.34 0 51.07 49.64
-1 13.94 -1 175.10 -1 59.43 3.58
-2 25.58 -2 145.37 -2 12.98 1.77
-3 9.36 -3 81.86 -3 6.02 5.07
-4 8.92 -4 62.86 -4 8.32 7.33
-5 9.28 -5 134.05 -5 13.97 10.78
Cruise / Time (EST) YR160624 / 0708 YR0701/ 0659 YR160706 / 0926
Desc. Clay Bank Mud Gloucester Pt Mud Pamunkey Mud
Station Code CB GP PM
Water depth (m) 5.15 4.56 6.25
Cruise / Time (EST) YR160714 / 0636 YR160721 / 0728 YR160805 / 0523
Desc. Ferry Point Sand/Mud Pamunkey Sand/Mud Goodwin Island Sand/Mud
Station Code FP PS GI
Water depth (m) 4.11 5.70 4.34

VIMS Final Report for Nova Research, Inc. 55
Table A2.7C
Core Surface Water for Sediment Resistivity (Collected using YSI6600)
Cruise / Time (EST) Desc. Station Code Core Temperature Conductivity Resistivity Salinity
(deg C) (μS/cm) (ohm.cm) (PSU)
YR160624 / 0708 Clay Bank Mud CB 5659 25.84 24.95 40.10 14.90
5660 25.25 24.29 41.20 14.65
YR0701/ 0659 Gloucester Pt Mud GP 5663 26.55 33.15 30.20 20.10
5664 25.96 32.24 31.00 19.69
YR160706 / 0926 Pamunkey Mud PM 5671 29.77 0.79 2640.00 0.16
5672 28.60 0.38 2665.00 0.17
YR160714 / 0636 Ferry Point Sand/Mud FP 5682 28.18 29.07 34.40 16.76
YR160721 / 0728 Pamunkey Sand/Mud PS 5689 29.97 3.03 330.10 1.42
YR160805 / 0523 Goodwin Island Sand/Mud GI 5697 25.77 35.15 28.40 21.75
5698 25.74 35.17 28.40 21.77