Resistivity-induced coupling between voltage distribution ...
13
Resistivity-induced coupling between voltage distribution and vibrations in dielectric elastomers Emil Garnell, Corinne Rouby, Olivier Doar´ e IMSIA, CNRS, ENSTA Paris, EDF, CEA, Institut Polytechnique de Paris, France E-mail: [email protected],[email protected], [email protected] Abstract. Dielectric elastomers are soft actuators made of a thin layer of elastomer sandwiched between compliant electrodes. Because of the resistivity of the electrodes, the voltage is not uniform on the actuator at high frequencies. We present experimental evidence that the voltage spatial distribution is coupled to the membrane vibrations, as well as a model based on Maxwell’s equations in a moving frame to explain the coupling. The model is validated experimentally, and is used to explain the physics of the observed coupling. As a result, information on the membrane deformation can be inferred from voltage measurements, which opens self-sensing possibilities at high frequencies. Keywords: Dielectric elastomers, Resistivity, Electrodynamics
Transcript of Resistivity-induced coupling between voltage distribution ...

Resistivity-induced coupling between voltagedistribution and vibrations in dielectric elastomers
Emil Garnell, Corinne Rouby, Olivier Doare
IMSIA, CNRS, ENSTA Paris, EDF, CEA, Institut Polytechnique de Paris,France
E-mail: [email protected],[email protected],
Abstract. Dielectric elastomers are soft actuators made of a thin layer ofelastomer sandwiched between compliant electrodes. Because of the resistivityof the electrodes, the voltage is not uniform on the actuator at high frequencies.We present experimental evidence that the voltage spatial distribution is coupledto the membrane vibrations, as well as a model based on Maxwell’s equations in amoving frame to explain the coupling. The model is validated experimentally, andis used to explain the physics of the observed coupling. As a result, informationon the membrane deformation can be inferred from voltage measurements, whichopens self-sensing possibilities at high frequencies.
Keywords: Dielectric elastomers, Resistivity, Electrodynamics

Coupling between voltage distribution and vibrations in dielectric elastomers 2
1. Introduction
Dielectric elastomers (DEs) are soft active materialscapable of large deformations under electric actuation[1]. Because of their high energy density, largeachievable strain, and combined actuation and sensingpossibilities, they have been considered for manyapplications, including artificial muscles, soft robotics,wearable sensors, loudspeakers, etc. They consistof a soft elastomeric material (typically silicone oracrylic), sandwiched between flexible electrodes. Whena high voltage is applied between the electrodes, themembrane is squeezed by the Maxwell electrostaticpressure, thins down and expands in area due toincompressibility. Deformations up to 500% area straincan be reached [2].
Self-sensing can be implemented with DE actu-ators: the deformation of the actuator is monitoredduring actuation without any added sensor, by measur-ing the voltage and current flowing through the device.Self-sensing improves the performance of DE actuators,as they can be operated in closed loop to compensatefor their limitations, such as viscoelastic creep [3].
In order to set-up self-sensing strategies, therelation between the deformation of the device andits electrical behavior must be known. At lowfrequencies, the DE membrane behaves as a capacitor,so measuring the capacitance, which is proportionalto the membrane area, provides a good estimation ofthe device geometry. To measure the capacitance, ahigh frequency signal can be superimposed to the lowfrequency actuation voltage [4, 5], or the actuationsignal can be directly used for sensing [6].
When the frequency increases, effects due to theelectrode resistivity come into play. Combined with thecapacitive nature of the DE membrane, the resistiveelectrodes form a resistor-capacitor circuit, which ischaracterized by its time constant τe. For frequencieshigher than 1/τe, the effective voltage which actuatesthe transducer is smaller than the supplied voltage,leading to a decrease in performance. The resistiveeffects have first been modeled by lumped parameters[7, 8], and lumped models are extensively used to studyself-sensing applications for one-degree-of-freedom (1-DOF) systems [9, 3].
Another resistivity-induced effect arises at higherfrequencies: the voltage will no longer be uniformon the electrodes. The lumped models then fail inpredicting the electrical behavior of the system, andtransmission line models which account for the spatialvariation of the voltage on the electrodes have beenproposed as a refinement [10, 11, 12, 13], either to studythe voltage distribution on DE membranes for actuatorapplications, or to investigate self-sensing of stackedDE transducers where the resistivity of the electrodesconnections is large [14, 15]. In all these studies on the
spatial distribution of the voltage on the electrodes, theinfluence of the dynamics of the device are neglected.This is valid for most applications, where actuationoccurs at timescales which are much larger than τe, sothe electrical behavior of the device can be computedassuming that the geometry is static.
However, this no longer holds for high frequencyapplications such as DEA-driven acoustics, or whenthe electrode resistivity is high. Only very few studiesinvestigated the influence of the device dynamics onthe electrical behavior [16, 17, 15]. These studiesanalysed 1-DOF systems using a lumped electricalmodel, but to the author’s knowledge, the couplingbetween the voltage spatial distribution and themembrane dynamics has not been investigated neitherexperimentally nor numerically. The goal of this articleis thus to propose a modelling approach that takesinto account this coupling and present experimentalresults that assess the interest of such an approach.The focus will be on high frequency applications whereDE devices operate at small deformations, which is thecase for DE loudspeakers for example.
The article is organized as follows: in section2, it is observed experimentally that the voltage onthe electrodes of a DE actuator can be influenced byits vibrations. The rest of the paper is dedicatedto modelling and understanding the physics of thiscoupling between the electrodynamic loading of a DEmembrane and its movement: a model describing thevoltage distribution on moving resistive DE devicesis presented for an arbitrary geometry in section 3,and is then validated by experiments in section 4 forthe inflated DE membrane configuration consideredin section 2. The coupling mechanism and itsconsequences are finally discussed in section 5.
2. Experimental observation
In this section, it is shown experimentally that thevoltage on the electrodes of DE actuators can beinfluenced by the displacement and the vibrations ofthe device.
We consider the actuator shown in figure 1(a),namely an axisymmetric DE membrane inflated overa closed cavity. This system can be actuated athigh frequency, as no additional mass apart from theDE membrane is moving. It has been investigatedby several researchers for use as pumps [18] orloudspeakers [19, 20, 21, 22].
The membrane is made of 50 µm-thick silicone(Elastosil Film 2030 from Wacker Chemie AG). A smallprestretch of 1.1 is applied by a circular pre-stretcher[23] to keep the membrane flat during the pad-printingof the electrodes, which are made of carbon-black(Ketjenblack EC-600JD from Akzo Nobel N.V) loaded
Coupling between voltage distribution and vibrations in dielectric elastomers 3
102 103
Frequency (Hz)
-25
-20
-15
-10
-5
0
0
0.2
0.4
0.6
0.8
1
Dielectric elastomermembrane
Soft compliantelectrodes
Membrane eigen-frequencies
Measured voltage at the center of the membraneInflated dielectric elastomer membrane(a) (c)
Cavity
Connection wire
Membrane
Membrane frame
High voltage probe
Measurement of the voltage on the electrodes(b)
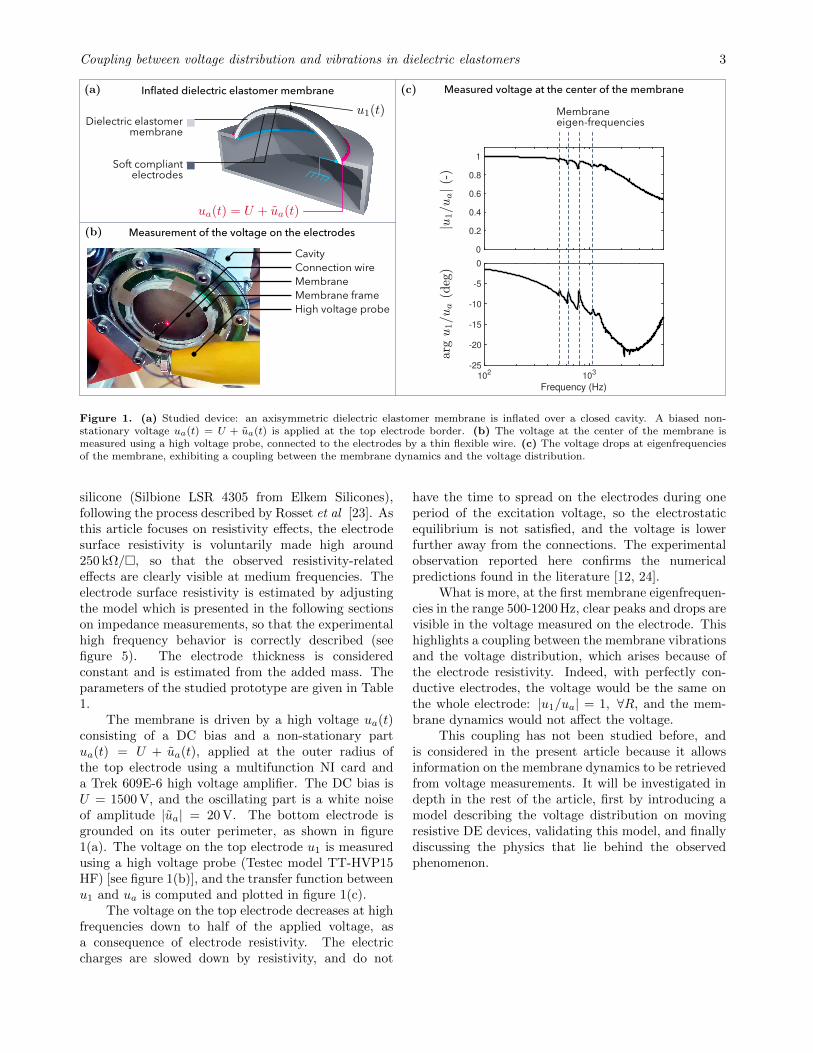
Figure 1. (a) Studied device: an axisymmetric dielectric elastomer membrane is inflated over a closed cavity. A biased non-stationary voltage ua(t) = U + ua(t) is applied at the top electrode border. (b) The voltage at the center of the membrane ismeasured using a high voltage probe, connected to the electrodes by a thin flexible wire. (c) The voltage drops at eigenfrequenciesof the membrane, exhibiting a coupling between the membrane dynamics and the voltage distribution.
silicone (Silbione LSR 4305 from Elkem Silicones),following the process described by Rosset et al [23]. Asthis article focuses on resistivity effects, the electrodesurface resistivity is voluntarily made high around250 kΩ/, so that the observed resistivity-relatedeffects are clearly visible at medium frequencies. Theelectrode surface resistivity is estimated by adjustingthe model which is presented in the following sectionson impedance measurements, so that the experimentalhigh frequency behavior is correctly described (seefigure 5). The electrode thickness is consideredconstant and is estimated from the added mass. Theparameters of the studied prototype are given in Table1.
The membrane is driven by a high voltage ua(t)consisting of a DC bias and a non-stationary partua(t) = U + ua(t), applied at the outer radius ofthe top electrode using a multifunction NI card anda Trek 609E-6 high voltage amplifier. The DC bias isU = 1500 V, and the oscillating part is a white noiseof amplitude |ua| = 20 V. The bottom electrode isgrounded on its outer perimeter, as shown in figure1(a). The voltage on the top electrode u1 is measuredusing a high voltage probe (Testec model TT-HVP15HF) [see figure 1(b)], and the transfer function betweenu1 and ua is computed and plotted in figure 1(c).
The voltage on the top electrode decreases at highfrequencies down to half of the applied voltage, asa consequence of electrode resistivity. The electriccharges are slowed down by resistivity, and do not
have the time to spread on the electrodes during oneperiod of the excitation voltage, so the electrostaticequilibrium is not satisfied, and the voltage is lowerfurther away from the connections. The experimentalobservation reported here confirms the numericalpredictions found in the literature [12, 24].
What is more, at the first membrane eigenfrequen-cies in the range 500-1200 Hz, clear peaks and drops arevisible in the voltage measured on the electrode. Thishighlights a coupling between the membrane vibrationsand the voltage distribution, which arises because ofthe electrode resistivity. Indeed, with perfectly con-ductive electrodes, the voltage would be the same onthe whole electrode: |u1/ua| = 1, ∀R, and the mem-brane dynamics would not affect the voltage.
This coupling has not been studied before, andis considered in the present article because it allowsinformation on the membrane dynamics to be retrievedfrom voltage measurements. It will be investigated indepth in the rest of the article, first by introducing amodel describing the voltage distribution on movingresistive DE devices, validating this model, and finallydiscussing the physics that lie behind the observedphenomenon.

Coupling between voltage distribution and vibrations in dielectric elastomers 4
3. Model of moving resistive DEs
3.1. Studied system
In order to obtain the equations governing the voltagedistribution on the electrodes of moving resistive DEdevices, we consider a DE membrane on which anelectrode is deposited on both sides, on the surfaceΣ. This setup is described in figure 2. The voltageon the top and bottom electrodes are denoted u1 andu2 respectively. The top electrode is connected to thevoltage supply on the contour Γ1 where the voltage isfixed at ua. The bottom electrode is connected to theground on Γ2. On the rest of the border Γ = ∂Σ,no current is flowing out. The electrode resistivityis denoted re, the membrane dielectric permittivityε, the membrane and electrodes thicknesses h and herespectively.
Dielectric elastomer membraneCompliant electrodes
Figure 2. Studied dielectric elastomer membrane, anddefinition of the variables.
The electrostatic excitation which is responsiblefor the actuation is commonly described for incom-pressible DE actuators by a pressure applied on themembrane surface [1] which reads:
pES = ε
(u1 − u2
h
)2
, (1)
so to compute the behavior of the DE actuator, it isnecessary to estimate precisely the distribution of thevoltages u1 and u2.
The equations governing the voltage distributionon the electrodes will be obtained by two differentmethods: first by using the transmission line theory,which is the method chosen by most authors whoinvestigate resistivity effects on DEs, and secondstarting directly from Maxwell’s equations, andsimplifying them to a moving DE membrane geometry.The two methods are finally compared to each other.
3.2. Transmission line model
Transmission line theory is an intuitive way toderive the equations governing the charge and voltagedistribution on a DE actuator [12]. An element of the
DE membrane is modelled as a capacitor connected toresistors which stand for the electrode resistivity, seefigure 3.
Figure 3. Transmission line model of a dielectric elastomermembrane. The black lines denote a unit cell, and the grey linesother cells. The capacitor value is C = ε
hδxδy, the blue resistor
values Rx = rehe
δxδy
, and the red resistors values are Ry = rehe
δyδx
.
Writing the current balance at the two nodesidentified by dots in figure 3, and using the standardconstitutive equations for resistors and capacitors, thefollowing system of equations is obtained :
∇s ·(here
∇su1
)=
∂
∂t
( εh
(u1 − u2)), (2a)
−∇s ·(here
∇su2
)=
∂
∂t
( εh
(u1 − u2)), (2b)
where ∇s denotes the surface del operator:
∇s =∂
∂xex +
∂
∂yey . (3)
These governing equations must be completedwith the following boundary conditions:
u1 = ua on Γ1 , (4a)
u2 = 0 on Γ2 , (4b)
∇su1 · nb = 0 on Γ\Γ1 , (4c)
∇su2 · nb = 0 on Γ\Γ2 , (4d)
where nb is the normal vector to the border Γ, seefigure 2.
Even if it is not always written in this partialdifferential equation form, the system (2) with theboundary conditions (4) has been used by manyauthors to study resistivity effects on DEs (see [12, 24,11] for example). Most of the time these equations areused in a more simple form, which is obtained if thethickness and resistivity are assumed to be uniform,and if the membrane thickness does not depend ontime:
∇2su =
2reε
heh
∂u
∂t, (5)

Coupling between voltage distribution and vibrations in dielectric elastomers 5
where u = u1 − u2. This is a diffusion equation whichis easily solved by finite element methods for example.Although the governing equation is more compact inthe form (5), the form (2) is more practical becausethe boundary conditions are much easier to implementwhen the two variables u1 and u2 are used.
3.3. Maxwell model for a moving medium
The assumptions that lie behind the transmission linetheory must be clarified for a moving medium. A DEmembrane under dynamic excitation will move anddeform, and the motion could very likely interact withthe charge diffusion. In this section the equationsgoverning the voltage distribution on the electrodesare obtained from Maxwell’s equations written for amoving medium [25]. We will show that it leads toadditional terms in the equations compared to thetransmission line model.
Maxwell’s equations for a moving medium havebeen written thoroughly by Kovetz [25]. Two framesare defined: R is a Galilean reference frame, and R′is the frame of reference of the matter. The frameR′ moves relatively to R in a motion defined by thevelocity field v(x, t). Quantities will be noted with anapostrophe when referring to the frameR′ and withoutwhen referring to the frame R. In particular, thecurrent density i refers to the velocity of the chargeswith respect to the reference frame R while the currentdensity i′ = i− ρv refers to the velocity of the chargeswith respect to the matter. In the frame R, Maxwell’sequations for electro-quasistatics [26] read:
∇ ·D = ρ , (6a)
∇ · i +∂ρ
∂t= 0 , (6b)
E = −∇u , (6c)
D = ε0E + P , (6d)
where D is the electric displacement, E the electricfield, ρ the charge density, u a scalar potential fromwhich the electric field E derives, P the polarization,and ε0 the vacuum permittivity. All fields have thesame expression in R and in R′, except the currentdensity i.
These equations must be completed by constitu-tive relations between the polarization P ′, the currenti′, and the electric field E′, which are written in theframe R′ attached to the matter. In the present casetwo types of materials are considered:
• The membrane is made of a linear dielectricmaterial, which does not conduct free charges,that is i′ = 0, and in which the polarization P ′
is proportional to the electric field E′. Given thatthere are no free charges initially in the dielectric,
and that there are no currents, the charge remainsnull at all times (∀t, ρ′ = 0). So in the dielectricmembrane:
P = ε0χE , i = 0 , (7)
where χ is the membrane electric susceptibility.
• The electrodes are made of linear conductivematerial, which satisfies Ohm’s law i′ = E′/re,and is not polarizable, that is P ′ = 0. Thus, inthe electrodes:
P = 0 , i− ρv =1
reE . (8)
Because of the thinness of the system, it is possibleto describe the problem by equations written on a givenreference surface Σ close to the membrane geometry,involving only two spatial variables, and not by volumeequations. The construction of the 2D model is basedon the following assumptions:
• In the electrodes the electric field is tangential.
• In the membrane the electric field is dominatedby the normal component (fringe effects areneglected).
• Outside of the electrodes and of the membrane theelectric field is null.
The first assumption amounts to assume that thepotential u from which the electric field derives byEq. (6c) does not depend on the normal direction inthe electrodes.
The second assumption implies that in themembrane the electric field is expressed as a functionof the electrode potentials as:
E = −u1 − u2
hn . (9)
Indeed, due to the aether relation (6d) and theconstitutive law (7), the electric field and the electricdisplacement are proportional:
D = εE , (10)
where ε = ε0(1 + χe) is the permittivity of themembrane’s material. Therefore, as there are nofree charges in the membrane (ρ = 0), Gauss’slaw (6a) implies that the dominant normal componentof the electric field is uniform in the thickness ofthe membrane, and the expression (9) is finallyobtained from (6c). Note that in this expression, thetangential component of the electric field has beenomitted because it is negligible compared to the normalcomponent. The tangential component is actually ofthe same order of magnitude in the membrane andin the electrodes, due to its continuity across the

Coupling between voltage distribution and vibrations in dielectric elastomers 6
interface between the two materials. On the otherhand, our assumptions violate the continuity of thenormal component of the electric field (null in theelectrodes and given by Eq. (9) in the membrane). Inpractice, the charges will be mainly localized near theinterface because of the discontinuity of the materialproperties, which justifies the jump of the electric field.
The charge balance (6b), Gauss’s law (6a) andOhm’s law (8) are integrated in the thickness of thetop electrode, to obtain surface conservation equations(see appendix Appendix A for the details):
∇s · j1 +∂σ
∂t= 0 , (11)
σ =ε
h(u1 − u2) , (12)
j1 − v1‖σ + γ1∇su1 = 0 , (13)
where j1 is the surface current in the top electrode,v1‖ the tangential velocity in the top electrode, γ1 thesurface conductivity of the top electrode, σ the surfacecharge of the top electrode, and ∇s stands for thesurface del operator defined by Eq. (3), where x andy now denote curvilinear coordinates on the referencesurface.
By inserting in the charge balance (11) theexpression of the surface current j1 given by Ohm’slaw (13) and the expression of the surface charge σgiven by equation (12), a diffusion equation governingthe voltage distribution on the top electrode isobtained, and this procedure is repeated for the bottomelectrode, yielding:
∇s · (γ1∇su1) =∂
∂t
( εh
(u1 − u2))
+ ∇s ·( εh
(u1 − u2)v1‖
), (14a)
−∇s · (γ2∇su2) =∂
∂t
( εh
(u1 − u2))
+ ∇s ·( εh
(u1 − u2)v2‖
). (14b)
On the portion of the top electrode border wherethere is no connection, the boundary condition readi′ · nb = 0, that is:
i · nb = ρv · nb for x ∈ Γ\Γ1 . (15)
Integrating this condition over the thickness of the topelectrode and using Ohm’s law (13) yields:
∇su1 · nb = 0 on Γ\Γ1 . (16)
The same holds for the bottom electrode, and the fullset of boundary conditions is finally the same as in thecase of the model based on transmission line theory,given by Eqs. (4).
3.4. Comparison between Maxwell and transmissionline models
The equations governing the voltage distribution onresistive DE membranes have been derived using twomethods: either by applying the transmission linetheory which gives equations (2), or by using directlyMaxwell’s equations which yields equations (14). Inboth cases, the boundary conditions are the same andare given by equations (4).
If the dielectric membrane is at rest, v = 0, andε/h can be moved out of the derivative in equation (14).Equations (2) and (14) are then identical.
However, if the membrane moves and deforms,the voltage distribution appears to be coupled tothe membrane movement, and equations (2) and (14)differ by the convective term ∇s ·
(ε/h(u1 − u2)v‖
)in
equation (14). This term matters when there is anin-plane movement of the membrane.
3.5. Linearization
We now consider that the actuator is driven by anoscillating voltage with a static bias: ua(t) = U+ua(t),as it is often the case for DE actuators [27]. Equations(14) are linearized, by considering small voltage anddisplacement perturbations around a steady state:
u1 = U + u1(t), u2 = 0 + u2(t), (17)
h = H + h(t), he = He + he(t). (18)
Also, given the small thickness of the electrodes andof the membrane, it is assumed that the tangentialvelocity is the same in the whole membrane, meaningthat v1‖ = v2‖ = v‖. The top and bottom electrodethicknesses and resistivity are also assumed to beidentical and uniform along the thickness direction,which yields γ1 = γ2 = he/re.
The linearized versions of equations (14) are:
ε
H
∂
∂t(u1 − u2)− εU
H2
∂h
∂t=
∇s ·(He
re∇su1
)− U∇s ·
( εH
v‖
), (19a)
ε
H
∂
∂t(u1 − u2)− εU
H2
∂h
∂t=
−∇s ·(He
re∇su2
)− U∇s ·
( εH
v‖
). (19b)
Equations (19) show that even at first order,the voltage distribution is coupled to the mechanicalvibrations, through the time derivative of themembrane thickness and through the membranetangential velocity v‖. It must be noted that thecoupling terms are proportional to the bias voltage U .
We emphasize that all effects which are discussedin the following are linear effects, independent of the

Coupling between voltage distribution and vibrations in dielectric elastomers 7
amplitude of the excitation. For larger excitationamplitudes, complex non-linear dynamics may arise, asstudied in depth by other researchers e.g. [28, 29, 30],but are beyond the scope of the present article.
4. Experimental validation of the model
The model is now used to compute the mechanical andelectrical behavior of the device shown in figure 1(a):an axisymmetric DE membrane inflated over a closedcavity.
The equations governing the dynamics of thismembrane have already been derived [29, 21, 22,31] and linearized around the inflated configuration.Appending equations (19) to the linearized dynamicequations results in a linear set of equations, whichstrongly couples electrical and mechanical dynamics.A weak form of these equations is built and solvedin the frequency domain using the open source finiteelement solver FreeFEM (see [31, 22] for the details ofthe method).
Three calculations are compared to measurementsin the following:
• Model w/o resistance: it is assumed that theelectrodes are perfectly conductive, so the voltageis uniform on the electrodes for all frequencies, andequal to the applied voltage.
• Uncoupled model : the electrical diffusion equa-tions (19) are solved first, assuming the geometryis static. The obtained frequency-dependent volt-age distribution is then used as a given input to themechanical calculation. This is the approach usedby the authors who consider nonuniform voltagedistributions on dielectric elastomers.
• Coupled model : the system of fully coupledelectrical and mechanical equations is solved,meaning that the influence of the vibrations of themembrane on the voltage distribution is taken intoaccount.
The parameters of the studied membrane aregiven in table 1. The behavior of the siliconemembrane is modelled by a Gent hyperelastic law.The shear modulus µ and the stiffening parameter Jmare estimated by fitting a simulation of the quasistaticinflation of the membrane on an inflation experiment.The range of the pressure sensor that we used limitedthe achievable biaxial stretches to approximately 1.7,at which the stiffening of the elastomer is not verysteep. As a consequence, the estimation of Jm is notvery accurate, and explains the large value in table 1.However, all measurements presented in this article areobtained for relatively small strains, for which Jm haslittle influence.
Dissipation effects related to the viscosity ofthe elastomer are taken into account by structural
Table 1. Parameters of the studied prototype. The membraneand electrode thicknesses H0 and He0 are given in the referenceconfiguration, before the membrane is pre-stretched and inflated.
Name Symbol Value
Shear modulus µ 450 kPaGent stiffening parameter [32] Jm 60Material loss factor η 2 %Membrane thickness H0 50 µmElectrode thickness He0 2 µmElectrode resistivity re 0.5 ΩmMembrane radius A 19 mmMembrane biaxial pre-stretch λpre 1.1Membrane density ρ 1042 kg m−3
Membrane relative permittivity εr 2.8Inflation pressure P 1500 PaBias voltage U 1500 VOscillating voltage amplitude |ua| 20 V
102 103-40
-20
0
20
40
MeasuredModel w/o resistanceUncoupled modelCoupled model
Figure 4. Transfer function between the vertical velocity of themembrane vz at radius R = 0.1 × A and the applied voltage,measured using a laser vibrometer and computed.
damping, using a constant loss factor η in themembrane.
To assess the performance of the model and of thenumerical implementation, the membrane is excitedwith white noise, and its velocity is measured usinga laser vibrometer (Polytec PSV-500). The transferfunction between the applied voltage and the velocity isobtained using the H1 transfer function estimate [33],and plotted in figure 4 together with the numericalresults.
The Model w/o resistance, Coupled model andUncoupled model differ most largely around the thirdmembrane mode, at 900 Hz. The coupled model yieldsa larger loss factor for the third mode, indicating thatsome mechanical energy is transferred to the electricalpart of the system and is dissipated by resistive effects.All three models provide a convincing estimation ofthe dynamics of the system, which suggest that for theconsidered electrode resistivity the coupling betweenthe vibrations and the voltage distribution has aminor effect on the electrostatic excitation. To furtheranalyse the consequences of this coupling, the electricalbehavior of the inflated membrane is now analysed.

Coupling between voltage distribution and vibrations in dielectric elastomers 8
The impedance of the membrane ua/i can beobtained from the numerical results, as the currentflowing through the membrane Σ reads:
i =
∫Σ
ε
H
∂
∂t(u1 − u2)dS +
∫Σ
εU∂
∂t
(1
h
)dS . (20)
In figure 5, this computed impedance is compared tothe measured impedance, obtained using the currentmeasured in a shunt resistor and the voltage given bythe monitor output of the Trek 609-E amplifier usedfor the experiments.
102 103
105
106
102 103-100
-90
-80
-70
-60
-50
-40
(a)
(b)
Capacitivebehavior
Resistivebehavior
Dynamicaleffects
MeasuredModel w/o resistanceUncoupled modelCoupled model
Figure 5. Membrane impedance, measured on a prototype, andcomputed with the Model w/o resistance, Uncoupled model andCoupled model. (a) Amplitude. (b) Phase.
The 1/ω behavior of the impedance at lowfrequencies (below 500 Hz) is characteristic of acapacitor, and resistive effects make it deviate fromthe capacitive behavior at high frequencies. As thefrequency of the excitation passes one of the firsteigenfrequencies of the membrane, a large displacementwill be caused by the applied voltage ua. As aconsequence, the membrane thickness will oscillate,and the second term in (20) results in peaks in theimpedance, which are both measured and computedby the three models. The impedance thus revealscoupling effects between the electrodynamic loadingof the membrane and its vibrations. This couplingmechanism is not related to the electrode resistivity,but to capacitance changes during actuation, andoccurs even with perfectly conductive electrodes (modelw/o resistance). It can thus be described by modelswhich assume a uniform voltage on the electrodes.
The measurement of the impedance may provideuseful information for self-sensing, as the first mem-
brane eigenfrequencies for example can be estimatedonly from impedance measurements by peak-pickingalgorithms. This information can then be used to per-form adaptive filtering for example.
Here again, figure 5 shows that there are only verysmall differences between the results of the Coupledmodel and Uncoupled model, and the comparison withthe measurements does not show that the prediction ofthe coupled model is better.
The voltage on the electrodes is now investigated,and the usefulness of the coupled model is demon-strated. The voltage is measured using a high volt-age probe, as explained in figures 1(a) and 1(b). Theelectrode voltage u1 is measured at different radii, andplotted in figure 6, together with the results of themodels.
102 1030.5
0.6
0.7
0.8
0.9
1
102 103-30
-25
-20
-15
-10
-5
0
(a)
(b)
MeasuredModel w/o resistanceUncoupled modelCoupled model
Figure 6. Transfer function between the voltage on the topelectrode u1 at different radii during actuation and the appliedvoltage ua, measured and computed. (a) Amplitude. (b) Phase.
On the one hand, the model w/o resistanceassumes that the voltage is uniform on the electrodes,and equal to the applied voltage. As a consequence,it is not able to describe the measured frequencydependence. On the other hand, both the Uncoupledmodel and the Coupled model capture the decreaseof the voltage at high frequencies due to electroderesistivity. The further away from the electricalthe connections the measurement point is located,the faster the voltage decreases at high frequencies.This result is well known and has been analysed bytransmission line models on DEs [12, 13, 11].
What is more interesting is the behavior of the

Coupling between voltage distribution and vibrations in dielectric elastomers 9
voltage on the electrodes at medium frequencies,around 1 kHz. Peaks and drops are observed at themembrane eigenfrequencies, as already analysed infigure 1. These peaks are caused by the couplingbetween the membrane vibrations and the voltagediffusion, through the coupling terms which appearin equation (19). Indeed, the Uncoupled model whichdoes not take these terms into account is not able topredict the observed peaks. The Coupled model onthe other hand gives a good estimation of the dropat 800 Hz for example. The errors between the modeland the experiments on the other peaks and drops maybe related to errors in the calculation of the dynamics(see figure 4) or to measurement errors. Indeed, themeasurement of the voltage on a vibrating membraneat high frequencies is difficult (see figure 1), as anyconnecting wire tends to interfere with the dynamics.
To conclude this section, the voltage distributionon the electrodes of vibrating DEAs is influenced by themembrane movement, and it has been shown that thiseffect arises from the coupling terms in equation (19).The physical origin of the coupling will be discussed inthe following section.
5. Discussion
+ + + +_ _ _ _
+_
Stage 1 - Charged membrane at rest
Time
Time
+_+ ++
_ ___
+++__
+__
+
Stage 3 - Displacement of the electric charges
+_+ ++
_ ___
+
Stage 2 - Deformation of the membrane
Figure 7. Physical interpretation of the observed couplingmechanism. The characteristic times of electrical and mechanicaleffects are τe and τm, respectively. The distinction between thethree stages is made here for pedagogical reasons, and does notoccur in practice.
In this section, the coupling observed in figure 6and its consequences are discussed.
The peaks in the voltage at the membraneeigenfrequencies seen in figure 6 can be explained byfigure 7 where the dynamic loading of a membrane isdecomposed into three stages:
• Stage 1 Consider a DE membrane at rest, chargedby a static voltage at its edge.
• Stage 2 Suppose that, under external action, themembrane deforms during a mechanical responsetime τm. This deformation induces local changesin thickness. Before the charges move on themembrane, due to Gauss’s law (12) the voltageon the membrane will increase where it is thicker,and decrease where it is thinner.
• Stage 3 Charges will be supplied by thegenerator, and they will move on the membraneso that the voltage equals the applied voltageeverywhere. This diffusion occurs during thetimescale τe.
In practice, the membrane is actuated by anon stationary input voltage ua(t), which vibratesthe system at the period τm. The deformationis most significant at system’s eigenmodes, thus,we now examine the case where the excitationfrequency matches one of the eigenfrequencies. Theelectromechanical behavior of the system is governedby the ratio of the mechanical timescale τm and theelectrical time τe. Note that for such a resonant system,the mechanical timescale is dictated by the system’sresonances, and not by the material viscoelasticrelaxation time constants.
• If τe τm, the electrodynamic equilibrium issatisfied at all times, the voltage is uniform onthe membrane, and equal to the applied voltageua(t).
• If τe ≈ τm, the charge diffusion takes approxi-mately one period of oscillation, so the electro-static equilibrium is not satisfied at all times.There are locally excess charges which gener-ate voltage fluctuations, and the coupling phe-nomenon described in figure 7 then occurs.
• If τe τm, the charges do not have the timeto spread on the membrane, so the electrostaticexcitation is small, and the membrane does notmove. If the membrane is vibrated by anothermechanical excitation of period τm, the voltagewill still locally vary on the electrodes because thecharges are ’fixed’ by the high resistivity.
For the current prototype, the time scales for thecharge diffusion effects τe and for the mechanical effectsτm can be estimated by:
τe =εA2reHHe
≈ 50 µs , τm =A√µ/ρ
≈ 900 µs , (21)

Coupling between voltage distribution and vibrations in dielectric elastomers 10
with the parameters defined in table 1. There is adifference in the order of magnitude between τe andτm of about 20, and the coupling is still visible. It ishowever expected that it would be even stronger withmore resistive electrodes, which would increase τe.
To have an insight of the consequences of thiscoupling for higher resistivity electrodes, we use themodel to compute the voltage distribution on theinflated membrane at 1179 Hz, which corresponds tothe fourth membrane eigenfrequency. The results areplotted in figure 8.
(a)
(b)
0 0.2 0.4 0.6 0.8 10
0.5
0 0.2 0.4 0.6 0.8 1
0.5
1
Static deformationUncoupled modelCoupled model
103
-10
0
10
20
30(c)
Figure 8. Computed dynamics of the inflated DE membrane atthe fourth eigenfrequency 1179 Hz, for more resistive electrodes(τm/τe = 5). (a) Vertical position z of the static deformationof the membrane and of the operational deflection shape aroundthe static equilibrium, scaled so that the maximum displacementof the Uncoupled model is 0.3. The same scaling is used forboth calculations. (b) Voltage distribution at 1179 Hz, obtainedwith the Uncoupled model and the Coupled model. (c) Transferfunction between the normal velocity at the center of themembrane vz and the excitation voltage ua.
Figure 8(b) shows that the voltage distributionon the membrane is influenced by the membranedynamics, as the results of the Uncoupled model andCoupled model differ. The voltage on the electrodesoscillates with a wavelength which is similar to themechanical wavelength which can be observed infigure 8(a). This suggests that information on thelocal deformation of the membrane at high frequenciescan be obtained by voltage measurements on theelectrodes, which could be useful for self-sensing.Moreover, figure 8(c) indicates that for more resistiveelectrodes than the measured ones (see figure 4),the Coupled model ans Uncoupled model differ more,which suggests that for highly resistive electrodes it is
necessary to take into account the coupling betweenthe vibrations and the voltage distribution to computeaccurately the electrostatic excitation. Experimentalstudies with more resistive electrodes would providefurther insights in this direction.
6. Conclusion
To conclude, the present article provides an analysisof resistivity effects on dielectric elastomers. It hasbeen shown experimentally that for a certain set ofparameters, when the timescale for electrodynamicsis similar to the mechanical timescale, a couplingbetween the voltage distribution and the vibrations ofthe membrane occurs.
The equations governing the voltage distributionon moving resistive dielectric elastomer membraneshave been derived, and linearized around a pre-stressedconfiguration with a static bias voltage. The linearmodel succeeds in describing the observed coupling.
When the electrode resistivity is high, it is nec-essary to take into account the influence of the mem-brane dynamics on the voltage to compute accuratelythe electrostatic excitation on the membrane. The pro-posed model therefore refines the modelling of the ex-citation in resistive dielectric elastomer actuators. Inpractice, this may typically happen for example for DEloudspeakers [34, 35, 36], which operate at high fre-quencies, or for DE devices with resistive electrodesdriven at lower frequencies.
The studied coupling also opens self-sensing pos-sibilities, as information on the membrane dynamicscan be deduced from voltage and impedance measure-ments. More precisely, the local variations of the volt-age on the electrodes provides information on the localdeformation. This may lead to self-sensing applicationsto control dielectric elastomer actuators operated athigh frequencies, where the standard capacitive sensingapproaches no longer work, as the membrane thicknessvaries locally, and no longer in a uniform way.
Preliminary experimental investigations have beenconducted to demonstrate the coupling, but we believethat dedicated experiments with even more resistiveelectrodes would help understanding the possibleapplications, especially for self sensing.
Acknowledgments
The authors thank Bekir Aksoy and Herbert Shea fromthe EPFL for the help in manufacturing the prototype.The authors acknowledge the support of the FrenchNational Research Agency within the project SMArT(ANR-15-CE08-0007-02).

Coupling between voltage distribution and vibrations in dielectric elastomers 11
Appendix A. Integration of electrodynamicequations
In this appendix Maxwell’s equations are integratedin the normal direction in order to obtain surfaceequations.
Dielectric elastomer membraneElectrodes
Figure A1. Definition of the geometry of a thin membrane forthe simplification of Maxwell’s equations. A point of the systemis identified by the location x of its projection on the referencesurface, and its coordinate ξ along the normal n to the referencesurface. Surfaces ξ = ξ±i (x, t) define the bottom and top sides ofthe electrodes, so that the thickness of the dielectic membraneis h = ξ−1 − ξ+2 , and the thicknesses of the top and bottom
electrodes are ξ+1 − ξ−1 and ξ+2 − ξ
−2 respectively, both supposed
to be equal to he in the section 3.2.
Each point in the volume of the membrane isidentified by a point x on the reference surface and analtitude ξ, see figure A1. For an arbitrary vector fielda(x, ξ) in this volume, a‖(x, ξ) denotes its projectionon the tangent plane to the reference surface at locationx.
The equations will be expressed using surfaceoperators: the notation ∇sa refers to the surfacegradient of a scalar field a, defined as the projectionof ∇a on the tangent plane to the reference surface,and ∇s · a refers to the surface divergence of a vectorfield a, defined as the divergence of a‖. Assuming thatthe thickness of the membrane is much smaller thanthe radius of curvature of the reference surface, thefollowing relation holds:
∇ = ∇s +∂
∂ξn . (A.1)
Appendix A.1. Integration of Gauss’s law
Using Eq. (A.1), the integration of Gauss’s law (6a)from the reference surface to the outer boundary ofthe top electrode reads:∫ ξ+1
0
∇s ·Ddξ +
∫ ξ+1
0
∂D
∂ξdξ · n =
∫ ξ+1
0
ρdξ . (A.2)
Note that the interval of integration includes theinterface where D ·n was assumed to be discontinuous.The jump of D, related to the charge density ρ, is
expressed by the second member. Given that thereare charges only in the electrode, Eq. (A.2) is thenrewritten as: ∫ ξ+1
0
∇s ·Ddξ −D⊥ = σ , (A.3)
where σ is the surface charge density of the topelectrode defined as:
σ =
∫ ξ+1
ξ−1
ρdξ , (A.4)
and D⊥ is the normal component of the electricdisplacement in the membrane, which does not dependon ξ as seen in Eqs. (9) and (10). The normalcomponent of the electric field in the membrane ismuch larger than its tangential component both in theelectrode and in the membrane and, in addition, themembrane radius is much larger that its thickness sothe first term of Eq. (A.3) is negligible compared tothe second one. Finally, combining Eqs. (A.3), (9) and(10) gives the expression of the surface charge densityas a function of the electrode potentials Eq. (12).
The same procedure applied to the bottomelectrode shows that its surface charge density is −σ.
Appendix A.2. Integration of the charge balance
Integrating the charge balance equation (6b) over thethickness of the top electrode reads:∫ ξ+1
ξ−1
∇s · idξ +
(∫ ξ+1
ξ−1
∂i
∂ξdξ
)· n +
∫ ξ+1
ξ−1
∂ρ
∂tdξ = 0 .
(A.5)
Using the Leigniz integral rule to express the terms ofthis equation yields:
∇s ·
(∫ ξ+1
ξ−1
idξ
)− i(ξ+
1 ) ·(∇sξ
+1 − n
)+ i(ξ−1 ) ·
(∇sξ
−1 − n
)+∂
∂t
(∫ ξ+1
ξ−1
ρdξ
)
− ρ(ξ+1 )∂ξ+
1
∂t+ ρ(ξ−1 )
∂ξ−1∂t
= 0 . (A.6)
As neither the dielectric membrane nor thesurrounding air can conduct free charges, the boundaryconditions for the current on the top and bottomsurfaces of the electrode read i′(ξ±1 ) · n±1 = 0, thatis: [
i(ξ±1 )− ρ(ξ±1 )v(ξ±1 )]·(n−∇sξ
±1
)= 0 . (A.7)
Moreover, the normal velocity of the interfaces reads:
v(ξ±1 ) · n =∂ξ±1∂t
+ v(ξ±1 ) ·∇sξ±1 , (A.8)

Coupling between voltage distribution and vibrations in dielectric elastomers 12
so the boundary conditions (A.7) become:
i(ξ±1 ) ·(n−∇sξ
±1
)− ρ(ξ±1 )
∂ξ±1∂t
= 0 . (A.9)
Introducing these boundary conditions in the chargebalance (A.6) cancels all the boundary terms, so thisequation finally gives Eq. (11), where σ is the surfacecharge density defined by Eq. (A.4), and the surfacecurrent density on the top electrode
j1 =
∫ ξ+1
ξ−1
i‖dξ , (A.10)
has been introduced.
Appendix A.3. Integration of Ohm’s law
In this work, we are interested in the voltagedistribution on the electrodes, which is related tothe charges’ in-plane motion. The slowing down ofthis motion, due to the resistivity of the electrodes,is described by Ohm’s law. Since the significantcomponent of the charges’ motion is the tangential one,Ohm’s law (8) is projected on the tangent plane to thereference surface:
i‖ − ρv‖ =1
reE‖ . (A.11)
As in the precedent paragraphs, let us examinethe case of the top electrode. The electric field isthere given by the surface gradient of the potential u1
and is uniform in the electrode thickness. IntegratingEq. (A.11) over the electrode thickness yields:∫ ξ+1
ξ−1
i‖dξ −∫ ξ+1
ξ−1
ρv‖dξ = −∇su1
∫ ξ+1
ξ−1
1
redξ . (A.12)
In order to recognize in the second term the surfacecharge σ defined by Eq. (A.4), we further assume thatthe tangential velocity v‖ does not depend on ξ in theelectrodes. This tangential velocity is denoted by v1‖and v2‖ in the top and bottom electrodes respectively.The surface Ohm’s law (A.12) is then simplified to yieldEq. (13), where j1 is the surface current defined byEq. (A.10), and the surface conductivity of the topelectrode
γ1 =
∫ ξ+1
ξ−1
1
redξ , (A.13)
has been introduced.
References
[1] Ron Pelrine, Roy Kornbluh, Qibing Pei, and Jose Joseph.High-Speed Electrically Actuated Elastomers with StrainGreater Than 100%. Science, 287(5454):836–839,February 2000.
[2] Yu Feng Goh, Samin Akbari, Tran Vy Khanh Vo, andSoo Jin Adrian Koh. Electrically-Induced Actuation ofAcrylic-Based Dielectric Elastomers in Excess of 500%Strain. Soft Robotics, 5(6):675–684, December 2018.
[3] Samuel Rosset, Benjamin M O’Brien, Todd Gisby, DanielXu, Herbert R Shea, and Iain A Anderson. Self-sensingdielectric elastomer actuators in closed-loop operation.Smart Materials and Structures, 22(10):104018, October2013.
[4] Kwangmok Jung, Kwang J. Kim, and Hyouk Ryeol Choi.A self-sensing dielectric elastomer actuator. Sensors andActuators A: Physical, 143(2):343–351, May 2008.
[5] Weili Hu, Xiaofan Niu, Ran Zhao, and Qibing Pei.Elastomeric transparent capacitive sensors based onan interpenetrating composite of silver nanowires andpolyurethane. Applied Physics Letters, 102(8):083303,February 2013.
[6] Todd A. Gisby, Benjamin M. O’Brien, and Iain A.Anderson. Self sensing feedback for dielectric elastomeractuators. Applied Physics Letters, 102(19):193703, May2013.
[7] Peter Sommer-Larsen, Jacob C. Hooker, Guggi Kofod,Keld West, Mohammed Benslimane, and Peter Gravesen.Response of dielectric elastomer actuators. In YosephBar-Cohen, editor, SPIE’s 8th Annual InternationalSymposium on Smart Structures and Materials, page157, Newport Beach, CA, USA, July 2001.
[8] N. C. Goulbourne, E. M. Mockensturm, and M. I.Frecker. Electro-elastomers: Large deformation analysisof silicone membranes. International Journal of Solidsand Structures, 44(9):2609–2626, May 2007.
[9] Christoph Keplinger, Martin Kaltenbrunner, Nikita Arnold,and Siegfried Bauer. Capacitive extensometry fortransient strain analysis of dielectric elastomer actuators.Applied Physics Letters, 92(19):192903, May 2008.
[10] Daniel Xu, Silvain Michel, Thomas McKay, BenjaminO’Brien, Todd Gisby, and Iain Anderson. Sensingfrequency design for capacitance feedback of dielectricelastomers. Sensors and Actuators A: Physical, 232:195–201, August 2015.
[11] Daniel Xu, Andreas Tairych, and Iain A Anderson. Stretchnot flex: Programmable rubber keyboard. SmartMaterials and Structures, 25(1):015012, January 2016.
[12] W. Kaal, S. Herold, and T. Melz. Modeling approaches forelectroactive polymers. In Yoseph Bar-Cohen, editor,SPIE Smart Structures and Materials + NondestructiveEvaluation and Health Monitoring, page 764211, SanDiego, California, USA, March 2010.
[13] Christian Graf and Jurgen Maas. In-Plane Field Propaga-tion in EAP Transducers Based on the Equivalent Net-work Method. In Volume 1: Development and Charac-terization of Multifunctional Materials; Modeling, Sim-ulation and Control of Adaptive Systems; StructuralHealth Monitoring, page 207, Stone Mountain, Georgia,USA, September 2012. ASME.
[14] Thorben Hoffstadt, Philip Meier, and Jurgen Maas. Mod-eling Approach for the Electrodynamics of MultilayerDE Stack-Transducers. In Volume 1: MultifunctionalMaterials; Mechanics and Behavior of Active Materials;Integrated System Design and Implementation; Struc-tural Health Monitoring, page V001T02A015, Stowe,Vermont, USA, September 2016. ASME.
[15] Thorben Hoffstadt and Jurgen Maas. Self-SensingControl for Soft-Material Actuators Based on DielectricElastomers. Frontiers in Robotics and AI, 6, 2019.
[16] G Rizzello, M Hodgins, D Naso, A York, and S Seelecke.Modeling of the effects of the electrical dynamics onthe electromechanical response of a DEAP circularactuator with a mass–spring load. Smart Materials andStructures, 24(9):094003, September 2015.
Coupling between voltage distribution and vibrations in dielectric elastomers 13
[17] G Rizzello, D Naso, A York, and S Seelecke. Closed loopcontrol of dielectric elastomer actuators based on self-sensing displacement feedback. Smart Materials andStructures, 25(3):035034, March 2016.
[18] Kimberly Pope, Alyson Tews, Mary I. Frecker, EricMockensturm, Nakhiah C. Goulbourne, and Alan J.Snyder. Dielectric elastomer laminates for activemembrane pump applications. In Smart Structuresand Materials 2004: Electroactive Polymer Actuatorsand Devices (EAPAD), volume 5385, pages 60–68.International Society for Optics and Photonics, July2004.
[19] Naoki Hosoya, Hiroaki Masuda, and Shingo Maeda.Balloon dielectric elastomer actuator speaker. AppliedAcoustics, 148:238–245, May 2019.
[20] Richard Heydt, Ron Pelrine, Jose Joseph, Joseph Eckerle,and Roy Kornbluh. Acoustical performance of anelectrostrictive polymer film loudspeaker. The Journalof the Acoustical Society of America, 107(2):833–839,2000.
[21] J. W. Fox and N. C. Goulbourne. Electric field-inducedsurface transformations and experimental dynamic char-acteristics of dielectric elastomer membranes. Journal ofthe Mechanics and Physics of Solids, 57(8):1417–1435,August 2009.
[22] Emil Garnell, Corinne Rouby, and Olivier Doare. Dynamicsand sound radiation of a dielectric elastomer membrane.Journal of Sound and Vibration, 459:114836, October2019.
[23] Samuel Rosset, Oluwaseun A. Araromi, Samuel Schlatter,and Herbert R. Shea. Fabrication Process of Silicone-based Dielectric Elastomer Actuators. Journal ofVisualized Experiments : JoVE, (108), February 2016.
[24] C Graf and J Maas. A model of the electrodynamic fielddistribution for optimized electrode design for dielectricelectroactive polymer transducers. Smart Materials andStructures, 21(9):094001, September 2012.
[25] A. Kovetz. Electromagnetic Theory. Oxford UniversityPress, Oxford, New York, March 2000.
[26] Ursula van Rienen, Jurgen Flehr, Ute Schreiber, andVictor Motrescu. Modeling and Simulation of Electro-Quasistatic Fields. In Kurt Antreich, Roland Bulirsch,Albert Gilg, and Peter Rentrop, editors, Modeling,Simulation, and Optimization of Integrated Circuits,ISNM International Series of Numerical Mathematics,pages 17–31. Birkhauser Basel, 2003.
[27] Takehiro Sugimoto, Kazuho Ono, Akio Ando, YuichiMorita, Kosuke Hosoda, and Daisaku Ishii. Semicylin-drical acoustic transducer from a dielectric elastomer filmwith compliant electrodes. The Journal of the AcousticalSociety of America, 130(2):744–752, 2011.
[28] Jian Zhu, Shengqiang Cai, and Zhigang Suo. Nonlinearoscillation of a dielectric elastomer balloon. PolymerInternational, 59(3):378–383, March 2010.
[29] Jian Zhu, Shengqiang Cai, and Zhigang Suo. Resonant be-havior of a membrane of a dielectric elastomer. Inter-national Journal of Solids and Structures, 47(24):3254–3262, December 2010.
[30] Chongjing Cao, Thomas L. Hill, Bo Li, Lei Wang, andXing Gao. Nonlinear dynamics of a conical dielectricelastomer oscillator with switchable mono to bi-stability.International Journal of Solids and Structures, pageS0020768320300512, February 2020.
[31] Emil Garnell, Olivier Doare, and Corinne Rouby. Coupledvibro-acoustic modeling of a dielectric elastomer loud-speaker. The Journal of the Acoustical Society of Amer-ica, 147(3):1812–1821, March 2020.
[32] A. N. Gent. A New Constitutive Relation for Rubber.Rubber Chemistry and Technology, 69(1):59–61, March1996.
[33] David J Ewins. Modal Testing: Theory and Practice,volume 15. Research studies press Letchworth, 1984.
[34] Richard Heydt, Roy Kornbluh, Joseph Eckerle, andRon Pelrine. Sound radiation properties of dielectricelastomer electroactive polymer loudspeakers. In SmartStructures and Materials 2006: Electroactive PolymerActuators and Devices (EAPAD), volume 6168, page61681M, San Diego, California, USA, March 2006.International Society for Optics and Photonics.
[35] Naoki Hosoya, Shun Baba, and Shingo Maeda. Hemi-spherical breathing mode speaker using a dielectric elas-tomer actuator. The Journal of the Acoustical Societyof America, 138(4):EL424–EL428, October 2015.
[36] Christoph Keplinger, Jeong-Yun Sun, Choon Chiang Foo,Philipp Rothemund, George M. Whitesides, and ZhigangSuo. Stretchable, Transparent, Ionic Conductors.Science, 341(6149):984–987, August 2013.