Resistance and biomass in Arabidopsis: a new...
57
Canet et al, 1 Resistance and biomass in Arabidopsis: a new model for Salicylic acid perception. Juan Vicente Canet, Albor Dobón, Federico Ibáñez, Lorena Perales, and Pablo Tornero. Instituto de Biología Molecular y Celular de Plantas, UPV-CSIC. Avda. de los Naranjos, s/n, 46022, Valencia, Spain All proofs and correspondence should be sent to: Pablo Tornero [email protected] Phone: (+34)963879377 Fax (+34)963877859 IBMCP(UPV-CSIC) Avda. de los Naranjos s/n, 46022 Valencia (SPAIN) Juan Vicente Canet [email protected] Albor Dodón [email protected] Federico Ibáñez [email protected] Lorena Perales [email protected] Pablo Tornero [email protected] Running title: BTH and fitness in Arabidopsis Key words: Salicylic acid, BTH, NPR1, AXR3, Arabidopsis. Word count: 9612
Transcript of Resistance and biomass in Arabidopsis: a new...

Canet et al, 1
Resistance and biomass in Arabidopsis: a new model for Salicylic acid
perception.
Juan Vicente Canet, Albor Dobón, Federico Ibáñez, Lorena Perales, and Pablo
Tornero.
Instituto de Biología Molecular y Celular de Plantas, UPV-CSIC. Avda. de los
Naranjos, s/n, 46022, Valencia, Spain
All proofs and correspondence should be sent to:
Pablo Tornero
Phone: (+34)963879377 Fax (+34)963877859
IBMCP(UPV-CSIC) Avda. de los Naranjos s/n,
46022 Valencia (SPAIN)
Juan Vicente Canet [email protected]
Albor Dodón [email protected]
Federico Ibáñez [email protected]
Lorena Perales [email protected]
Pablo Tornero [email protected]
Running title: BTH and fitness in Arabidopsis
Key words: Salicylic acid, BTH, NPR1, AXR3, Arabidopsis.
Word count: 9612

Canet et al, 2
Summary.
Salicylic acid (SA) is an essential hormone for plant defence and development.
SA perception is usually measured by counting the number of pathogens that
grow in planta upon an exogenous application of the hormone. We propose a
biological SA perception model based on plant fresh weight reduction caused
by disease resistance in Arabidopsis thaliana. This effect is more noticeable
when a chemical analogue of SA is used, such as Benzothiadiazole (BTH). By
spraying BTH several times, a substantial difference in plant biomass is
observed when compared with the mock treatment. This difference is dose-
dependent and does not require pathogen inoculation. The model is robust and
allows for the comparison of different Arabidopsis ecotypes, recombinant
inbreed lines, and mutants. Our results show that two mutants, non-expresser
of pathogenesis-related genes 1 (npr1) and auxin resistant 3 (axr3), fail to lose
biomass when BTH is applied. Further experiments showed that axr3 responds
to SA and BTH in terms of defence induction. NPR1-related genotypes also
confirm the pivotal role of NPR1 in SA perception, and suggest an active
program of depletion of resources in the infected tissues.

Canet et al, 3
Introduction.
Plants possess a sophisticated defence system that is triggered depending on
the nature of the pathogen. Some plant defences are specialized in
necrotrophic pathogens (van Kan 2006) while others are effective against
biotrophic pathogens (Bent and Mackey 2007). Salicylic acid (SA) is a key
molecule in the triggering of plant defences against biotrophs. SA is also
relevant for some developmental events (e.g. Vanacker et al. 2001 and
Martinez et al. 2004). Despite its importance in defence, little is still known
about this hormone. In Arabidopsis (Arabidopsis thaliana) there are transgenic
lines have been developed that degrade SA (NahG, Friedrich et al. 1995) while
others produce more SA (c-SAS and p-SAS, Mauch et al. 2001). There are also
two mutants impaired in SA biosynthesis, such as eds5/sid1 (Nawrath et al.
2002) and sid2/ics1 (Wildermuth et al. 2001). Additionally, there are other
mutants with less SA, e.g. eds1 and pad4 (Wiermer et al. 2005). SA
biosynthesis is under a positive feedback loop; SA triggers the expression of
EDS1 and PAD4, and these genes are required for the expression of the SA
biosynthetic genes. The metabolism of SA is also under control (Shah 2003).
Most of the SA present in the plant is conjugated with glucose, forming a pool of
temporary inactive SA that can be slowly released in an active form (Nawrath et
al. 2005).
The scientific community has made an important effort to find the SA receptor.
NPR1 is the only known gene that, when mutated, renders plants insensitive to
SA, and yet it is not clear if it is the receptor itself. It has been found in at least
four different screenings (Cao et al. 1994, Delaney et al. 1995, Glazebrook et al.

Canet et al, 4
1996, and Shah et al. 1997), which indicates the essential role played by this
gene in SA perception. NPR1 has shown to accumulate in the cytosol and
migrate to the nucleus upon SA perception. In the proposed model, SA triggers
the expression of a thioredoxin that acts over NPR1 oligomers, rendering
monomers that migrate to the nucleus (Tada et al. 2008). NPR1 is degraded by
the proteosome in the nucleus, a process that is required for activation of
defence when SA is present (Spoel et al. 2009).
In parallel with the search for mutants, other biochemical approaches aimed at
searching for proteins with SA binding. While some of the candidates have a
strong affinity (Kumar and Klessig 2003) it is likely that none of them is a
conventional SA receptor, if such a thing exists.
An intriguing feature of plant defences is the resulting loss of fitness (Heil 2002).
It may seem intuitive that, upon a pathogen insult, the plant produces toxic
compounds that negatively affect the plant, but other mechanisms can be
proposed. For example, the plant may prioritize defence vs. development,
redirecting all available resources to stop invasion. A third option is a “scorching
earth defence”, i.e. the tissue where the pathogen is perceived is deprived of
nutrients. SA negatively regulates the effect of the auxins, and this hormone is a
good candidate to be the vehicle used to reduce plant development when a
strong defence is triggered (Wang, D. et al. 2007a).
In order to find the genes required for SA perception and its consequences, we
had to screen and accurately measure different Arabidopsis genotypes. The
exponential growth of the pathogens used (Katagiri et al. 2002) proved to be a
handicap. The relationship between plant defence and development is also

Canet et al, 5
affected by the presence of the pathogen in the system. Therefore, we have
developed a biological model for the perception of SA in Arabidopsis not based
on pathogen inoculation. Instead, we apply benzothiadiazole (BTH). BTH is a
biotechnological development of the research in plant defence (Lawton et al.
1996), a chemical analogous of SA that triggers plant defence and biomass loss
in a consistent and dose-dependent manner. With this system, we are capable
of analyzing the natural and artificial variations of Arabidopsis in response to
SA. Small variations were found in both cases. Arabidopsis ecotypes showed
no extreme behaviour, and only two mutants were selected, axr3-1 (A
semidominant allele, Ouellet et al. 2001) and npr1. Complementary experiments
demonstrated that axr3 can perceive SA, confirming the unique role of NPR1
and related genes. We also found that the presence of sni1 in the plant (Li et al.
1999) implies that NPR1 is relevant for a programmed down-regulation of plant
metabolism which could affect the pathogen.
Canet et al, 6
Results.
An experimental model for SA perception.
We are interested in unveiling the signal transduction that starts with salicylic
acid (SA) application to Arabidopsis, and results in the triggering of the plant
defences. The amounts of SA that trigger plant resistance are close to
phytotoxicity, and this is why BTH (Lawton et al. 1996) is commonly used in the
laboratory. BTH is a chemical analogous of SA with no phytotoxicity, and it is
commercialized under different names (Actigard® and BION® among others,
www.syngenta.com). The standard way of measuring SA perception is by a
western blot of a defence marker (i.e. PR2, Cao et al. 1997), or by monitoring
the growth of a inoculated pathogen, (e.g. Pseudomonas syringae pv tomato
DC3000 (Pto), Katagiri et al. 2002). Figure 1a shows the result of Pto
inoculation. Pto is able to grow several orders of magnitude more in mock-
treated plants than in BTH 350 µM treated plants. While the procedure of
inoculating and measuring Pto is straightforward (Tornero and Dangl 2001), it is
subject to important variations; small changes in the initial conditions can lead
to a lack of reproducibility. Besides, factors that affect pathogen growth also
affect Pto measurement. During the experiments, we noticed that BTH treated
plants have less biomass than mock-treated plants (Figure 1b). This fact has
been described in (Heil 2002) and it is indicated in the label of the commercial
product (www.syngenta.com). We repeated the experiments without pathogen
inoculation and obtained the same results (data not shown); a single 350 µM
application of BTH can reduce Arabidopsis biomass. Since a single treatment
lacks reproducibility and there was statistical overlapping between mock vs.

Canet et al, 7
BTH treated plants, we tried different applications and treatments. Briefly, we
applied BTH by imbibing, drenching, spraying, and in vitro culture (data not
shown). The optimal method consists of spraying BTH four times for two weeks
(see Experimental procedures) and recording plant weight when the plants are
three weeks old. No special limit was observed after four treatments; up to eight
treatments were applied during four weeks with no evident toxicity (data not
shown). Increasing the number of treatments improves the difference between
mock vs. BTH treated plants when the plants have enough room to grow. When
the treatment finished, Col-0 plants outgrew the treatment and were able to set
seeds.
The results are more clearly shown when the ratio between BTH and mock
treated plants is used (Figure 1c). Different BTH concentrations were used to
find the optimal option, starting with 350 µM (used in Figure 1a) and diluting by
a factor of 10. BTH concentrations higher than 3.5 µM still produced a
measurable effect on Arabidopsis biomass, whereas lower BTH concentrations
failed to differentiate mock and BTH treated plants. Therefore, 350 µM is the
standard BTH concentration or “High BTH”, and 350 nM the subclinical BTH
concentration or “Low BTH”.
Phenotypes of the model
The differences in plant biomass caused by High BTH are numerically
significant, corresponding to the strong phenotype of Figure 2a. Figure 2a
shows Col-0 treated with mock (left) and High BTH (right); observe the
difference in plant size, while the number of leaves is similar. Therefore, a visual

Canet et al, 8
inspection can discern in most cases whether a genotype responds or not to
BTH. This is a simple way to evaluate SA perception and characterize the
response to BTH in the ecotype Col-0. There were no observable macroscopic
plant lesions, so we checked for microscopic lesions. Trypan blue staining
pinpoints cell death and membrane damage (and fungi if present, Keogh et al.
1980). Figure 2b, c and d show the Trypan Blue staining of cotyledons from
plants treated with mock, Low BTH, and High BTH respectively. While
subclinical BTH concentrations produced no measurable effects, standard
amounts of BTH triggered program cell death in a small number of cells.
Callose depositions are a hallmark of defence induction, and are easily seen
with aniline blue under ultraviolet light (Conrath et al. 1989). Therefore,
cotyledons of mock, Low BTH, and High BTH treated plants were stained with
aniline blue (Figure 2e, f, and g, respectively. Figure 2h, i and j show the same
cotyledons exposed to visible light). The result is that mock and subclinical BTH
concentrations do not produce callose deposition. Standard BTH
concentrations, on the other hand, produce abundant callose depositions, of
several sizes and distributions. A 3.3' diaminobenzidine stain showed no
difference in Reactive Oxygen Species (ROS) at the time of the sampling (data
not shown).
SA is a hormone with a fine-regulated homeostasis. Thus, there is evidence of a
positive feedback loop in SA synthesis and of negative regulation upon SA
perception (Shah 2003). A plausible explanation of BTH effects on biomass is
that it sets in motion a feedback loop that runs unchecked. To verify this
hypothesis, the amounts of SA (free and total) in mock, Low BTH, and High

Canet et al, 9
BTH treated plants were measured (Figure 3a). Low BTH induced a small and
reproducible increase in the amount of total and free SA (all these values are in
agreement with reported concentrations (Defraia et al. 2008)), while High BTH
produced a decrease in free SA and a strong decrease in the total amount of
SA. The subclinical amounts of BTH do not induce the expression of the marker
PR1 (Figure 3b), a standard stress marker (Uknes et al. 1992), nor enough
resistance to be detected in Pto growth curves (data not shown). Standard BTH
concentrations induced a strong PR1 expression, even if the western blot was
repeated with only mock and subclinical BTH treatments to avoid a possible
signal masking due to the strong High BTH signal (data not shown).
Natural variation and SA perception.
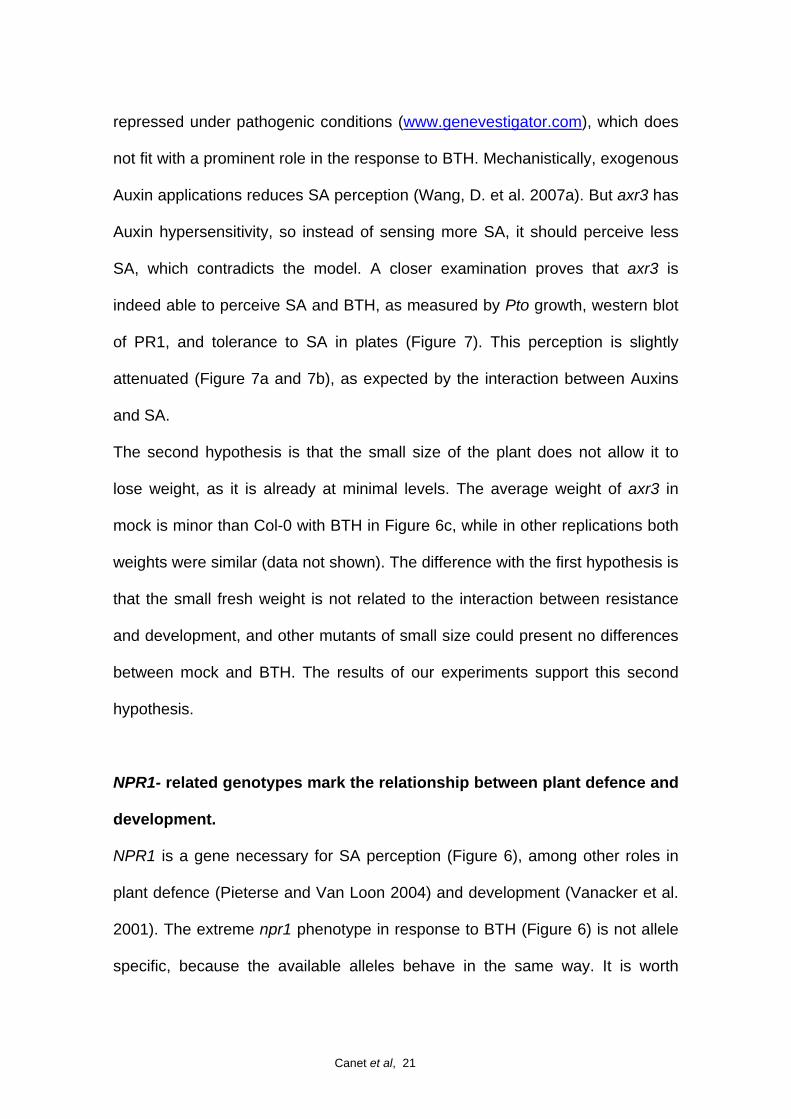
Once the right conditions were set, we evaluated if Col-0 was the best ecotype
to work with. Figure 4 shows the analysis of two sets of ecotypes and Col-0.
Figure 4a corresponds to a nuclear core collection of 48 ecotypes (McKhann et
al. 2004), while Figures 4b and c shows a set of 96 ecotypes (Nordborg et al.
2005). Col-0 is a valid representative of the ecotypes tested; in the three panels
it ranked in the middle of the ecotypes (between 40th and 56th percentiles) when
ordered by percentage of plant fresh weight (PFW). Some ecotypes like Col-0,
Ws-0, Laer-0 and No-0 were repeated with different stocks (e.g., Col-3, Col-4,
Col-5, etc), because they are the background of mutations or are used for
mapping. None of them behaved differently (data not shown).
Another option in Natural Variation is to search for quantitative trait locus
(QTLs) in mapping populations. This can be done even if the parentals have a

Canet et al, 10
similar behaviour, a phenomena called transgression (Koornneef et al. 2006).
We analyzed seven recombinant inbreed lines (RILs) available at the beginning
of this research searching for transgression. The RILs were: Col-0 x Nd-1
(Deslandes et al. 1998), Col-gl1 x Kas-1 (Wilson et al. 2001), Cvi-1 x Laer-2
(Alonso-Blanco et al. 1998), Laer-0 x Sha-0 (Clerkx et al. 2004), Bay-0 x Sha-0
(Loudet et al. 2002), Col-4 x Laer-0 (Lister and Dean 1993), and Laer-0 x No-0
(Magliano et al. 2005) (Figure 5 and data not shown). There are three QTLs
detected only in the fresh weight of the mock-treated plants (Colgl1 x Kas-1,
Laer-0 x Sha-0 and Laer-0 x No-0, Figure 5b, d and e, respectively). There is,
however, no significant QTL specific of the response to BTH in terms of fresh
weight.
Most signal transductions do not affect SA perception.
The next step was to analyze the wealth of information generated in the form of
mutants. SA biosynthesis is regulated by a positive feedback loop, so the first
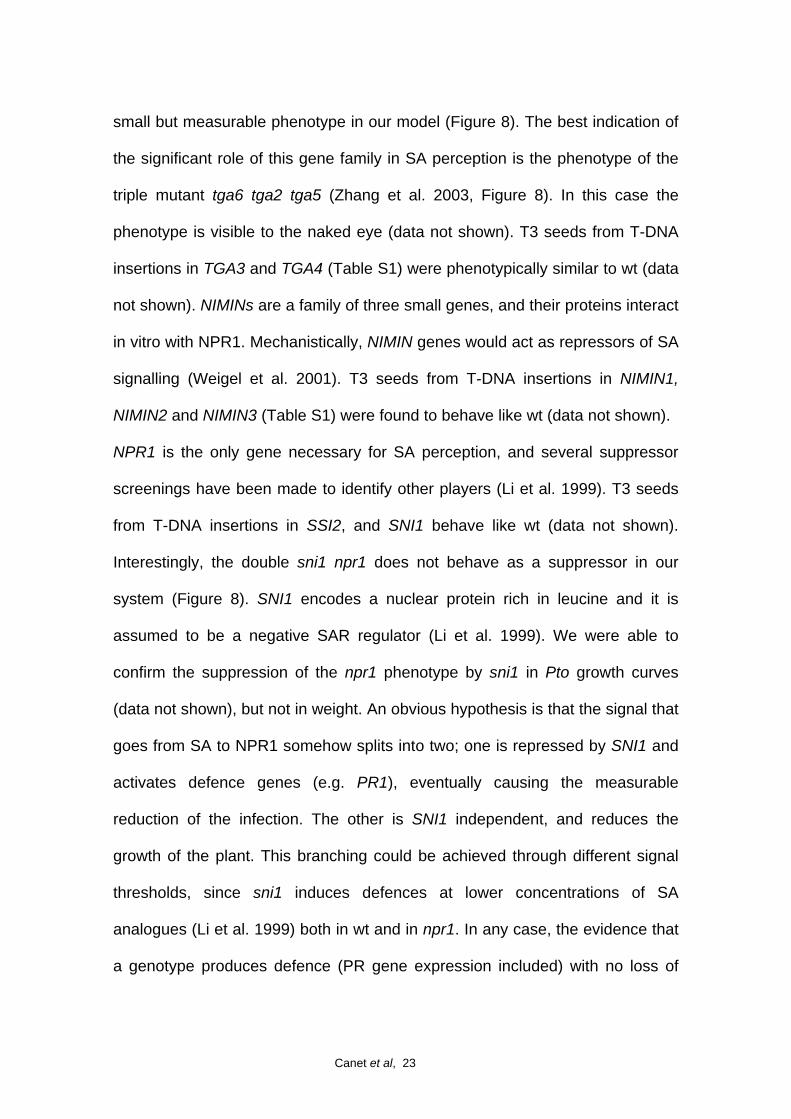
objective was to analyze the mutations related to SA. Thus, we assayed the
mutant that failed to perceive SA; npr1, mutants of SA biosynthesis; eds5 and
sid2, transgenic lines with altered SA content (NahG less SA, and c-SAS more
SA); and mutants with a down regulation of SA biosynthesis, eds1 and pad4
(Figure 6a). Only npr1 failed to respond to SA. This clear result prompted us to
keep npr1 as a negative control, and to extend the list of mutants in defence
(Figure 6a and b). Then, we tested mutants in basal resistance (either more
resistant or more susceptible), Systemic Acquired Resistance (SAR), specific

Canet et al, 11
resistance, and non-host resistance. None of the tested mutants in defence,
except npr1, differed from the wild type (wt) in their response to BTH.
SA signal transduction has been reported to crosstalk with several signal
transductions (Lopez et al. 2008), Jasmonic Acid, Ethylene, Abscisic Acid,
Auxins, Light and ROS being the most commonly cited. Therefore, the response
to BTH of a representative set of mutants in each of these pathways was
measured. For the Auxin pathway, nineteen mutants were tested (Figure 6c),
and only axr3 did not respond to BTH in a consistent manner. Note that the
allele used in this work is axr3-1, a semidominant mutation that enhances the
stability of the protein (Ouellet et al. 2001). Mutants in other pathways, like Light
(Figure 6c), Abscisic Acid (Figure 6d), Ethylene (Figure 6d), ROS (Figure 6d) or
Jasmonic Acid and/or response to necrotrophs (Figure 6e), had a similar
response to BTH as wt. A complete list of the mutants tested is provided in
Table S1.
axr3 and npr1 show a distinct response to SA.
The conclusion of Figure 6 and other data not presented is that from a total of
98 mutants tested, only two did not respond to BTH; npr1 and axr3. NPR1 is a
gene clearly involved in SA perception, but the result of axr3 was unexpected.
While it is tempting to discard axr3 due to the small size of this mutant, other
small mutants like cpr1 (Bowling et al. 1994), show percentages of fresh weight
in the same order of magnitude as the wt (Figure 6a). Therefore, a detailed
characterization of axr3 in terms of response to SA and BTH was performed.
Figure 7a shows Pto growth in Col-0, npr1 and axr3 pretreated with mock or

Canet et al, 12
High BTH. Clearly, BTH is able to trigger defence in axr3, as opposed to the
effect caused in npr1. The levels of the PR1 protein were determined by
western blot (Figure 7b) in plants either treated with mock or BTH 350 µM and
basically showed the same results; while npr1 fails to induce this defence
marker upon High BTH, axr3 is able to increase the expression of this defence
protein. Note that in axr3 plants there is a small but detectable amount of PR1
even in the mock treatment.
An interesting feature of mutations in npr1 is that it fails to regulate the levels of
SA (Cao et al. 1997). When growing npr1 in MS plates supplemented with SA
500 µM, the cotyledons are bleached and the plant is unable to grow (Figure
7c). The easiest interpretation is that npr1 fails to perceive SA, and therefore is
unable to trigger SA degradation and SA accumulation has deleterious effects.
Col-0 and axr3 plants, in the other hand, grow in plates containing SA 500 µM
(Figure 7c).
npr1-related genes and SA perception
Then we focused on npr1 and related genes. The previous experiments were
repeated with npr1-1, but there are eleven alleles of npr1 (Cao et al. 1994,
Delaney et al. 1995, Glazebrook et al. 1996, and Shah et al. 1997). We assayed
four of them (Figure 8), and -with some variation- all the alleles tested show no
response to BTH in terms of PFW. There are no mutants with an increasing
sensitivity to SA; therefore the next best candidates are the transgenics that
overexpress NPR1. 35S:NPR1 is an overexpression of NPR1, and the plants
can perceive BTH more strongly, as reported in the literature (Cao et al. 1998).

Canet et al, 13
35S:NPR1:HBD is a version of NPR1 fused to the glucocorticoid receptor in a
npr1 background (Wang, D. et al. 2005). The result is a protein not subjected to
the nuclear vs. cytoplasm traffic, vital to its function in SA perception (Dong
2004). Figure 8 shows that the mere presence of NPR1 in the cytosol is not
enough to trigger response to BTH and the nuclear localization is required.
There are five genes in Arabidopsis with a high homology to NPR1 (Liu et al.
2005). NPR3 and NPR4 have been reported to play a key role in plant defence
(Zhang et al. 2006) and mutations in BOP1 and BOP2 affect the identity of the
floral organs and the shape of the leaves (Ha et al. 2007; McKim et al. 2008).
Plants from these two double mutants respond to BTH in the same way as in wt
(Figure 8).
Regarding its biochemistry, NPR1 has been shown to interact in yeast two-
hybrid with two sets of proteins, TGAs (Zhang et al. 1999) and NIMINs (Weigel
et al. 2001), and in vivo with some of them. T-DNA insertions in TGA1 and
TGA7 show small but consistent differences between these mutants and wt in
their response to BTH (Figure 8). This small effect is more noticeable when a
triple mutant tga6 tga2 tga5 is used (Zhang et al. 2003), and the plants show an
intermediate macroscopic phenotype (data not shown).
The npr1 phenotypes are quite straightforward, which has lead to a number of
suppressor screenings. One of these suppressors is sni1 (Li et al. 1999), and
the double sni1 npr1 regains the ability to activate defences upon BTH
application. Interestingly, the double sni1 npr1 does not behave as a suppressor
in our system (Figure 8). We also tested T3 seeds from insertions in the
homolog NPR2, the interactors NIMIN1, NIMIN2, NIMIN3, TGA3 and TGA4 and

Canet et al, 14
the suppressors SSI2 (Shah et al. 2001) SON1 (Kim and Delaney 2002), and
SNI1 but no npr1-like phenotype was observed in the segregating families (data
not shown).

Canet et al, 15
Discussion
SA perception and plant fitness
Salicylic acid is a necessary hormone in plants for full resistance against
biotrophic pathogens such as Pto. While the amount of SA can be measured in
the laboratory (Defraia et al. 2008), for the quantification of SA perception we
usually rely on the growth of the pathogen we are interested to start with. This is
a potential circular problem, since we use a tool to answer a question that
affects the tool.
Another potential problem is the nature of the pathogen. Pathogens like Pto
grow exponentially, and small differences in the input lead to considerable
differences in the output. There are alternatives, like immunodetection of
defence markers (Uknes et al. 1992, Figures 2 and 7), or measurement of
phytoalexin accumulation (Glazebrook and Ausubel 1994). These alternatives
can produce quantitative data, but are not suitable for high throughput assays.
One side effect of several resistances is their negative effect on plant fitness
(Heil 2002). In general, the more resistant an individual is, the less fit it is to
compete when the pathogen is not present. There are several hypotheses to
explain this fact. The first is that, since the plant produces molecules that
eventually stop the growth of the pathogen, it is plausible that the same
molecules affect the plant. Other alternative is an economic consideration; the
triggering of the defence genes involves the use of resources that have to be
obtained from normal plant growth. A somewhat related argument is the
“scorching earth” defence, where by turning basal metabolism down, the plant
negates the pathogen the nutrients that it requires.
Canet et al, 16
Resistance and fresh weight are inversely correlated
In the case of BTH, a single application can produce measurable effects in
terms of plant fresh weight (Figure 1b). This subtle effect measured four days
after a single BTH treatment was optimized for measurement and screen. While
different ways of applying BTH produce visible differences, the best condition
for our goals is to spray the plants with BTH four times on separated dates (see
Experimental procedures). This procedure provides us with an accurate
quantification of genotypes such as the mutants and ecotypes described above
(Figure 1c). But most importantly, it gives us a screen (Figure S1) that can be
used to search for new mutants in a high-throughput fashion. In principle, this
model is analogous to screen for mutants in auxin perception with plates of 2,4-
D (Maher and Martindale 1980). 2,4-D is more stable and have a stronger effect
in the plant that the endogenous auxin, like BTH vs. SA. The main differences
are that BTH does not work in plates, and it is not lethal. But in both cases we
can recover mutations impaired in the perception of the hormone by using an
analogue and a set of extreme conditions (Mockaitis and Estelle 2008).
In order to use the biological model, several steps have to be taken. First we
need to characterize plant response in terms of macroscopic, microscopic and
molecular phenotypes, to be sure that the observed effects on fresh weight
correspond to the activation of plant defences. Second is the ecotype to be
used, because Col-0 may not be the best background. And thirdly, there is the
question of genetic specificity; the biological model proposed should not
mislabel mutants that affect the growth of the pathogen as a mutant in SA

Canet et al, 17
perception (e.g. cpr1, Figure 6a), and it should correctly label npr1 as defective
in SA perception.
The response to BTH in terms of PFW is dose-dependent (Figure 1c). The
highest BTH concentration tested is 350 µM, a concentration frequently used in
Arabidopsis (Lawton et al. 1996). To put it in context, this corresponds to
approximately nine times the dose recommended in tomato for Pto infection
(www.epa.gov), but it is six times lower than SA concentrations used in
Arabidopsis (2 mM, e.g. Aviv et al. 2002). The loss of fresh weight can be
detected as low as 3.5 µM, but not at 350 nM. Low BTH is unable to trigger cell
death or callose deposition (Figure 2c and f). High BTH, on the other hand, is
able to cause cell death in a small number of cells (Figure 2d), as also reported
in the literature for SAR (Alvarez et al. 1998) and labelled as micro-HRs. While
a plausible hypothesis was that these micro-HR sites are similar, we did not
observe any oxidative burst (data not shown). It is therefore possible that the
micro-HRs are different, and while in SAR they are caused by oxidative burst,
the cell death shown in Figure 2d is caused by other effector. Another
alternative is that in our model a transient oxidative burst occurs immediately
after the treatments, but it disappears when the tissue is stained (5 days after
the last treatment). In any case, the small number of cell deaths observed does
not account for the difference in PFW, and it seems an effect rather than a
cause of resistance. While it has been reported that BTH by itself does not
strongly trigger callose depositions (Kohler et al. 2002), a second mock
treatment after BTH had the ability to do so. Consistently with this result, (we

Canet et al, 18
sprayed the plant several times), there is a strong callose staining with High
BTH.
The next step was to analyze the molecular events that occur in this system.
The amount of SA is under the control of feedback loops, positive in SA
biosynthesis and negative in SA accumulation (Shah 2003). Therefore, it was
relevant to measure the amount of SA in this system. High BTH produced a
strong reduction in the amount of total SA (Figure 3a). There is a small
reduction in the amount of free SA, but it is clear that the plant responded to
High BTH with a reduction of the conjugated form of SA (mainly glucoside)
(Nawrath et al. 2005). Therefore, this constitutes additional evidence in favour
of a negative feedback loop that regulates the accumulation of SA. The other
piece of evidence is the amount of SA in npr1 (Cao et al. 1997). This mutant
has more SA than the wt, both in mock and pathogen-inoculated plants.
Another form of this phenotype is the low tolerance of npr1 plants to SA in vitro
(Figure 7c). It can not detect SA, and therefore it can not avoid SA accumulation
and toxicity.
The detection of the defence marker PR1 (Figure 3b) and Pto growth (Figure 1a
and data not shown) confirm that fresh weight loss and disease defence are
closely correlated, as low concentrations that do not produce fresh weight loss,
do not trigger defence. Correspondingly, high concentrations are able to
produce both phenotypes.

Canet et al, 19
SA perception in natural variation
Before starting the search for new mutants, the best genotype has to be
chosen. Col-0 is the ecotype most widely used for mutant screening
(www.arabidopsis.org), but it could be an extreme ecotype in response to BTH.
Figure 4 shows that Col-0 is a representative Arabidopsis ecotype, because it
ranks between the 40th and 56th percentile among the collections tested.
Another reason for these experiments was to search for natural variation, but
there is no extreme ecotype in the response to BTH.
We also searched for transgression in seven RILs (Figure 5 and data not
shown), but found none. The three QTLs found are only relevant to the
differences in growth when a mock treatment is applied, but there is no
difference in the response to BTH. This does not mean that there are not
variations in the SA response (van Leeuwen et al. 2007), but with the
populations and system under study, none was both significant and specific to
SA perception.
SA perception in defence and signalling mutants
From the comprehensive list of mutants tested, there is no evidence of
desensitization. That is, mutants that have more SA than in wt (e.g. c-SAS and
cpr1) are still able to respond to exogenous BTH applications (Figure 6). A
direct consequence is that we can assay genotypes that are more resistant to
bacteria and unequivocally discriminate if it is due to an enhanced SA
perception. So far we have found no evidence for such genotype, with the
exception of 35S:NPR1 (see below). Regarding the different kind of defences,

Canet et al, 20
mutants in SAR, basal, specific (or gene-for-gene) and non-host resistance
were tested and found not to be different from the wt, with the exception of npr1,
as discussed below.
The more we study plant biology, the clearer it becomes that everything is
interconnected. If two decades ago plant defence and development could be
seen as two separate programs, evidence in the last years reveals a much
more intricate signal network with complex interactions. Thus, there are reports
on the interactions between SA and Auxins, Light perception, Ethylene,
Jasmonic Acid, Abscisic Acid and ROS, among others (reviewed by Lopez et al.
2008). Mutations in pathways different than Auxin do not have a measurable
impact on SA perception when measured as described. Regarding Auxins, only
axr3 does not respond to BTH in weight, and there is no visible difference
between mock and BTH treated plants (data not shown). AXR3 belongs to the
family of IAAs, genes that are rapidly induced with auxins, and behave as
activators or repressors of the auxin response (Reed 2001). The allele of axr3
used is a dominant mutant that stabilizes the protein, causing an increase in
auxin perception and phenocopying the overexpression of the wt protein
(Ouellet et al. 2001). It is tempting to speculate that AXR3 is the link between
defence and development.
In favour of this hypothesis, there are solid evidences of the interaction between
SA and Auxins (Wang, D. et al. 2007a) and the overexpression of AXR3
reproduces the axr3 phenotype (Reed 2001). Thus, the phenotype that
responds to BTH could be explained by an increase in the amount of the AXR3
protein. However, this hypothesis has serious drawbacks. AXR3 is slightly
Canet et al, 21
repressed under pathogenic conditions (www.genevestigator.com), which does
not fit with a prominent role in the response to BTH. Mechanistically, exogenous
Auxin applications reduces SA perception (Wang, D. et al. 2007a). But axr3 has
Auxin hypersensitivity, so instead of sensing more SA, it should perceive less
SA, which contradicts the model. A closer examination proves that axr3 is
indeed able to perceive SA and BTH, as measured by Pto growth, western blot
of PR1, and tolerance to SA in plates (Figure 7). This perception is slightly
attenuated (Figure 7a and 7b), as expected by the interaction between Auxins
and SA.
The second hypothesis is that the small size of the plant does not allow it to
lose weight, as it is already at minimal levels. The average weight of axr3 in
mock is minor than Col-0 with BTH in Figure 6c, while in other replications both
weights were similar (data not shown). The difference with the first hypothesis is
that the small fresh weight is not related to the interaction between resistance
and development, and other mutants of small size could present no differences
between mock and BTH. The results of our experiments support this second
hypothesis.
NPR1- related genotypes mark the relationship between plant defence and
development.
NPR1 is a gene necessary for SA perception (Figure 6), among other roles in
plant defence (Pieterse and Van Loon 2004) and development (Vanacker et al.
2001). The extreme npr1 phenotype in response to BTH (Figure 6) is not allele
specific, because the available alleles behave in the same way. It is worth

Canet et al, 22
mentioning that the npr1-3 allele is still functional for the so-called Induced
Systemic Resistance (Pieterse and Van Loon 2004). In fact, the overexpression
of NPR1 fused to the glucocorticoid receptor (35S:NPR1:HBD in Figure 8)
reproduces the same phenomenon, i.e. a functional NPR1 protein that is unable
to migrate to the nucleus. Therefore, the response to BTH is dependent on the
NPR1 protein acting in the nucleus. The overexpression of NPR1 produces an
increasing sensitivity to SA and its analogues in terms of pathogen growth and
defence markers (Cao et al. 1998; Friedrich et al. 2001), and we can
reproducibly detect this enhanced SA perception (Figure 8).
In the Arabidopsis genome there are five genes with high homology to NPR1
(Liu et al. 2005). Certain functional redundancy could exist in the genes of this
family; therefore we assayed loss of function mutations in these genes.
Fortunately, there are two double mutants available, npr3 npr4 and bop1 bop2,
and none of them has a consistent difference with wt. In the case of NPR2, T3
seeds from a T-DNA insertion (Table S1) were found to be like wt (data not
shown). Therefore, there is no measurable functional redundancy, at least in a
NPR1 wt background.
NPR1 interacts with proteins from two families of genes, TGAs (Zhang et al.
1999) and NIMINs (Weigel et al. 2001). TGAs are a subclass of the family of
bZIP transcription factors (Jakoby et al. 2002) that physically interact with
promoters of PR genes (Johnson et al. 2003). The transcriptional activation of
these PR genes is dependent on the interaction of the TGAs with NPR1
(Després et al. 2000). There are reports about functional redundancy in this
family (Jakoby et al. 2002), and yet T-DNA insertions in tga1 and tga7 have a
Canet et al, 23
small but measurable phenotype in our model (Figure 8). The best indication of
the significant role of this gene family in SA perception is the phenotype of the
triple mutant tga6 tga2 tga5 (Zhang et al. 2003, Figure 8). In this case the
phenotype is visible to the naked eye (data not shown). T3 seeds from T-DNA
insertions in TGA3 and TGA4 (Table S1) were phenotypically similar to wt (data
not shown). NIMINs are a family of three small genes, and their proteins interact
in vitro with NPR1. Mechanistically, NIMIN genes would act as repressors of SA
signalling (Weigel et al. 2001). T3 seeds from T-DNA insertions in NIMIN1,
NIMIN2 and NIMIN3 (Table S1) were found to behave like wt (data not shown).
NPR1 is the only gene necessary for SA perception, and several suppressor
screenings have been made to identify other players (Li et al. 1999). T3 seeds
from T-DNA insertions in SSI2, and SNI1 behave like wt (data not shown).
Interestingly, the double sni1 npr1 does not behave as a suppressor in our
system (Figure 8). SNI1 encodes a nuclear protein rich in leucine and it is
assumed to be a negative SAR regulator (Li et al. 1999). We were able to
confirm the suppression of the npr1 phenotype by sni1 in Pto growth curves
(data not shown), but not in weight. An obvious hypothesis is that the signal that
goes from SA to NPR1 somehow splits into two; one is repressed by SNI1 and
activates defence genes (e.g. PR1), eventually causing the measurable
reduction of the infection. The other is SNI1 independent, and reduces the
growth of the plant. This branching could be achieved through different signal
thresholds, since sni1 induces defences at lower concentrations of SA
analogues (Li et al. 1999) both in wt and in npr1. In any case, the evidence that
a genotype produces defence (PR gene expression included) with no loss of

Canet et al, 24
fresh weight, contradicts the first two hypotheses presented to explain the
interaction between plant defence and development (“defence is toxic”, and
“defence is expensive”). Thus, the third hypothesis (“scorching earth defence”)
is favoured by the results presented here. In other words, the plant has two
programs: active synthesis of defences and active depletion of nutrients.

Canet et al, 25
Experimental procedures.
Inoculation and plant treatment.
For all the experiments, Arabidopsis thaliana was sown in small pots, kept at 4
°C for 3 days and then transferred to growing conditions under a short-day
regime (8 hours of light (150 µmol m-2 s-1) at 21 °C, 16 hours of dark at 19 °C).
The treatments, inoculations, and sampling started 30 minutes after the initiation
of the artificial day to ensure reproducibility. Pseudomonas syringae pv. tomato
DC3000 (Pto) containing pVSP61 (empty vector) were maintained as described
(Ritter and Dangl, 1996). The bacteria were grown, inoculated and measured as
described (Tornero and Dangl 2001) with minor changes. Trypan Blue and
Aniline Blue staining were performed as described (Tornero et al. 2002; Conrath
et al. 1989, respectively). For all the experiments, three independent treatments
were performed (three independent sets of plants sown and treated on different
dates), only two in the case of the large collection of ecotypes.
BTH and fresh weight.
Benzothiadiazole (BTH, CGA 245704), in the form of commercial product
(Bion® 50 WG, a gift from Syngenta Agro S.A. Spain) was prepared in water for
each treatment and applied with a household sprayer. When indicated, a mock
inoculation of distilled water was performed. The treatments were conducted on
the 8th, 11th, 15th, and 18th day (day 0 is when plants are transferred to growing
conditions), and the weight of the plants recorded on the 21st day. For each
genotype and treatment, 15 plants were weighed in 3 groups of 5. The mock
treatment was considered to have a value of 100, and the average and

Canet et al, 26
standard deviation of the percentage of the fresh weight resulting from the BTH
treatment are represented.
Western blot.
Immunodetection of PR1 protein was carried out as described (Wang, D. et al.
2005), using an Amersham ECL Plus Western Blotting Detection Reagents
(GE HealthCare, Little Chalfont, UK). The second antibody was a 1:25000
dilution of Anti-Rabbit IgG HRP Conjugate (Promega, Madison, USA).
Chemiluminescent signals were detected using a LA-3000 Luminescent Image
Analyzer (Fujifilm Life Science, Stamford, CT, USA).
SA in plates and in planta.
Arabidopsis seeds were surface-sterilized for 10 min in 70% ethanol and for 10
min in commercial bleach. Then, five washes were done with distilled water and
the seeds were distributed on agar plates. The medium contains 0.5x
Murashige and Skoog salts (Duchefa BV, Haarlem, the Netherlands), 0.6%
(w/v) Phyto Agar (Duchefa), 2% (w/v) sucrose, with or without SA 500 µM (final
concentration). The result was evaluated 10 days after transferring to growing
conditions. For the measurement of SA in planta, three samples of 250 mg were
frozen in liquid nitrogen. SA extraction was performed as described by (Mayda
et al. 2000).

Canet et al, 27
QTL mapping.
Plants of Arabidopsis were treated with either mock or benzothiadiazole (BTH)
350 µM as described above. The weight of five plants per line and the genotype
of each line were used as input for the program WinQTLCart (Wang, S. et al.
2007b), that calculates the probability that a QTL is link to a particular region of
the genome. The populations analyzed were: Col-0 x Nd-1, 98 lines (Deslandes
et al. 1998); Col-gl1 x Kas-1, 115 lines (Wilson et al. 2001); Cvi-1 x Laer-2, 50
lines (Alonso-Blanco et al. 1998); Laer-0 x Sha-0, 114 lines (Clerkx et al. 2004);
Bay-0 x Sha-0, 162 lines (data not shown, Loudet et al. 2002); Col-4 x Laer-0,
85 lines (Lister and Dean 1993); and Laer-0 x No-0, 135 lines (Magliano et al.
2005).

Canet et al, 28
Acknowledgements.
This work was supported by a BIO2006-02168 grant of Ministerio de Ciencia e
Innovación (MICINN) to PT, a JAE-CSIC Fellowship to JVC and a FPI- MICINN
to AD. We thank the English translation service of the Universidad Politécnica
de Valencia and the Statistics Service (CTI-CSIC). We appreciate the seeds
provided by a great number of colleagues and the BTH provided by Syngenta.
Thanks also to Carlos A. Blanco for advice in QTL mapping, and to José León
and Pablo Vera for useful advice.

Canet et al, 29
References.
Alonso-Blanco, C., A. J. Peeters, M. Koornneef, C. Lister, C. Dean, N. van den Bosch, J. Pot and M. T. Kuiper (1998). Development of an AFLP based linkage map of Ler, Col and Cvi Arabidopsis thaliana ecotypes and construction of a Ler/Cvi recombinant inbred line population. Plant J. 14(2): 259-71.
Alvarez, M. E., R. I. Pennell, P. J. Meijer, A. Ishikawa, R. A. Dixon and C. Lamb (1998). Reactive oxygen intermediates mediate a systemic signal network in the establishment of plant immunity. Cell 92(6): 773-84.
Aviv, D. H., C. Rusterucci, B. F. Holt, 3rd, R. A. Dietrich, J. E. Parker and J. L. Dangl (2002). Runaway cell death, but not basal disease resistance, in lsd1 is SA- and NIM1/NPR1-dependent. Plant J. 29(3): 381-91.
Bent, A. F. and D. Mackey (2007). Elicitors, effectors, and R genes: the new paradigm and a lifetime supply of questions. Annu Rev Phytopathol 45: 399-436.
Bowling, S. A., A. Guo, H. Cao, A. S. Gordon, D. F. Klessig and X. Dong (1994). A mutation in Arabidopsis that leads to constitutive expression of systemic acquired resistance. Plant Cell 6: 1845-1857.
Cao, H., S. A. Bowling, A. S. Gordon and X. Dong (1994). Characterization of an Arabidopsis Mutant That Is Nonresponsive to Inducers of Systemic Acquired Resistance. Plant Cell 6(11): 1583-1592.
Cao, H., J. Glazebrook, J. D. Clarke, S. Volko and X. Dong (1997). The Arabidopsis NPR1 gene that controls systemic acquired resistance encodes a novel protein containing ankyrin repeats. Cell 88(1): 57-63.
Cao, H., X. Li and X. Dong (1998). Generation of broad-spectrum disease resistance by overexpression of an essential regulatory gene in systemic acquired resistance. Proc Natl Acad Sci U S A 95(11): 6531-6.
Clerkx, E. J., M. E. El-Lithy, E. Vierling, G. J. Ruys, H. Blankestijn-De Vries, S. P. Groot, D. Vreugdenhil and M. Koornneef (2004). Analysis of natural allelic variation of Arabidopsis seed germination and seed longevity traits between the accessions Landsberg erecta and Shakdara, using a new recombinant inbred line population. Plant Physiol. 135(1): 432-43. Epub 2004 Apr 30.
Conrath, U., A. Domard and H. Kauss (1989). Chitosan-elicited synthesis of callose and of coumarin derivatives in parsley cell suspension cultures. Plant Cell Reports 8: 152-155.

Canet et al, 30
Defraia, C. T., E. A. Schmelz and Z. Mou (2008). A rapid biosensor-based method for quantification of free and glucose-conjugated salicylic acid. Plant Methods. 4(1): 28.
Delaney, T. P., L. Friedrich and J. A. Ryals (1995). Arabidopsis signal transduction mutant defective in chemically and biologically induced disease resistance. Proc Natl Acad Sci U S A. 92(14): 6602-6.
Deslandes, L., F. Pileur, L. Liaubet, S. Camut, C. Can, K. Williams, E. Holub, J. Beynon, M. Arlat and Y. Marco (1998). Genetic characterization of RRS1 a recessive locus in Arabidopsis thaliana that confers resistance to the bacterial soft rot pathogen, Ralstonia solanacearum. Molec. Plant-Microbe Interact. 11: 659-667.
Després, C., C. DeLong, S. Glaze, E. Liu and P. R. Fobert (2000). The Arabidopsis NPR1/NIM1 protein enhances the DNA binding activity of a subgroup of the TGA family of bZIP transcription factors. Plant Cell 12: 279-290.
Dong, X. (2004). NPR1, all things considered. Current Opinion in Plant Biology 7(5): 547-552.
Friedrich, L., K. Lawton, R. Dietrich, M. Willits, R. Cade and J. Ryals (2001). NIM1 overexpression in Arabidopsis potentiates plant disease resistance and results in enhanced effectiveness of fungicides. Mol Plant Microbe Interact 14(9): 1114-24.
Friedrich, L., B. Vernooij, T. Gaffney, A. Morse and J. Ryals (1995). Characterization of tobacco plants expressing a bacterial salicylate hydroxylase gene. Plant Mol Biol 29(5): 959-68.
Glazebrook, J. and F. M. Ausubel (1994). Isolation of phytoalexin-deficient mutants of Arabidopsis thaliana and characterization of their interactions with bacterial pathogens. Proc. Natl. Acad. Sci., USA 91: 8955-8959.
Glazebrook, J., E. E. Rogers and F. M. Ausubel (1996). Isolation of Arabidopsis mutants with enhanced disease susceptibility by direct screening. Genetics 143: 973-982.
Ha, C. M., J. H. Jun, H. G. Nam and J. C. Fletcher (2007). BLADE-ON-PETIOLE 1 and 2 control Arabidopsis lateral organ fate through regulation of LOB domain and adaxial-abaxial polarity genes. Plant Cell. 19(6): 1809-25. Epub 2007 Jun 29.
Heil, M. (2002). Ecological costs of induced resistance. Curr Opin Plant Biol 5(4): 345-50.

Canet et al, 31
Jakoby, M., B. Weisshaar, W. Droge-Laser, J. Vicente-Carbajosa, J. Tiedemann, T. Kroj and F. Parcy (2002). bZIP transcription factors in Arabidopsis. Trends Plant Sci. 7(3): 106-11.
Johnson, C., E. Boden and J. Arias (2003). Salicylic acid and NPR1 induce the recruitment of trans-activating TGA factors to a defense gene promoter in Arabidopsis. Plant Cell. 15(8): 1846-58.
Katagiri, F., S. Thilmony and S. Y. He (2002). The Arabidopsis thaliana-Pseudomonas syringae Interaction. The Arabidopsis Book.
Keogh, R. C., B. J. Deverall and S. McLeod (1980). Comparison of histological and physiological responses to Phakopsora pachyrhizi in resistant and susceptible soybean. Trans. Br. Mycol. Soc. 74: 329-333.
Kim, H. S. and T. P. Delaney (2002). Arabidopsis SON1 is an F-box protein that regulates a novel induced defense response independent of both salicylic acid and systemic acquired resistance. Plant Cell 14(7): 1469-82.
Kohler, A., S. Schwindling and U. Conrath (2002). Benzothiadiazole-induced priming for potentiated responses to pathogen infection, wounding, and infiltration of water into leaves requires the NPR1/NIM1 gene in Arabidopsis. Plant Physiol 128(3): 1046-56.
Koornneef, M., C. Alonso-Blanco and P. Stam (2006). Genetic analysis. Methods Mol Biol 323: 65-77.
Kumar, D. and D. F. Klessig (2003). High-affinity salicylic acid-binding protein 2 is required for plant innate immunity and has salicylic acid-stimulated lipase activity. Proc Natl Acad Sci U S A. 100(26): 16101-6. Epub 2003 Dec 12.
Lawton, K. A., L. Friedrich, M. Hunt, K. Weymann, T. Delaney, H. Kessmann, T. Staub and J. Ryals (1996). Benzothiadiazole induces disease resistance in Arabidopsis by activation of the systemic acquired resistance signal transduction pathway. Plant J 10(1): 71-82.
Li, X., Y. Zhang, J. D. Clarke, Y. Li and X. Dong (1999). Identification and cloning of a negative regulator of systemic acquired resistance, SNI1, through a screen for suppressors of npr1-1. Cell 98: 329-339.
Lister, C. and C. Dean (1993). Recombinant inbred lines for mapping RFLP and phenotypic markers in Arabidopsis thaliana. Plant J. 4: 745-750.
Liu, G., E. B. Holub, J. M. Alonso, J. R. Ecker and P. R. Fobert (2005). An Arabidopsis NPR1-like gene, NPR4, is required for disease resistance. Plant J. 41(2): 304-18.

Canet et al, 32
Lopez, M. A., G. Bannenberg and C. Castresana (2008). Controlling hormone signaling is a plant and pathogen challenge for growth and survival. Curr Opin Plant Biol. 11(4): 420-7. Epub 2008 Jun 26.
Loudet, O., S. Chaillou, C. Camilleri, D. Bouchez and F. Daniel-Vedele (2002). Bay-0 x Shahdara recombinant inbred line population: a powerful tool for the genetic dissection of complex traits in Arabidopsis. Theor Appl Genet. 104(6-7): 1173-1184. Epub 2002 Feb 13.
Magliano, T. M., J. F. Botto, A. V. Godoy, V. V. Symonds, A. M. Lloyd and J. J. Casal (2005). New Arabidopsis recombinant inbred lines (Landsberg erecta x Nossen) reveal natural variation in phytochrome-mediated responses. Plant Physiol. 138(2): 1126-35. Epub 2005 May 20.
Maher, E. P. and S. J. Martindale (1980). Mutants of Arabidopsis thaliana with altered responses to auxins and gravity. Biochem Genet. 18(11-12): 1041-53.
Martinez, C., E. Pons, G. Prats and J. Leon (2004). Salicylic acid regulates flowering time and links defence responses and reproductive development. Plant J. 37(2): 209-17.
Mauch, F., B. Mauch-Mani, C. Gaille, B. Kull, D. Haas and C. Reimmann (2001). Manipulation of salicylate content in Arabidopsis thaliana by the expression of an engineered bacterial salicylate synthase. The Plant Journal 25(1): 67-77.
Mayda, E., B. Mauch-Mani and P. Vera (2000). Arabidopsis dth9 mutation identifies a gene involved in regulating disease susceptibility without affecting salicylic acid-dependent responses. Plant Cell 12(11): 2119-28.
McKhann, H. I., C. Camilleri, A. Bérard, T. Bataillon, J. L. David, X. Reboud, V. Le Corre, C. Caloustian, I. G. Gut and D. Brune (2004). Nested core collections maximizing genetic diversity in Arabidopsis thaliana. The plant Journal 38: 193-202.
McKim, S. M., G. E. Stenvik, M. A. Butenko, W. Kristiansen, S. K. Cho, S. R. Hepworth, R. B. Aalen and G. W. Haughn (2008). The BLADE-ON-PETIOLE genes are essential for abscission zone formation in Arabidopsis. Development. 135(8): 1537-46. Epub 2008 Mar 13.
Mockaitis, K. and M. Estelle (2008). Auxin receptors and plant development: a new signaling paradigm. Annu Rev Cell Dev Biol 24: 55-80.
Nawrath, C., S. Heck, N. Parinthawong and J. P. Metraux (2002). EDS5, an essential component of salicylic acid-dependent signaling for disease resistance in Arabidopsis, is a member of the MATE transporter family. Plant Cell 14(1): 275-86.

Canet et al, 33
Nawrath, C., J. P. Métraux and T. Genoud (2005). Chemical signals in plant resistance: salicylic acid. . Multigenic and Induced Systemic Resistance in Plants. S. Tuzun and E. Bent. Dordrecht Kluwer: pp. 143–165.
Nordborg, M., T. T. Hu, Y. Ishino, J. Jhaveri, C. Toomajian, H. Zheng, E. Bakker, P. Calabrese, J. Gladstone, R. Goyal, M. Jakobsson, S. Kim, Y. Morozov, B. Padhukasahasram, V. Plagnol, N. A. Rosenberg, C. Shah, J. D. Wall, J. Wang, K. Zhao, T. Kalbfleisch, V. Schulz, M. Kreitman and J. Bergelson (2005). The pattern of polymorphism in Arabidopsis thaliana. PLoS Biol. 3(7): e196. Epub 2005 May 24.
Ouellet, F., P. J. Overvoorde and A. Theologis (2001). IAA17/AXR3: Biochemical Insight into an Auxin Mutant Phenotype. Plant Cell 13(4): 829-842.
Pieterse, C. M. and L. C. Van Loon (2004). NPR1: the spider in the web of induced resistance signaling pathways. Curr Opin Plant Biol. 7(4): 456-64.
Reed, J. W. (2001). Roles and activities of Aux/IAA proteins in Arabidopsis. Trends in Plant Science 6(9): 420-425.
Shah, J. (2003). The salicylic acid loop in plant defense. Curr Opin Plant Biol. 6(4): 365-71.
Shah, J., P. Kachroo, A. Nandi and D. F. Klessig (2001). A recessive mutation in the Arabidopsis SSI2 gene confers SA- and NPR1-independent expression of PR genes and resistance against bacterial and oomycete pathogens. Plant J. 25: 563-574.
Shah, J., F. Tsui and D. F. Klessig (1997). Characterization of a salicylic acid-insensitive mutant (sai1) of Arabidopsis thalianaidentified in a selective screen utilizing the SA-inducible expression of the tms2 gene. Molec. Plant-Microbe Interact. 10: 69-78.
Spoel, S. H., Z. Mou, Y. Tada, N. W. Spivey, P. Genschik and X. Dong (2009). Proteasome-mediated turnover of the transcription coactivator NPR1 plays dual roles in regulating plant immunity. Cell. 137(5): 860-72.
Tada, Y., S. H. Spoel, K. Pajerowska-Mukhtar, Z. Mou, J. Song, C. Wang, J. Zuo and X. Dong (2008). Plant immunity requires conformational charges of NPR1 via S-nitrosylation and thioredoxins. Science. 321(5891): 952-6. Epub 2008 Jul 17.
Tornero, P. and J. L. Dangl (2001). A high throughput method for quantifying growth of phytopathogenic bacteria in Arabidopsis thaliana. The Plant Journal 28(4): 475-481.

Canet et al, 34
Tornero, P., P. Merritt, A. Sadanandom, K. Shirasu, R. W. Innes and J. L. Dangl (2002). RAR1 and NDR1 contribute quantitatively to disease resistance in Arabidopsis, and their relative contributions are dependent on the R gene assayed. Plant Cell 14(5): 1005-15.
Uknes, S., B. Mauch-Mani, M. Moyer, S. Potter, S. Williams, S. Dincher, D. Chandler, A. Slusarenko, E. Ward and J. Ryals (1992). Acquired resistance in Arabidopsis. The Plant Cell 4: 645-656.
van Kan, J. A. (2006). Licensed to kill: the lifestyle of a necrotrophic plant pathogen. Trends Plant Sci. 11(5): 247-53. Epub 2006 Apr 17.
van Leeuwen, H., D. J. Kliebenstein, M. A. West, K. Kim, R. van Poecke, F. Katagiri, R. W. Michelmore, R. W. Doerge and D. A. St Clair (2007). Natural variation among Arabidopsis thaliana accessions for transcriptome response to exogenous salicylic acid. Plant Cell. 19(7): 2099-110. Epub 2007 Jul 13.
Vanacker, H., H. Lu, D. N. Rate and J. T. Greenberg (2001). A role for salicylic acid and NPR1 in regulating cell growth in Arabidopsis. Plant J. 28(2): 209-16.
Wang, D., K. Pajerowska-Mukhtar, A. H. Culler and X. Dong (2007a). Salicylic acid inhibits pathogen growth in plants through repression of the auxin signaling pathway. Curr Biol. 17(20): 1784-90. Epub 2007 Oct 4.
Wang, D., N. D. Weaver, M. Kesarwani and X. Dong (2005). Induction of protein secretory pathway is required for systemic acquired resistance. Science. 308(5724): 1036-40.
Wang, S., C. J. Basten and Z.-B. Zeng (2007b). Windows QTL Cartographer Raleigh, NC, Department of Statistics, North Carolina State University, .
Weigel, R. R., C. Bauscher, A. J. Pfitzner and U. M. Pfitzner (2001). NIMIN-1, NIMIN-2 and NIMIN-3, members of a novel family of proteins from Arabidopsis that interact with NPR1/NIM1, a key regulator of systemic acquired resistance in plants. Plant Mol Biol 46(2): 143-60.
Wiermer, M., B. J. Feys and J. E. Parker (2005). Plant immunity: the EDS1 regulatory node. Curr Opin Plant Biol. 8(4): 383-9.
Wildermuth, M. C., J. Dewdney, G. Wu and F. M. Ausubel (2001). Isochorismate synthase is required to synthesize salicylic acid for plant defence. Nature 414(6863): 562-5.
Wilson, I. W., C. L. Schiff, D. E. Hughes and S. C. Somerville (2001). Quantitative trait loci analysis of powdery mildew disease resistance in the Arabidopsis thaliana accession kashmir-1. Genetics. 158(3): 1301-9.

Canet et al, 35
Zhang, Y., Y. T. Cheng, N. Qu, Q. Zhao, D. Bi and X. Li (2006). Negative regulation of defense responses in Arabidopsis by two NPR1 paralogs. Plant J. 48(5): 647-56. Epub 2006 Oct 31.
Zhang, Y., W. Fan, M. Kinkema, X. Li and X. Dong (1999). Interaction of NPR1 with basic leucine zipper protein transcription factors that bind sequences required for salicylic acid induction of the PR-1 gene. Proc Natl Acad Sci U S A 96(11): 6523-8.
Zhang, Y., M. J. Tessaro, M. Lassner and X. Li (2003). Knockout analysis of Arabidopsis transcription factors TGA2, TGA5, and TGA6 reveals their redundant and essential roles in systemic acquired resistance. Plant Cell. 15(11): 2647-53. Epub 2003 Oct 23.
Supporting information Table S1. List of ecotypes, populations and mutants tested.
Figure S1. Picture of Col-0 and npr1.1 after mock and BTH 350 µM treatments

Canet et al, 36
Figure legends:
1.-BTH increases disease resistance and decreases biomass
accumulation. (a), Arabidopsis plants were pretreated with either mock or
benzothiadiazole (BTH) 350 µM and then inoculated with Pseudomonas
syringae pv tomato isolate DC3000 (Pto) one day later. Three days later, the
bacteria (measured as Logarithm of colony forming units per plant) were
measured. (b), Plant weight of (a) before bacterial extraction, in mg of fresh
weight. (c), The same effect after considerable optimization that includes four
treatments (see Experimental procedures). All panels show the average and
standard deviations, and at least three independent experiments were
performed with similar results.
2.-The continuous triggering of plant resistance produces a distinctive
macroscopic and microscopic phenotype. (a), Macroscopic phenotype of
plants either treated with mock (left) or with BTH 350 µM (right) at the same
time as Figure 1c. BTH-treated plants have the same number of leaves as
mock-treated plants, and are able to survive and set seeds. (b), (c) and (d)
correspond to Trypan blue stains, unveiling cell death and membrane damage.
(e), (f) and (g) show Aniline blue stains under ultraviolet light, which detects
callose depositions. (h), (i), and (j) are the same micrographs under visible light.
(b), (e) and (h) are from representative plants treated with mock, (c), (f) and (i)
are from BTH 350 nM treated plants, and (d), (g), and (j) are from BTH 350 µM
treated plants. Only BTH 350 µM produces microscopic cell death in few and

Canet et al, 37
isolated cells (dark blue staining outside the veins in (d)), and triggers plant
defence, as observed in the callose depositions (fluorescent in (g)).
3.-SA accumulation and defence induction upon BTH application. (a)
Quantification of SA upon mock, BTH 350 nM, and BTH 350 µM treatments as
described in Figure 1c. Both free and total SA (i.e. glucosylated derivates
released after hydrolysis plus the free SA) were measured, showing the
average and standard deviations of three samples. (b) Western blot for PR1.
This defence marker was immunodetected in samples from the same
experiments as in (a). The arrow points to the expected size of PR1 (14 kDa).
4.- Arabidopsis ecotypes tested show a similar phenotype. Two collections
of ecotypes were tested as described in Figure 1c. (a) Col-0 and the McKhann
collection (McKhann et al. 2004) ranked for its percentage of fresh weight. (b)
and (c) Col-0 and the Nordborg collection (Nordborg et al. 2005) were
measured in two separate lots. The full names of the ecotypes shown, as well
as other ecotypes tested, are listed in Table S1. None of the ecotypes tested
shows an extreme behaviour under these conditions, and Col-0 ranked between
40th and 56th percentile in the three panels.
5.- There are no significant QTLs in the tested populations specific to SA
perception. Plants were treated with either mock or BTH 350 µM as described
in Figure 1c. The output showed is the logarithm of odds (LOD, in the Y axis)
that a QTL is link to a particular region of the genome (X axis). The horizontal

Canet et al, 38
line shows the threshold of significance. The continuous lines show the QTLs
for mock, and the dotted line the QTLs for BTH treatment. The populations
analyzed were (a) Col-0 x Nd-1, (b) Col-gl1 x Kas-1, (c) Cvi-1 x Laer-2, (d) Laer-
0 x Sha-0, (e) Laer-0 x No-0, (f) Col-4 x Laer-0.
6.-A collection of mutants points to only two candidates for SA
perception. All the mutants were tested as described in Figure 1c. The
complete list is shown in Table S1. (a) and (b) show defence mutants, (c)
corresponds to mutations in Auxin and Light signalling, (d) mutations in Abscisic
Acid, Ethylene and Reactive Oxygen Species, and (e) mutations in Jasmonic
Acid and/or response to necrotrophs. 35FM stands for 35S:FMO1, 35DIR is
35S:DIR1, phyA/B is the double phyA phyB, 35HAB is 35S:HAB1, abi/hab is
abi1-2 hab1-1, 35ERF is 35S:ERF1, atrb-D is atrboh-D, and atrb-F is atrboh-F.
7.-axr3 can sense SA and BTH. (a) Pto growth in Col-0, npr1 and axr3 treated
either with mock or BTH 350 µM, as described in Figure 1a. (b) Western blot for
PR1 of the same experiment as (a), but prior to bacterial inoculation. The arrow
points to the expected size of PR1 (14 kDa). (c) Phenotype of the same
genotypes in MS plates supplemented with SA 500 µM. npr1 plants do not
perceive SA and therefore can not avoid accumulation to toxic levels. Col-0 and
axr3 can perceive SA and are able to grow in this medium.
8.-Behaviour of genotypes related to NPR1 in SA perception. Alleles of
npr1, loss of function of related genes and transgenic plants that overexpress

Canet et al, 39
the protein were assayed as described in Figure 1c. 3xtga stands for the triple
mutant tga6 tga2 tga5 and NPR1HBD for the transgenic 35S:NPR1:HBD.

Canet et al, 40
Figures.


Mutant Ecotipe if not Col-0 Other names Figure 5 Keyword Keyword35S:HAB1 d ABAaba2-1 Laer d ABAaba3-2 Laer d ABAabi1-2/hab1-2 d ABAabi5-3 Laer d ABAarf11.1 c Auxinsarf1-2 c Auxinsarf12.1 c Auxinsarf13.1 c Auxinsarf15.1 c Auxinsarf16.1 c Auxinsarf19.1 c Auxinsarf20.1 c Auxinsarf21.1 c Auxinsarf3.1 c Auxinsarf6.1 c Auxinsarf8.2 c Auxinsarf9.1 c Auxinsaxr1-3 c Auxinsaxr2-1 c Auxinsaxr3-1 c Auxinsixr1-1 c Auxinstir1-1 c Auxinsyucca c Auxins35S-FMO1 a Defencefmo1 Data not shown Defenceald1 Data not shown Defence NPR1-independentdth9 Data not shown Defence NPR1-independenteds1-1 Ws-0 Data not shown Defence R genes
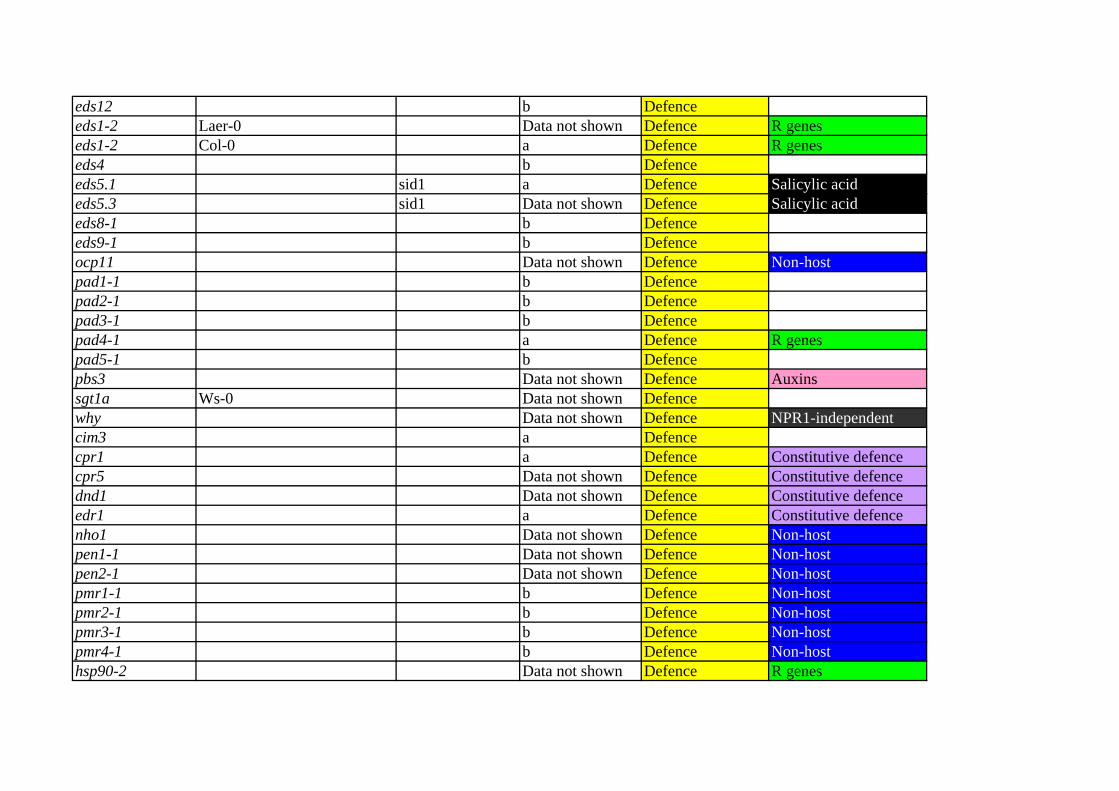
eds12 b Defenceeds1-2 Laer-0 Data not shown Defence R geneseds1-2 Col-0 a Defence R geneseds4 b Defenceeds5.1 sid1 a Defence Salicylic acideds5.3 sid1 Data not shown Defence Salicylic acideds8-1 b Defenceeds9-1 b Defenceocp11 Data not shown Defence Non-hostpad1-1 b Defencepad2-1 b Defencepad3-1 b Defencepad4-1 a Defence R genespad5-1 b Defencepbs3 Data not shown Defence Auxinssgt1a Ws-0 Data not shown Defencewhy Data not shown Defence NPR1-independentcim3 a Defencecpr1 a Defence Constitutive defencecpr5 Data not shown Defence Constitutive defencednd1 Data not shown Defence Constitutive defenceedr1 a Defence Constitutive defencenho1 Data not shown Defence Non-hostpen1-1 Data not shown Defence Non-hostpen2-1 Data not shown Defence Non-hostpmr1-1 b Defence Non-hostpmr2-1 b Defence Non-hostpmr3-1 b Defence Non-hostpmr4-1 b Defence Non-hosthsp90-2 Data not shown Defence R genes

rar1/ndr1 Data not shown Defence R genesrar1-21 Data not shown Defence R genesrpm1-1 Data not shown Defence R genesrps5-2 Data not shown Defence R genessgt1b b Defence R genesc-SAS-10 a Defence Salicylic acidNahG Laer-0 Data not shown Defence Salicylic acidNahG a Defence Salicylic acidNahG Ws-0 Data not shown Defence Salicylic acidsid2 eds16 a Defence Salicylic acid35S-DIR1 a Defencedir1 b Defencendr1-1 b Defence R genessfd1-1 b Defencesfd1-2 Data not shown Defence35S-ERF1 d Ethyleneein2-1 Data not shown Ethyleneein2-5 Data not shown Ethyleneeto1-1 d Ethyleneeto2 Data not shown Ethyleneeto3 Data not shown Ethyleneetr1-3 d Ethylenehls1-1 d Ethylenebik1 e JA-Necrotrophsbos1 e JA-Necrotrophscoi1 e JA-Necrotrophsjin1 e JA-Necrotrophsjin4 jar1 e JA-Necrotrophsocp3 e JA-Necrotrophscop1-4 c Light

det1-1 c Lighthy5-215 c LightphyA/phyB Laer c LightphyA-201 Laer c LightphyB-5 Laer c Lightuvr2-1 c Lightatrboh-D d ROSatrboh-F d ROSrcd1 Data not shown ROS

Keyword Keyword RefSaez et al. 2004Leon-Kloosterziel et al. 1996Leon-Kloosterziel et al. 1996Saez et al. 2006Finkelstein and Lynch 2000Okushima et al. 2005Okushima et al. 2005Okushima et al. 2005Okushima et al. 2005Okushima et al. 2005Okushima et al. 2005Okushima et al. 2005Okushima et al. 2005Okushima et al. 2005Okushima et al. 2005Okushima et al. 2005Okushima et al. 2005Okushima et al. 2005Leyser et al. 1993Timpte et al. 1995Ouellet et al. 2001Scheible et al. 2001Dharmasiri et al. 2005Zhao et al. 2001
SAR Bartsch et al. 2006SAR Bartsch et al. 2006
Song et al. 2004SAR Basal defence Mayda et al. 2000
Basal defence Parker et al. 1996

Basal defence Glazebrook et al. 1996Basal defence Parker et al. 1996Basal defence Parker et al. 1996Basal defence Glazebrook et al. 1996Basal defence Nawrath et al. 2002Basal defence Nawrath et al. 2002Basal defence Glazebrook et al. 1996Basal defence Glazebrook et al. 1996Basal defence Agorio and Vera 2007
Glazebrook and Ausubel 1994Glazebrook and Ausubel 1994Glazebrook and Ausubel 1994
Basal defence Glazebrook and Ausubel 1994Glazebrook and Ausubel 1994
Basal defence Warren et al. 1999Azevedo et al. 2002
Basal defence Desveaux et al. 2004Maleck et al. 2002Bowling et al. 1994Bowling et al. 1997Yu et al. 1998Frye and Innes 1998Lu et al. 2001Collins et al. 2003Lipka et al. 2005Vogel, J. and Somerville 2000Vogel, J. and Somerville 2000Vogel, J. and Somerville 2000Vogel, J. and Somerville 2000Hubert et al. 2003
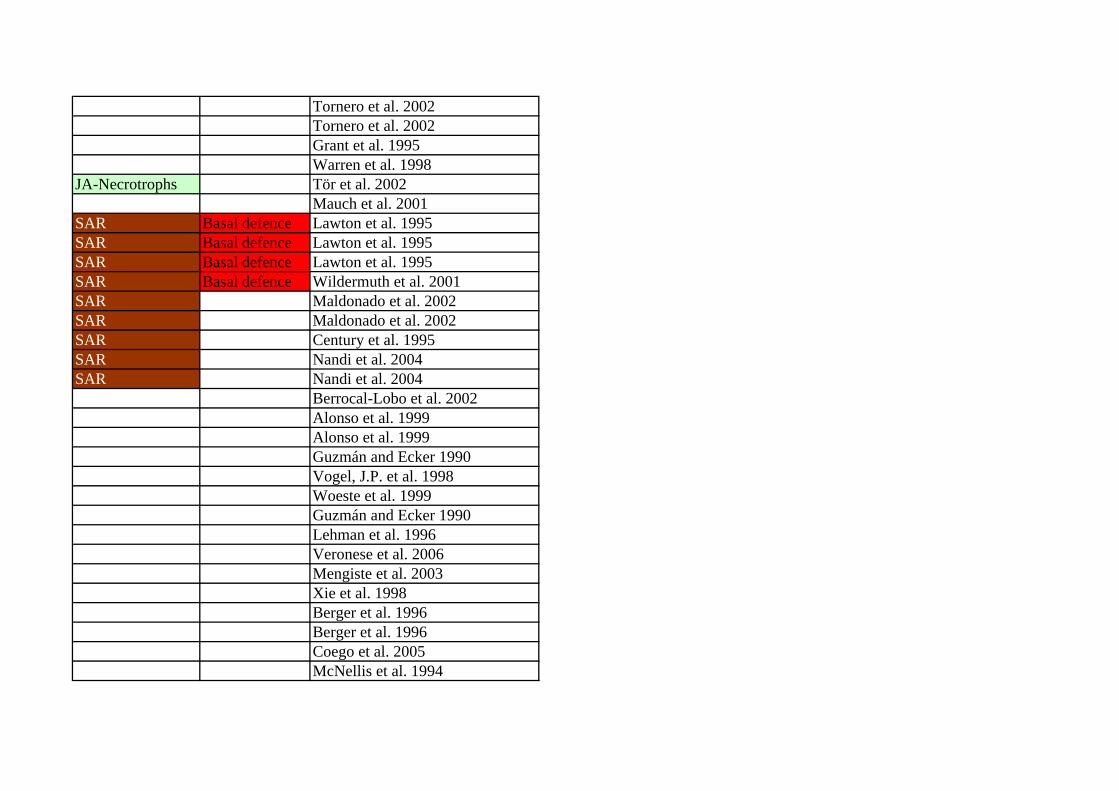
Tornero et al. 2002Tornero et al. 2002Grant et al. 1995Warren et al. 1998
JA-Necrotrophs Tör et al. 2002Mauch et al. 2001
SAR Basal defence Lawton et al. 1995SAR Basal defence Lawton et al. 1995SAR Basal defence Lawton et al. 1995SAR Basal defence Wildermuth et al. 2001SAR Maldonado et al. 2002SAR Maldonado et al. 2002SAR Century et al. 1995SAR Nandi et al. 2004SAR Nandi et al. 2004
Berrocal-Lobo et al. 2002Alonso et al. 1999Alonso et al. 1999Guzmán and Ecker 1990Vogel, J.P. et al. 1998Woeste et al. 1999Guzmán and Ecker 1990Lehman et al. 1996Veronese et al. 2006Mengiste et al. 2003Xie et al. 1998Berger et al. 1996Berger et al. 1996Coego et al. 2005McNellis et al. 1994

Chory et al. 1989Oyama et al. 1997Reed et al. 1993Nagatani et al. 1993Reed et al. 1993Jiang et al. 1997Torres et al. 2002Torres et al. 2002Ahlfors et al. 2004