Residential Zoned Ducted HVAC Systems - California …€¦ · · 2011-11-073.3 Measure Cost...
45
CODES AND STANDARDS ENHANCEMENT INITIATIVE (CASE) Residential Zoned Ducted HVAC Systems 2013 California Building Energy Efficiency Standards California Utilities Statewide Codes and Standards Team September 2011 This report was prepared by the California Statewide Utility Codes and Standards Program and funded by the California utility customers under the auspices of the California Public Utilities Commission. Copyright 2011 Pacific Gas and Electric Company, Southern California Edison, SoCalGas, SDG&E. All rights reserved, except that this document may be used, copied, and distributed without modification. Neither PG&E, SCE, SoCalGas, SDG&E, nor any of its employees makes any warranty, express of implied; or assumes any legal liability or responsibility for the accuracy, completeness or usefulness of any data, information, method, product, policy or process disclosed in this document; or represents that its use will not infringe any privately-owned rights including, but not limited to, patents, trademarks or copyrights
-
Upload
vuongkhanh -
Category
Documents
-
view
219 -
download
1
Transcript of Residential Zoned Ducted HVAC Systems - California …€¦ · · 2011-11-073.3 Measure Cost...

CODES AND STANDARDS ENHANCEMENT INITIATIVE (CASE)
Residential Zoned Ducted HVAC Systems
2013 California Building Energy Efficiency Standards
California Utilities Statewide Codes and Standards Team September 2011
This report was prepared by the California Statewide Utility Codes and Standards Program and funded by the California utility customers under the auspices of the California Public Utilities Commission.
Copyright 2011 Pacific Gas and Electric Company, Southern California Edison, SoCalGas, SDG&E.
All rights reserved, except that this document may be used, copied, and distributed without modification.
Neither PG&E, SCE, SoCalGas, SDG&E, nor any of its employees makes any warranty, express of implied; or assumes any legal liability or
responsibility for the accuracy, completeness or usefulness of any data, information, method, product, policy or process disclosed in this document;
or represents that its use will not infringe any privately-owned rights including, but not limited to, patents, trademarks or copyrights
Residential Zoned Ducted HVAC Systems
2013 California Building Energy Efficiency Standards September 2011
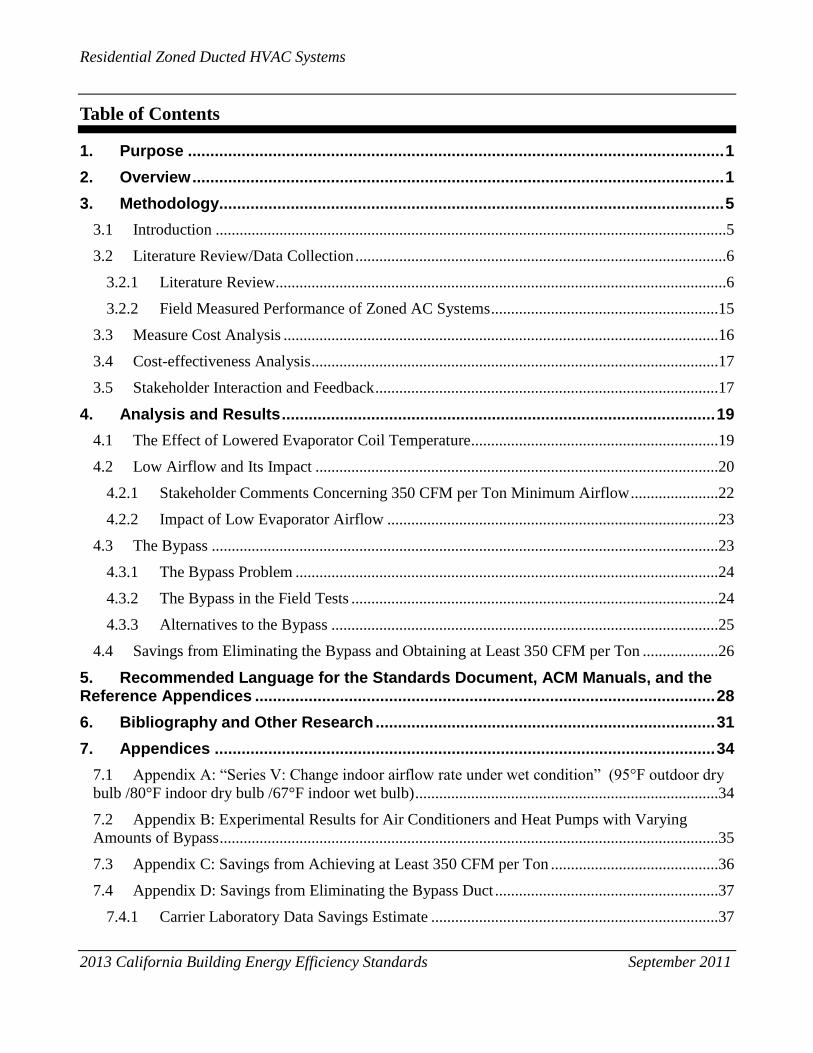
Table of Contents
1. Purpose ........................................................................................................................ 1
2. Overview ....................................................................................................................... 1
3. Methodology................................................................................................................. 5
3.1 Introduction ................................................................................................................................5
3.2 Literature Review/Data Collection .............................................................................................6
3.2.1 Literature Review.................................................................................................................6
3.2.2 Field Measured Performance of Zoned AC Systems .........................................................15
3.3 Measure Cost Analysis .............................................................................................................16
3.4 Cost-effectiveness Analysis ......................................................................................................17
3.5 Stakeholder Interaction and Feedback ......................................................................................17
4. Analysis and Results ................................................................................................. 19
4.1 The Effect of Lowered Evaporator Coil Temperature..............................................................19
4.2 Low Airflow and Its Impact .....................................................................................................20
4.2.1 Stakeholder Comments Concerning 350 CFM per Ton Minimum Airflow ......................22
4.2.2 Impact of Low Evaporator Airflow ...................................................................................23
4.3 The Bypass ...............................................................................................................................23
4.3.1 The Bypass Problem ..........................................................................................................24
4.3.2 The Bypass in the Field Tests ............................................................................................24
4.3.3 Alternatives to the Bypass .................................................................................................25
4.4 Savings from Eliminating the Bypass and Obtaining at Least 350 CFM per Ton ...................26
5. Recommended Language for the Standards Document, ACM Manuals, and the Reference Appendices ....................................................................................................... 28
6. Bibliography and Other Research ............................................................................ 31
7. Appendices ................................................................................................................ 34
7.1 Appendix A: “Series V: Change indoor airflow rate under wet condition” (95°F outdoor dry
bulb /80°F indoor dry bulb /67°F indoor wet bulb) ............................................................................34
7.2 Appendix B: Experimental Results for Air Conditioners and Heat Pumps with Varying
Amounts of Bypass .............................................................................................................................35
7.3 Appendix C: Savings from Achieving at Least 350 CFM per Ton ..........................................36
7.4 Appendix D: Savings from Eliminating the Bypass Duct ........................................................37
7.4.1 Carrier Laboratory Data Savings Estimate ........................................................................37

Residential Zoned Ducted HVAC Systems
2013 California Building Energy Efficiency Standards September 2011
7.4.2 Field Experiment and ACCA Zoning Manual Savings Estimate ......................................38
7.4.3 Conservative Model Savings Estimate: Extrapolations of Manufacturer’s Data Tables ...39
7.4.4 Final Cooling Savings Estimate .........................................................................................40
7.4.5 Combined Cooling Savings: 50% All Zones, 50% One Zone ...........................................40
7.4.6 Gas Furnace Heating Saving Estimate ...............................................................................41
7.4.7 Combined Heating Savings: 50% All Zones, 50% One Zone ...........................................41
Table of Figures
Figure 1. Energy Benefits ....................................................................................................................... 2
Figure 2. Life-Cycle Cost ....................................................................................................................... 4
Figure 3. Energy Consumption Zoned vs. Central System ..................................................................... 7
Figure 4. Overlay of AC Efficiency (watts cooling/watts energy consumed) in NAHB study .............. 9
Figure 5. Net Zoned System Efficiency with Bypass (Carrier Lab Data) ............................................ 12
Figure 6. ACCA Manual Equation ....................................................................................................... 13
Figure 7. Inputs and Results from ACCA Equation ............................................................................. 14
Figure 8. ACCA Manual Z Equation Approximates Field Unit 2 ........................................................ 14
Figure 9. Airflow Reduction with Multi-Zoned HVAC Systems ......................................................... 15
Figure 10. Normalized Fan Watt Draw Increase with Multi-Zoned HVAC Systems .......................... 16
Figure 11. Net Cost of Bypass Elimination and Additional Supplies................................................... 17
Figure 12. Air Conditioner Efficiency Falls with a Colder Evaporator Coil ........................................ 20
Figure 13. Single Zone vs. Multi-Zone Airflow and Watt Draw .......................................................... 21
Figure 14. Normalized Sensible EER vs. Supply CFM (laboratory test data) ..................................... 22
Figure 15. Typical California Zoned HVAC System ........................................................................... 23
Figure 16. Clarifying the Bypass Problem ............................................................................................ 24
Figure 17. Three Field Units Operated with Varying Bypass in One Zone Operation ........................ 25
Figure 18. A Two-Zone System with Capacity Diversion ................................................................... 26
Figure 19. Field Test — Net Sensible EER with Varying Bypass Flows and Zoning ......................... 27
Figure 20: Change in Indoor Airflow Rate Under Wet Conditions ...................................................... 34
Figure 21: Experimental Results for Air Conditioners and Heat Pumps with Varying Amounts of
Bypass ............................................................................................................................................ 35
Figure 22. Normalized Sensible EER vs. Supply CFM (normalized to 371 CFM per Ton) ................ 36
Figure 23. Carrier 23% Loss with 50% Bypass .................................................................................... 37

Residential Zoned Ducted HVAC Systems
2013 California Building Energy Efficiency Standards September 2011
Figure 24. Median Field Test and ACCA Manual 31% Loss with 50% Bypass .................................. 38
Figure 25. Conservative Model 22% Loss with 50% Bypass ............................................................... 39
Figure 26. Estimated 25.7% Efficiency Decrease in Zoned Mode ....................................................... 40
Project Team
Bruce A. Wilcox, Rick Chitwood and John Proctor designed and carried out the research and analysis
for this project.

Page 1
2013 California Building Energy Efficiency Standards September 2011
1. Purpose
This report recommends new mandatory requirements for zoned ducted HVAC systems in the
California 2013 Title 24 – Part 6 Building Energy Efficiency Standards. It also proposes eliminating
the current compliance credit for zoned systems and proposes that the current prescriptive standard for
airflow and fan watt draw become a mandatory item for the 2013 Standards.
2. Overview
a. Measure
Title Residential Zoned Ducted HVAC Systems
b.
Description
A mandatory requirement in the Low Rise Residential Standards for new single
family homes and existing homes undergoing HVAC alterations or replacement to
ensure the efficient functioning of air conditioners, furnaces, and heat pumps that
employ ducted zoned systems. The requirement includes three items, one of them
specific to ducted, multi-zone systems:
1. Eliminating bypass ducting that recirculates cooled or heated air back into the
return system.
2. Specifying that the system provide at least 350 CFM per ton through the unit
under all operating modes, with that airflow delivered to the house (this will
be a mandatory requirement for all systems).
3. Specifying that the watt draw of the system shall be no greater than 0.58
W/CFM as specified in Reference Residential Appendix RA3.
In addition, this CASE proposes elimination of the energy savings compliance credit
for zoned systems under the performance approach.
c. Type of
Change
Mandatory Measure – The change would add a mandatory measure whenever a
multi-zoned system is installed or altered.
Compliance Option – The change would eliminate multi-zoning from the list of
existing compliance options for meeting the Standards using the performance
approach.
Modeling – The change would eliminate the special modeling for zoned systems.
Otherwise it would not modify the calculation procedures or assumptions used in
making performance calculations.
Documents – The following documents are affected:
1. Standards Sections 150, 151, and 152
2. Residential ACM Approval Manual
3. Residential CF-4R and CF-6R

Page 2
2013 California Building Energy Efficiency Standards September 2011
d. Energy
Benefits
Figure 1 shows the energy savings in each climate zone for the 2,700 ft2 Prototype D
single family home with a multi-zoned system that provides ≥ 350 CFM per ton,
≤ 0.58 watts per CFM and no bypass versus the field measured CFM per ton, watts
per CFM and 50% bypass.
Electricity Demand Natural Gas
Time
Dependent
Valuation
Electricity
Time
Dependent
Valuation
\Gas
Climate
Zone (kWh/yr) (kW) (Therms/yr) (mTDV/yr) (mTDV/yr)
01 0 0.00 17 0.00 2.97
02 55 0.12 16 4.88 2.94
03 34 0.10 9 3.78 1.67
04 124 0.29 12 9.26 2.21
05 0 0.00 13 0.00 2.18
06 130 0.28 5 8.91 0.81
07 93 0.22 2 7.59 0.22
08 256 0.46 3 14.82 0.60
09 372 0.62 6 21.68 0.95
10 433 0.69 6 24.11 1.08
11 670 0.85 13 36.83 2.38
12 308 0.52 13 20.09 2.43
13 714 0.86 12 35.29 2.19
14 625 0.77 12 31.05 2.19
15 1749 1.44 1 67.18 0.19
16 282 0.58 24 20.38 4.30
Statewide 318 0.49 8 18.02 1.41
Figure 1. Energy Benefits
e. Non-
Energy
Benefits
Eliminating the bypass will improve installation quality and provide better control
over delivery velocities, potentially reducing noise. It will also reduce the excessive
drying effect on house air and reduce the probability of mold growth in the air
conditioner.
f.
Environmen-
tal Impact
The measure has no adverse environmental impact.
Material Increase (I), Decrease (D), or No Change (NC): (All units are lbs/year)
Mercury Lead Copper Steel Plastic Others
(Identify)
Per Unit
Measure1
NC NC NC NC NC
Per Prototype
Building2
NC NC NC NC NC

Page 3
2013 California Building Energy Efficiency Standards September 2011
g.
Technology
Measures
This change does not encourage or require a particular technology. This change
prohibits bypass ducts.
h.
Performance
Verification
of the
Proposed
Measure
HERS field verification using standard sampling is required for the airflow and watt
draw specifications. Building inspectors can verify that bypass ducts are not installed.
i. Cost
Effectiveness
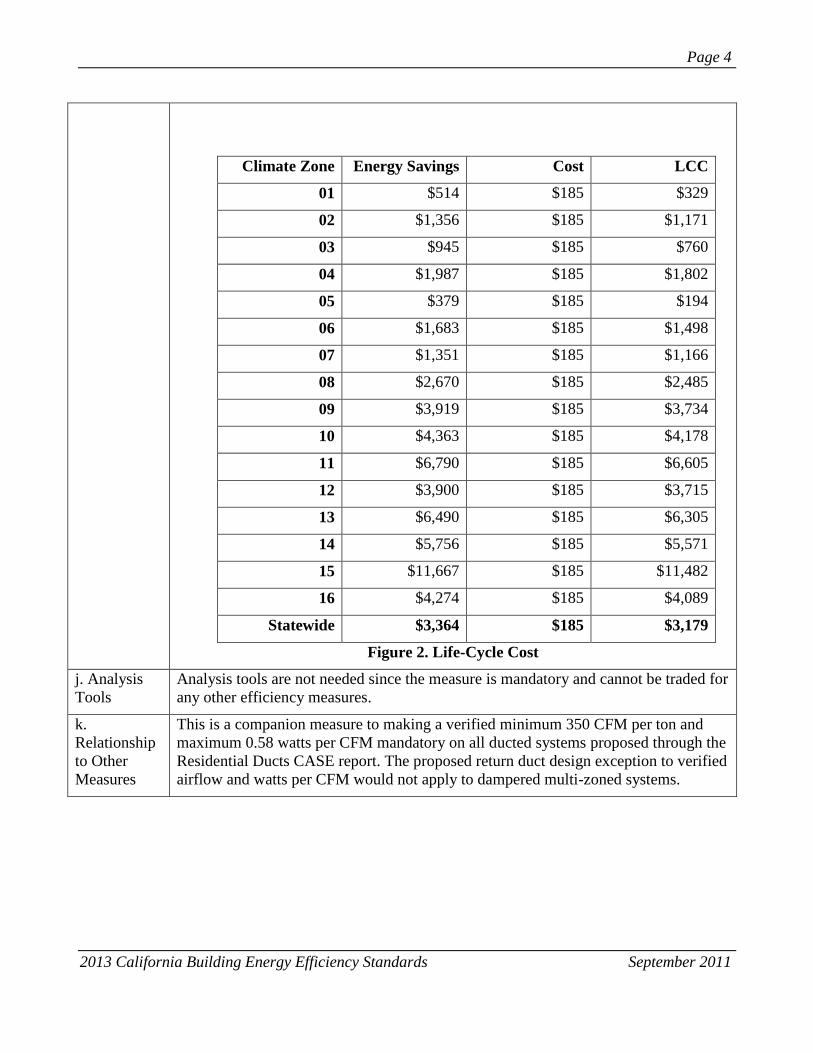
Based on the analysis in Section 4 of this CASE, Figure 2 shows the life-cycle cost in
each climate zone for the 2,700 ft2 Prototype D with a dampered zoned system
exhibiting a typical:
1. Cooling efficiency degradation of 9.1% due to low airflow half of the time with
all zones calling for cooling,
2. Cooling efficiency degradation of 25.7% due to the recirculation at 50% bypass
half the time,
3. Heating efficiency degradation of 1.9% half the time with all zones calling, and
4. Heating efficiency degradation of 6.8% half the time with one zone calling.
The measure is designed to ensure at least 350 CFM per ton and no greater than 0.58
watts per CFM in all modes as well as the elimination of the recirculation bypass.
The measure eliminates the bypass damper and ducts, and adds more supply ductwork
and registers.
Cost Savings:
1. Bypass damper $84
2. Bypass duct $10
3. Bypass takeoffs $10
4. Bypass elbows $32
5. Bypass insulation $5
6. Labor $30
7. Total = $171
Cost Increase:
1. Flex duct $10
2. Wyes $45
3. Boots $45
4. Registers $60
5. Labor $65
6. Total = $225
Net Cost Increase: $54 + $130 HERS verification = $185
Figure 2 shows the measure’s energy savings, cost and life-cycle cost (LCC) for each
zone. A positive LCC means the measure is cost effective in that zone.
Page 4
2013 California Building Energy Efficiency Standards September 2011
Climate Zone Energy Savings Cost LCC
01 $514 $185 $329
02 $1,356 $185 $1,171
03 $945 $185 $760
04 $1,987 $185 $1,802
05 $379 $185 $194
06 $1,683 $185 $1,498
07 $1,351 $185 $1,166
08 $2,670 $185 $2,485
09 $3,919 $185 $3,734
10 $4,363 $185 $4,178
11 $6,790 $185 $6,605
12 $3,900 $185 $3,715
13 $6,490 $185 $6,305
14 $5,756 $185 $5,571
15 $11,667 $185 $11,482
16 $4,274 $185 $4,089
Statewide $3,364 $185 $3,179
Figure 2. Life-Cycle Cost
j. Analysis
Tools
Analysis tools are not needed since the measure is mandatory and cannot be traded for
any other efficiency measures.
k.
Relationship
to Other
Measures
This is a companion measure to making a verified minimum 350 CFM per ton and
maximum 0.58 watts per CFM mandatory on all ducted systems proposed through the
Residential Ducts CASE report. The proposed return duct design exception to verified
airflow and watts per CFM would not apply to dampered multi-zoned systems.

Page 5
2013 California Building Energy Efficiency Standards September 2011
3. Methodology
3.1 Introduction
The primary purpose of zoning ducted air conditioners, heat pumps, and furnaces is to improve
comfort. Increased comfort is attained by having the capacity of the HVAC system (cooling or
heating delivered) follow the shift in load as it changes across the house. For example, it is common
for two-story homes to be too hot on the second floor in both summer and winter. Zoning has the
capability of diverting more of the HVAC capacity to the area with the higher load. Another common
example is a home with a significant area of west-facing and east-facing windows. In the summer, the
east rooms overheat in the morning and the west rooms overheat in the afternoon.
A letter sent to the California Energy Commission on June 6, 2011 by Mr. Glenn Hourahan, Senior
Vice President of the Air Conditioning Contractors of America (ACCA), included the following
conclusions:
“Properly designed and installed systems improve comfort.
A properly designed and installed system may or may not save a significant amount of energy,
or may increase energy use to some extent.”
(Hourahan 2011)
Providing the most agreeable temperature to all the zones is comfortable, but it carries with it the
distinct possibility of increased energy consumption. Since the most common home is single zoned
and has only one thermostat placed near the center of the house, temperatures in the rooms distant
from that thermostat will vary, sometimes significantly. If zoning is added, the more distant rooms
can be conditioned to a more comfortable temperature. This increased conditioning requires more
energy.
The National Association of Home Builders (NAHB) report, “Field Investigation of Carrier
Residential Zoning System” (Kenney & Barbour 1994) notes that:
“Studies have demonstrated that a multi-zone system will use more energy than a central
thermostat system when a constant setpoint is used. A 35 percent increase was documented
(Oppenheim 1991) as a direct result of a multi-zone system being more responsive to the
cooling needs of the entire house... While there is an increase in energy consumption, a zone
system does provide more uniform temperatures and better thermal comfort throughout the
house than that offered by a central thermostat.”
The American Society of Heating, Refrigeration and Air-Conditioning Engineers (ASHRAE)
Transactions Paper, “Energy Implications of Blower Overrun Strategies for a Zoned Residential
Forced Air System” by Oppenheim1 (1991) states:
1 This is possibly the Oppenheim 1991 paper referred to in the NAHB report quoted above. However the reference is not clear.
Page 6
2013 California Building Energy Efficiency Standards September 2011
“Zoning with a no-thermostat setup (Test 2) used more electricity for cooling than the system
in a central configuration (Test 1) with no thermostat setpoint scheduling. The reason is that
by having temperature control at three points instead of just one, the air-conditioning unit was
more responsive to the house load.”
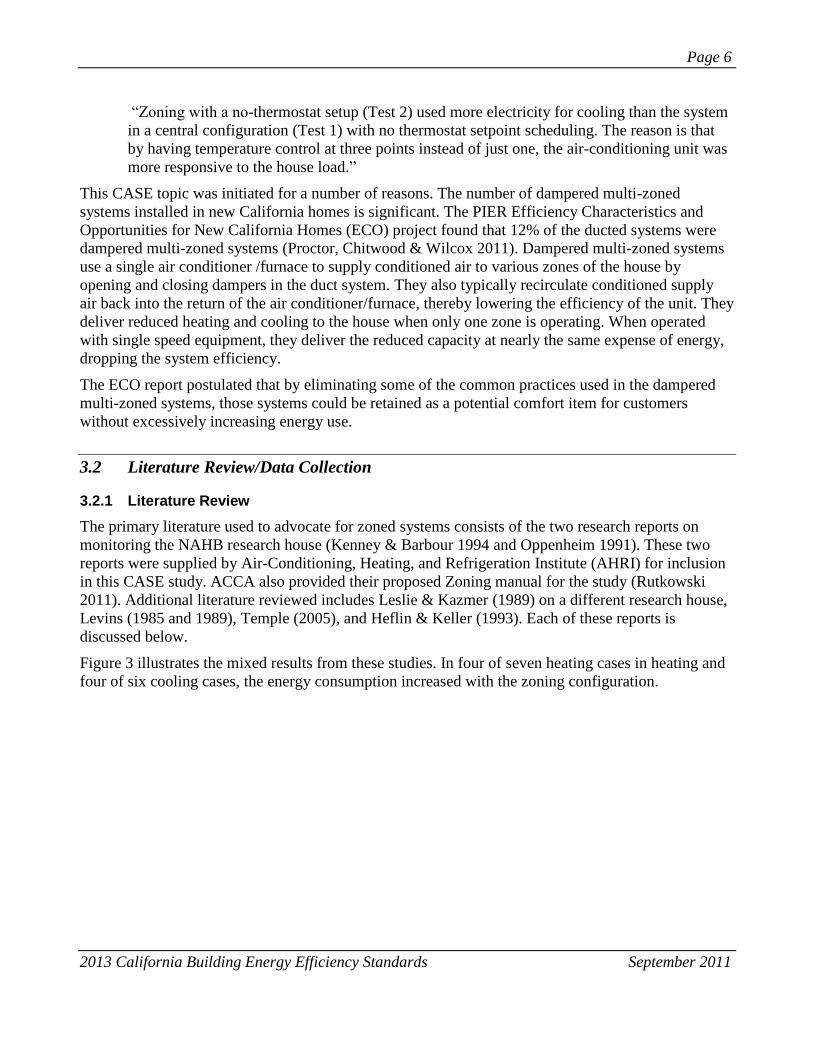
This CASE topic was initiated for a number of reasons. The number of dampered multi-zoned
systems installed in new California homes is significant. The PIER Efficiency Characteristics and
Opportunities for New California Homes (ECO) project found that 12% of the ducted systems were
dampered multi-zoned systems (Proctor, Chitwood & Wilcox 2011). Dampered multi-zoned systems
use a single air conditioner /furnace to supply conditioned air to various zones of the house by
opening and closing dampers in the duct system. They also typically recirculate conditioned supply
air back into the return of the air conditioner/furnace, thereby lowering the efficiency of the unit. They
deliver reduced heating and cooling to the house when only one zone is operating. When operated
with single speed equipment, they deliver the reduced capacity at nearly the same expense of energy,
dropping the system efficiency.
The ECO report postulated that by eliminating some of the common practices used in the dampered
multi-zoned systems, those systems could be retained as a potential comfort item for customers
without excessively increasing energy use.
3.2 Literature Review/Data Collection
3.2.1 Literature Review
The primary literature used to advocate for zoned systems consists of the two research reports on
monitoring the NAHB research house (Kenney & Barbour 1994 and Oppenheim 1991). These two
reports were supplied by Air-Conditioning, Heating, and Refrigeration Institute (AHRI) for inclusion
in this CASE study. ACCA also provided their proposed Zoning manual for the study (Rutkowski
2011). Additional literature reviewed includes Leslie & Kazmer (1989) on a different research house,
Levins (1985 and 1989), Temple (2005), and Heflin & Keller (1993). Each of these reports is
discussed below.
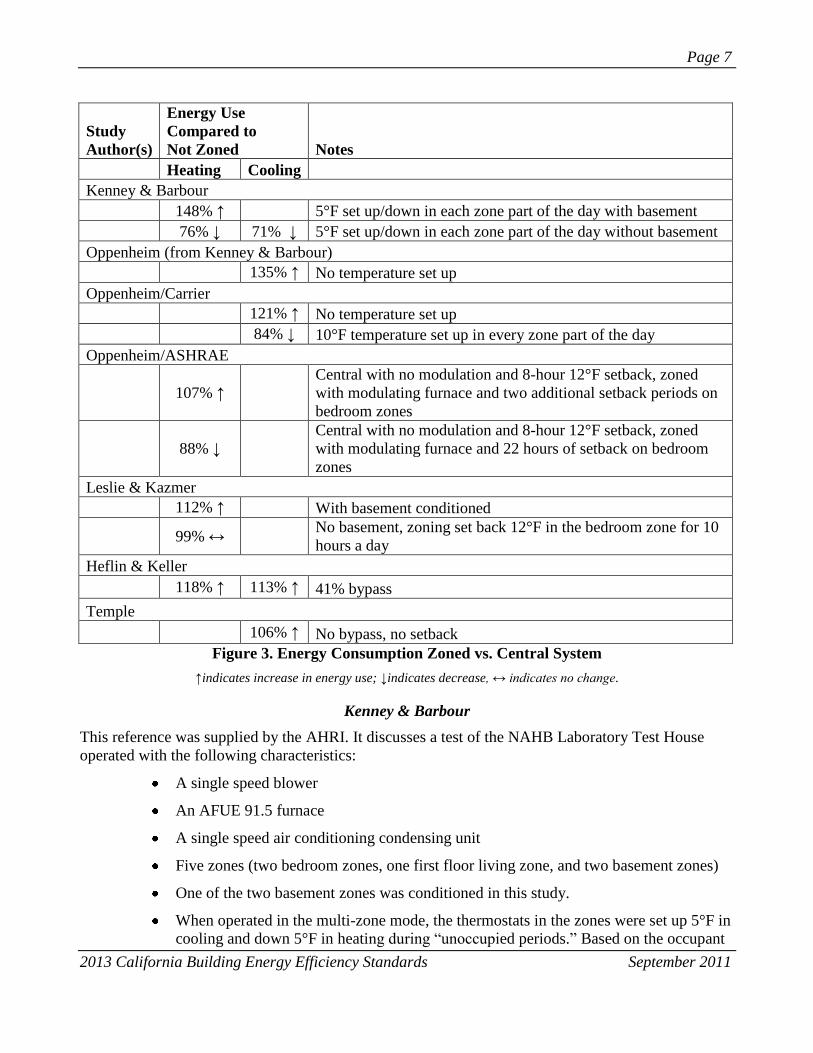
Figure 3 illustrates the mixed results from these studies. In four of seven heating cases in heating and
four of six cooling cases, the energy consumption increased with the zoning configuration.
Page 7
2013 California Building Energy Efficiency Standards September 2011
Study
Author(s)
Energy Use
Compared to
Not Zoned Notes
Heating Cooling
Kenney & Barbour
148% ↑
5°F set up/down in each zone part of the day with basement
76% ↓ 71% ↓ 5°F set up/down in each zone part of the day without basement
Oppenheim (from Kenney & Barbour)
135% ↑ No temperature set up
Oppenheim/Carrier
121% ↑ No temperature set up
84% ↓ 10°F temperature set up in every zone part of the day
Oppenheim/ASHRAE
107% ↑
Central with no modulation and 8-hour 12°F setback, zoned
with modulating furnace and two additional setback periods on
bedroom zones
88% ↓
Central with no modulation and 8-hour 12°F setback, zoned
with modulating furnace and 22 hours of setback on bedroom
zones
Leslie & Kazmer
112% ↑
With basement conditioned
99% ↔
No basement, zoning set back 12°F in the bedroom zone for 10
hours a day
Heflin & Keller
118% ↑ 113% ↑ 41% bypass
Temple
106% ↑ No bypass, no setback
Figure 3. Energy Consumption Zoned vs. Central System
↑indicates increase in energy use; ↓indicates decrease, ↔ indicates no change.
Kenney & Barbour
This reference was supplied by the AHRI. It discusses a test of the NAHB Laboratory Test House
operated with the following characteristics:
A single speed blower
An AFUE 91.5 furnace
A single speed air conditioning condensing unit
Five zones (two bedroom zones, one first floor living zone, and two basement zones)
One of the two basement zones was conditioned in this study.
When operated in the multi-zone mode, the thermostats in the zones were set up 5°F in
cooling and down 5°F in heating during “unoccupied periods.” Based on the occupant

Page 8
2013 California Building Energy Efficiency Standards September 2011
heat and moisture simulation data, the “unoccupied periods” appear to be: upstairs
zone = 14.5 hours, downstairs bedroom zone = 8 hours, downstairs living zone = 11
hours.
Air returns are present in every zone.
The test showed 34% increase in heating costs when the zoned system was operated with the
basement zone conditioned.
The test showed a 29% reduction in cooling energy consumption with zoning and the
temperature setpoint adjustments.
The test showed a problem with recovery time when the zones went from unoccupied to
occupied (conditioned vs. temperature floating).
The report states:
“Zoned systems are known to encourage energy conservation. This has resulted in
agencies such as the California Energy Commission to provide performance credits for
zoned heating and cooling systems.”
“Moreover, zoning can cause higher operating costs if thermostat setup/setback is not
used; however, the level of comfort is dramatically increased over the central
thermostat.”
“Studies have demonstrated that a multi-zone system will use more energy than a
central thermostat system when a constant setpoint is used. A 35 percent increase was
documented (Oppenheim 1991) as a direct result of a multi-zone system being more
responsive to the cooling needs of the entire house... While there is an increase in
energy consumption, a zone system does provide more uniform temperatures and
better thermal comfort throughout the house than that offered by a central thermostat.”
“Zoning can improve thermal comfort, especially in areas that are underheated or
ground coupled. However, increased operating cost is required to achieve higher levels
of thermal comfort.”
“Setback schedules can significantly reduce operating costs, however some degree of
thermal discomfort should be expected.”
“Only in mild temperatures, outside air greater than 51°F, did the zones recover from
the five degree setback. In all other cases, the zones did not recover to 71°F in the
allotted two hours.”
The cooling savings conclusions of the 1994 study are questionable due to two incongruities in
the report. First, there is an unexplained, random distribution of air conditioner efficiency
against outdoor temperature for the system operated as a whole house (single zone) system.
But in the zoned operation, the study shows a typical air conditioner efficiency pattern against
outdoor temperature. The reported efficiency of the unit as a whole house system was
substantially lower than when operated as a zoned system in all but the highest temperatures.
This is shown in Figure 4 (an overlay of the study’s Figures 3.2.2 and 3.2.3).

Page 9
2013 California Building Energy Efficiency Standards September 2011
Figure 4. Overlay of AC Efficiency (watts cooling/watts energy consumed) in NAHB study
Whole house single zone operation in red; five zone operation in black
Second, the report states that “both systems experienced approximately the same percentage of hours
in each temperature bin.” However the graphs in the report show vastly different “Typical Record
Year” temperature bins — a statistic that should be identical between the two graphs.
The study reported excess humidity (above 60% Rh) occurring in the zoned configuration twice as
often as with the whole house configuration, There were over 400 occurrences in the basement and
130 occurrences in the first-floor bedroom in the multi-zoned configuration compared to 180 and 60
occurrences respectively in the whole house configuration.
Oppenheim
This reference was supplied by the Air-Conditioning, Heating, and Refrigeration Institute (AHRI). It
discusses a test of the National Association of Homebuilders (NAHB) Laboratory Test House
operated with the following characteristics:
No bypass duct
A variable speed blower
A prototype modulating furnace
A two-speed air conditioner condensing unit
Three zones for cooling
The basement was not conditioned.
Page 10
2013 California Building Energy Efficiency Standards September 2011
The thermostats in the two bedroom zones were set at a consistent 85°F, 15 hours a
day every day (this was a set point temperature increase of 10°F for this unoccupied
house).
The first-floor living zone thermostat was set at a consistent 85°F, 9 hours a day every
day.
There is no mention of the presence of returns in the zones. They are assumed to be
present since this is the same test house as was used in the Kenney and Barbour study.
The test showed 21% increase in energy consumption when no temperature setpoint
adjustments were used.
The test showed a 16% reduction in energy consumption with the temperature setpoint
adjustments.
Leslie & Kazmer
This reference discusses a test at a Laboratory Test House in Chicago, Illinois, operated with the
following characteristics:
No bypass duct
A variable speed blower
A modulating (variable capacity) 82% AFUE furnace
A two-speed air conditioner
Bedroom, common, and basement zones
When operated in the heating multi-zone mode, the bedroom thermostats were set
down 12°F for 10 daytime hours.
Also when operated in the heating multi-zone mode, the basement thermostat was set
down 12°F for 15 nighttime hours.
Air returns are present in every zone.
The test showed 12% increase in heating energy consumption when the zoned system was
operated with the basement zone conditioned.
The test showed a 1% reduction in heating energy consumption with zoning and the
temperature setpoint adjustments.
The report states:
“Zoned heating provided superior comfort compared to central heat, especially in the
basement. However, the cost of providing this comfort was high.”
“A test of zoning without basement heat showed energy savings during cold weather
but not during moderate weather.”
“Modulating the furnace during central heat reduced energy consumption during
moderate weather but not during cold weather.”

Page 11
2013 California Building Energy Efficiency Standards September 2011
Levins
These two papers addressed severe zoning wherein the returns and supplies were fully blocked off
and towels were placed under the doors. Levins concluded: “Temperatures in closed-off rooms floated
with the outdoor temperature variations, but no savings were observed in the overall heat pump
electrical usage or in the house cooling load.”
Heflin & Keller
The authors of this paper were the senior engineer and director for split system development at Carrier
Corporation. This paper discusses a series of laboratory tests of zoning bypasses on single speed
residential air conditioners and heat pumps. The data from the tests are in Appendix B.
Figure 5 shows the loss of efficiency from recirculating air through a bypass. The left hand axis shows
the percentage of efficiency relative to no bypass. The bottom axis displays the percentage airflow
providing cooling or heating to the conditioned space. When 50% of the air is bypassed, the efficiency
falls to 77% of its full value or a 23% loss in efficiency.
This paper did not present data on the reduction in sensible heat ratio as the amount of bypass
increases. It is well known, however, that the recirculation bypass ducts reduce the sensible heat ratio
and that the sensible energy efficiency ratio (EER) drops faster than the total EER, as plotted in
Figure 5.

Page 12
2013 California Building Energy Efficiency Standards September 2011
Figure 5. Net Zoned System Efficiency with Bypass (Carrier Lab Data)
This paper states:
“Capacity and EER drop significantly with increasing air bypass for both the air
conditioner and heat pump. The capacity and the EER of the air conditioner decreased
47% and 46% respectively with an increase in bypass from 0% to 79% for DOE A test
conditions.”
Note that the reduction in capacity produces an almost equal reduction in efficiency.
This is because the watt draw of the condensing unit changes very little as the indoor coil
gets colder.
Heflin & Keller, commenting on the field studies by Leslie & Kazmer, Levins, and
Oppenheim, noted: “None of the studies employed a bypass duct.” The report continues,
“Moreover, the fact that the homes were unoccupied and zoning separation (closed doors) was
maintained throughout testing caused energy losses to be minimized. Thus the documented
field studies could be considered a ‘best case scenario’ in terms of energy savings.”
The report states:

Page 13
2013 California Building Energy Efficiency Standards September 2011
“Without setback/setup schedules, zoned systems typically used more energy than the
unzoned systems....”
“Most of the savings resulted from setback/setup.”
Temple
This reference discusses a test of a new townhouse in Pittsburg, Pennsylvania, which operated with
the following characteristics:
No bypass duct
A variable speed blower
A two-speed air conditioner
Bedroom, common, and basement zones
Three zones
Air returns are present in two zones.
The test showed 6% increase in cooling energy consumption when the system was operated
with zoned control.
Rutkowski (ACCA Manual Zr)
Air Conditioning Contractors of America is producing a manual titled “Zoned Comfort Systems for
Residential Low-Rise Buildings” (Rutkowski 2011). The manual, which is currently in a public
review draft, includes an equation (Figure 6) for estimating the supply dry bulb temperature based on
the bypass factor and other operating conditions. The equation assumes a sensible heat ratio of 1.0,
which is not achieved in the field. The result is an overestimate of the sensible cooling delivered to
the house.
While the equation produces an overly optimistic view of the sensible capacity of an air conditioner
operating with a bypass, plotting the results of that equation shows that the reduction in efficiency
from a bypass is approximately 31% for a 50% bypass. Figure 7 shows the numbers from that
calculation for a 3 ton unit with 1050 CFM through the unit and varying levels of bypass. The results
are plotted in Figure 8 and compared to the field data for unit #2.
Figure 6. ACCA Manual Equation

Page 14
2013 California Building Energy Efficiency Standards September 2011
% CFM to
Residence 100% 90% 80% 70% 60% 50%
BPF 0 0.1 0.2 0.3 0.4 0.5
OAT (°F) 95 95 95 95 95 95
EDB (°F) 75 75 75 75 75 75
B/C 32 32 32 32 32 32
LDB (°F) 50.3 49.1 47.5 45.6 43.4 40.8
Temperature
Split (°F) 24.7 25.9 27.5 29.4 31.6 34.2
CFM 1050 945 840 735 630 525
CapS (BTUh) 28,004 26,449 24,925 23,318 21,511 19,389
Relative Sensible
Capacity 100% 94% 89% 83% 77% 69%
Figure 7. Inputs and Results from ACCA Equation
Figure 8. ACCA Manual Z Equation Approximates Field Unit 2
Page 15
2013 California Building Energy Efficiency Standards September 2011
Literature Review Summary
The Heflin and Keller paper illustrates the severe penalty associated with bypass ducts.
From the literature review, it is also clear that even without a bypass duct or a dump zone and even
with modulating furnaces or air conditioners, the savings from zoned systems are far from certain. In
many studied cases the energy consumption increases with the use of the zoned systems.
3.2.2 Field Measured Performance of Zoned AC Systems
Rick Chitwood measured HVAC characteristics of 80 new California homes for the Efficiency
Characteristics and Opportunities for New California Homes (ECO) project (Proctor, Chitwood &
Wilcox 2011). That randomized survey included 10 dampered multi-zoned systems. Nine of the
systems were two-zone systems and one was a three-zone system.
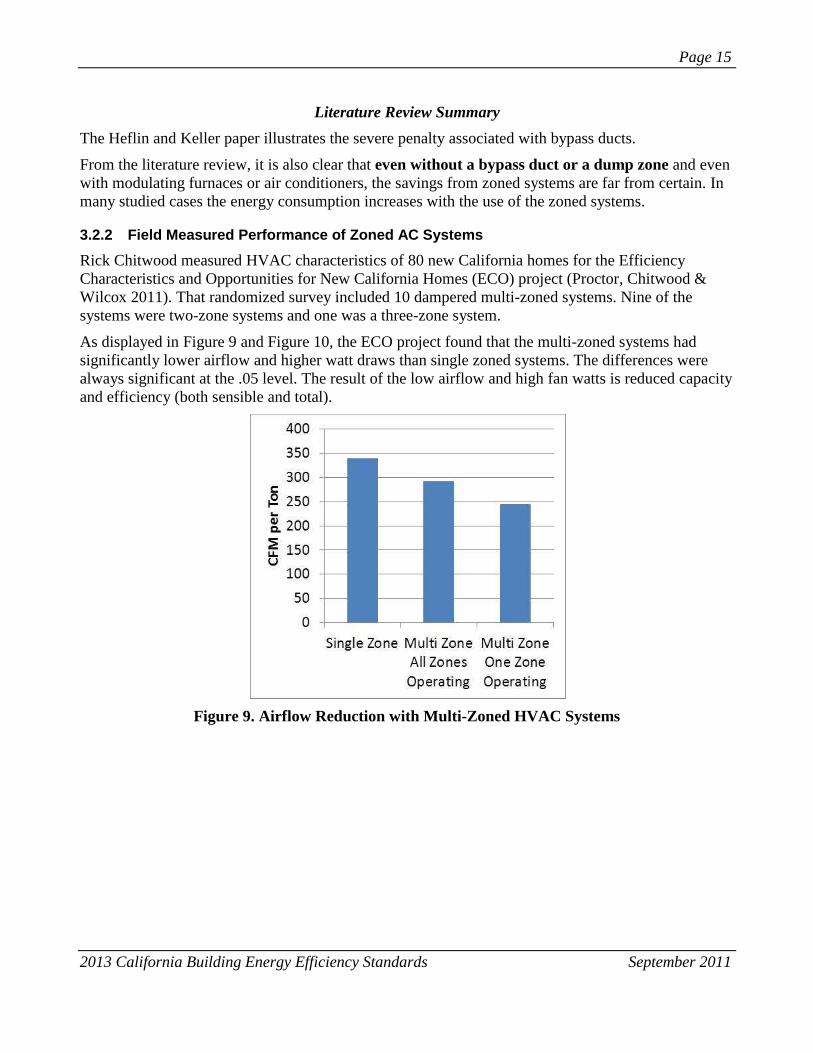
As displayed in Figure 9 and Figure 10, the ECO project found that the multi-zoned systems had
significantly lower airflow and higher watt draws than single zoned systems. The differences were
always significant at the .05 level. The result of the low airflow and high fan watts is reduced capacity
and efficiency (both sensible and total).
Figure 9. Airflow Reduction with Multi-Zoned HVAC Systems

Page 16
2013 California Building Energy Efficiency Standards September 2011
Figure 10. Normalized Fan Watt Draw Increase with Multi-Zoned HVAC Systems
Three of the zoned systems were studied intensively to confirm the energy savings potential. The
details of this follow-up investigation are in Section 4.3.1.
3.3 Measure Cost Analysis
As explained in Section 4, this measure proposes to eliminate the bypass and, as one option, add
additional supply ducts and registers to consistently deliver full capacity to the home while
concentrating that capacity largely in the zone needing cooling or heating.
Figure 11 shows the net cost of removing the bypass and increasing the number of supply ducts and
registers; costs are based on purchasing a low volume of materials and are derived from HVAC
contractors’ estimates of labor savings and labor increases for a 2700 ft2 zoned production home. The
costs for HERS verification and builder markup are added to arrive at the cost to the home buyer per
square foot of conditioned floor area

Page 17
2013 California Building Energy Efficiency Standards September 2011
Item Cost
Net labor $35
Net materials $19
Subcontractor overhead and profit $54
Total subcontractor invoice to builder $108
HERS verification $130
Total cost to builder $238
Builder markup 30% $71
Total cost to home buyer $309
Cost to home buyer per square foot of
conditioned floor area
$0.11
Figure 11. Net Cost of Bypass Elimination and Additional Supplies
We estimated the Time Dependent Valuation (TDV) energy savings of this measure for each climate
zone by using simulations of the 2,700 ft2 Prototype D, run with the 2013 Residential Standards
Development Software. This simulation model used an initial SEER and EER degraded by 17%, and
then compared it to the minimum allowable SEER and complementary EER. This simulation model
also used an initial AFUE degraded by 4.4% and compared it to the minimum allowable AFUE.
Efficiency degradations are derived in Section 4 of this report.
For these runs we assumed the home complied with all of the other provisions of the 2008
prescriptive standards except HVAC airflow and fan watt draw.
3.4 Cost-effectiveness Analysis
Life-cycle costs were calculated using the approach specified in the Life-Cycle Cost Methodology
prepared for the 2013 California Building Energy Efficiency Standards (Architectural Energy
Corporation 2011).
3.5 Stakeholder Interaction and Feedback
This work was publicly vetted through our stakeholder outreach process. This involved obtaining
feedback on the direction of the proposed changes through in-person meetings, webinars, email
correspondence and phone calls.
All of the main approaches, assumptions and methods of analysis used to develop this measure have
been presented for review at public stakeholder meetings. At each meeting, the utilities' CASE team
invited feedback on the proposed language and analysis thus far, and sent out a summary of what was
discussed at the meeting.

Page 18
2013 California Building Energy Efficiency Standards September 2011
A record of the stakeholder meeting presentations, summaries and other supporting documents can be
found at www.h-m-g.com/T24/Res_Topics/Residential_Topics.htm. Stakeholder meetings were held
on the following dates and locations:
April 14, 2010, San Ramon Conference Center, San Ramon, CA
April 12, 2011, Buehler Alumni and Visitors Center, UC Davis, CA
June 14, 2011, Stakeholder meeting with Honeywell, 418 Mission Ave., San Rafael, CA

Page 19
2013 California Building Energy Efficiency Standards September 2011
4. Analysis and Results
There are two primary methods by which the common multi-zoned dampered system lowers the
capacity and efficiency of an air conditioner. These are:
Lower airflow due to the additional restriction of zoning dampers, and
Recirculation through the air conditioner due to the use of a bypass duct.
Both of these items lower the evaporator coil temperature, which lowers the capacity and efficiency
of the unit.
In Sections 4.1 through 4.3 below, these items are examined individually with respect to their effect
on system efficiency.
Section 4.4 summarizes the savings from eliminating the bypass and obtaining airflow in excess of
350 CFM per ton.
4.1 The Effect of Lowered Evaporator Coil Temperature
The reverse Carnot cycle establishes a theoretical Coefficient of Performance2 (COPC) of a vapor
compression air conditioner. That Coefficient of Performance is stated as:
COPC = Tevap / (Tcond – Tevap)
Where
Tevap is the evaporator (inside coil) temperature and
Tcond is the condenser (outside coil) temperature
The Carnot cycle is a clearly unattainable ideal, but it make two things perfectly clear:
1. Higher condenser temperatures reduce the efficiency of the air conditioner.
2. Lower evaporator temperatures reduce the efficiency of the air conditioner.
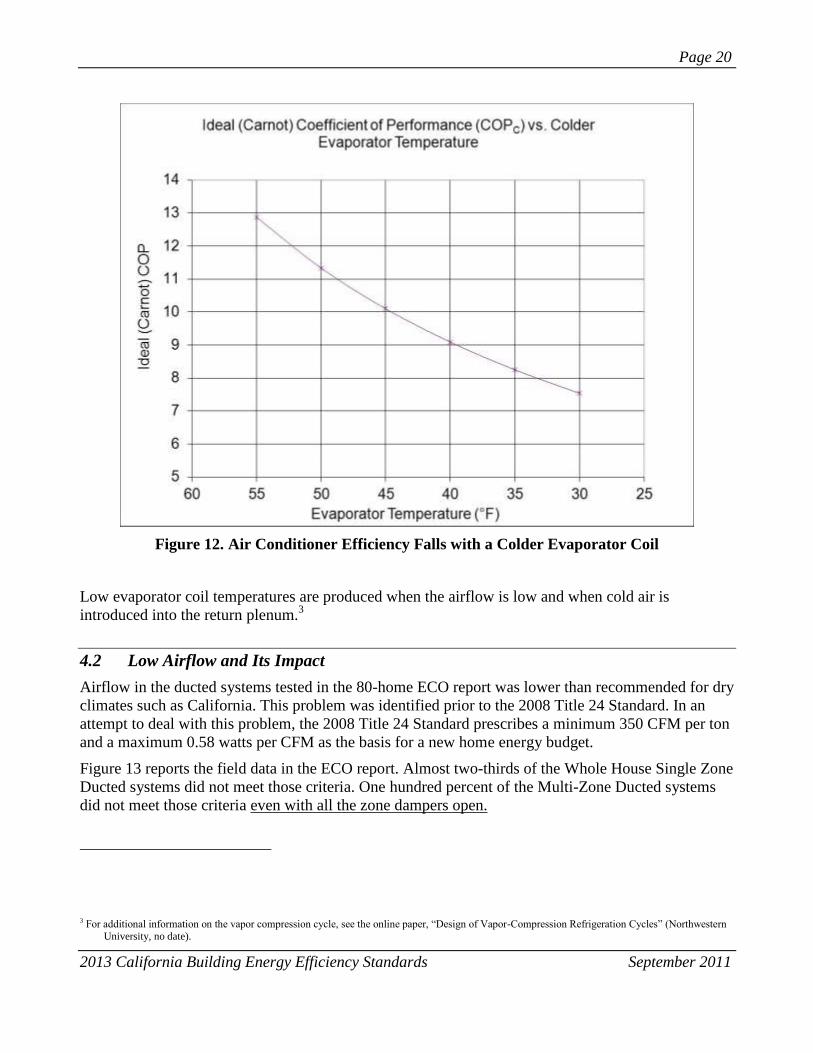
Figure 12 graphs the COPC of a unit with a condenser temperature of 95°F and varying evaporator
temperatures.
2 EER = COP * 3.414
Page 20
2013 California Building Energy Efficiency Standards September 2011
Figure 12. Air Conditioner Efficiency Falls with a Colder Evaporator Coil
Low evaporator coil temperatures are produced when the airflow is low and when cold air is
introduced into the return plenum.3
4.2 Low Airflow and Its Impact
Airflow in the ducted systems tested in the 80-home ECO report was lower than recommended for dry
climates such as California. This problem was identified prior to the 2008 Title 24 Standard. In an
attempt to deal with this problem, the 2008 Title 24 Standard prescribes a minimum 350 CFM per ton
and a maximum 0.58 watts per CFM as the basis for a new home energy budget.
Figure 13 reports the field data in the ECO report. Almost two-thirds of the Whole House Single Zone
Ducted systems did not meet those criteria. One hundred percent of the Multi-Zone Ducted systems
did not meet those criteria even with all the zone dampers open.
3 For additional information on the vapor compression cycle, see the online paper, “Design of Vapor-Compression Refrigeration Cycles” (Northwestern
University, no date).

Page 21
2013 California Building Energy Efficiency Standards September 2011
Parameter Whole House
Single Zone
Meeting Criteria
Whole House
Single Zone Not
Meeting Criteria
Multi-Zone All
Zones
Operating
Multi-Zone
One Zone
Operating
Fan Watts (Mean) 569 572 829 783
Problem Units (Percent
with W/CFM >0.58 or
CFM/ton < 350)
0% 63% 100% 100%
Fan Watts per CFM
(Mean of Problem Units)
0.48 0.57 0.75 0.85
CFM per Ton
(Mean if CFM/ton < 350)
407 309 292 244
Figure 13. Single Zone vs. Multi-Zone Airflow and Watt Draw
Laboratory tests at Purdue University (Shen, Braun & Groll 2004) show the efficiency effect of low
airflows outside the range normally published in the manufacturers’ extended data tables. As
displayed in Figure 14, these tests show that the efficiency is reduced to 75% of its full value when
the airflow is reduced to 50% of its baseline value.
The data for this graph are in Section 7.1 – Appendix A.

Page 22
2013 California Building Energy Efficiency Standards September 2011
Figure 14. Normalized Sensible EER vs. Supply CFM (laboratory test data)
It is nearly universally accepted that the evaporator airflow for dry climates like California’s should
exceed 350 CFM per ton. The comments of stakeholders on this matter are quoted in Section 4.2.1.
4.2.1 Stakeholder Comments Concerning 350 CFM per Ton Minimum Airflow
Mr. Hourahan of ACCA discussed the 350 CFM per ton minimum airflow:
“In fact, this is poor practice for most of the country. This is near the lower limit of some
OEM equipment, and may be below the low limit for some equipment.”
(Hourahan 2011)
Mr. Hourahan also concludes:
“System merit should be based on correct design and installation.
Code should require correct design and installation.”
(ibid)
Mr. Aniruddh Roy of the Air-Conditioning, Heating, and Refrigeration Institute (AHRI) wrote a letter
discussing some of AHRI’s thoughts on zoning. The letter succinctly points out that proper airflow is
essential to all systems, particularly zoned systems:
“When you include zoning on a poorly designed duct system, the poor performance is
multiplied.”
“Supply airflow must be maintained...”

Page 23
2013 California Building Energy Efficiency Standards September 2011
“We are sure you will agree that there are many poorly designed and installed duct systems in
California.”
(Roy 2011)
4.2.2 Impact of Low Evaporator Airflow
The impact of low evaporator airflow and the savings attributable to improving the airflow are fully
developed in Section 7.3 – Appendix C.
In summary:
The percentage air conditioning savings for improving multi-zoned units with all dampers
open from an average 292 CFM per ton to an average 371 CFM per ton is 9.1%
The percentage gas heating savings for improving airflow through the furnace heat exchanger
is 1.9%.
4.3 The Bypass
The second problem found with California multi-zone dampered system is the bypass duct. Figure 15
shows the most common California multi-zone dampered HVAC configuration. A single speed air
conditioner and furnace supply two zones through dampers. There is a bypass between the supply
plenum and the return plenum. The bypass flow is controlled by a bypass damper.
Figure 15. Typical California Zoned HVAC System
Zoned systems throttle the flow to the inoperative zone to reduce the cooling delivered to that zone.
The throttling increases the static pressure in the supply plenum and if no other adjustments were
made, the air velocity and noise would increase in the operating zone.
In order to avoid the noise, the contractors install a bypass with a damper that opens to relieve the
static pressure and maintain nearly the same flow to the operative zone. Bypasses mitigate the
increased velocity and noise at the zone calling for heat or cooling.
A “perfect” bypass would bypass all the “excess” air back into the return plenum of the air
conditioner/furnace, thereby lowering the evaporator coil temperature in cooling and raising the
furnace inlet temperature in heating. This reduces the capacity and efficiency of the air conditioner
and furnace.
Mr. Hourahan of ACCA notes that bypass ducts cause a lower cooling coil temperature (Hourahan
2011).

Page 24
2013 California Building Energy Efficiency Standards September 2011
This reduced cooling coil temperature is the major fundamental flaw with bypass ducts. The lower
evaporator temperature lowers the total and sensible capacity of the air conditioner.
4.3.1 The Bypass Problem
Figure 16 illustrates the bypass problem by showing an extreme situation.
Figure 16. Clarifying the Bypass Problem
In this situation, the return temperature in cooling would fall until the return temperature and the
supply temperature were the same and there was no heat transfer across the evaporator coil. As we
approach this situation, the watt draw of the compressor, condenser fan, and evaporator fan change
very little. The result is an ever-decreasing efficiency.
In heating the same phenomenon applies; the return temperature would rise until the supply
temperature and the return temperature were the same and no heat exchange would occur, but the
amount of gas burned would remain the same.
In both of these cases, the units normally have safety devices to avoid this extreme situation.
Nevertheless, the problem is still with us with any bypass.
4.3.2 The Bypass in the Field Tests
In reality no contractor would build the system illustrated in Figure 16. However, putting the units in
the field through varying levels of bypass revealed that some systems come remarkably close to this
situation.
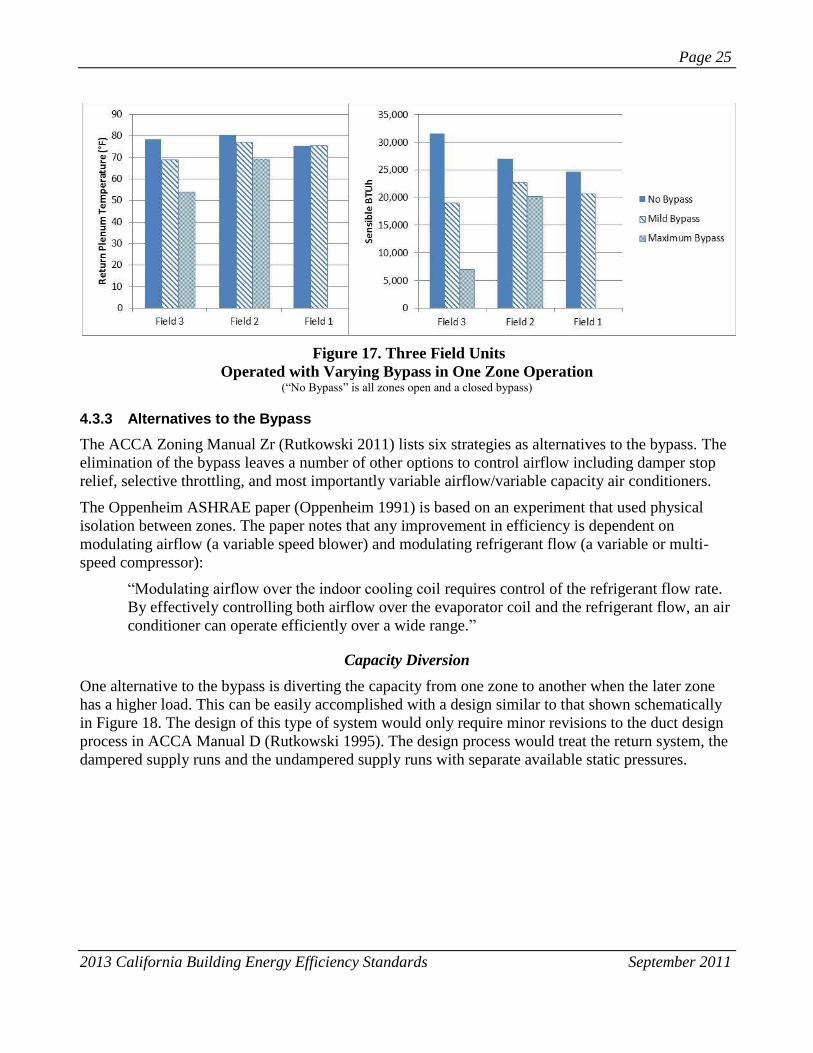
In every case the capacity reductions are significant, as shown in Figure 17Error! Reference source
not found.. The field experiments showed a return plenum temperature reduction in the median case
(Field 2) of 11.5°F and a capacity reduction of 25% with a 31% bypass
Page 25
2013 California Building Energy Efficiency Standards September 2011
Figure 17. Three Field Units
Operated with Varying Bypass in One Zone Operation (“No Bypass” is all zones open and a closed bypass)
4.3.3 Alternatives to the Bypass
The ACCA Zoning Manual Zr (Rutkowski 2011) lists six strategies as alternatives to the bypass. The
elimination of the bypass leaves a number of other options to control airflow including damper stop
relief, selective throttling, and most importantly variable airflow/variable capacity air conditioners.
The Oppenheim ASHRAE paper (Oppenheim 1991) is based on an experiment that used physical
isolation between zones. The paper notes that any improvement in efficiency is dependent on
modulating airflow (a variable speed blower) and modulating refrigerant flow (a variable or multi-
speed compressor):
“Modulating airflow over the indoor cooling coil requires control of the refrigerant flow rate.
By effectively controlling both airflow over the evaporator coil and the refrigerant flow, an air
conditioner can operate efficiently over a wide range.”
Capacity Diversion
One alternative to the bypass is diverting the capacity from one zone to another when the later zone
has a higher load. This can be easily accomplished with a design similar to that shown schematically
in Figure 18. The design of this type of system would only require minor revisions to the duct design
process in ACCA Manual D (Rutkowski 1995). The design process would treat the return system, the
dampered supply runs and the undampered supply runs with separate available static pressures.

Page 26
2013 California Building Energy Efficiency Standards September 2011
Figure 18. A Two-Zone System with Capacity Diversion
4.4 Savings from Eliminating the Bypass and Obtaining at Least 350 CFM per Ton
The intensive study of three zoned systems in this project combined with the existing literature
provide sufficient information on the combined savings from eliminating the bypass and ensuring at
least 350 CFM per ton delivered to the home.
There are two cases: the system with all zones operating and the system with one zone operating.
For the first case, the savings are due to the difference in efficiency between the average airflow of
the zoned systems (all zones calling) and the efficiency at the new average efficiency when at least
350 CFM per ton is attained. The calculations are in Section 7.3 – Appendix C. The savings are based
on the laboratory data in Figure 14.
In the second case, the savings are derived from an average of the median field tested unit as
confirmed by the Carrier paper on bypasses (Kenney & Barbour 1994) and a conservative model
based on the manufacturers’ extended data tables. The calculations are in Section 7.4 – Appendix D.
While the three field tests are not sufficient to estimate the effect of the bypass, there are additional
data that make this estimation possible. Specifically, these data are obtained from modeling from the
manufacturers’ extended data tables, independent laboratory tests at Purdue, laboratory tests at Carrier
Corporation, and models promulgated by the Air Conditioning Contractors of America.
Figure 19 displays the measured data from the three field units.

Page 27
2013 California Building Energy Efficiency Standards September 2011
Figure 19. Field Test — Net Sensible EER with Varying Bypass Flows and Zoning

Page 28
2013 California Building Energy Efficiency Standards September 2011
5. Recommended Language for the Standards Document,
ACM Manuals, and the Reference Appendices
SUBCHAPTER 7
LOW-RISE RESIDENTIAL BUILDINGS – MANDATORY FEATURES AND
DEVICES
SECTION 150 – MANDATORY FEATURES AND DEVICES
Any new construction in a low-rise residential building shall meet the requirements of this Section.
(m) Air-distribution System Ducts, Plenums, and Fans.
Add:
11. HVAC System Bypass Duct. Bypass ducts that deliver supply air to the return system shall not
be used.
12. Zonally Controlled Central Forced Air System. Central forced air systems shall simultaneously
demonstrate, in every zonal control mode, an airflow from the residence, through the circulation
blower and delivered to the house greater than 350 CFM per ton of nominal cooling capacity and a
blower Watt draw of less than 0.58 W/CFM as specified in Reference Residential Appendix RA3.
SUBCHAPTER 9
LOW-RISE RESIDENTIAL BUILDINGS—ADDITIONS AND ALTERATIONS
IN EXISTING LOW-RISE RESIDENTIAL BUILDINGS
SECTION 152 – ENERGY EFFICIENCY STANDARDS FOR ADDITIONS AND ALTERATIONS IN
EXISTING BUILDINGS THAT WILL BE LOW-RISE RESIDENTIAL OCCUPANCIES
Add:
(b) Alterations. Alterations to existing residential buildings or alterations in conjunction with a change in building
occupancy
to a low-rise residential occupancy shall meet Section 150 (m) 11 and 12 as well as either Item 1 or 2 below
Residential Compliance Manual
4.5.2 Zonal Control
An energy compliance credit is provided for zoned heating and air-conditioning systems, which save energy by providing selective conditioning for only the occupied areas of a house. A house having at least two zones (living and sleeping) may qualify for this compliance credit. The equipment may consist of one air-conditioning system for the living areas and another system for sleeping areas or a single system with zoning capabilities, set to turn off the sleeping areas in the daytime and the living area unit at night (see Figure 4-19).
There are unique eligibility and installation requirements for zonal control to qualify under the Standards. The following steps must be taken for the building to show compliance with the Standards under this exceptional method:

Page 29
2013 California Building Energy Efficiency Standards September 2011
1. Temperature Sensors. Each thermal zone, including a living zone and a sleeping zone, must have individual air temperature sensors that provide accurate temperature readings of the typical condition in that zone. 2. Habitable Rooms. Each habitable room in each zone must have a source of space heating and/or cooling (if zonal credit for cooling is desired) such as forced air supply registers or individual conditioning units. Bathrooms, laundry, halls and/or dressing rooms are not habitable rooms. 3. Non-closeable Openings. The total non-closeable opening area (W) between adjacent living and sleeping thermal zones (i.e., halls, stairwells, and other openings) must be less than or equal to 40 ft². All remaining zonal boundary areas must be separated by permanent floor-to-ceiling walls and/or fully solid, operable doors capable of restricting free air movement when in the closed position.
4. Thermostats. Each zone must be controlled by a central automatic dual setback thermostat that can control the conditioning equipment and maintain preset temperatures for varying time periods in each zone independent of the other. Other requirements specific to forced air ducted systems include the following:
1. Each zone must be served by a return air register located entirely within the zone. Return air dampers are not required. 2. Supply air dampers must be manufactured and installed so that when they are closed, there is no measurable airflow at the registers. 3. The system must be designed to operate within the equipment manufacturer's specifications. 4. Air is to positively flow into, through, and out of a zone only when the zone is being conditioned. No measurable amount of supply air is to be discharged into unconditioned or unoccupied space in order to maintain proper airflow in the system. Although multiple thermally distinct living and/or sleeping zones may exist in a residence, the correct way to model zonal control for credit requires only two zones: one living zone and one sleeping zone. All separate living zone components must be modeled as one single living zone:the same must be done for sleeping zones.

Page 30
2013 California Building Energy Efficiency Standards September 2011
Page 31
2013 California Building Energy Efficiency Standards September 2011
6. Bibliography and Other Research
Architectural Energy Corporation. January 14, 2011. “Life-Cycle Cost Methodology” prepared for the
2013 California Building Energy Efficiency Standards. Online document retrieved June 28, 2011
from:
www.energy.ca.gov/title24/2013standards/prerulemaking/documents/general_cec_documents/201
1-01-14_LCC_Methodology_2013.pdf
Hourahan, G. June 6, 2011. Letter to Ron Yasney, Contract Manager, California Energy Commission.
Mr. Hourahan is the Senior Vice President – Technical for the Air Conditioning Contractors of
America. ACCA is a national trade association representing professional HVAC contracting
businesses. This letter discussed multi-zoned systems with the purpose of dissuading the
Commission from adopting the proposed changes. The conclusion of his five-page letter included
the following statements, which succinctly point out the need for the changes in this proposal:
Properly designed and installed systems improve comfort.
A properly designed and installed system may or may not save a significant amount of
energy, or may increase energy use to some extent.
System merit should be based on correct design and installation.
Code should require correct design and installation
Heflin, C. & F. Keller. 1993. “Steady-State Analysis of Single-Speed Residential Split Systems with
Zoning Bypass.” ASHRAE Transactions, Vol. 99, Part 2, Paper number 3693, Pages 40-51.
American Society of Heating Refrigeration and Air-Conditioning Engineers. Atlanta GA.
Kenney, T. & C. Barbour. August 31, 1994. “Field Investigation of Carrier Residential Zoning
System.” Final Report prepared for Carrier Corporation by NAHB Research Center, Inc. Upper
Marlboro, MD.
This reference was supplied by the Air-Conditioning, Heating, and Refrigeration Institute (AHRI).
It discusses a test of the National Association of Homebuilders (NAHB) Laboratory Test House,
as discussed in Section 3.2.1 of this report.
Leslie, N., & K. Kazmer. 1989. “Performance of a Residential Zoned Heating System in an
Unoccupied Research House.” ASHRAE Transactions, Vol. 95, Part 1, Pages 903-909. American
Society of Heating Refrigeration and Air-Conditioning Engineers. Atlanta, GA.
Levins, W. December 1985. “Experimental Measurements of Heating Season Energy Savings from
Various Retrofit Techniques on Three Unoccupied Houses.” Proceedings of the
ASHRAE/DOE/BTECC/CIBSE Conference-Thermal Performance of the Exterior Envelopes of
Buildings III. From Heflin and Keller.
Levins, W. December 1989. “Measured Performance of Zoning in Single-Family Houses.”
Proceedings of the ASHRAE/DOE/BTECC/CIBSE Conference. Orlando, FL. From Heflin and
Keller.
Lindeburg, M. 1990. Mechanical Engineering Reference Manual. Eighth Edition. Equation 10.66,
Page 10-14. Professional Publications Inc. Belmont, CA.
Page 32
2013 California Building Energy Efficiency Standards September 2011
Northwestern University. No Date. “Design of Vapor-Compression Refrigeration Cycles.” Online
document retrieved June 28, 2011 from:
www.qrg.northwestern.edu/thermo/design-library/refrig/refrig.html
This reference discusses the vapor compression cycle including the Carnot cycle, the effect of the
temperature of the heat source/evaporator, the effect of the temperature of the heat sink/condenser,
and other topics.
Oppenheim, P. 1991. “Energy Implications of Blower Overrun Strategies for a Zoned Residential
Forced Air System.” ASHRAE Transactions, Vol. 97, Part 2, Pages 354-362. American Society of
Heating Refrigeration and Air-Conditioning Engineers. Atlanta, GA.
This reference was supplied by the Air-Conditioning, Heating, and Refrigeration Institute (AHRI).
It discusses a test of the National Association of Homebuilders (NAHB) Laboratory Test House,
as discussed in Section 3.2.1 of this report.
Oppenheim, P. 1992. “Energy-Saving Potential of a Zoned Forced-Air Heating System.” ASHRAE
Transactions, Vol. 98, Part 1, Pages 1247-1257. American Society of Heating Refrigeration and
Air-Conditioning Engineers. Atlanta, GA.
Proctor, J., R. Chitwood, & B. Wilcox. 2011. “Efficiency Characteristics and Opportunities for New
California Homes (ECO).” Prepared for California Energy Commission. Publication pending.
Report on Contract Number: PIR-08-019.
This reference is the source for the data on the performance of 10 random multi-zoned systems
with dampered zones.
Roy, A. May 17, 2011. Letter to Mr. Bruce Wilcox.
Mr. Aniruddh Roy is the Regulatory Engineer with the Air-Conditioning, Heating, and
Refrigeration Institute (AHRI). AHRI is the trade association representing manufacturers of
heating, cooling, water heating, and commercial refrigeration equipment. This letter discussed
multi-zoned systems with the purpose of dissuading the Commission from adopting the proposed
changes. In his letter he noted that:
The AHRI Zoning Members stress the importance of maintaining adequate airflow (CFM)
through the A/C Unit at all times.
When you include zoning on a poorly designed duct system, the poor performance is
multiplied.
Supply airflow must be maintained....
We are sure you will agree that there are many poorly designed and installed duct systems in
California.
Rutkowski, H. 1995. Residential Duct Systems Manual D. Air Conditioning Contractors of America.
Washington, D.C.
Rutkowski, H. 2011. Unpublished draft of ACCA Manual Zr: Zoned Comfort Systems for Residential
Low-Rise Buildings. Air Conditioning Contractors of America. Washington, D.C.

Page 33
2013 California Building Energy Efficiency Standards September 2011
Shen, B., J. Braun, & E. Groll. 2004. “Other Steady-state Tests for ASHRAE Project” in Steady-state
Tests1, Section Title: Series V: Change indoor airflow rate under wet condition. Ray W. Herrick
Laboratories, The School of Mechanical Engineering, Purdue University. West Lafayette, IN.
This reference is reproduced in Appendix A.
Sun Power Association. 1990. “Short Term Evaluation of Savings Due to Furnace Components.” Sun
Power Association. Wheat Ridge, CO.
Temple, K. 2005. “Field Performance of a Zoned Forced-Air Cooling System in an Energy-Efficient
Home.” ASHRAE Transactions, Vol. 111, Part 2, Paper DE-05-4-1. American Society of Heating,
Refrigeration, and Air-Conditioning Engineers. Atlanta, GA.
Modera, Mark. Telephone and email communications, 2010 and 2011, Professor, Civil and
Environmental Engineering, Sempra Energy Chair in Energy Efficiency, Director, Western
Cooling Efficiency Center. University of California, Davis.
Page 34
2013 California Building Energy Efficiency Standards September 2011
7. Appendices
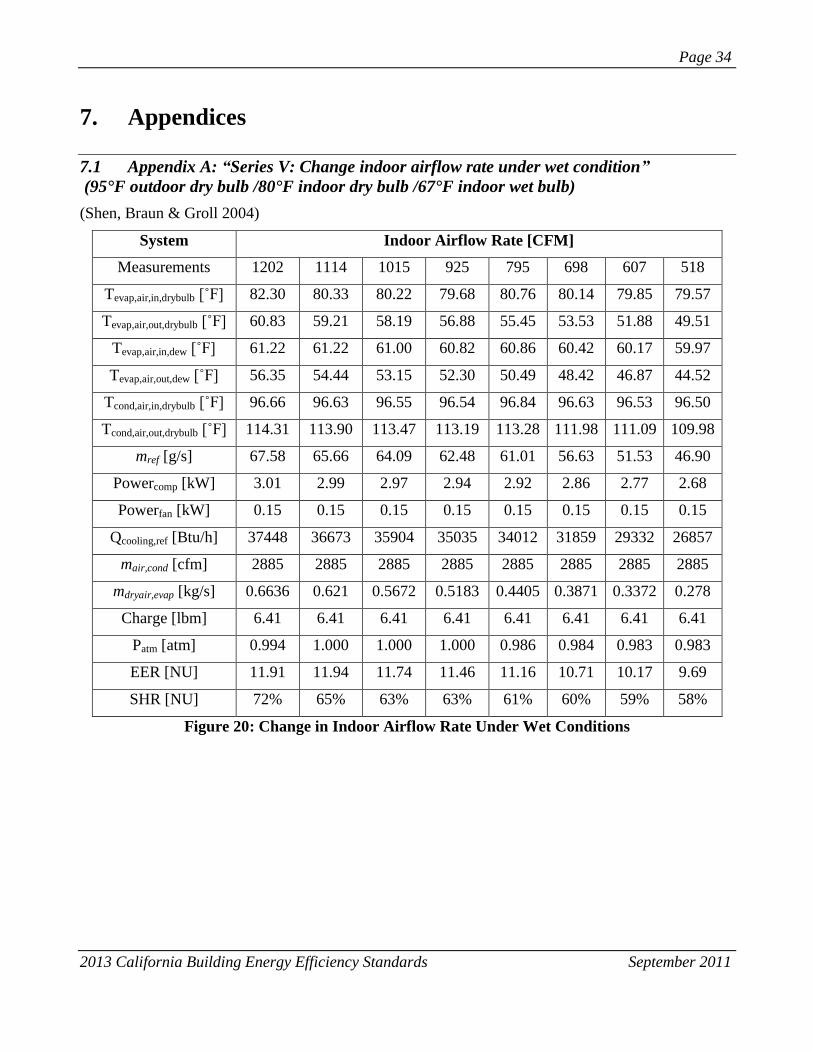
7.1 Appendix A: “Series V: Change indoor airflow rate under wet condition”
(95°F outdoor dry bulb /80°F indoor dry bulb /67°F indoor wet bulb)
(Shen, Braun & Groll 2004)
System Indoor Airflow Rate [CFM]
Measurements 1202 1114 1015 925 795 698 607 518
Tevap,air,in,drybulb [˚F] 82.30 80.33 80.22 79.68 80.76 80.14 79.85 79.57
Tevap,air,out,drybulb [˚F] 60.83 59.21 58.19 56.88 55.45 53.53 51.88 49.51
Tevap,air,in,dew [˚F] 61.22 61.22 61.00 60.82 60.86 60.42 60.17 59.97
Tevap,air,out,dew [˚F] 56.35 54.44 53.15 52.30 50.49 48.42 46.87 44.52
Tcond,air,in,drybulb [˚F] 96.66 96.63 96.55 96.54 96.84 96.63 96.53 96.50
Tcond,air,out,drybulb [˚F] 114.31 113.90 113.47 113.19 113.28 111.98 111.09 109.98
mref [g/s] 67.58 65.66 64.09 62.48 61.01 56.63 51.53 46.90
Powercomp [kW] 3.01 2.99 2.97 2.94 2.92 2.86 2.77 2.68
Powerfan [kW] 0.15 0.15 0.15 0.15 0.15 0.15 0.15 0.15
Qcooling,ref [Btu/h] 37448 36673 35904 35035 34012 31859 29332 26857
mair,cond [cfm] 2885 2885 2885 2885 2885 2885 2885 2885
mdryair,evap [kg/s] 0.6636 0.621 0.5672 0.5183 0.4405 0.3871 0.3372 0.278
Charge [lbm] 6.41 6.41 6.41 6.41 6.41 6.41 6.41 6.41
Patm [atm] 0.994 1.000 1.000 1.000 0.986 0.984 0.983 0.983
EER [NU] 11.91 11.94 11.74 11.46 11.16 10.71 10.17 9.69
SHR [NU] 72% 65% 63% 63% 61% 60% 59% 58%
Figure 20: Change in Indoor Airflow Rate Under Wet Conditions

Page 35
2013 California Building Energy Efficiency Standards September 2011
7.2 Appendix B: Experimental Results for Air Conditioners and Heat Pumps with
Varying Amounts of Bypass
(Heflin & Keller 1993)
Bypass % Fixed Orifice AC
EER(total)
TXV AC
EER(total)
TXV Heat Pump
EER(total)
Orifice Heat
Pump COP
0 10.6 10.2 7.44 2.84
22 10.6 9.6 6.7 2.53
41 9.19 8.77 6.49 2.34
60 7.66 6.81 5.15 1.81
79 5.74 4.03 3.54 1.18
Figure 21: Experimental Results for Air Conditioners and Heat Pumps with Varying Amounts
of Bypass
Page 36
2013 California Building Energy Efficiency Standards September 2011
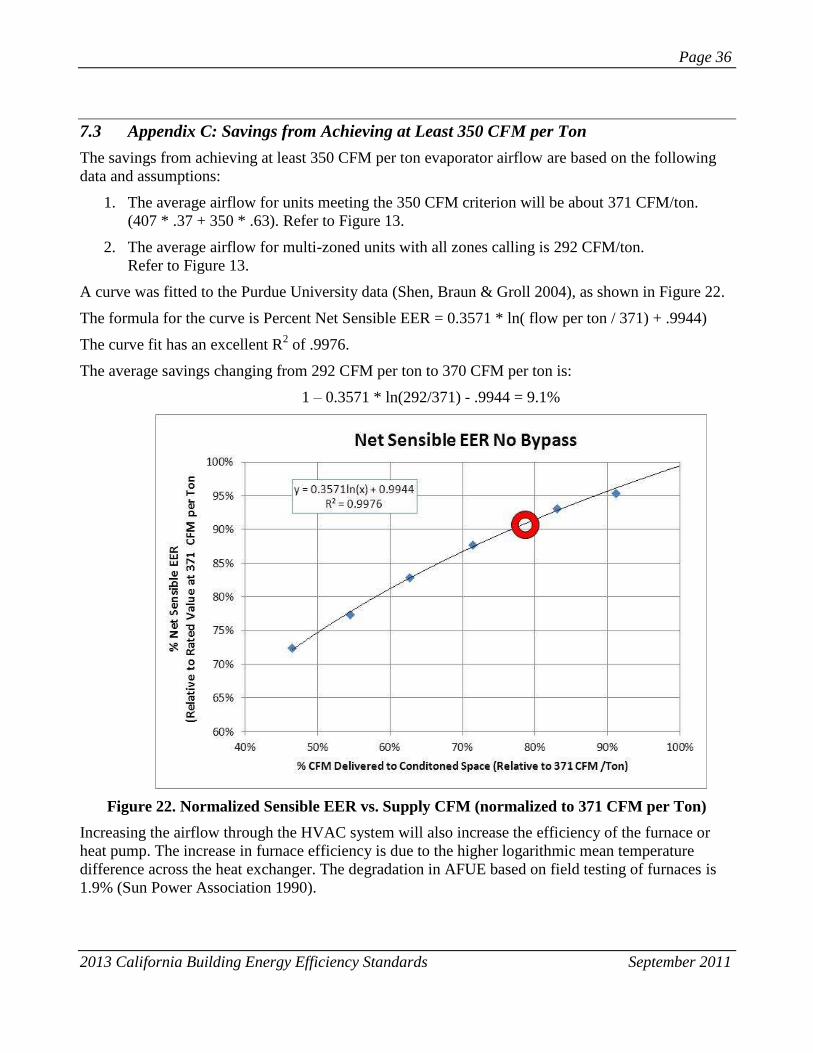
7.3 Appendix C: Savings from Achieving at Least 350 CFM per Ton
The savings from achieving at least 350 CFM per ton evaporator airflow are based on the following
data and assumptions:
1. The average airflow for units meeting the 350 CFM criterion will be about 371 CFM/ton.
(407 * .37 + 350 * .63). Refer to Figure 13.
2. The average airflow for multi-zoned units with all zones calling is 292 CFM/ton.
Refer to Figure 13.
A curve was fitted to the Purdue University data (Shen, Braun & Groll 2004), as shown in Figure 22.
The formula for the curve is Percent Net Sensible EER = 0.3571 * ln( flow per ton / 371) + .9944)
The curve fit has an excellent R2 of .9976.
The average savings changing from 292 CFM per ton to 370 CFM per ton is:
1 – 0.3571 * ln(292/371) - .9944 = 9.1%
Figure 22. Normalized Sensible EER vs. Supply CFM (normalized to 371 CFM per Ton)
Increasing the airflow through the HVAC system will also increase the efficiency of the furnace or
heat pump. The increase in furnace efficiency is due to the higher logarithmic mean temperature
difference across the heat exchanger. The degradation in AFUE based on field testing of furnaces is
1.9% (Sun Power Association 1990).

Page 37
2013 California Building Energy Efficiency Standards September 2011
7.4 Appendix D: Savings from Eliminating the Bypass Duct
The savings from eliminating the bypass duct are based on the following data and assumptions:
1. The bypass for the most common two zone system is a “perfect” 50% bypass. This would
maintain the same airflow to the zone calling for cooling or heating.
2. The Carrier laboratory tests are the most conclusive and well-controlled measurements of the
efficiency degradation due to bypasses.
3. The three field experiments provide recent additional data to supplement the Carrier laboratory
tests.
4. The manufacturers’ extended data tables, when extrapolated to the lower return temperatures
that occur with a bypass, provide a conservative estimate of the capacity reductions due to the
bypass.
5. The ACCA bypass calculation contained in Manual Zr produce capacity reductions similar to
the Carrier tests and very close to the median of the three field experiments.
7.4.1 Carrier Laboratory Data Savings Estimate
For a 50% bypass, the Carrier lab data shows an average 23% reduction in efficiency, as shown in
Figure 23.
Figure 23. Carrier 23% Loss with 50% Bypass
Page 38
2013 California Building Energy Efficiency Standards September 2011
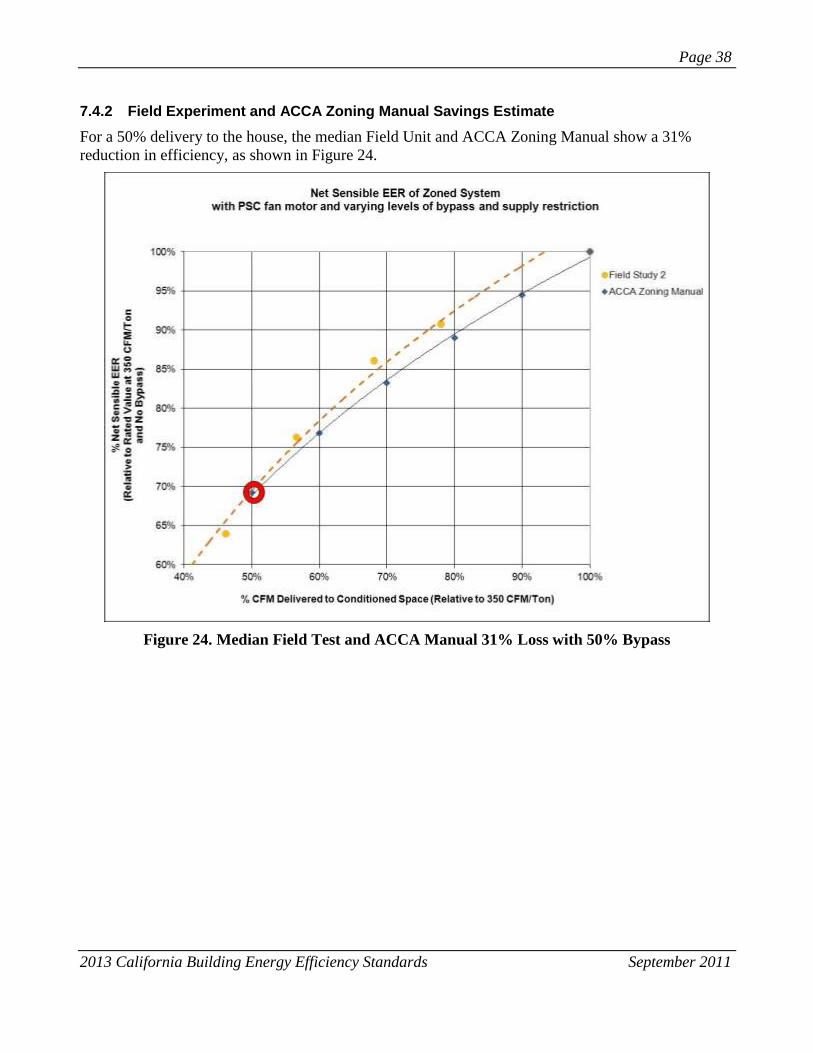
7.4.2 Field Experiment and ACCA Zoning Manual Savings Estimate
For a 50% delivery to the house, the median Field Unit and ACCA Zoning Manual show a 31%
reduction in efficiency, as shown in Figure 24.
Figure 24. Median Field Test and ACCA Manual 31% Loss with 50% Bypass

Page 39
2013 California Building Energy Efficiency Standards September 2011
7.4.3 Conservative Model Savings Estimate: Extrapolations of Manufacturer’s Data Tables
For a 50% delivery to the house with a 50% bypass, conservative model shows a 22% reduction in
efficiency, as shown in Figure 25.
Figure 25. Conservative Model 22% Loss with 50% Bypass

Page 40
2013 California Building Energy Efficiency Standards September 2011
7.4.4 Final Cooling Savings Estimate
For multi-zone systems operating with half the zones operating and a 50% bypass, the cooling savings
was taken as an average between the modeled Sensible EER from the conservative manufacturers’
extended tables (displayed as the 50% bypass line in Figure 26) and the measured Sensible EER from
Unit 2 (the median unit) in the Field Study. As shown in Figure 26, the savings are 25.7% in cooling.
Figure 26. Estimated 25.7% Efficiency Decrease in Zoned Mode
7.4.5 Combined Cooling Savings: 50% All Zones, 50% One Zone
Average cooling savings based on 50% of time with all zones calling 50% with one zone calling
Using 9.1% from Section 7.3 and 25.7% from Section 7.4.4, the combined cooling savings is:
average(9.1%,25.7%) = 17.4%

Page 41
2013 California Building Energy Efficiency Standards September 2011
7.4.6 Gas Furnace Heating Saving Estimate
Based on a first principles estimate and a 50% bypass used as a single pass (first order effect):
Heat exchanger heat transfer Q = UAΔTM
Where:
ΔTM is the logarithmic mean temperature difference
ΔTA is the temperature difference between the gasses at one end of the heat exchanger.
ΔTB is the temperature difference between the gasses at the other end of the heat exchanger.
(Lindeburg 1990)
Based on:
The combustion products and excess air combination temperature of 1500°F
Combustion product exiting temperature of 300°F
Average furnace heat rise from ECO (Proctor, Chitwood & Wilcox 2011) is 54.9°F
House air side entering temperature without bypass 70°F
House air side entering temperature with 50% bypass 97.5°F
House air side exiting temperature without bypass 124.5°F
Maximum house air side exiting temperature with 50% bypass 152.4°F
Logarithmic mean temperature differential without bypass:
= 598
Logarithmic mean temperature differential with bypass:
= 557
The heating savings are approximately 6.8%.
7.4.7 Combined Heating Savings: 50% All Zones, 50% One Zone
Average heating savings based on 50% of time with all zones calling 50% with one zone calling
Using 1.9% from Section 7.3 and 6.8% from Section 7.4.6, the combined heating savings is:
Average (1.9%,6.8%) = 4.4%