RESIDENTIAL PERCEPTIONS OF BROWN AND … PERCEPTIONS OF BROWN AND BLACK BEARS AND HUMAN-BEAR...
119
RESIDENTIAL PERCEPTIONS OF BROWN AND BLACK BEARS AND HUMAN-BEAR CONFLICT MITIGATION ON THE KENAI PENINSULA OF ALASKA By Rebecca S. Zulueta A thesis submitted in partial fulfillment of the requirements for the degree of Master of Science (Conservation Biology & Sustainable Development and Wildlife Ecology) at the UNIVERSITY OF WISCONSIN- MADISON 2012
Transcript of RESIDENTIAL PERCEPTIONS OF BROWN AND … PERCEPTIONS OF BROWN AND BLACK BEARS AND HUMAN-BEAR...

RESIDENTIAL PERCEPTIONS OF BROWN AND BLACK BEARS
AND HUMAN-BEAR CONFLICT MITIGATION ON
THE KENAI PENINSULA OF ALASKA
By
Rebecca S. Zulueta
A thesis submitted in partial fulfillment of the requirements for the degree of
Master of Science
(Conservation Biology & Sustainable Development and Wildlife Ecology)
at the
UNIVERSITY OF WISCONSIN- MADISON
2012

ii
TABLE OF CONTENTS
ACKNOWLEDGEMENTS……....……….…………….………………………...……...iii
LIST OF TABLES………...…………………………………….……………...…………v
LIST OF FIGURES……………………………………………..…………………...…..vii
LIST OF APPENDICES………….…………..……………..…………..…………..........ix
CHAPTER ONE. Residential Community Attitudes, Risk Perception, and
Tolerance toward Brown and Black Bears on the Kenai Peninsula, Alaska
1.1 ABSTRACT……………………………..….………………………........…..10
1.2 INTRODUCTION……..…………………….…………..……...…..….....…11
1.3 HYPOTHESES…………………………………………………………...….21
1.4 METHODS………………...…………..………..………..…………...…..…21
1.4.1 Study Area…….………………………….….………..……….......21
1.4.2 Survey Design and Administration ……………...……..…….....…22
1.4.3 Data Analysis….....……………..……………..…………..…….…25
1.5 RESULTS………………………………………..….……….……..……..…29
1.6 DISCUSSION…………………………………………………...…….….….36
1.7 MANAGEMENT IMPLICATIONS………………………….……….….....44
1.8 LITERATURE CITED………………………………..……………….....….47
CHAPTER TWO. A Review of Human-Bear Conflict Mitigation Strategies on the
Kenai Peninsula, Alaska
2.1 ABSTRACT……………………………..………………………..……….....68
2.2 INTRODUCTION …………………………..……………………………....68
2.3 HUMAN-BEAR CONFLICTS………………………………………....……69
2.4 MANAGEMENT AGENCIES…………………………………….……..….72
2.5 INTERAGENCY CONSERVATION TEAMS AND OBJECTIVES……....75
2.6 CURRENT MANAGEMENT OF BROWN BEAR POPULATIONS….......78
2.7 STRATEGIES AND OUTREACH PROGRAMS ON THE KENAI……….81
2.7.1 Wildlife Conservation Community Program..………………......…87
2.7.2 Wildlife Habitat Incentive Program……………………..…………89
2.8 FUTURE RESEARCH AND RECOMMENDATIONS………….……........91
2.9 LITERATURE CITED………..………………...………………...……........96

iii
ACKNOWLEDGEMENTS
First and most importantly I would like to thank the many residents on the Kenai
Peninsula who took the time to fill out a survey and chat with me. Without your interest
and time this project would not have been possible. Thank you for your many kind
words, encouragement, stories, and the shared meals. To my advisor, David Drake,
thank you for your patience and constant encouragement. You have been a light shining
through the darkness for me during this “interesting” experience called grad school. I
would also like to thank my committee members; John Morton, for being a wonderful,
challenging boss and mentor; Mark Rickenbach, for your help with the survey design;
and Tim Van Deelen, for all of your encouragement. I would also like to thank Adrian
Treves for your help with getting the project off the ground and helpful suggestions with
the survey design. Thank you to Xiaoping Feng and Jen Stenglein for your advice and
patience when it came to talking with me about statistics. It is truly and greatly
appreciated. Thank you to Jim Miller for always greeting me with open arms. You really
help make Nelson a great department. Thank you to the U. S. Fish and Wildlife Service
for helping fund my research and for all of the wonderful support from the staff. Thank
you as well to the U. S. Forest Service in Moose Pass for welcoming me back to that area
and supporting my research. I would also like to thank the Alaska Department of Fish
and Game, in particularly Jeff Selinger, for taking the time to field my many questions.
Thank you to the Nelson Institute and the Advanced Opportunity Fellowship as I would
not have been able to have this experience without your support and belief in my success.
I would also like to thank the Graduate School for stepping in and supporting me as a
student during a challenging time. It speaks volumes for the University. Thank you to all

iv
of my friends and lab mates; I would not have been able to find the drive to continue this
whole process without your encouragement and the happy hour beers shared. Many,
many thanks, to my family for your constant love and support in all of the challenging
endeavors I take on. It all starts with you. Thanks for giving me that strong back bone.
And a very special thank you to John Francis for helping me remember there are people
in this world, even at the University, that really do care and if we all cared a little more
about each other, just imagine what a better world it would be.

v
LIST OF TABLES
Chapter One
Table 1 Selection of low and high defense of life or property communities based
on housing density, human population size, and the number of defense of
life or property bear kills (DLP) on the Kenai Peninsula, Alaska, 2011
....................................................................................................................55
Table 2 Demographic characteristics for survey respondents in select low versus
high defense of life and property (DLP) communities on the Kenai
Peninsula, Alaska, 2011.…………………………………….……….…..56
Table 3 Comparison of sightings and negative experiences with brown and black
bears on private property in select defense of life and property (DLP)
communities on the Kenai Peninsula, Alaska, 2011……………..………57
Table 4 Comparison of attitudes and risk perception toward brown and black bears
in select defense of life and property (DLP) communities on the Kenai
Peninsula, Alaska, 2011.………………...………………………..……...58
Table 5 Model comparisons for determining respondents‟ attitude toward brown
bears on the Kenai Peninsula, Alaska, 2011.……………….........….…...59
Table 6 Evaluation of predictor variables for determining respondents‟ attitude
toward brown bears on the Kenai Peninsula, Alaska, 2011……………...59
Table 7 Model comparisons for determining respondents‟ attitude toward black
bears on the Kenai Peninsula, Alaska, 2011……………………….…….59
Table 8 Evaluation of predictor variables for determining respondents‟ attitude
toward black bears on the Kenai Peninsula, Alaska, 2011……….……...59
Table 9 Model comparisons for determining respondents‟ risk perception toward
brown bears on the Kenai Peninsula, Alaska, 2011……………...…........60
Table 10 Evaluation of predictor variables for determining respondents‟ risk
perception toward brown bears on the Kenai Peninsula, Alaska, 201…...60
Table 11 Model comparisons for determining respondents‟ risk perception toward
black bears on the Kenai Peninsula, Alaska, 2011……………...…….....60
Table 12 Evaluation of predictor variables for determining respondents‟ risk
perception toward black bears on the Kenai Peninsula, Alaska, 2011…..60

vi
Table 13 Comparison of tolerance toward brown and black bears in select defense
of life and property (DLP) communities on the Kenai Peninsula, Alaska,
2011………………………………………………………………………61
Table 14 Demographic characteristics for survey respondents on the Kenai
Peninsula, Alaska, 2011.……………………..…………………………..62

vii
LIST OF FIGURES
Chapter One
Figure 1 Map of agencies responsible for bear management on the Kenai Peninsula,
Alaska, 2012……………………………………………..………………63
Figure 2 Distribution of defense of life or property bear kills (DLP) from 1960-
2008 on the Kenai Peninsula, Alaska…………………………………....64
Figure 3 Defense of life or property bear kills (DLP) and human population size on
the Kenai Peninsula, Alaska, 1960-2010……….……………..………....65
Figure 4 Total brown bear mortalities from 2000-2011 on the Kenai Peninsula of
Alaska due to harvest, non-hunting kills (i.e. road kills, illegal kills), and
defense of life or property kills (DLP)………………………………..….65
Figure 5 Sites selected for surveys on the Kenai Peninsula, Alaska, 2011……..…66
Figure 6 Overall experience of respondents with brown and black bears on the
Kenai Peninsula, Alaska, 2011 (n=426)……..…………...………..…….66
Figure 7 Preventive measures respondents used or had to mitigate conflicts with
brown and black bears on the Kenai Peninsula, Alaska, 2011…………..67
Figure 8 Losses/damages that respondents have incurred from brown and black
bears on their property on the Kenai Peninsula, Alaska, 2011………...... 67
Chapter Two
Figure 1 Percentage and location of defense of life or property bear kills (DLP) on
the Kenai Peninsula of Alaska from 1960-2008………………..………101
Figure 2 Attractants on surveyed properties of the Kenai Peninsula, Alaska,
2011.……...……………………………………………………………..101
Figure 3 Map of agencies responsible for bear management on the Kenai Peninsula,
Alaska, 2012………………………………..………………………..…102
Figure 4 Total brown bear mortalities from 2000-2011 on the Kenai Peninsula due
to harvest, non-hunting kills (ex. road kill, illegal kills), and defense of life
or property kills (DLP)………………………………………..……...…103

viii
Figure 5 Game Management Units (GMU) on the Kenai Peninsula of Alaska,
2012…………………………………………………………………….104

ix
LIST OF APPENDICES
Chapter One
Appendix A The survey instrument (questionnaire)……………..……..…………....105
Appendix B Assessing non-response bias postcard survey…………………...….…..113
Chapter Two
Appendix C Kenai Peninsula Bear Awareness Materials…………………………....114
Appendix D New Bear Awareness Pamphlets……...……………………...…..…….116

10
CHAPTER ONE: Residential Community Attitudes, Risk Perception, and
Tolerance toward Brown and Black Bears on the Kenai Peninsula, Alaska
Abstract
The Kenai Peninsula of Alaska has experienced a drastic increase in the number of
conflicts between humans and bears that result in bear kills in defense of life or property
(DLP). Research is needed to better understand human attitudes, risk perception, and
tolerance toward both brown (Ursus arctos) and black bears (Ursus americanus). My
objectives were to determine if there were differences in attitude, risk perception, and
tolerance toward brown and black bears among respondents from low versus high DLP
communities and whether experience with bears was a strong factor influencing attitude
and risk perception. I therefore conducted a total of 432 door to door surveys of these
issues in six communities on the Kenai Peninsula (2011). I selected survey communities
to represent 3 each from low or high DLP incidences during 2000-2010. Respondents
showed an overall positive attitude toward both brown and black bears in all six
communities. Both communities displayed a neutral response for risk perception toward
bears, yet there was significantly more risk perception in high DLP communities towards
brown bears. Key factors in predicting attitudes toward bears were opinion about the
population size, age and education of the respondent, risk perception, and overall
experience. Risk perception toward bears was best predicted by opinion about the
population size, attitude, and overall experience. There were no significant differences in
tolerance toward either bear species among community types relative to responses of
contacting authorities or use of lethal methods. In addition, low DLP respondents had

11
fewer attractants on their property and more education. My research provides wildlife
managers with information on community attitudes and perceptions of risk posed by
bears, as well as an understanding of tolerance during bear encounters. In addition, a
greater understanding of the frequency of sightings and conflicts with bears, including the
type of conflicts, will aid managers in determining the best form of conflict resolution.
INTRODUCTION
The Kenai Peninsula (Kenai) is connected to the mainland of south central Alaska
by a narrow (18 km) isthmus. Research with microsatellite and mitochondrial DNA has
verified that Kenai brown bears (Ursus arctos) are genetically less diverse than mainland
Alaskan brown bears (Talbot & Farley, 2009). In addition, this population of brown
bears does not breed with the brown bear population on the mainland (Talbot & Farley,
2009). The genetic isolation and small size of the Kenai brown bear population, along
with rapid urban development leading to human encroachment on bear habitat, creates
concern about maintaining a healthy population of brown bears. The Alaska Department
of Fish and Game (ADF&G) listed the Kenai brown bear as a “Species of Special
Concern” (Del Frate, 1999),1 and the United States Forest Service considers presence of
Kenai brown bears an indicator of the health of the ecosystem (DeBruyn, Harris, Morton,
& Selinger, 2006). There was an estimated 625 brown bears peninsula wide on the Kenai
during summer 2010 (Morton, Bray, Hayward, White, & Paetkau, 2012, unpublished
data). Considering available habitat, Morton et al. (2012) estimated 45 brown bears per
1 At the start of 2012, the ADF&G no longer uses the “Species of Special Concern” list. The
species/populations of special concern have been relegated to an appendix in the State Wildlife Action
Plan. As of September 2012 no changes had been made to programs regarding brown bear research on the
Kenai (Selinger, Personal Communication, 2012).

12
1,000 km2, while Miller et al., (1997) reported studies on southern coastal habitats to
contain 191–551 brown bears per 1,000 km2 and studies in interior Alaska ranged from
10–30 brown bears per 1,000 km2 in available habitat. The Kenai is considered a coastal
habitat and brown bear management is therefore a high priority and concern for wildlife
managers on the Kenai. There is a fall and spring harvest of brown bears allowing
residents and non-residents to register for a permit every four years. Total annual harvest
does not exceed 14-18 bears.
Black bears (Ursus americanus) are common in the western United States
(Witmer & Whittaker, 2001) and occur over most of the forested areas of Alaska (Alaska
Department of Fish and Game, 2011). On the Kenai, black bear populations appear
stable, with greater densities along the southern coast, possibly due to the low density of
brown bear competitors during the salmon run (Alaska Department of Fish and Game,
2011). ADF&G estimates the Kenai contains 3,000–4,000 black bears with an annual,
average harvest of 410, allowing three bears per year for residents. In communities where
both bear species occur, attitudes towards bears vary and people may view black bears as
less of a threat than brown bears, possibly due to their smaller size (Petko-Seus, 1985;
Hastings, 1986). People generally are more familiar with black bears than with other
large mammals (Kellert, 1994), and attitudes toward black bears are generally positive
(Kellert, 1994; Morzillo, Mertig, Garner, & Liu, 2007), even in instances of human-black
bear conflict (Jonker, Parkhurst, Field, & Fuller, 1998), which perhaps reflects higher
tolerance for black bears.
Human coexistence with brown and black bears rests upon a fine balance of many
biological and social factors. As human development continues in areas near bear

13
habitat, wildlife managers must consider the type of habitat necessary to maintain a
sustainable population of bears while also addressing concerns from residents who live in
these areas. Conflicts often occur when either bears move into areas of high human use
or when human development encroaches on bear habitat (Stowell & Willging, 1992;
Peine, 2001). Human encroachment often leads to habitat fragmentation which
diminishes the value of bear habitat (Proctor, McLellan, Strobeck, & Barclay, 2005:
Waller & Servheen 2005; Nawaz, 2007) and isolates bear populations, decreasing their
ability to survive (Proctor, Servheen, Miller, Kasworm, & Wakkinen, 2004). In addition,
areas of high human use often become population sinks for bears (Nielsen et al., 2004;
Nielsen, Stenhouse, & Boyce, 2006), and even small numbers of bears killed can have
adverse effects on population growth (Wakkinen & Kasworm, 2004). Currently, brown
bear populations in Alaska remain intact; however, they may follow the same trend as
bear populations in the continental United States because humans are the most significant
source of mortality on adult brown bears (Servheen, Herrero, & Peyton, 2004). An
understanding of human behavior and attitudes regarding bears has important
implications for the conservation of bears and supporting habitat (Peyton, Bull, Reis, &
Visser, 2000; Siemer & Decker, 2003; Siemer & Otto, 2005).
Wilder, DeBruyn, Smith, and Southwould (2007) defined a human-bear conflict
as an incident that involves an interaction between a bear(s) and person(s) in which the
bear acts aggressively, including all instances where bears obtained food, damaged
property, or were judged to be negatively affected by human activities. This includes
instances where bears obtained food, damaged property, or were judged to be negatively
affected by human activity. When a conflict escalates beyond the tolerance of a human,

14
also defined as the point at which one would act or demand action from an authority to
deal with a situation (Peyton et al., 2000), the bear may be killed. The state of Alaska
allows the killing of a brown or black bear in defense of life or property (DLP) if a bear
attack was not provoked or caused by negligence with food or garbage (Alaska
Administrative Code 5 AAC 92.410). Trend in DLP cases have been documented by the
ADF&G on the Kenai since 1960 (Figure 1) and only reflect trend in brown bear
numbers as black bear numbers are not documented in this manner.
Not only is the Kenai one of the most visited areas of Alaska, it is also the second-
fastest developing area of Alaska (2010 US Census data). Over the past ten years, the
human population has grown significantly, with about 10,000 new residents each decade
since 1960 (US Census data 1960-2010). In turn, number of conflicts between humans
and bears that result in DLPs has also increased (Figure 2). Similar trends occur in other
areas of North America with the rise of human-bear conflicts and human population.
During the 1980s and 1990s number of conflicts with bears and humans increased, yet
this increase was disproportional to human growth (Beckmann and Berger, 2003),
especially in areas adjacent to public lands containing large carnivores.
Suring and del Frate (2002) reported that DLP cases on the Kenai had increased
from < one bear death each year in the 1960s to an average of 5 per year in the 1990s.
From 2000-2009, 164 documented DLP cases occurred on the Kenai; averaging over 16
bear deaths each year. Since DLP numbers typically reflect brown bear kills, this
increase in DLP cases emphasizes concerns that the brown bear population may not
persist with these high rates of mortality (Schwartz & Arthur, 1997; Suring & del Frate,
2002). The ADF&G bases management on an assumption of human-caused brown bear

15
mortalities at 6% of an estimated population of 250 bears (Miller, 1989). If accurate,
during 2000-2011, the annual number of DLPs has surpassed that threshold seven out of
twelve years, and only in 2000 did the total human caused mortalities fall below the
threshold (Figure 3). Due to the growing human population, the potential exists for
conflicts between humans and bears to also continue increasing over time. For
sustainable bear conservation, wildlife managers must understand and address people‟s
attitudes and behavior regarding human-bear conflict (Wang, Lassoie, & Curtis, 2006;
Palmeira, Crawshaw, Haddad, Ferraz, & Verdade, 2008; Ogra, 2009). Currently, bear
managers on the Kenai have only nominal data on why people kill bears in DLP
situations, and therefore lack adequate tools to reduce human-bear conflicts, and
ultimately, bear fatalities.
Peninsula-wide documentation of human-bear interactions is lacking currently.
There are four agencies that manage bears on the Kenai; ADF&G along with three
federal agencies including the Kenai National Wildlife Refuge (KENWR), Kenai Fjords
National Park (KEFJ), and the Chugach National Forest (CNF, Figure 4). Typically,
each agency collects and manages data on human-bear interactions within their own
jurisdiction, but little interagency cooperation and data coordination exists. During the
1980s, these agencies formed the Interagency Brown Bear Study Team which served as a
way for each agency to have input on the research conducted and management of brown
bears peninsula-wide, however, human-bear interaction data was not a priority of the
interagency team. The only comprehensive information besides DLP data that the Kenai
has regarding human-bear interactions is with the Bear Human Interaction Management
System (BHIMS). This database allows bear management teams throughout all National

16
Parks in Alaska to enter data on human-bear interactions (Wilder et al., 2007). This
system has yet to be shared with other federal agencies.
There has also been little research conducted regarding the public‟s perception of
bears on the Kenai. Community involvement is often essential for wildlife management
to be successful. For example, managers in the Wrangell-St. Elias National Park and
Preserve attempted to decrease human-bear conflicts within the by focusing on educating
visitors. However, data later revealed that 80% of incidents involved residents who lived
outside the park boundaries (Wilder, 2003). After redirecting management and including
educational programs on bears for the community, human-bear conflicts decreased. The
Wrangell-St. Elias National Park and Preserve example underscores the importance of
effective wildlife management policy as a result of understanding public attitudes toward
wildlife and conservation programs (Naughton-Treves, Grossberg, & Treves, 2003;
Tarrant, Bright, & Cordell, 1997). Without this understanding of community attitudes,
which shape behavior towards bears, the human-bear conflicts on the Kenai will
continue.
Local resource users should also participate in wildlife management decisions.
For example, government resource managers and locals can have very different
perceptions on issues (Kendrick, 2003). Understanding stakeholders‟ opinions and
considering them in management actions can lead to more effective wildlife management
strategies. Wilson and Clark (2007) stated that the ultimate threat to carnivore
conservation, including bears is not habitat loss, but rather human populations and their
behaviors and attitudes toward carnivores. Subsequently, Carroll, Noss, and Paquet
(2001) stated that when strategizing the conservation of carnivores, biological science
17
should be central to the discussion, yet efforts are likely to fail if other disciplines such as
the social sciences and education are not involved to aid in finding politically acceptable
solutions. Studies that do not include other disciplines often perform poorly, and even
failed (Carroll et al., 2001). Research must therefore be directed at an understanding of
human attitudes, risk perception, and tolerance toward both brown and black bears on the
Kenai.
Attitude
Understanding attitudes toward bears can lead to a better understanding of human
behavior toward bears and circumstances leading to a DLP. While there are many
definitions of attitude, a common theme among definitions is that a person‟s attitude
represents his or her evaluation of the subject in question (Ajzen & Fishbein, 1977).
Ajzen and Fishbein (1977) argued that a person‟s attitude toward an object influences the
overall pattern of their response to the object, but it doesn‟t necessarily predict a given
action; therefore, attitudes do not necessarily cause a certain behavior (Ajzen, 2001;
Bohner & Wanke, 2002). Ajzen‟s (1991) theory of planned behavior states that
intentions to perform behaviors of different kinds can be predicted with high accuracy
from attitudes toward the behavior, subjective norms, and perceived behavioral control.
It is the theory of reasoned action (TRA) that follows the assumption that humans will
process information and use it to decide how to act (Ajzen & Fishbein, 1980; Fishbein &
Manfredo, 1992). It is therefore the combination of attitude toward a behavior and the
subjective norms - an individual's perceptions of the social pressures placed on them by
others to either perform or not perform a certain behavior - are what determines the

18
performance of a behavior (Fishbein & Manfredo, 1992). By understanding the attitudes
of residents on the Kenai, we can get a better sense of the outcomes of their interaction
with bears.
Bright and Manfredo (1995) found that people who hold strong positive attitudes
toward bears are more likely to support actions favorable to bears, tolerate bear damage,
and maintain those ideals during conflict. The population status of bears has also been
shown to affect people‟s attitudes, with more positive attitudes found when bears are
considered rare in the area (Cardoza, 1976; Brown, Decker, & Hustin, 1981) and more
negative when overpopulation deems hunting necessary for damage control (Colorado
Division of Wildlife, 1989). Negative attitudes toward bears can be found by people
who feel their livelihood may be threatened due to dependence on common resources
with bears (Kellert, 1994). Don, Carols, Bright, Teel, & Vaske (2009) also found that
people with negative attitudes toward certain wildlife species may be more likely to kill
or support the killing of wildlife in response to damage.
Risk Perception
Risk perceptions are intuitive judgments made by people themselves rather than
those made by experts who base their judgments on technical assessments (Slovic, 1987).
Slovic (1987) further defined risk perception as the degree to which people believe they
are or could be exposed to some danger. Studies have found that risk perception toward
bears can influence beliefs, attitudes, and behavior toward bears (Knuth, Stout, Siemer,
Decker, & Stedman,1992), as well as influence a community‟s attitude toward
management policy (Decker, Lauber, & Siemer, 2002). Concern about bears led to about

19
33% of Alaskan voters reporting that they occasionally avoid trips into the countryside
(Miller, Miller, & McCollum, 1998). Also, people‟s perception of wildlife risks tended
to focus on events where the damage is rare and extreme, rather than damage that may
amount to small losses at first, but become cumulatively greater in the end (Naughton-
Treves, 1997). This may be related to a concern about common resources tied to
economic and social stability whereby brown bear protection conflicts with economic
well-being (Power, 1991). Siemer, Hart, Decker, and Shanahan (2009) revealed that
more positive experiences with black bears in local residential areas led to decreased risk
perception among residents. Understanding the factors influencing risk perception could
supply wildlife managers with the tools to better manage concerns about human-bear
conflicts.
Tolerance
Tolerance toward bears is based upon the idea that a person will reach a point at
which they will no longer accept an interaction with a bear (Peyton et al., 2000). Once a
person reaches this point, they would either act themselves or request action from an
authority to eliminate the situation, sometimes resulting in the death of the bear.
Understanding tolerance of bears will give a better idea of what must occur before
someone decides to kill a bear. Research has shown that hunting of predators is thought
to increase tolerance among affected communities as it is believed to promote
conservation of those species within communities (Loveridge, Reynolds, & Milner-
Gulland, 2007; Treves, 2009). Decker et al. (2002) found that people who perceive
benefits from a wildlife species tend to have a higher tolerance for conflicts with that

20
species. In addition, moderate damage will be tolerated if people have positive attitudes
toward bears (Agee &Miller, 2009; Jonker et al., 1998; Kellert, 1994; White, Shropshire,
& Staten, 1997). In regard to gender, Miller and McCollum (1994) found that women
with more concern about bears and no history of hunting were more tolerant of bears in
urban settings. Iossa, Soulsbury, Baker, and Harris (2010) speculated that areas with a
lack of tolerance could be linked to the large size of bears, making them appear to be a
greater threat to humans. A greater understanding of tolerance toward bears on the Kenai
will aid wildlife managers in identifying where to put their energy and resources into
education and wildlife conflict management.
Experience
Peoples‟ experiences with bears shape attitudes, risk perception, and tolerance
toward bears. Beliefs and previous experiences with animals contribute to the
development of attitudes, which influence tolerance of wildlife (Spash, 1997;
Zimmermann, Walpole, & Leader-Williams, 2005). Often, one or more events can
strongly affect people‟s attitudes and influence their reaction to future encounters
(Conover, 2001; Woodroffe, Thirgood, & Rabinowitz, 2005). In addition, people tend to
hold positive attitudes toward nuisance wildlife until they have experienced some type of
damage (Clark, Clapp, Smith, & Wigley, 1991; West & Parkhurst, 2002). More
familiarity with wildlife species often decreases the uncertainty of the consequences of
interactions. Therefore, when a person becomes more familiar with bears in the form of
sightings and non-negative interactions, a negative correlation may exist with perceived
risk from bears.

21
To minimize effectively human-bear conflicts, it‟s important to understand
people‟s experiences with bears and how their attitudes, risk perceptions, and tolerance
levels can influence their behaviors toward bears. Therefore, the objective of my
research was to measure these attributes to identify key factors that predict human
behavior during bear conflicts. By looking at communities with a low number of DLPs
compared to those with a high number of DLPs I can test whether there are significant
differences among these attributes for respondents in different community types. While
DLP numbers only reflect brown bear numbers it‟s also important to address questions
based on both bear species to determine whether respondent attributes differ depending
on species. I tested the following hypotheses:
1) Communities with a low number of bears killed in defense of life or property will
have more positive attitudes and less risk perception toward brown and black
bears than people in communities with a high number of bear kills.
2) Positive experiences with bears will be a strong factor influencing positive
attitude and less risk perception toward bears.
3) Communities with a low number of bears killed in defense of life or property will
be more tolerant of both brown and black bears than people in communities with a
high number of bear kills.
METHODS
Study Area
The Kenai Peninsula lies in south central Alaska between the Cook Inlet and
Prince William Sound. The 23,000 km² of land is composed of a heavily glaciated

22
mountain range that divides the eastern mountains and western lowlands. The western
side of the Kenai supports northern boreal forests composed of black spruce (Picea
mariana), white spruce (Picea glauca), black cottonwood (Populus balsamifera
trichocarpa), quaking aspen (Populus tremuloides), and paper birch (Betula papyrifera).
The eastern side of the Kenai is considered a temperate coastal rainforest mainly
composed of sitka spruce (Picea sitchensis), western hemlock (Tsuga heterophylla),
mountain hemlock (Tsuga mertensiana), and white spruce. The Kenai also includes shrub
and peat communities, numerous lakes, salmon (Oncorhynchus spp.) fed streams, and
tundra. Unlike most of Alaska, the Kenai has a well-developed road system which has
facilitated rapid development and high tourist traffic on the peninsula. Most (roughly
75%) of the Kenai is federally owned public land managed by KEFJ, KENWR and CNF.
The remaining quarter is private native, borough, and state land composed of
communities along the highways. According to the 2010 United States census,
approximately 55,000 residents lived in 29 communities on the mainland of the Kenai.
The population averaged 52% men, the average age was between 55-59 years for all
people 18 or older, most adults have a high school diploma or the equivalent, and the
most common occupation is management/professional.
Survey Design and Administration
From May 25- July 5, 2011 I handed out a total of 432 questionnaires to residents
in six communities on the Kenai to determine attitudes, risk perception, and tolerance
toward brown and black bears. The survey included: (1) a 4 page questionnaire and (2) a
cover letter describing the purpose of the study, whom to contact if questions arose, and a

23
guarantee of confidentiality. The questionnaire (Appendix A) contained questions
regarding individual attitudes and risk perception toward brown and black bears which
were measured on a 5-point Likert scale. Open ended questions regarding experience with
bears were included as well as closed ended questions regarding tolerance toward bears.
Some questions were adapted from Kaczensky, Blazic, and Gossow (2004); as well as
Siemer et al. (2009). The survey was approved by the Institutional Review Board (IRB)
for Human Subjects at the University of Wisconsin-Madison in the spring of 2011
(Protocol: SE-2011-0196).
I selected the six communities for the survey based on the number of brown bears
killed in defense of life or property (DLP) from 2000-2010 within those community
boundaries based on absolute DLP numbers rather than per capita rates. I chose three
communities with low DLPs (0-3) and three with high DLPs (11-21). Furthermore, it is
important to note that DLP numbers for low DLP communities could be due to low
brown bear numbers in those communities rather than intrinsically benign behaviors of
those residents.
Low DLP communities included Cohoe, Moose Pass, and Seward. Cohoe is a
rural community on the western side of the Kenai, an area near the Cook Inlet shoreline
with little variation in terrain. Moose Pass is a very small community along the Seward
Highway in the eastern mountains near Kenai Lake. Seward is the most urban
community sampled, located on the Resurrection Bay, surrounded by mountains. Moose
Pass and Seward have bear awareness programs more specifically for garbage
management and Seward has a cost share program for bear-resistant garbage containers
which most residents appeared to have used.

24
High DLP communities included Sterling, Cooper Landing, and Bear Creek.
Sterling is a rural community on the western side of the Kenai, in the flatlands and has
more agriculture than any other community of those sampled. Cooper Landing is in the
mountains of the Kenai and has a strong program for promoting garbage management and
brown bear education due to its close proximity to the Kenai and Russian River
confluence, an area of high salmon and angler activity. Bear Creek is a suburb of Seward
tucked into the mountains. Each of the six communities shared similarities when grouped
as high or low DLP communities, including human population, housing density, and road
accessibility (Table 1; Figure 5). I weighted the number of surveys per community based
on population size in order to provide a representative sample of surveys from all
communities despite variation in population size.
I located homes in each community by use of a street map which outlined the
community boundary and proceeded to randomly deliver questionnaires by hand
following Kaczensky et al. (2004). If nobody was at home during the time of delivery or
if they refused to fill out the questionnaire, I proceeded to the next neighboring house. I
only asked adults 18 years or older to fill out the questionnaire and if their age was
uncertain I mentioned they must be 18 years or older to participate. I then informed them
that I would return in two hours to collect the completed questionnaire which they could
leave outside for me if they would no longer be home. If this time frame did not work for
them I offered to come at a more convenient time. I also varied the time and days that I
surveyed to minimize bias in age, gender, and employment status of respondents.

25
To address non-response bias, I placed a self-addressed, stamped postcard with
five diagnostic questions from the original questionnaire at each residence I attempted to
contact without success (Appendix B).
Before leaving each residence I used a checklist of categories to characterize the
property in regards to the habitat and attractants for bears. I classified properties as (1)
either urban, suburban, or rural, (2) on a high or low traffic road, (3) mostly forested,
mostly open, or forested/open (half forested, half open), (4) riparian (≤ 800m of a water
body) or non-riparian (> 800m of a water body). Protective measures (ex. type of fencing
such as electric fence) to reduce/eliminate bear conflicts were noted. Attractants on the
property were also listed including garbage not in bear resistant canisters, pet food,
pets/animals on property, beehives, and other. Gardens and natural vegetation was not
included as it was more difficult to define from a distance relative to other attractants.
Data Analysis
Data analysis included descriptive statistics summarizing responses to all
questions with Microsoft Excel. I completed all other analysis using R (version 2.14.2, R
Foundation for Statistical Computing, Vienna, Austria).
Non-response bias
I determined whether there was a non-response bias by testing if the distribution
of responses differed between respondents and non-respondents for the five diagnostic
questions. For the question, “Please rate your overall experience with brown/black
bears,” responses were measured on an ordinal scale and analysis completed with the

26
Wilcoxon-Rank Sum Test with continuity correction. For the question, “Has a
brown/black bear been killed in a non-hunting related incident on your property,”
categorical responses were analyzed with a two-tailed Fisher‟s Exact Test for count data.
For analysis of categorical responses to the question regarding hunting in the past two
years, I used Pearson‟s X2
Test with Yates' continuity correction. Differences among
responses to attitude and risk perception questions were measured with Pearson‟s X2
Test,
and Bonferroni‟s correction was applied when multiple comparisons were needed.
Significant differences were determined at the p<0.05 level and moderately significant at
the 0.05<p<0.1 level.
Variables influencing attitude and risk perception toward bears
I measured general attitude and risk perception toward bears based on responses
to three statements for attitude and three for risk perception. Each statement used a 5-
point Likert scale in which respondents were asked whether they strongly agreed, agreed,
were neutral, disagreed, or strongly disagreed to each statement. All attitude and risk
perception questions were constructed in a similar manner to facilitate comparison of
responses. Answers were coded so that positive feelings were expressed by high values
and negative feelings by low values. In order to determine whether all responses for the
three attitude and three risk perception questions were highly correlated and showed high
reliability to support grouping of related questions, I performed a test to determine
Cronbach‟s alpha coefficient which measures internal consistency among responses to
each question (Zeller & Carmines, 1980; Gliem & Gliem, 2003). Levels of acceptability
range from α =0.7 acceptable, α =0.8 good, and α =0.9 excellent. Responses for the three

27
attitude questions were highly correlated and showed high reliability according to
Cronbach‟s alpha coefficient (brown bear: α =0.85, black bear: α =0.83), supporting the
grouping of related questions. In addition, risk perception responses for the three
different questions were highly correlated resulting in an index for risk perception (brown
bear: α =0.89, black bear: α =0.88). A mean index was then calculated for attitude and
risk perception for both bear species for each respondent by adding the three responses
together and dividing by three.
Four response variables were examined for analysis using multiple linear
regression: (a) attitude toward brown bears, (b) attitude toward black bears, (c) risk
perception toward brown bears, and (d) risk perception toward black bears. Although
attitude and risk perception responses were measured on an ordinal scale, they were
considered to be continuous variables for the regression analysis (Borgatta & Bohrnstedt,
1980; Vaske, 2008).
Due to the large number of possible predictor variables, two alpha levels were
used (α= 0.1 and α= 0.05) to sort through the noise of the model when first performing
simple linear regressions to aid in selection of variables for full models. To check for
multicollinearity among predictor variables I looked at the variance inflation factor (VIF)
for each variable. No variables exceeded the VIF cut-off criteria of 4.0.
Complete full models included the following predictor variables for analysis of
attitude and risk perception: (a) AGE (continuous variable); (b) GENDER (male=1,
female=2); (c) EDUCATION (grade school or high school=1, some college or college
degree=2); (d) HUNTER (Yes or No, where „Yes‟ is defined as a respondent who
reported having “hunted in the past two years” or “regularly hunted at any other time in

28
[their] life”); (e) HIGHLOW (respondent in either high=1 or low=0 DLP community); (f)
ATTRACTANTS (Yes or No, where „Yes‟ is defined as respondent that either had pets
visible at the time of survey drop off or collection and/or food/garbage not secured in
bear resistant canisters); (g) SIGHTINGS (continuous variable; total number of sightings
of both brown and black bears in community during 2010); (h) NEGATIVE
EXPERIENCES (continuous variable; total number of negative experiences with both
brown and black bears in community during 2010); (i) OVERALL EXPERIENCES
(continuous variable; positive=1, somewhat positive=2, neutral=3, somewhat negative=4,
and negative=5); (j) CONFLICT (Yes or No, where „Yes‟ is defined as a respondent who
reported having experienced some type of loss/damage from bears on their property at
some point); and (k) OPINION (continuous variable; too high=1, high=2, about right=3,
low=4, too low=5, don‟t know=6). In addition, analysis of attitude included risk index
while analysis of risk perception included attitude index as explained previously.
I created four multiple linear regression models to determine variables
contributing to attitude and risk perception toward brown and black bears. Using the
stepwise method forward and backwards, I removed the weakest predictor variables one
by one. For model selection, I used Akaike‟s Information Criterion (AIC), delta AIC,
and AIC weights. I determined significance of predictor variables in each of the best
fitting models at p<0.05.
Tolerance toward bears
To measure tolerance for interactions with a brown or black bear near one‟s home
I set up a 7-question bear sensitivity index (BSI) (Peyton et al., 2000; Siemer et al.,

29
2009). Tolerance is defined in a BSI as the point at which someone notifies authorities to
take management action with the bear. I used the accepted definition of BSI plus
included the use of lethal methods by respondent due to the fact that authorities would
legally have to become involved in the event of a DLP. Each of the seven questions
described a scenario of a human-bear interaction (e.g., “You see a brown bear near your
home once”) from which respondents were asked to choose their preferred response by
selecting one of the following: 1) do nothing, 2) use non-lethal methods (ex. pepper
spray, hazing), 3) contact authorities, or 4) use of lethal methods. I applied Pearson‟s X2
Test to examine differences among high and low DLP communities for both nuisance brown
and black bears and preferences for responses to each scenario. Bonferroni‟s correction was
applied when multiple comparisons were necessary. To look at overall tolerance including
all scenarios, for each respondent I summed the number of responses someone chose to
notify the authorities or use lethal methods (value of 0-7). This value was then compared
among low versus high DLP respondents with Pearson‟s X2
Test. Significance was
determined if p<0.05.
RESULTS
Survey Response Rate
I visited 620 residences in six selected communities on the Kenai. One hundred
fifty-five residents were not home when I visited. Out of the 465 that were home, 26
refused to fill out a survey. Of the 439 homes that accepted a survey (acceptance rate of
94%), 432 residents completed a survey for a total response rate of 70%. According to
Cochran‟s (Snedecor & Cochran, 1989) my sample size of 432 completed surveys from a

30
population of 12,138 people for the six communities gave me a 4.6% margin of error with
use of a 95% confidence interval.
Of the 155 postcards left at resident‟s doors, a total of 54 postcards were mailed
back and analyzed for a response rate of 35%. There were no statistical differences found
in responses from those that completed a questionnaire to those that filled out a postcard
for all five of the questions.
Comparing Low versus High DLP Respondents
Respondents in high DLP communities reported killing significantly more brown
bears than respondents in low DLP communities (Fisher‟s Exact Test, p=0.01; Table 2).
Low DLP communities saw significantly more black bears than brown bears (Pearson's χ2
with Bonferroni‟s correction=226.54, df=1, p<0.001) and significantly fewer brown bears
than high DLP communities (Pearson's χ2 with Bonferroni‟s correction=315.60, df=1,
p<0.001). Low DLP communities had significantly more negative black bear
experiences than brown bear experiences (Pearson's χ2 with Bonferroni‟s
correction=13.25, df=1, p=0.001) and had fewer negative brown bear experiences than
high DLP communities (Pearson's χ2 with Bonferroni‟s correction=87.68, df=1,
p<0.001). High DLP communities also experienced significantly more negative
interactions with brown bears than black bears (Pearson's χ2with Bonferroni‟s
correction=25.69, df=1, p< 0.001; Table 3).
There was a moderately significant difference between low and high DLP
communities relative to brown bears in response to the attitude question; “There is no
need to have bears on the Kenai.” Low DLP communities in general disagreed with this

31
statement more than high DLP communities; however, overall, at least 89% of
respondents in both community types disagreed with the statement (Pearson's χ2
Bonferroni‟s correction=9.24, df=1, p=0.06), revealing an overall positive attitude. In
regards to risk perception, respondents in high DLP communities answered “I worry
about problems bears may cause” and “I fear being injured by bears on the Kenai” with
significantly more perceived risk toward brown than black bears (Pearson's χ2 with
Bonferroni‟s correction=9.99, df=2, p=0.04, Pearson's χ2 with Bonferroni‟s
correction=13.69, df=2, p=0.01; Table 4).
Variables influencing attitude toward brown and black bears
The best fit model for predicting attitude toward brown bears included the
predictor variables GENDER, OPINION, AGE, EDUCATION, RISK PERCEPTION,
and OVERALL EXPERIENCE (adjusted R2
=0.46, n=383; Table 5).
The coefficient estimate (Table 6) for GENDER was negative and not significant
(p=0.13), yet important to the model thus female respondents tend to have a more
positive attitude toward brown bears than male respondents. The coefficient estimate for
OPINION was positive and significant (p=0.03) thus respondents who were less likely to
think the brown bear populations were too high were more likely to have an increasingly
positive attitude toward brown bears. The coefficient estimate for AGE was negative and
significant (p=0.01), revealing that younger respondents were more likely to have a more
positive attitude toward brown bears. The coefficient estimate for EDUCATION was
positive and moderately significant (p=0.06), suggesting respondents with at least some
college were more likely to have a more positive attitude toward brown bears than those

32
with a high school education or less. The coefficient estimate for RISK PERCEPTION
was positive and significant (p<0.001), indicating that those respondents who perceive
less risk were more likely to have a more positive attitude toward brown bears. In
regards to OVERALL EXPERIENCE, the coefficient estimate was negative and
significant (p<0.001), indicating that those with more positive experiences were more
likely to have a more positive attitude toward brown bears.
The best fitting model explaining attitude toward black bears included the
variables OPINON, AGE, EDUCATION, RISK PERCEPTION, and OVERALL
EXPERIENCE (adjusted R2
=0.41, n=386; Table 7).
The coefficient estimate for OPINION (Table 8) was positive and moderately
significant (p=0.07) thus respondents who were less likely to think the black bear
populations were too high were more likely to have a more positive attitude toward black
bears. The coefficient estimate for AGE was negative and significant (p=0.01), revealing
younger respondents were more likely to have a more positive attitude toward black
bears. The coefficient estimate for EDUCATION was positive and not significant
(p=0.68), yet included in the model, thus respondents with at least some college were
more likely to have a more positive attitude toward black bears than those with a high
school education or less. The coefficient estimate for RISK PERCEPTION was positive
and significant (p<0.001) thus those with less perceived risk were more likely to have a
more positive attitude toward black bears. In regards to OVERALL EXPERIENCE, the
coefficient estimate was negative and significant (p<0.001), thus those with more positive
experiences were more likely to have a more positive attitude toward black bears.

33
Variables influencing risk perception towards brown and black bears
The best fitting model to describe risk perception toward brown bears contained
the predictor variables OPINION, ATTRACTANT, ATTITUDE, and OVERALL
EXPERIENCE (adjusted R2
=0.39, n=400; Table 9).
The coefficient estimate for OPINION was positive and significant (p<0.001;
Table 10), indicating that respondents who were less likely to think the brown bear
populations were too high perceived less risk toward brown bears. The coefficient
estimate for ATTRACTANT was negative and significant (p=0.04), thus respondents
with no attractants on their property were more likely to perceive less risk toward brown
bears than respondents with attractants on their property. The coefficient estimate for
ATTITUDE was positive and significant (p<0.001), indicating those with more positive
attitudes toward brown bears were more likely to perceive less risk from brown bears. In
regards to OVERALL EXPERIENCE, the coefficient estimate was negative and
significant (p<0.001), thus those with more positive experiences were more likely to
perceive less risk toward brown bears.
Risk perception toward black bears was best predicted by the model containing
the predictor variables OPINION, GENDER, AGE, ATTITUDE, and OVERALL
EXPERIENCE (adjusted R2
=0.39, n=386; Table 11).
The coefficient estimate for OPINION was positive and significant (p<0.001;
Table 12), thus respondents who were less likely to think the black bear populations were
too high perceived less risk from black bears. The coefficient estimate for GENDER was
positive and significant (p<0.001) indicating that male respondents were more likely to
perceive less risk from black bears than females. The coefficient estimate for AGE was

34
positive and significant (p<0.001), thus older respondents were more likely to perceive
less risk from black bears. The coefficient estimate for ATTITUDE was positive and
significant (p<0.001), thus those with a more positive attitude were more likely to
perceive less risk from black bears. In regards to OVERALL EXPERIENCE, the
coefficient estimate was negative and significant (p<0.001), indicating that those with
more positive experiences were more likely to perceive less risk from black bears.
Tolerance toward brown and black bears
Tolerance toward both brown and black bears was not significantly different
between low versus high DLP communities except for two out of the seven scenarios I
presented in my questionnaire (Table 13). In regards to black bears for the scenario “You
see a bear near your home more than once a week,” low DLP communities were more
likely to do nothing (44%) than high DLP respondents (30%; p=0.05). Significant
differences were also found for the scenario, “You see or hear a bear attempting to enter
some part of your home”. Low and high DLP respondents treated each bear species
differently in this situation. While the majority of respondents from both types of
communities chose to use lethal methods, a greater percentage of high DLP respondents
(brown bears: 73%, black bears: 71%) chose lethal methods compared to low DLP
respondents (brown bears: 54%, black bears: 53%; brown bears: p<0.001; black bears:
p=0.001). When examining responses to the tolerance scenarios in which authorities
became involved, such as “use of lethal methods” or “contact authorities”, no significant
differences existed relative to low versus high DLP communities or bear species.

35
Respondent Characteristics
Significantly more respondents in low DLP communities (41%) reported having a
college degree than high DLP respondents (28%) (Pearson's χ2=12.39, df=3, p=0.01).
The average age of respondents was 52 and 55% were male. Ninety-eight percent of
respondents had at least a high school degree, and 68% had attended at least some
college. The average length of residency on the Kenai was 17 years. Although most
respondents (59%) indicated regular hunting participation, most (64%) had not hunted
within the last 2 years nor had hunted brown (81%) or black bears (64%; Table 14).
Over 80% of respondents experienced positive to neutral experiences with both
bear species (Figure 6). The majority (91%) of respondents used some type of routine
preventive measure to protect themselves, family, pets, and/or property from bears. The
most common management options reported by respondents included using or having
firearms (63%; did not specify whether this included lethal or non-lethal rounds), dog/s
(41%), and other (36%; Figure 7). “Other” included such things as air horns and warning
neighbors of sightings. In regard to conflicts, there was no significant difference among
respondent type or bear species. The majority of respondents had not experienced a loss
or damage from brown (71%) or black bears (69%). Those that did experience a conflict
categorized the loss/damage as mostly structural damage (i.e., buildings, vehicles, etc.;
14% due to brown bears, 10% due to black bears), a threat to themselves or family
members (12% due to brown bears, 9% due to black bears), and other loss or damage
(12% due to brown bears, 10% due to black bears; Figure 8). There was no significant
difference among respondent type or bear species for these three categories of conflict.

36
DISCUSSION
While I had hypothesized only low DLP respondents would have a positive
attitude toward brown and black bears, respondents from both low and high DLP
communities appeared to have an overall positive attitude toward both brown and black
bears. Both communities displayed a neutral response for risk perception toward both
bear species, yet there was significantly more risk perception in high DLP communities
towards brown bears. These findings were similar to my hypothesis that low DLP
respondents would have less risk perception toward both bear species, however, I did not
hypothesize that risk perception by high DLP respondents would be specific to brown
bears. My hypothesis that overall experience with bears would be a strong predictor of
attitude and risk perception was verified in my models. Other key factors in predicting
attitude toward bears included opinion about the population size, age and education of the
respondent, and risk perception. In addition, risk perception toward bears was best
predicted by opinion about the population size and attitude. Attractants were also a key
factor in predicting risk perception toward brown bears. While I had hypothesized that
low DLP respondents would be more tolerant of brown and black bears, there were no
significant differences in tolerance toward either bear species among low and high DLP
respondents in regards to responses of contacting authorities or use of lethal methods. In
addition, low DLP respondents had fewer attractants on their property and more
education.

37
Comparing Low versus High DLP Respondents
Low DLP respondents saw significantly more black bears and significantly fewer
brown bears than high DLP respondents. Low DLP respondents also reported
significantly more negative black bear experiences and significantly fewer negative
brown bear experiences than high DLP respondents. These findings suggest that overall
bear species composition in communities may be different with more black bears in low
DLP communities and more brown bears in high DLP communities. The reason for this
is unknown, but may be explained by the availability of more suitable brown bear habitat
in the high DLP communities compared to low DLP communities, and more suitable
black bear habitat in low DLP communities relative to high DLP communities. However,
thorough habitat analysis of these communities would aid in determination of this
assumption.
Most respondents in both types of communities tended to have positive or
somewhat positive attitudes toward both bear species (80%), although those in high DLP
communities were slightly less positive toward brown bears. This is consistent with my
hypothesis as well as with research conducted by Jonker, Muth, Organ, Zwick, and
Siemer (2006). Jonker et al. (2006) found that while some respondents experienced
problems with beavers, their attitude remained positive, yet less so compared to
respondents that experienced no problems with beavers. It‟s possible that these slight
differences in attitude stem from the greater amount of negative experiences with brown
bears for those respondents from high DLP communities relative to respondents in low
DLP communities. In addition, more negative attitudes have been found by people who

38
are dependent on local land resources for a living as they feel that their livelihood may be
threatened because of bears (Kellert, 1994).
Two out of the three risk perception questions found that high DLP respondents
perceived greater risk from brown bears than low DLP respondents, which is consistent
with my hypothesis that low DLP respondents have less perceived risk; however, I did
not state that risk perception would be specific to bear species. Research by Siemer et al.
(2009) showed that more positive experiences with black bears in local residential areas
led to decreased risk perception among residents. It seems likely that the increased
negative experiences with brown bears among high DLP respondents has contributed to
their increased sense of risk perception compared to fewer negative brown bear
experiences, and thus less perceived risk for low DLP respondents. Gore, Siemer,
Shanahan, Schuefele, & Decker (2005) found that a slight increase in risk perception by
respondents corresponded with an increase in print media coverage of bear incidences. I
do not know whether there is a greater amount of communication in high DLP
communities to attribute to more risk perception among respondents compared to low
DLP respondents.
Variables influencing attitude towards brown and black bears
My hypothesis that overall experience with bears would be a strong predictor of
attitude was verified in my models for both brown and black bears. Other variables
influencing attitude toward bears included their opinion on the population size, age and
education of the respondent, and risk perception. For the variable of opinion regarding
the population size of both brown and black bears, my results were consistent with the

39
literature which states that when bears are considered rare, relatively speaking, more
positive attitudes are found among respondents (Cardoza, 1976; Brown et al., 1981). On
the contrary, when bear populations are perceived as being overpopulated, more negative
attitudes are found (Colorado Division of Wildlife, 1989). There are no data regarding
the population size of brown or black bears in each of my surveyed communities, but in
general, the majority of respondents from my survey were of the opinion that both bear
populations were not too high, therefore having little negative effect on their attitude.
My results for age of respondent are consistent with research by Morzillo (2007),
who found younger respondents often have a more positive attitude toward bears than
older respondents. This could be due to the fact that often older respondents have more
time to incur loss or damage from bears which affects attitude negatively and it is likely
these younger respondents have experienced none or little loss to bears.
In accordance with research by Knuth et al. (1992), risk perception toward bears
can influence attitudes toward bears. People who perceive less risk tend to have more
positive attitudes toward bears. My results were consistent with my hypothesis that
positive experiences with bears will be a strong factor influencing positive attitudes,
which is also validated by the literature. Often one or more events can strongly affect
people‟s attitudes and influence their reaction to future encounters (Conover, 2001;
Woodroffe et. al, 2005). Those that tend to hold positive attitudes toward nuisance
wildlife do so until they have experienced some type of damage (Bowman, Leopold,
Vilella, Gill, & Jacobson, 2001; Clark et al., 1991; Jonker et al., 2006; West & Parkhurst,
2002).

40
I found nominal studies regarding a significant link between education level and
attitude toward bears, yet my results indicate a more positive attitude toward bears with
higher educated respondents. The fact that women were found to have a more positive
attitude toward bears than men has been documented in the literature regarding wildlife
in general. Kellert and Berry (1987) pointed to strong differences in the types of attitudes
men and women have with women having more humanistic and moralistic views and
expressing more concern about wildlife conservation.
Variables influencing risk perception towards brown and black bears
My hypothesis that overall experience with bears would be a strong predictor of
risk perception was verified in my models for both brown and black bears. Other
variables that best predicted risk perception toward both brown and black bears included
opinion and attitude. I could not find literature regarding people‟s opinion relative to the
size of a bear population and how it may be related to risk perception. My research
suggests that people who thought brown or black bear populations were not too high also
perceived less risk from that species of bear. As with other research regarding attitudes,
those with less risk perception also tended to have more positive attitudes toward bears
(Knuth et al., 1992). The fact that more positive experiences with bears are associated
with decreased risk perception among residents is also supported by Siemer et al. (2009)
and supports my hypothesis that positive experiences are a strong factor influencing less
risk perception.
Other variables that predicted risk perception toward brown bears included
attractants, while variables related to black bears included respondents‟ gender and age,

41
and negative experiences. Why attractants were a factor relative to brown bears and not
black bears is unclear, but could have to do with my data collection process or even the
model selection process. I recorded attractants based on a quick survey of the property.
Therefore, it is likely that I missed attractants even though they were present. In addition,
my survey of attractants represented a one day snapshot, and it is possible that people
tended to vary the amount of attractants on their property over time. However increased
risk perception has been associated with more negative experiences, which could be due
to the fact that I found more attractants associated with respondents‟ properties in high
DLP communities compared to low DLP communities.
Gender results were consistent with literature as females tended to perceive more
risk (toward large carnivores) than men (Arrindell, 2000; Roskaft, Bjerke, Kaltenborn,
Linell, & Andersen, 2003; Tucker & Bond, 1997), which is possibly due to the majority
of women lacking familiarity with bears as more men traditionally hunt more than
women. Age also had a significant relationship with risk perception in that older
respondents perceived less risk than younger respondents. Age may factor into the
amount of experience a person has with black bears as research has found the more
experience and familiarity someone has with bears, the less risk they perceive. Research
has also found that older people are more afraid of wolves and brown bear than younger
people, (Bjerke, Kaltenborn, & Thrane, 2001; Roskaft et al., 2003).
Tolerance toward brown and black bears
While I had hypothesized that low DLP respondents would be more tolerant of
brown and black bears, there were no significant differences in tolerance toward either

42
bear species among low and high DLP respondents in regards to responses of “contact
authorities” or “use of lethal methods”. My results suggest that according to these
situations authorities would deal with residents from both community types with the same
frequency. However, the specific cases might still differ such as authorities responding
to DLPs more in high DLP communities, while responding to low DLP communities
before DLPs have occurred. This leads to speculation of whether measuring tolerance in
this manner is an accurate predictor of how people would behave in real life scenarios.
When examining the various situations described for tolerance questions, I found
that respondents answered only two of the seven situations in significantly different
ways. While most responses from both community types were similar for these two
situations, a significant percentage differed in which low DLP respondents chose less
aggressive measures and high DLP respondents chose more aggressive measures.
Research by Zinn, Manfredo, Vaske, and Wittman (1998) found that as people
experience more negative encounters, they are more likely to support proactive
management, which includes invasive or lethal techniques. Therefore, the greater
number of negative experiences that high DLP respondents reported could be leading to
more aggressive actions regarding these tolerance scenarios. In addition support for
lethal techniques will become stronger depending on the type and severity of the wildlife-
caused problems (Stout, Knuth, & Curtis, 1997; Loker et al., 1999; Koval & Mertig,
2004). Although I did not gauge the severity of negative experiences with bears, there
was no significant difference in the type of conflicts people reported for brown and black
bears among communities.

43
Conflict mitigation efforts
My survey results indicated that 91% of residents have available or have used
some type of routine preventive measure against bears, with most respondents (63%)
having available or using firearms for protection from bears. Other preventive measures
used included dogs (41%), bear spray (34%), and bear-resistant garbage cans (33%).
Many respondents used more than one type of preventive measure. From my data, it
appears that residents are aware of bears in the area and prepare for interactions with
them with a potentially lethal response. My results were not able to determine if
respondents are aware of the effectiveness of other non-lethal measures and strategies.
The fact that there was no significant difference in the type of conflict
experienced among respondents from either community type or bear species suggests that
some conflicts are universal for the Kenai. While most respondents had not suffered a
loss or damage, those that did, typically experienced structural damage (buildings,
vehicles, etc.), a threat to themselves or a family member, or other category, caused by
both bear species. When respondents filled out what the category of “other” consisted of,
most described objects being destroyed such as barbecues and bird feeders. In general,
the reliability of determining which bear species may have caused these losses may be
low because loss or damage can happen at night or when no one is present. Since this
question did not specify if the person actually saw the bear or could positively ID bear
sign, differentiating bear species was not possible.

44
MANAGEMENT IMPLICATIONS
Understanding human attitude, risk perception, and tolerance toward bears
provides managers with greater insight into factors that could hinder effective wildlife
management. Successful coexistence with bears means taking a closer look at private
lands and requires interaction and cooperation with residents and wildlife managers
(Primm & Wilson, 2004). This is especially important as residents are responsible for
80% of DLPs (Kenai Peninsula Brown Bear Conservation Strategy, 2000) and 40% of
these DLPs occur on private property (ADFG, 2012). Determining the source of
conflicts and mitigating those conflicts becomes a job for the whole community.
Peine (2001) found that food conditioned bears can increase the likelihood of
human-bear conflicts. Therefore, it is important that wildlife managers work on
addressing attractants such as food, garbage, pets, and livestock as they are often the
primary cause of human-bear conflicts associated with property damage, human injury,
and bear kills (Herrero, 1985; Gunther, 1994; Gniadek & Kendall, 1998; Herrero &
Higgins, 2003). Residents that are uneducated about bear behavior toward attractants, as
well as negligence of those that do know the consequences, can significantly contribute to
conditioning bears to human attractants. On the Kenai, food conditioned bears become
nuisance bears which often result in dead bears after creating problems on people‟s
property. By eliminating attractants fewer nuisance bears will exist and therefore
residents will experience less negative experiences with bears on their property,
increasing positive attitudes toward bears. Strengthening the enforcement of ordinances
already in effect that work to penalize residents for negligently feeding wildlife can be an

45
effective way to reduce attractants on people‟s property. However, if other issues such as
risk perception are not addressed, residents may still feel threatened when a bear is on or
near their property.
A more comprehensive understanding of risk perceived by residents on the Kenai
would help wildlife managers to focus efforts in a way to reduce those levels. This could
greatly benefit high DLP communities in regards to their risk perception toward brown
bears. Gore (2007) found that by focusing on the factors that influence wildlife-related
risk perception, outreach efforts can be better designed with a clear message to aid in
reducing those levels of risk perception. Cho (2003) also found that people who had
increased risk perception were also linked to increased risk-reducing behavior, so it is
likely that this group of residents would be receptive to education on the subject of better
understanding bears and bear behavior. Research has also found that risk perception can
be strongly affected by people who would not feel in control of their own response during
an encounter with a bear (Johansson & Karlsson, 2011) Therefore, if they were taught
how to handle an interaction, it is likely this information would help to decrease their
level of risk perception. Offering bear safety and awareness classes to the public would
provide them with the skills to successfully handle an interaction with a bear.
Wildlife managers should also work to increase tolerance of bears on the Kenai.
Studies have revealed that decreased tolerance of bears was correlated to respondents
who were less knowledgeable about bears, those with less education, and lower incomes
(Clark et al. 1991). Working to improve residents‟ knowledge about bears with
educational programs could help increase tolerance of bears. Increasing education about

46
wildlife has also been associated with an increase in support of wildlife agencies (Peyton
& Grise, 1995), which would greatly benefit wildlife managers on the Kenai as brown
bear management has been a contentious subject among the public, state, and federal
agencies. In addition, research on hunting clubs in Mississippi and Arkansas found that
clubs with fewer bears wanted more bears and those with more wanted fewer (White et
al. 1997). This is suggestive of tolerance decreasing when bear populations are high.
Taking this into account, it‟s important that bear populations on the Kenai are not
perceived as being too high to negatively affect tolerance and measures that work to keep
bear populations at socially acceptable levels should be considered.
With the ever increasing human population on the Kenai it is likely human-bear
conflicts will escalate and the number of bears killed in defense of life or property will
become a significant source of mortality for brown bears not only on the Kenai
Peninsula, but the rest of Alaska as well. This implies that residents who live in these
areas will determine the success of bear conservation. Gaining support of residents and
teaching them that their actions and efforts are required for successful conservation of
bears will be an invaluable tool.

47
LITERATURE CITED
Agee, J. D., & Miller, C. A. (2009). Factors contributing toward use of lethal control of black
bears in central Georgia, USA. Human Dimensions of Wildlife, 14(3), 198-205.
Ajzen, I. (1991). The Theory of Planned Behavior. Orginizational Behavior and Human
Decision Processes, 50, 179-211.
Ajzen, I. (2001). Nature and operation of attitudes. Annual Review of Psychology, 52, 27-
58.
Ajzen, I., & Fishbein, M. (1977). Attitude-behavior relations: A theoretical analysis and
review of empirical research. Psychological Bulletin, 84, 5.
Ajzen, I., & Fishbein, M. (1980). Understanding attitudes and predicting social behavior.
Englewood Cliffs, NJ: Prentice-Hall.
Alaska Department of Fish and Game (2011). Retrieved from www.adfg.alaska.gov
Arrindell, W. A. (2000). Phobic dimensions: IV. The structure of animal fears. Behaviour
Research and Therapy, 38, 509–530.
Beckmann, J. P., & Berger, J. (2003). Using black bears to test ideal free distribution
models experimentally. Journal of Mammalogy, 84, 594−606.
Bjerke, T., Kaltenborn, B. P., & Thrane, C. (2001). Sociodemographic correlates of fear-
related attitudes toward the wolf (Canis lupus lupus). Fauna Norvegica, 21, 35–
33.
Bohner, G., and Wanke, M. (2002). Attitudes and attitude change. New York, NY:
Taylor and Francis.
Borgatta, E. F., & Bohrnstedt, G. W. (1980). Level of measurement: Once over again.
Sociological Methods & Research, 9(2), 147-160.
Bowman, J. L., Leopold, B. D., Vilella, F. J., Gill, D. A., & Jacobson, H. A. (2001).
Attitudes of Landowners toward American Black Bears Compared between Areas
of High and Low Bear Populations. Ursus, 12, 153-160.
Bright, A. D., & Manfredo, M. J. (1995). The quality of attitudinal information regarding
natural resource issues: The role of attitude-strength, importance, and information.
Society and Natural Resources, 8, 399-414.

48
Brown, T. L., Decker, D. J., & Hustin, D. L. (1981). Public attitudes toward black bear
in the Catskills. Albany, NY: New York State Department of Environmental
Conservation.
Cardoza, J. E. (1976). The history and status of the black bear in Massachusetts and
adjacent New England States. Massachusetts Divison of Fisheries and Wildlife,
Res. Bull., 18, 113.
Carroll, C., Noss, R. F., & Paquet, P. C. (2001). Carnivores as focal species for
conservation planning in the Rocky Mountain region. Ecological Applications,
11 (4), 961-980.
Cho, H. (2003). Communicating risk without creating unintended effects. American
Journal Health Study, 18, 104.
Clark, J. D., Clapp, D. L., Smith, K. G., & Wigley, T. B. (1991). Black bear damage and
landowner attitudes towards bears in Arkansas. Proceedings of the Annual
Conference of Southeastern Association of Fish and Wildlife Agencies.
Colorado Division of Wildlife (1989). Attitudes about wildlife and black bears in
Colorado. Denver, CO.
Conover, M. R., (2001). Resolving human-wildlife conflicts: the science of wildlife
damage management. Boca Raton, FL: CRC Press.
DeBruyn, T. D., Harris, G., Morton, J. M., & Selinger, J., (2006). White Paper. Research
Directions for the Interagency Brown Bear Study Team. Anchorage, AK.
Decker, D. J., Lauber, T. B., & Siemer, W. F. (2002). Human–wildlife conflict
management: A practitioner’s guide. Northeast Wildlife Damage Management
Research and Outreach Cooperative. Ithaca, NY.
Del Frate, G. G. (1999). Units 7 and 15 brown bear management report of survey and
inventory activities 1996-1998. Federal Aid in Wildlife Restoration Project.,
Juneau, AK: Alaska Department of Fish and Game.
Don Carlos, A. W., Bright, A. D., Teel, T. L., Vaske, J. J. (2009). Human-black bear
conflict in urban areas: an integrated approach to management response. Human
Dimensions of Wildlife, 14, 174–184.
Fishbein, M., & Manfredo, M. J. (1992). A theory of behavior change. In Influencing
human behavior : Theory and applications in recreation, tourism, and natural
resource management. Champaign, IL: Sagamore.

49
Gliem, J. A. & Gliem, R. R. (2003). Calculating, interpreting, and reporting Cronbach’s
alpha reliability coefficient for likert-type scales. Midwest Research-to-Practice
Conference in Adult, Continuing, and Community Education. Columbus, OH:
Ohio State University.
Gniadek, S. J., & Kendall, K. C. (1998). A summary of bear management in Glacier
National Park, 1960-1994. Ursus, 10, 155-159.
Gore, M. L., Siemer, W. F., Shanahan, J. E., Schuefele, D., & Decker, D. J. 2005. Effects
on risk perception of media coverage of a black bear-related human fatality.
Wildlife Society Bulletin, 33(2), 507-516.
Gore, M. L., Knuth, B. A., Curtis, P. D., & Shanahan, J. E. (2007). Factors influencing
risk perception associated with human–black bear conflict. Human Dimensions of
Wildlife, 12(2), 133–136.
Gunther, K.A. (1994). Bear management in Yellowstone National Park, 1960-93.
International conference on bear research and management.
Hastings, B. (1986). Wildlife-related perceptions of visitors in Cades Cove, Great Smoky
Mountains National Park. Ph.D. Dissertation, University of Tennessee, Knoxville.
Herrero, S. (1985). Bear attacks: their causes and avoidance. New York, NY: Lyons and
Burford.
Herrero, S., & Higgins, A. (2003). Human injuries inflicted by bears in Alberta: 1960-
1998. Ursus, 14, 44-54.
Iossa, G., Soulsbury, C. D., Baker, P. J., & Harris, S. (2010). A taxonomic analysis of
urban carnivore ecology. Urban carnivores. Baltimore, MD: The John Hopkins
University Press.
Johansson, M., & Karlsson, J. (2011). Subjective Experience of Fear and the Cognitive
Interpretation of Large Carnivores. Human Dimensions of Wildlife, 16(1), 15-29.
Jonker, S. A., Parkhurst, J. A., Field, F., & Fuller, T. K. (1998). Black bear depredation
on agricultural commodities in Massachusetts. Wildlife Society Bulletin, 26, 318–
324.
Jonker, S. A., Muth, R. M., Organ, J. F., Zwick, R. R., and Siemer, W. F. (2006).
Experiences with beaver damage and attitudes of Massachusetts residents toward
beaver. Wildlife Society Bulletin, 34, 1009-1021.
Kaczensky, P., Blazic, M., & Gossow, H. (2004). Public attitudes towards brown bears
(Ursus arctos) in Slovenia. Biological Conservation, 118(5), 661-674.

50
Kellert, S. R. & Berry, J. K. (1987). Attitudes, knowledge and behaviors toward wildlife
as affected by gender. Wildlife Society Bulletin, 15(3), 363-371.
Kellert, S. R. (1994). Public attitudes toward bears and their conservation. Bears: Their
Biology and Management. A Selection of Papers from the Ninth International
Conference on Bear Research and Management, Missoula, MT.
Kenai Peninsula Brown Bear Stakeholders Group (2000). Kenai Peninsula Brown Bear
Conservation Strategy. Juneau, AK: Alaska Department of Fish and Game.
Kendrick, A. (2003). Caribou co-management in northern Canada: fostering multiple
ways of knowing. Navigating Socialecological Systems. Cambridge, United
Kingdom: Cambridge University Press.
Knuth, B. A., Stout, R. J., Siemer, W. F., Decker, D. J., and Stedman, R. C. (1992). Risk
management concepts for improving wildlife population decisions and public
communication strategies. Transactions of the 57th North American Wildlife and
Natural Resources Conference, Washington D.C.
Koval, M. H., & Mertig, A. G. (2004). Attitudes of the Michigan public and wildlife
agency personnel toward lethal wildlife management. Wildlife Society Bulletin,
32(1), 232-243.
Loker, C. A., Decker, D. J., & Schwager, S. J. (1999). Social Acceptability of Wildlife
Management Actions in Suburban Areas: 3 Cases from New York. Wildlife
Society Bulletin, 27(1), 152-159.
Loveridge, A. J., Reynolds, J. C., & Milner-Gulland, E. J. (2007). Does sport hunting
benefit conservation? Key Topics in Conservation Biology. Oxford: Oxford
University Press.
Miller, S.D (1989). Population management of bears in North America. Eighth
International Conference on Bear Research and Management. British Columbia,
Canada.
Miller, S. D., White, G. C., Sellers, R. A., Reynolds, H. V., Schoen, J. W., Titus, K.,
Barnes, V. G. Jr., Smith, R. B., Nelson, R. R., Ballard, W. B., and Schwartz, C. C.
(1997). Brown and black bear density estimation in Alaska using radio-telemetry
and replicated mark-resight techniques. Wildlife Monographs, 133, 55.
Miller, S. M., & McCollum, D. W. (1994). Alaska voters, Alaska hunters, and Alaska
nonresident hunters: their wildlife related trip characteristics and economics.
Anchorage, AK: Alaska Department of Fish and Game.

51
Miller, S. M., Miller, S. D., & McCollum, D. W. (1998). Attitudes toward and relative
value of Alaskan brown and black bears to resident voters, resident hunters, and
nonresident hunters. Ursus, 10, 357-376.
Morton, J. M., Bray, M., Hayward, G., White, G., & Paetkau, D. (2012). The Kenai
brown bear population on the Kenai National Wildlife Refuge and Chugach
National Forest. Anchorage, AK: United States Fish and Wildlife Service.
Morzillo, A. T., Mertig, A. G., Garner, N., & Liu, J. (2007) Resident attitudes toward
black bears and population recovery in East Texas. Human Dimensions of
Wildlife, 12, 417–428.
Naughton-Treves, L. (1997). Farming the forest edge: Vulnerable places and people
around Kibale National Park, Uganda. Geography Review, 87(1), 27-46.
Naughton-Treves, L., Grossberg, R., & Treves, A. (2003). Paying for tolerance: Rural
citizens‟ attitudes toward wolf depredation and compensation. Conservation
Biology, 17(6), 1500-1511.
Nawaz, M. A. (2007). Status of the brown bear in Pakistan. Ursus, 18(1), 89-100.
Nielsen, S. E., Herrero, S., Boyce, M. S., Mace, R. D., Benn, B., Gibeau, M. L., &
Jevons, S. (2004). Modelling the spatial distribution of human-caused grizzly bear
mortalities in the Central Rockies ecosystem of Canada. Biological Conservation,
120(1), 101-113.
Nielsen, S. E., Stenhouse, G. B., & Boyce, M. S. (2006). A habitat-based framework for
grizzly bear conservation in Alberta. Biological Conservation, 130(2), 217-229.
Ogra, M. (2009). Attitudes toward resolution of human-wildlife conflict among forest-
dependent agriculturalists near Rajaji National Park, India. Human Ecology, 37,
161–177.
Palmeira, F. B. L., Crawshaw, P. G., Haddad, C. M., Ferraz, K., & Verdade, L. M.
(2008). Cattle depredation by puma (Puma concolor) and jaguar (Panthera onca)
in central western Brazil. Biological Conservation, 141, 118–125.
Peine, J. D. (2001). Nuisance bears in communities: Strategies to reduce conflict. Human
Dimensions of Wildlife, 6, 223–237.
Petko-Seus, P.A. 1985. Knowledge and attitudes of campers toward black bears in Great
Smoky Mountains National Park. M.S. Thesis, University of Tennessee,
Knoxville.
52
Peyton, R. B., & Grise, L. (1995). A 1995 survey of Michigan public attitudes regarding
bear management issues. Report to the Wildlife Division. East Lansing, MI:
Michigan Department of Natural Resources.
Peyton, R. B., Bull, P., Reis, T., & Visser, L. (2000). An assessment of the social
carrying capacity of black bears in the Lower Peninsula of Michigan. East
Lansing, MI: Michigan State University, Department of Fisheries and Wildlife.
Power, T. M. (1991). Ecosystem preservation and the economy in the Greater
Yellowstone area. Conservation Biology, 5(3), 395-404.
Primm, S., & Wilson, S. M. (2004). Re-connecting grizzly bear populations: Prospects
for participatory projects. Ursus, 15(1), 104-114.
Proctor, M. F., Servheen, C., Miller, S. D., Kasworm, W. F., & Wakkinen, W. L. (2004).
A comparative analysis of management options for grizzly bear conservation in
the U.S.– Canada trans-border area. Ursus, 15, 145–160.
Proctor, M. F., McLellan, B. N., Strobeck, C. & Barclay, R. M. R. (2005). Genetic
analysis reveals demographic fragmentation of grizzly bears yielding vulnerably
small populations. Proceedings of the Royal Society B, 272, 2409-2416.
Roskaft, E., Bjerke, T., Kaltenborn, B., Linell, J. D. C., & Andersen, R. (2003). Patterns
of self reported fear towards large carnivores among the Norwegian public.
Evolution and Human Behavior, 24, 184–198.
Schwartz, C. C., & Arthur, S. A. (1997). Cumulative effects model verification sustained
yield estimation, and population viability management of the Kenai Peninsula,
Alaska brown bear. Federal Aid in Wildlife Restoration Study. Juneau, AK:
Alaska Department of Fish and Game.
Servheen, C., Herrero, S., Peyton, B. (2004). Status Survey and Conservation Action
Plan. Bears. IUCN/SSC Bear Specialist Group. Missoula, MT.
Siemer, W. F., & Decker, D. J. (2003). 2002 New York State Black Bear Management
Survey: Study Overview and Findings Highlights. Human Dimensions Research
Unit. Ithaca, NY: Cornell University.
Siemer, W. F., & Otto, P. (2005). A group model-building intervention to support wildlife
management. Paper submitted to the 23rd International Conference of the System
Dynamics Society. Boston, MA.
Siemer, W. F., Hart, P. S., Decker, D. J., & Shanahan, J. E. (2009). Factors that influence
concern about human-black bear interactions in residential settings. Human
Dimensions of Wildlife, 14, 185-197.

53
Slovic, P. (1987). Perceptions of risk. Science, 236, 280–285.
Snedecor, G. W., & Cochran, W. G. (1989). Statistical Methods. Eighth Edition, Iowa
State University Press.
Spash, C. L. (1997). Ethics and environmental attitudes with implications for economic
valuation. Journal of Environmental Management, 50, 403–416.
Stout, R.J., Knuth, B.A., & Curtis, P.D. (1997). Preferences of suburban landowners for
deer management techniques: A step towards better communication. Wildlife
Society Bulletin, 25, 34-359.
Stowell, L. R., & Willging, R. C. (1992). Bear damage to agriculture in Wisconsin.
Proceedings of the 5th
Eastern Wildlife Damage Control Conference.
Suring, L. H., & del Frate, G. (2002). Spatial analysis of locations of brown bears killed
in defense of life or property on the Kenai Peninsula, Alaska, USA. Ursus, 13,
237-245.
Talbot, S. L., & Farley, S. D. (2009). Brown bears of the Kenai Peninsula are genetically
isolated from mainland south central and southwestern Alaskan populations
(abstract only). Alaska Science Center, Anchorage, AK: United States Geological
Survey.
Tarrant, M. A., Bright, A. D., & Cordell, H. K., (1997). Attitudes toward wildlife species
protection: assessing moderating and mediating effects in the value-attitude
relationship. Human Dimensions of Wildlife, 2, 1–20.
Vaske, J. J. (2008). Survey Research and Analysis: Applications in Parks, Recreation,
and Human Dimensions. State College, PA: Venture Publishing.
Wakkinen, W. L., & Kasworm, W. F. (2004). Demographics and population trends of
grizzly bears in the Cabinet–Yaak and Selkirk Ecosystems of British Columbia,
Idaho, Montana, and Washington. Ursus, 15, 65-75.
Waller J. S., & Servheen, C. (2005). Effects of transportation infrastructure on grizzly
bears in Northwestern Montana. Journal of Wildlife Management, 69, 985-1000.
Wang, S. W., Lassoie, J. P., & Curtis, P. D. (2006). Farmer attitudes towards
conservation in Jigme Singye Wangchuck National Park, Bhutan. Environmental
Conservation, 33, 148–156.
West, B. C., & Parkhurst, J. A. (2002). Interactions between deer damage, deer density,
and stakeholder attitudes in Virginia. Wildlife Society Bulletin, 30, 139-147.

54
White, T. H., Shropshire, C. C., and Staten, M. (1997). Black bear damage in the Mississippi Alluvial Valley. Proceedings of the Wildlife Damage Management Conference.
Wilder, J. M. (2003). Quantifying bear populations and bear-human conflicts using non-
invasive genetic sampling in the Kennicott Valley of Wrangell-St. Elias National
Park and Preserve, AK. M.S. Thesis, University of Idaho.
Wilder, J. M., DeBruyn, T. D., Smith, T.S., & Southwould, A. (2007). Systematic
collection of bear-human interaction information for Alaska's national parks.
Ursus, 18(2), 209-216.
Wilson, S. M., & Clark, S. G. (2007). Resolving human-grizzly bear conflict: An
integrated approach in the common interest. Integrated Resource and
Environmental Management. Ontario, Canada: Oxford University Press.
Witmer, G. W., & Whittaker, D. G. (2001). Dealing with nuisance and depredating black
bears. Western Black Bear Workshop, 7, 73-81.
Woodroffe, R., Thirgood, S. J., Rabinowitz, A. (Eds.), (2005). People and Wildlife:
Conflict or Coexistence? Cambridge, UK: Cambridge University Press.
Zeller, R. & Carmines, E. (1980). Measurement in Social Sciences: The Link Between
Theory and Data. Cambridge, UK: Cambridge University Press.
Zimmermann, A., Walpole, M. J., & Leader-Williams, N., (2005). Cattle ranchers‟
attitudes to conflicts with jaguar Panthera onca in the Pantanal of Brazil. Oryx,
39, 406–412.
Zinn, H. C., Manfredo, M. J., Vaske, J. J., & Wittman, K. (1998). Using normative
beliefs to determine the acceptability of wildlife management actions. Society and
Natural Resources, 11, 649–662.

55
TABLES- Chapter One
Table 1. Selection criteria* of low and high defense of life and property
communities based on housing density, human population size, and the
number of defense of life or property bear kills (DLP) on the Kenai
Peninsula, Alaska, 2011.
Community Housing Density mi
2
(2000)
Pop.
(2000) DLPs (2000-2010)
Sunrise 1.9 18 0
Crown Point 10.7 75 1
Lowell Point 6.1 92 0
Primrose 1.3 93 2
Hope 3.4 137 2
Clam Gulch 8.4 173 2
Moose Pass 6.6 206 2
Nikolaevsk 3.4 345 1
Cooper Landing 5.7 369 18
Kachemak 136.2 431 0
Kasilof 20.1 471 2
Happy Valley 4.5 489 1
Funny River 22.8 636 8
Ninilchik 3.7 772 10
Salamatof 34.8 954 1
Cohoe 9 1168 1
Fritz Creek 15.7 1603 0
Bear Creek 19.2 1748 10
Diamond Ridge 17.8 1802 3
Anchor Point 10.8 1845 1
Ridgeway 56.3 1932 5
Seward 73.3 2830 0
Soldotna 240.7 3759 5
Homer 177 3946 0
Nikiski 25.4 4327 9
Sterling 33 4705 18
Kalifornsky 35.8 5846 5
Kenai 100.4 6942 4
*Fox River was not included as it was not road accessible to the mainland of the
Kenai Peninsula.

56
Table 2. Demographic characteristics for survey respondents in select low versus high defense of life
and property (DLP) communities on the Kenai Peninsula, Alaska, 2011.
Self-reported demographic data
Low DLP
Community
High DLP
Community P-value
Number of respondents 150 282 <0.001
GENDER 41% female 47% female 0.35
59% male 53% male
AGE 18-86 years old 18-84 years old NA
EDUCATION (report having a college degree) 41% 28% 0.01
RESIDENCY (range of residence in years) 1 to 75 1 year to 65 NA
HUNTER
Regular hunting participation 53% 60% 0.16
Hunted in the past two years 31% 38% 0.27
Hunted brown bears at some time in past 17% 19% 0.80
Hunted black bears at some time in past 32% 35% 0.42
Brown bear killed in non-hunting related incident on property 0.7% 1.7% 0.01
Black bear killed in non-hunting related incident on property 3.3% 2.1% 0.52

57
Table 3. Comparison of sightings and negative experiences with
brown and black bears on private property in select defense of life
and property (DLP) communities on the Kenai Peninsula, Alaska,
2011.
Respondents
Survey question
and response
options
Low DLP
Community
High DLP
Community P-value
Brown
bear
Black
bear
Brown
bear
Black
bear
Total sightings 203 640 752 718
< 0.001 a,c
Respondents n=145 n=146 n=274 n=272
Mean 2.6 3.9 2.7 4.2
Range 0 to 20 0 to 29 0 to 40 0 to 30
SD 6.1 8.1 6.4 8.5
Total negative
experiences 14 41 124 56
< 0.001 a,b,c
Respondents n=145 n=144 n=269 n=268
Mean 0.4 0.2 0.4 0.3
Range 0 to 2 0 to 7 0 to 10 0 to 13
SD 2.8 1.1 2.9 1.1 aSignificant with bonferroni‟s correction for low DLP communities
among brown vs. black bears. bSignificant with bonferroni‟s correction for high DLP communities
among brown vs. black bears. cSignificant with bonferroni‟s correction for brown bears among low vs.
high DLP communities.

58
Table 4. Comparison of attitudes and risk perception toward brown and black bears in select defense of
life and property (DLP) communities on the Kenai Peninsula, Alaska, 2011.
Respondents
Type of Question Survey question and
response optionsa
Low DLP
Community
High DLP
Community P-value
Attitude
Brown
bear
Black
bear
Brown
bear
Black
bear
I enjoy having bears
on the Kenai n=149 n= 149 n=280 n=282
0.33 Agree 75% 79% 74% 77%
Neutral 15% 18% 17% 17%
Disagree 10% 3% 9% 7%
Bears are a sign of
intact nature n=148 n=149 n=278 n=280
0.95 Agree 82% 81% 80% 80%
Neutral 12% 14% 13% 14%
Disagree 6% 5% 8% 6%
There is no need to
have bears on the
Kenai n=148 n=148 n=281 n=281
0.01* Agree 9% 5% 5% 5%
Neutral 5% 6% 14% 14%
Disagree 86% 89% 81% 80%
Mean Index 4.18 4.26 4.08 4.11
SD 0.98 0.80 0.84 0.80
Risk Perception
I worry about
problems bears may
cause n=149 n=147 n=280 n=280 0.01** Agree 45% 35% 51% 38%
Neutral 32% 31% 24% 28%
Disagree 23% 34% 25% 34%
I feel threatened by
bears on the Kenai n=147 n=147 n=280 n=281
0.09 Agree 16% 13% 21% 15%
Neutral 22% 20% 27% 23%
Disagree 63% 67% 53% 62%
I fear being injured
by bears on the Kenai n=147 n=147 n=280 n=281
0.001**
Agree 22% 16% 29% 17%
Neutral 26% 22% 30% 27%
Disagree 52% 61% 42% 56%
Mean Index 3.26 3.50 3.06 3.37
SD 1.04 1.03 1.07 1.01 aScores were derived from a 5-point likert scale, with 1 indicating strongly disagree, 5 strongly agree, and 3
neutral.
*Moderately significant with bonferroni's correction for brown bears among high vs. low DLP communities.
**Significant with bonferroni‟s correction for high DLP communities among brown vs. black bears.

59
Table 5. Model comparisons for determining respondents’ attitude toward brown bears on the Kenai
Peninsula, Alaska, 2011.
Model AIC ∆ AIC AICwt
Best Fit
Model
ATTITUDE~GENDER+OPINION+AGE+EDUCATION+
RISK PERCEPTION+OVERALL EXPERIENCE 809.26 0.00 0.96
Full Model
ATTITUDE~OPINION+CONFLICT+HUNTER+GENDER+
AGE+ EDUCATION+RISK PERCEPTION+SIGHTINGS+
NEGATIVE EXPERIENCES+OVERALL EXPERIENCES
815.51 6.25 0.04
Null Model ATTITUDE~1 1045.73 236.47 <0.001
Table 6. Evaluation of predictor variables for determining respondents’
attitude toward brown bears on the Kenai Peninsula, Alaska, 2011.
Predictor Variables Coefficient
Estimate
Std.
Error t value P-value
GENDER (Male) -0.11 0.07 -1.5 0.13
OPINION 0.05 0.02 2.25 0.03
AGE -0.01 0.00 -2.45 0.01
EDUCATION (Some College) 0.15 0.08 1.91 0.06
RISK PERCEPTION 0.31 0.04 7.99 <0.001
OVERALL EXPERIENCES -0.26 0.03 -7.49 <0.001
Table 7. Model comparisons for determining respondents’ attitude toward black bears on the
Kenai Peninsula, Alaska, 2011.
Model AIC ∆ AIC AICwt
Best Fit
Model
ATTITUDE~OPINION+AGE+EDUCATION+RISK
PERCEPTION+OVERALL EXPERIENCE 773.54 0.00 0.82
Full Model
ATTITUDE~OPINION+HUNTER+AGE+EDUCATION+
RISK PERCEPTION+NEGATIVE EXPERIENCES+
OVERALL EXPERIENCES
776.55 3.02 0.18
Null Model ATTITUDE~1 970.02 196.48 <0.001
Table 8. Evaluation of predictor variables for determining respondents’
determining attitude toward black bears on the Kenai Peninsula, Alaska, 2011.
Predictor Variables Coefficient
Estimate
Std.
Error t value P-value
OPINION 0.04 0.02 1.85 0.07
AGE -0.01 0.00 -3.18 0.01
EDUCATION (Some College) 0.14 0.07 1.83 0.68
RISK PERCEPTION 0.24 0.04 6.45 <0.001
OVERALL EXPERIENCES -0.29 0.03 -8.59 <0.001

60
Table 9. Model comparisons for determining respondents’ risk perception toward brown bears
on the Kenai Peninsula, Alaska, 2011.
Model AIC ∆ AIC AICwt
Best Fit
Model
RISK PERCEPTION~OPINION+ATTRACTANT+
ATTITUDE +OVERALL EXPERIENCES 1023.72 0.00 0.97
Full Model
RISK PERCEPTION~OPINION+CONFLICT+
HIGHLOW+ ATTRACTANT+ATTITUDE+
SIGHTINGS+NEGATIVE EXPERIENCES+
OVERALL EXPERIENCES
1030.62 6.89 0.03
Null Model RISK PERCEPTION~1 1222.37 198.64 <0.001
Table 10. Evaluation of predictor variables for determining respondents’
risk perception toward brown bears on the Kenai Peninsula, Alaska,
2011.
Predictor Variables Coefficient
Estimate
Std.
Error t value P-value
OPINION 0.11 0.03 3.84 <0.001
ATTRACTANTS (Yes) -0.17 0.09 -2.02 0.04
ATTITUDE 0.43 0.06 7.40 <0.001
OVERALL EXPERIENCES -0.23 0.04 -5.18 <0.001
Table 11. Model comparisons for determining respondents’ risk perception toward black bears
on the Kenai Peninsula, Alaska, 2011.
Model AIC ∆ AIC AICwt
Best Fit
Model
RISK PERCEPTION~OPINION+GENDER+AGE+
ATTITUDE+ OVERALL EXPERIENCES 968.64 0.00 0.72
Full Model
RISK PERCEPTION~OPINION+GENDER+AGE+
ATTITUDE+ NEGATVE
EXPERIENCES+OVERALL EXPERIENCES
970.49 1.85 0.28
Null Model RISK PERCEPTION~1 1152.31 183.67 <0.001
Table 12. Evaluation of predictor variables for determining respondent’s risk
perception toward black bears on the Kenai Peninsula, Alaska, 2011.
Predictor Variables Coefficient
Estimate
Std.
Error t value P-value
OPINION 0.14 0.03 4.70 <0.001
GENDER (Male) 0.38 0.09 4.47 <0.001
AGE 0.01 0.00 3.42 <0.001
ATTITUDE 0.42 0.06 6.83 <0.001
OVERALL EXPERIENCES -0.23 0.05 -4.99 <0.001

61
Table 13. Comparison of tolerance toward brown and black bears in select defense of life and property (DLP)
communities on the Kenai Peninsula, Alaska, 2011.
Respondents
Type of Question Survey question and
response options
Low DLP
Community
High DLP
Community P-value
Tolerance
Brown
bear
Black
bear
Brown
bear
Black
bear
You see a bear near your home once n=147 n=146 n=277 n=275
0.08 Do nothing 80% 86% 81% 81%
Use non-lethal methods 3% 3% 8% 8%
Contact authorities 15% 7% 10% 8%
Use lethal methods 2% 4% 1% 3%
You see a bear near your home more
than once a week n=144 n=145 n=272 n=271
*<0.001 Do nothing 33% 44% 23% 30%
Use non-lethal methods 8% 9% 17% 18%
Contact authorities 57% 40% 56% 46%
Use lethal methods 3% 7% 29% 6%
A bear damages a garbage can at
your home once n=142 n=144 n=264 n=261
0.01 Do nothing 50% 53% 45% 42%
Use non-lethal methods 12% 14% 37% 25%
Contact authorities 35% 26% 28% 26%
Use lethal methods 3% 6% 4% 7%
A bear damages garbage cans at
your home more than once a week n=139 n=142 n=252 n=255
0.15 Do nothing 12% 14% 10% 9%
Use non-lethal methods 17% 15% 18% 20%
Contact authorities 64% 59% 60% 53%
Use lethal methods 8% 11% 12% 18%
A bear chases a pet once n=143 n=144 n=266 n=269
0.02
Do nothing 34% 35% 26% 27%
Use non-lethal methods 18% 17% 26% 23%
Contact authorities 36% 31% 31% 27%
Use lethal methods 11% 16% 17% 23%
A bear chases a pet more than once
a week n=141 n=144 n=266 n=270
0.04 Do nothing 8% 8% 5% 5%
Use non-lethal methods 12% 15% 11% 12%
Contact authorities 55% 51% 45% 42%
Use lethal methods 26% 26% 39% 41%
You see or hear a bear attempting to
enter some part of your home n=145 n=146 n=272 n=274
**<0.001 Do nothing 1% 1% 2% 3%
Use non-lethal methods 10% 14% 9% 9%
Contact authorities 35% 32% 16% 16%
Use lethal methods 54% 53% 73% 71%
*Significance with bonferroni's correction for black bears among high vs. low DLP communities.
**Significance with bonferroni‟s correction for brown bears among high vs. low DLP communities, and black bears
among high vs. low DLP communities.
***Use of non-lethal methods (ex. pepper spray, hazing)

62
Table 14. Demographic characteristics for survey respondents on the
Kenai Peninsula, Alaska, 2011.
Variable N
Response
Category Percent
AGE 429 Mean Age 52
GENDER 417 Female 45
Male 55
EDUCATION 421 Grade School 3
High School
Degree 29
Some College 35
College Degree 33
RESIDENCY (in years) 418 Mean Length 17
HUNTER
Regular hunting participation 419 No 41
Yes 59
Hunted in the past two years 419 No 64
Yes 36
Hunted brown bears at some time in
past 411 No 81
Yes 19
Hunted black bears at some time in past 420 No 64
Yes 36

63
FIGURES- Chapter One
Figure 1. Distribution of defense of life or property bear kills (DLP) from 1960-2008 on the Kenai
Peninsula, Alaska.

64
Figure 2. Defense of life or property bear kills (DLP) and human population size on the Kenai
Peninsula, Alaska, 1960-2010.
Figure 3. Total brown bear mortalities from 2000-2011 on the Kenai Peninsula of Alaska due to
harvest, non-hunting kills (ex. road kills, illegal kills), and defense of life or property kills (DLP).
0
20
40
60
80
100
120
140
160
180
1960 1970 1980 1990 2000 2010
Years
DL
P B
ear
Kil
ls
0
10000
20000
30000
40000
50000
60000
Hu
man
Po
pu
lati
on
Human
Population
DLPs

65
Figure 4. Map of agencies responsible for bear management on the Kenai Peninsula, Alaska, 2012.

66
Figure 5. Sites selected for surveys on the Kenai Peninsula, Alaska, 2011.
Figure 6. Overall experience of respondents with brown and black bears on the Kenai Peninsula,
Alaska, 2011 (n=426).
3523 27
10 6
35
2332
5 4
0102030405060708090
100
Positive Somewhat
Positive
Neutral Somewhat
Negative
Negative
Response
Per
cen
tag
e
Brown bears
Black bears

67
Figure 7. Preventive measures respondents used or had to mitigate conflicts with brown and black
bears on the Kenai Peninsula, Alaska, 2011. These categories are not mutually exclusive and many
respondents used or had more than one method for routine preventive measures.
Figure 8. Losses/damages that respondents have incurred from brown and black bears on their
property on the Kenai Peninsula, Alaska, 2011. These categories are not mutually exclusive and
respondents may have experienced more than one type of loss/damage.
933 6
63
34 4131 36
0
10
20
30
40
50
60
70
80
90
100
None Bear proof
garbage
cans
Electric
fence
Firearms Bear Spray Dog/s Motion
sensor
lights at
night
Other
Types of preventive measures
Percen
tag
e
71
4 25
0
1412 12
69
4 2 3 1
10 9 10
0
10
20
30
40
50
60
70
80
90
100
NoneLoss of crops/stored food/beehives
Killed or injured pet or hunting dog
Killed or injured livestock or small animal
Killed or injured work/guard animal
Structure damage (buildings/vehicles/etc.)
A threat to your person or a family member
Other
Type of loss/damage
Per
cen
tag
e Brown bear
Black bear

68
CHAPTER TWO. A Review of Human-Bear Conflict Mitigation Strategies on the
Kenai Peninsula, Alaska
Abstract
The Kenai Peninsula is one of the fastest developing areas of Alaska and also has
experienced a drastic increase in the number of brown bears killed via the defense of life
or property (DLP) law since 2000. In an attempt to decrease DLP numbers, various
programs have been initiated by wildlife management agencies to address human-bear
conflicts. This is a review of human-bear conflict mitigation strategies used on the Kenai
Peninsula along with recommendations on how to strengthen current programs as well as
other strategies to improve proactive management of these conflicts.
INTRODUCTION
For the persistence and health of brown bears (Ursus arctos), including their
habitat on the Kenai Peninsula (Kenai), coexistence among humans and bears must occur.
While a portion of the land on the Kenai is federally protected as designated wilderness,
human encroachment threatens quality bear habitat on the remaining private and public
land. The Kenai is the second fastest growing region in Alaska, having grown 11.5% in
the last decade (US Census, 2010). This includes 1.5 new houses being built each day
(Kenai Peninsula Borough, 2012). Additionally, road density and other infrastructure to
service communities continues to fragment bear habitat, leading to an increase in human-
bear interactions. This increase in interactions also has led to an increase in the number
of conflicts between humans and bears that result in bears killed in defense of life or
property (DLPs), averaging five per year in the 1990s to an average of 16 per year during

69
the past decade (ADF&G, unpublished data). In 2000, the Alaska Department of Fish
and Game (ADF&G) reported that residents, as opposed to wildlife managers and law
enforcement, were responsible for about 80% of the bears killed in DLPs (Kenai
Peninsula Brown Bear Conservation Strategy, 2000), and about 40% of DLPs occurred
on private property (Figure 1). This raises concerns among bear managers on the Kenai
because it is difficult to control what happens when humans and bears come in contact
with each other.
In November of 1998, the ADF&G listed the Kenai brown bear population as a
“Species of Special Concern.”1 This identified the brown bear population as “vulnerable
to significant decline due to low numbers, restricted distribution, dependence on limited
habitat resources, or sensitivity to environmental disturbance” (Kenai Peninsula Brown
Bear Conservation Strategy, 2000). In an effort to ensure the future of brown bears on
the Kenai, many programs have been developed, ranging from concentrating
management on available bear habitat to human-bear conflict mitigation and outreach.
The following is a review of human-bear conflicts on the Kenai as well as the goals
outlined and programs created by the agencies responsible for promoting coexistence of
humans and bears on the Kenai.
HUMAN-BEAR CONFLICTS
Conflicts often occur when either bears move into human use areas or when
human development encroaches on bear habitat (Stowell & Willging, 1992; Peine, 2001),
1 At the start of 2012, the ADF&G no longer uses the “Species of Special Concern” list. The
species/populations of special concern have been relegated to an appendix in the State Wildlife Action
Plan. As of September 2012 no changes had been made to programs regarding brown bear research on the
Kenai (Selinger, Personal Communication, 2012).

70
mostly due to bears seeking out food sources which are now limited in availability after
displacement, or loss of vital habitat. Since even small numbers of bears killed by
humans can have adverse effects on population growth (Wakkinen & Kasworm, 2004),
areas of high human use often become population sinks for bears (Nielsen et al., 2004;
Nielsen, Stenhouse, & Boyce, 2006). For example, over a 10 year period, Beckmann and
Lackey (2008) reported 151 black bear deaths in urban environments of the northern
Sierra Nevada Mountains of Nevada including the Lake Tahoe Basin of California. All
of the deaths were due to humans, and deaths exceeded recruitment.
Developed areas attract bears as they search for a food source. Attractants offered
in a human-dominated landscape are often high calorie foods that can be obtained more
easily than natural, lower calorie foods found from foraging for longer periods of time
(McCarthy & Seavoy, 1994). Seeking human attractants such as garbage, bird and pet
food, fish carcasses, and livestock becomes habitual once a bear becomes conditioned to
this type of food. Bears habituated to human-dominated areas tend to frequent more
areas inhabited by humans in search of non-natural food sources, altering their foraging
patterns (Beckmann & Berger, 2003; Beckmann & Lackey, 2008). Food-conditioned
bears are more likely to inflict human injury because they are habituated to humans and
their attractants (Herrero, 1985; Herrero & Fleck, 1990). Understanding the cause of
human-bear conflicts on the Kenai is essential for mitigation of those conflicts.
Research I conducted on the Kenai Peninsula in 2011 regarding residents‟
attitudes, risk perceptions, and tolerance toward bears (Zulueta, 2012, unpublished) sheds
light on the types of conflicts people are experiencing with bears. I found that 44%

71
(n=191) of respondents experienced some type of conflict with brown and/or black bears
on their property. Types of conflicts included loss of crops, stored food, or beehives;
killed or injured pets or hunting dogs; killed or injured livestock or small animals; killed
or injured work/guard animals; structural damage (buildings, vehicles, etc.); threats to
themselves or a family member; and/or other. There was no significant difference in the
number of reported conflicts or bear species among respondents in high versus low DLP
communities. Those that experienced a conflict with bears categorized the loss/damage
as mostly structural damage (buildings, vehicles; Brown:14%, Black:10%), threat to
themselves or family members (Brown:12%, Black:9%), and “other” loss or damage
(Brown:12%, Black:10%). “Other” most often included objects on property that were
damaged such as barbeque grills/smokers, bird feeders, garbage cans, and rubber items,
which can also be described as attractants. There was no significant difference among
respondent type or bear species for conflicts.
Most respondents (91%, n=394) used some type of routine preventive measure to
protect themselves, family, pets, and/or property from bears. Most of the preventative
measures included firearms (63%), dog/s (41%), and other (36%), such as use of bells, air
horns, and word of mouth/warning neighbors.
While 56% (n=242) of respondents have never had a conflict with either a brown
or black bear on their property, 46% (n=112) of those respondents had attractants on their
property based on a sight survey. Attractants included garbage not in bear resistant
canisters, pet food, pets/animals on property, beehives, and other. Other possible
attractants such as dirty barbeque grills, unlocked freezers, natural vegetation, gardens,
and composts were not included due to difficulty in detection. In total, 51% (n=221) of

72
respondents surveyed had some form of attractant visible on their property. When
looking at respondents in low versus high DLP communities, 20% (n=99) more
respondents in high DLP communities had attractants on their property compared to
respondents in low DLP communities (59% vs. 39%, respectively). Since these
percentages only include listed attractants and those that were visible, this is most likely a
conservative estimate. Due to the fact that each house was only surveyed one day and
was therefore a snap shot in time, this information does not mean that attractants were out
on the property every day, all the time or that they were never there. Of the attractants
observed, 90% were pets/livestock (Figure 2). Only 18% (n=78) of total respondents had
some type of fencing on their property, and of those residents, 13% (n=11) had electric
fencing.
MANAGEMENT AGENCIES
When considering the management of brown bears on the Kenai, it is important to
note that the responsibility is shared among multiple agencies. Along with the State of
Alaska through ADF&G, there are three federal agencies who manage brown bears and
their habitat. This includes the United States Fish and Wildlife Service- Kenai National
Wildlife Refuge (KENWR), the United States Forest Service- Chugach National Forest
(CNF), and the United States National Park Service- Kenai Fjords National Park (KEFJ)
(Figure 3). Each agency has specific objectives regarding brown bear and habitat
management on their respective lands and ADF&G also focuses largely on the private
sector.
73
The Alaska National Interest Lands Conservation Act (ANILCA) passed in 1980
dictated purposes for each Federal Conservation Unit in Alaska. The purpose of the
KENWR regarding bear management is to conserve populations and habitats in their
natural diversity, including habitat restoration and population monitoring; and to continue
to support research plans identified and/or developed by the Interagency Brown Bear
Study Team (United States Fish and Wildlife Service, 2009). In addition, the KENWR
works with the CNF on management of the Kenai-Russian River Complex which
includes the confluence of the two rivers and a portion of the designated wilderness on
KENWR land (Suring & Barber, 2010). Human-bear interactions are high in this area
due to spawning salmon and lots of anglers during the summer months and involve a
great deal of human and bear management.
The Revised Land and Resource Management Plan for the CNF (2002) delineates
brown bear management into habitat and core areas. For brown bear habitat
management, important brown bear feeding areas are designated in which new road
construction and vegetation management not intended to maintain or improve ecological
conditions for brown bears are not allowed within 750 feet of those areas. There are also
guidelines to locate long-term human concentrated activities away from important
seasonal brown bear concentrations. The brown bear core areas identify selected
landscapes and their associated habitats for management to meet population objectives
for brown bears and to reduce dangerous encounters between humans and brown bears.
KEFJ has developed a comprehensive bear management plan that identifies
responsibilities in specific management areas and guidelines to manage various types of
interactions and conflicts with bears (Phillips, Thompson, Hilderbrand, & Adams, 2012).

74
The KEFJ also uses the Bear-Human Information Management System (BHIMS)
developed for all parks in Alaska to document bear-human interactions and conflict. This
system provides a systematic and comprehensive way to document conflicts and
summarizes events such as the number of bears killed as a result of conflicts with
humans, the number and type of attacks on people, and use of protective measures like
bear spray. The data from this system is then used to develop improved bear-safety
messages, as well as to refine management strategies for human-bear conflicts (Phillips et
al., 2012).
The ADF&G‟s mission became to (1) protect and forestall or mitigate serious
threats to populations before they become critical; (2) identify conservation concerns at
an earlier stage while avoiding the necessity for listing on the State Endangered Species
List or through the federal Endangered Species Act; and (3) provide for recovery efforts
to be initiated under a more flexible management system (Kenai Peninsula Brown Bear
Conservation Strategy, 2000). Federal aid is given to the Wildlife Restoration Program
and provides half of the state‟s wildlife management budget, including an annual budget
of about $700,000 for brown bear research and management. The ADF&G has minimal
authority to manage non-hunting activities that contribute to the rise of DLPs, as most
occur on private land or are managed by other agencies (Kenai Peninsula Brown Bear
Conservation Study, 2000). However, they can work to increase understanding and
awareness of brown bear conservation.
Since the responsibility of brown bear management is split among four agencies,
each with their own management plan, a variety of strategies are used on the Kenai
leading to inconsistent approaches with management, research and outreach for residents

75
and visitors regarding bears. As an example, the KEFJ promotes non-lethal techniques to
deal with nuisance bears and does not allow hunting (Phillips et al., 2012). The KENWR
on the other hand has a portion of the refuge that lies next to KEFJ land that allows
hunting and only recently adopted non-lethal techniques, yet lethal techniques are still
used under certain circumstances. In addition, the KENWR has a small portion of their
land where hunting is not allowed (Skilak Wildlife Recreation Area). While the focus for
management of brown bears among these agencies is typically on their respective lands,
due to the natural movement of bears and relative proximity of federal and state land on
the Kenai, management in one area can greatly affect that of the other, and therefore
collaborative efforts for brown bear management must exist. For the most part,
collaborative efforts are established through interagency teams and strategies.
INTERAGENCY CONSERVATION TEAMS AND OBJECTIVES
Interagency Brown Bear Study Team
In 1984 staff from the KENWR, CNF, KEFJ, and ADF&G created the
Interagency Brown Bear Study Team (IBBST). The goal of IBBST was to coordinate
research and provide information to managers to maintain a viable population of brown
bears on the Kenai. Viable population of bears is defined as “a population that persists
despite the effects of demographic, environmental and genetic stochasticity, plus human
induced mortality” (deBruyn, Harris, Morton, & Selinger, 2006). This means that the
population is self-sustaining over time while coexisting with humans. The IBBST is the
primary organization responsible for coordinating brown bear research on the Kenai and
sharing results with stakeholders that use scientific research when developing

76
conservation strategies. They separate themes of their “step-down” plan into three
sections: demographics, population, and habitat.
The IBBST places a heavy emphasis on confidently describing and modeling the
demographics of the Kenai brown bear population to achieve an accurate assessment of
the rate of population increase (deBruyn et al., 2006). The IBBST believes that
maintaining a viable population of Kenai bears requires understanding landscape use by
bears and humans and addressing interactions to promote coexistence.
There is no formal plan by the IBBST to evaluate coexistence between humans
and bears due to difficulty and expense (deBruyn et al., 2006). The IBBST emphasizes
the need for information on how human presence and activity influence bear behavior.
They list two reasons for this: (1) human numbers are increasing the potential for
negative effects on brown bears, and (2) more people in the wild raises the likelihood of
humans encountering brown bears, which may raise the potential for mauling incidents or
DLPs. Realizing the importance of human bear interaction research, the IBBST actively
solicits grants to support interested students and advise appropriate research.
Kenai Peninsula Brown Bear Conservation Strategy
The Kenai Peninsula Brown Bear Conservation Strategy (KPBBCS) was the first
collaborative project developing proactive management for Kenai brown bears among the
public, local, state, and federal governments. In June of 2000, the KPBBCS was
published by the stakeholder‟s group in hopes of creating a strategy that would also avoid
having to list the Kenai brown bear population under the Endangered Species Act (Kenai
Peninsula Brown Bear Conservation Strategy, 2000). The three phase strategy first
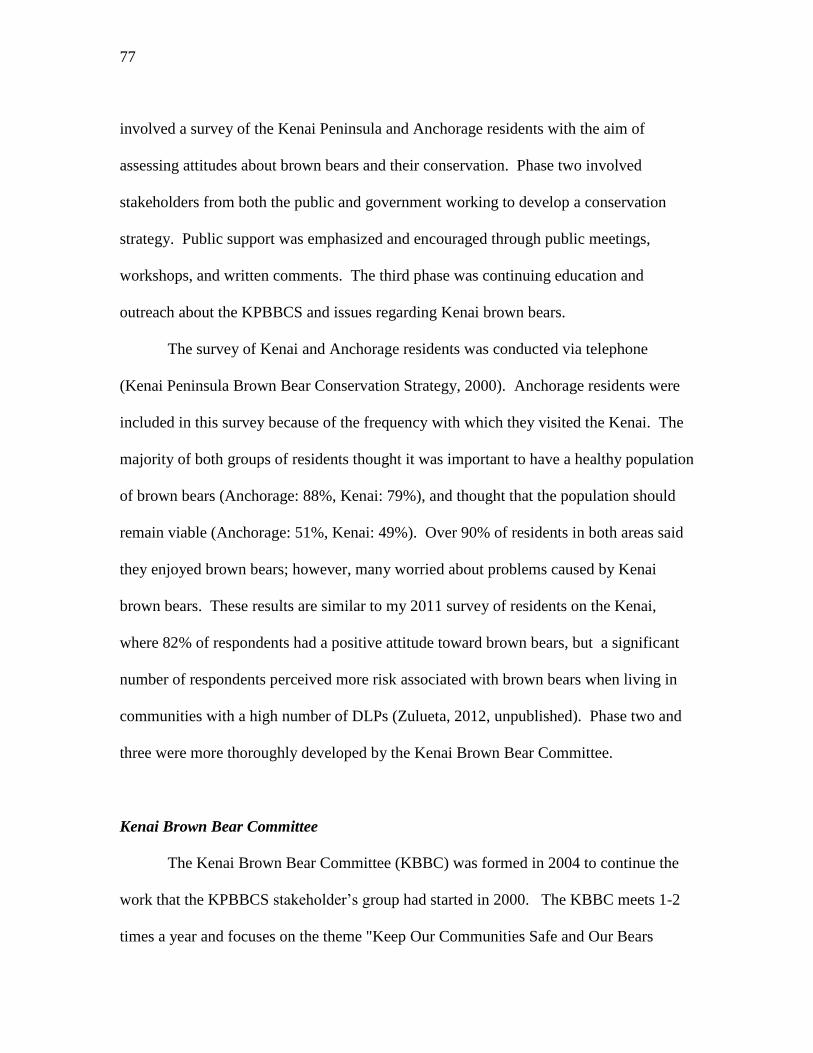
77
involved a survey of the Kenai Peninsula and Anchorage residents with the aim of
assessing attitudes about brown bears and their conservation. Phase two involved
stakeholders from both the public and government working to develop a conservation
strategy. Public support was emphasized and encouraged through public meetings,
workshops, and written comments. The third phase was continuing education and
outreach about the KPBBCS and issues regarding Kenai brown bears.
The survey of Kenai and Anchorage residents was conducted via telephone
(Kenai Peninsula Brown Bear Conservation Strategy, 2000). Anchorage residents were
included in this survey because of the frequency with which they visited the Kenai. The
majority of both groups of residents thought it was important to have a healthy population
of brown bears (Anchorage: 88%, Kenai: 79%), and thought that the population should
remain viable (Anchorage: 51%, Kenai: 49%). Over 90% of residents in both areas said
they enjoyed brown bears; however, many worried about problems caused by Kenai
brown bears. These results are similar to my 2011 survey of residents on the Kenai,
where 82% of respondents had a positive attitude toward brown bears, but a significant
number of respondents perceived more risk associated with brown bears when living in
communities with a high number of DLPs (Zulueta, 2012, unpublished). Phase two and
three were more thoroughly developed by the Kenai Brown Bear Committee.
Kenai Brown Bear Committee
The Kenai Brown Bear Committee (KBBC) was formed in 2004 to continue the
work that the KPBBCS stakeholder‟s group had started in 2000. The KBBC meets 1-2
times a year and focuses on the theme "Keep Our Communities Safe and Our Bears

78
Wild." The KBBC is made up of an extensive group of representatives from the ADF&G,
Alaska Department of Natural Resources, CNF, KENWR, KEFJ, Kenai Peninsula
Borough, Alaska Resource Management, Safari Club International, Alaska Audubon
Society, Defenders of Wildlife, Kenai Peninsula Tourism Marketing Council, Kenai
Convention and Visitors Bureau, Soldotna Visitors Center, The Wilderness Society, and
Alaska Center for the Environment (Alaska Department of Fish and Game, 2012). With
a focus on research, human-bear interactions, land planning, and public education, the
goal of the KBBC is to decrease the number of DLPs while increasing the understanding
and knowledge of conserving brown bears. The committee educates residents and
visitors about how to reduce conflicts and manage bear attractants properly through
public service announcements, printed materials, and a website.
CURRENT MANAGEMENT OF BROWN BEAR POPULATIONS
The ADF&G is charged with the task of maintaining “an estimated population of
250 brown bears with a sex and age structure that will sustain harvest, comprising at least
60 percent males” (Kenai Peninsula Brown Bear Conservation Strategy, 2000). The 250
bear estimate was proposed based on the extrapolation of data from studies completed in
other areas of Alaska and used for about the past 30 years of management on the Kenai
(DeBruyn et al., 2006). At the current population size, allowable human-caused
mortalities (including road kills, DLPs, illegal kills, and harvest numbers), equals
approximately 14 bears, with no more than six of those being female. The hunting
season will close if the number of brown bears killed either by hunting or DLPs equals
14, which is about 6% of the estimated population (Kenai Peninsula Brown Bear

79
Conservation Strategy, 2000). Looking at data on brown bear mortalities from 2000-
2011, only in 2000 did the total human-caused mortalities fall below the 6% threshold of
allowable human-caused mortalities (Figure 4). This pressure on brown bears from
human-caused mortalities leads to questions about the population‟s viability and whether
using the estimate made over 30 years ago is an accurate way to manage today‟s brown
bear population.
Due to the need for updating the population estimate of brown bears in a
rigorously scientific way, the IBBST met in 2009 to discuss proposals based on pilot
research in 2008; this was the last time the IBBST met (Morton, Personal
Communication, 2012). Despite disagreement about the proposed population estimate by
ADF&G with the three federal partners and prevention of sampling outside the Federal
lands for peninsula-wide data, the DNA-based, mark-recapture estimate of the Kenai
brown bear population was completed in 2010 (Morton, Bray, Hayward, White, &
Paetkau, 2012, unpublished). ADF&G has yet to formally recognize the findings of an
estimated 625 brown bears peninsula-wide. When compared to other coastal studies such
as Miller et al. (1997), which reported 191-551 bears per 1,000 km2
of available bear
habitat, the 45 bears per 1,000 km2 on the Kenai (Morton et al., 2012, unpublished) is
relatively low.
Compounding the issue of revising the brown bear estimate for the Kenai is the
issue of a declining moose population. Many people on the Kenai hunt moose which
they eat throughout the following year. Since the 1990s, community members and
hunters have been pressuring wildlife managers to do something about the declining
moose population and asking them if an increasing brown bear population is responsible

80
for the decline. It is understood by agencies that this decline is mostly due to loss of
quality moose habitat in Game Management Unit (GMU) 15A, correlating well with the
fire history in this region, and low bull to cow ratios in GMU 15C. The ADF&G has
developed intensive management plans in these two of the four game management units
on the Kenai focused on sustaining elevated moose population levels (Figure 5). As part
of the Alaska Board of Game (BOG) recommendations, the hunting season on brown
bears will be liberalized creating more pressure on brown bear populations. The ultimate
objective of this plan is to “maintain current moose densities by increasing human harvest
as predation declines” (Alaska Department of Fish and Game, 2012).
In early spring of 2012, about a year after this plan was developed, ADF&G
conducted a calf mortality study by collaring 54 calves in a GMU at the southern end of
the Kenai (Schwartz, 2012). Preliminary results revealed 45 of the 54 died, 19 of them
due to brown bear kills. Other research conducted in Alaska has found that brown bear
predation is a significant source of mortality for moose calves (Ballard, Spraker, &
Taylor, 1981). This information about brown bear predation on moose will not likely
change the intensive management plans for moose, focused on wolf control, and will
likely lead to BOG increasing brown bear mortality (McDonough, Personal
Communication, 2012). There is a plan to open registration of brown bear hunting
beginning April 1 and ending May 31, then restarting again September 1 to run until
November 1st. “The bag limit shall be one brown bear every regulatory year in 2
intensive management areas and one brown bear every four regulatory years in 2 non-
intensive management areas on the Kenai Peninsula” (Alaska Board of Game, 2012).

81
While this remains a proposal for brown bear management, the ADF&G continues to
liberalize the public harvest of brown bears as a way of managing moose populations.
Although ADF&G has not acknowledged the new population estimate of brown
bear on the Kenai, they have been liberalizing harvest of brown bear for many years. In
the spring of 2003, BOG advised ADF&G to increase the brown bear quota from 14 to
20, and increased the female quota from six to eight. Until 2007/08 there was one season
in the fall allowing a licensed bear hunter one bear every four years. Since then, there
has been a fall and spring harvest with the length of fall harvest increasing by 15 days in
2009/10. Also in the spring of 2009, non-residents were allowed to apply for permits, but
were required to use guides. As of January 2012, the BOG adopted a proposal to change
from a drawing system to a registration-based system for the harvest of brown bears.
They also enacted a three-year running average to manage the reproductive-age female
deaths to a total of 30. These actions, slowly liberalizing harvest of brown bear over the
years are resulting in greater pressure on the population.
STRATEGIES AND OUTREACH PROGRAMS ON THE KENAI
There has been much research on the effectiveness of modifying the behavior of
bears with the use of non-lethal methods. The KEFJ uses non-lethal methods to deal with
nuisance bears (Phillips, et al., 2012). In addition, ADF&G has been conducting research
with TASER International, Inc., to determine whether these Electronic Control Devices
can be an effective and safe tool as a non-lethal method to deal with nuisance bears
(Lewis & Mooney, 2012). However, a study in the Lake Tahoe Basin found that the most
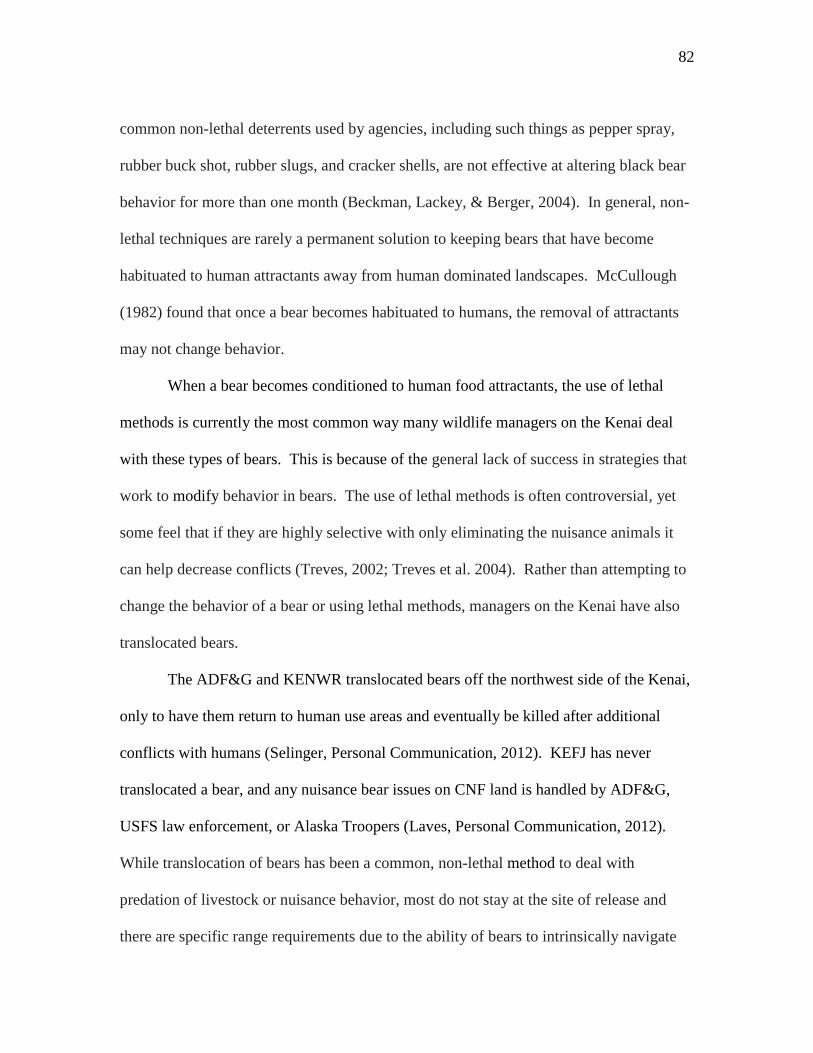
82
common non-lethal deterrents used by agencies, including such things as pepper spray,
rubber buck shot, rubber slugs, and cracker shells, are not effective at altering black bear
behavior for more than one month (Beckman, Lackey, & Berger, 2004). In general, non-
lethal techniques are rarely a permanent solution to keeping bears that have become
habituated to human attractants away from human dominated landscapes. McCullough
(1982) found that once a bear becomes habituated to humans, the removal of attractants
may not change behavior.
When a bear becomes conditioned to human food attractants, the use of lethal
methods is currently the most common way many wildlife managers on the Kenai deal
with these types of bears. This is because of the general lack of success in strategies that
work to modify behavior in bears. The use of lethal methods is often controversial, yet
some feel that if they are highly selective with only eliminating the nuisance animals it
can help decrease conflicts (Treves, 2002; Treves et al. 2004). Rather than attempting to
change the behavior of a bear or using lethal methods, managers on the Kenai have also
translocated bears.
The ADF&G and KENWR translocated bears off the northwest side of the Kenai,
only to have them return to human use areas and eventually be killed after additional
conflicts with humans (Selinger, Personal Communication, 2012). KEFJ has never
translocated a bear, and any nuisance bear issues on CNF land is handled by ADF&G,
USFS law enforcement, or Alaska Troopers (Laves, Personal Communication, 2012).
While translocation of bears has been a common, non-lethal method to deal with
predation of livestock or nuisance behavior, most do not stay at the site of release and
there are specific range requirements due to the ability of bears to intrinsically navigate

83
and travel over long distances (Linnell, Odden, & Smith, 1997). According to
information compiled from a review of literature by Linnell et al. (1997), areas <300km2
are too small for brown bears to ensure that after translocation they do not come back to
the same area and translocation is therefore not cost-effective on the Kenai due to its
small size. Managers on the Kenai have therefore have started to emphasize the use of
proactive methods in reducing human-bear conflict by first working with people before a
bear becomes conditioned to attractants.
Modifying people‟s behaviors can be one way to successfully reduce human-bear
conflicts. The theory of reasoned action (TRA) states that humans will process
information and use it to decide how to act (Ajzen & Fishbein, 1980; Fishbein &
Manfredo, 1992). With this understanding, the attitude toward the behavior as well as the
subjective norms- an individual's perceptions of the social pressures placed on them by
others to either perform or not perform a certain behavior- affects the individual‟s
intention to perform the behavior and it is the intention that is a direct indicator of
whether the behavior will be performed (Fishbein & Manfredo, 1992). Understanding
these factors can lead to effective modification of people‟s behaviors when it comes to
strategies aimed at reducing conflicts between humans and bears.
Currently, throughout Alaska, there is an ordinance in effect to encourage
behaviors that decrease the likelihood of bears becoming conditioned to human garbage.
Negligently feeding wildlife results in a fine of $310; the intentional feeding of wildlife
results in a misdemeanor, a standard fine of $1000, and a mandatory court appearance
(Alaska Administrative Code 5 AAC 92.0). While this ordinance is state-wide,
enforcement is lacking peninsula-wide. Programs specifically aimed at controlling

84
garbage, including banning the feeding of bears and negligence with garbage, as well as
ordinances requiring the use of bear-proof garbage containers, have been effective in
many areas, including Juneau, Alaska (McCarthy & Seavoy, 1994; Peine, 2001). If
enforcement were strengthened on the Kenai, it‟s possible that conflicts would diminish,
as they did in Juneau (Selinger, Personal Communication, 2012).
Current strategies to modify people‟s behaviors also emphasize education (Peine,
2001; Lackey & Ham, 2003; Gore, 2004). Educational programs and campaigns have
successfully led to a reduction of conflicts, primarily through the reduction of human
attractants, in several areas with black bears including New York, central Florida,
northern New Jersey, Lake Tahoe area of Nevada and California, as well as areas with
both brown and black bears, including Montana and British Columbia (Gore, Knuth,
Curtis, & Shanahan, 2006). Successful programs work to create social pressure within
communities to sustain changes to human behaviors (Ajzen & Fishbein, 1980; Gore,
2004). ADF&G and other agencies on the Kenai provide informational mailers, host
booths at high profile venues, give school programs, and broadcast relevant public
service announcements on television and radio commercials to educate residents.
ADF&G has also declared April to be Alaska Bear Awareness Month. April was chosen
because it is typically the month when bears first come out of hibernation for the active
bear season (April 15 to October 31). Programs and informational services start the first
week of April to remind people to become more vigilant about avoiding attractants for
bears by keeping trash in bear resistant containers, taking down birdfeeders, and using
electric fencing around livestock, among other recommendations.

85
While there have been many different educational programs over the years aimed
at reducing human-bear conflict on the Kenai, I will focus on the current program offered
by the KENWR, created with the help of ADF&G, the Safari Club, and the KBBC since
it is the program promoted by all agencies on the Kenai. The program for school children
starts in April and focus on bears in the community. A classroom visit includes inducting
children into the Alaska Junior Ranger Program where they receive a badge and recite a
pledge. They are then asked to take a look at their yard at home and assess it for bear
attractants. If they have any, they are asked to come up with changes or solutions.
ADF&G will give similar programs upon request for bears, but typically the Alaska
Junior Wildlife Ranger Program is promoted on the Kenai. This program has also been
shared with KEFJ to serve the Seward area of the Kenai, and Lake Clark National Park
which gives programs based out of Homer on the southern end of the Kenai. Home
school programs have also been presented by agencies. While educational programs are
established to change people‟s behaviors, few are typically given a formal evaluation to
determine the effectiveness of the information provided to the public (Lackey & Ham,
2003; Beckmann et al., 2004; Gore, 2004; Gore et al., 2006). In the past ADF&G also
held programs for adults, but found turnout to be poor so the programs were retired.
ADF&G has found public service announcements to be a more cost effective way for
reaching adult residents (Selinger, Personal Communication, 2012). Bear safety training
is another program ADF&G, as well as private individuals, present to interested parties.
As an example, oil companies on the Kenai have annual bear safety training for their
workers in which ADF&G employees train the workers on safety precautions and how to
handle interactions with bears (Selinger, Personal Communication, 2012).

86
ADF&G‟s main office on the Kenai (Soldotna) also maintains a wealth of
information available to residents and visitors regarding their management strategies and
how to reduce conflict with bears (Appendix C). Information available includes:
o Bear facts including natural history information.
o Bear behavior information and quiz sheet.
o How to handle interactions with bears and safety precautions to avoid
conflict.
o How to store garbage to prevent bears from becoming habituated.
o Information on predator management of bears and why it is sometimes
implemented in the state of Alaska.
o Tips for women traveling in bear country.
o A checklist which includes information for people living in cities like
Anchorage that also have bears. Cartoons and rhymes for children about
bear awareness.
o Bumper stickers regarding a “fed bear is a dead bear”.
ADF&G not only provides information on bears and bear awareness at their office
in Soldotna, they also maintain a website that includes safety principles around bears and
how to avoid conflict with bears. Information on the website was primarily adapted from
“Living in Harmony with Bears.” The information provided is largely designed to help
people co-exist with brown and black bears. Along with similar information at the office,
the website includes:
o More detailed information on proper handling of garbage to keep bears
away; focusing on the idea that keeping human food away from bears is

87
the most important thing humans can do to prevent conflicts and
confrontation between bears and people. This includes solutions at-home
and while camping. Home solutions range from reminders about bird seed
and gardens as attractants to the use of different types of bear resistant
garbage canisters as well as how to obtain them. In addition, there is
information on the use of garbage incinerators and extensive information
on erecting an electric fence, material requirements, maintenance, and
vendors. Information on camping with bears includes proper food storage,
camp set up, and cooking procedures to minimize odors.
o Safety information for outdoor recreation, including hunting, fishing, and
specifics for children. This information comes in the form of videos on
loan to the public in larger cities on the Kenai Peninsula, bear sighting
posters, and bear behavior information and use of bear spray/firearms.
There is also a list of procedures to follow if you have a negative
encounter with a bear and kill it in defense of life or property.
While education efforts to address human-bear conflicts have been a significant
focus of conflict mitigation strategies on the Kenai, two programs have been developed
which provide financial aid to residents who seek to proactively reduce attractants.
Wildlife Conservation Community Program
In an effort to address the high number of calls to the City of Kenai police
department and other agencies regarding human-bear interactions, the City of Kenai
initiated a Bear-Safe Neighborhood pilot project in 2007. The ADF&G, Alaska

88
Audubon, Waste Management, Inc. and the City of Kenai, focused efforts on reducing
bear problems due to improper waste storage and other human-caused attractants in two
subdivisions within the city. This collaborative effort was awarded a grant to determine
whether communities with a high number of bear conflicts would benefit from a program
which gave residents bear proof garbage containers to use as well as a free pick up
service for two years. Police would also increase the amount of patrolling in the target
neighborhood. In the past, this area had many problems with bears, but during the two
years of the pilot project no negative interactions were reported. After the program, 3 out
of the 30 households involved continued to use the free canisters and paid for pick up.
Conflicts increased again but not to the extent as before the program. As a result of the
pilot program‟s success, ADF&G asked the City of Kenai to expand the efforts municipal
wide creating the Wildlife Conservation Community Program (WCCP), with funding
from the U.S. Fish and Wildlife Service Private Landowners Stewardship Grant. The
WCCP offers residents of the City of Kenai bear resistant containers at a cost of $50
instead of $200. These containers were also purchased for use in city parks. Since then,
other programs on the Kenai were initiated in Cooper Landing, Homer, Hope, Moose
Pass, and Seward.
In 2008, the City of Kenai adopted a Bear Problem Area and Emergency Bear
Declaration ordinance. This requires that residents keep garbage in bear resistant
containers in areas of town considered bear problem areas. In the fall of 2010, an
increase in incidences with bears was reported and the first Emergency Declaration of a
Bear Problem Area occurred in the City of Kenai.

89
The WCCP is now a community-based cooperative effort involving municipal,
state and federal agencies, businesses, non-profits, and residents of Kenai. One main
objective of the WCCP is to reduce the number of brown and black bears becoming
conditioned to human generated attractants in residential areas, thereby reducing the
number of DLP killings. Other benefits include safer neighborhoods, less agency time
spent dealing with bears, a reduction in animal deaths caused by ingestion of non-
digestible materials and a reduction in human-wildlife conflicts with other species such as
moose. There has been an interest in extending the program throughout the Kenai
Peninsula Borough, yet as of 2012, the program has not been initiated due to lack of
funding from grants.
In addition to individual residences obtaining bear resistant containers, the Kenai
Peninsula Borough modified all transfer sites and implemented bear resistant dumpsters
which were completed peninsula wide 2010-2011. The clean-up project at transfer sites
has led to fewer bear conflicts for these locations and people are learning how to properly
store and dump their garbage (Selinger, Personal Communication, 2012).
Wildlife Habitat Incentive Program
The Natural Resources Conservation Service (NRCS) created the Wildlife Habitat
Incentive Program (WHIP), which is a cost share program that helps to improve a wide
variety of wildlife habitat conditions and reduce negative impacts to wildlife species on
private land. During the 2011 fiscal year the NRCS developed a new program available
to landowners only on the Kenai Peninsula. Typically, the NRCS develops programs that
work with property owners on ways to allow wildlife movement on private property and

90
do not normally develop programs aimed at keeping wildlife out of private property.
However, due to the high number of DLP bear kills on the Kenai and the listing of brown
bears as a species of special concern by ADF&G, the program was implemented to help
decrease the amount of human-bear conflicts.
WHIP works to reduce potential human-bear interactions at sites of human-
provided bear attractants such as chicken coops and bee hives by providing matching
funds to landowners to install permanent electric bear fencing. Electric fencing has been
proven to exclude bears from areas of potential food sources and was determined the
most effective method for decreasing human-bear conflicts due to agricultural attractants
in a Massachusetts study (Jonker, Parkhurst, Field, & Fuller, 1998). Once shocked, bears
tend to avoid those fence lines, and when properly designed, the mere sight of the fence
often aids in reminding bears of the shock they may receive.
The NRCS and ADF&G also provide fence designs, site management plans, and
recommendations for the installation of fences. This site inventory and assessment is part
of the technical assistance landowners receive in addition to or aside from cost-share
assistance.
Since the start of the program in 2010, five parties have applied for funding, and
six new applications have been submitted. In order to qualify for funding, all who apply
must have some type of attractant such as livestock, fowl, or beehives. As of May 2011,
no one who applied has been declined. However, only one fence has been installed to
date.

91
FUTURE RESEARCH AND RECOMMENDATIONS
The successful conservation of bears on the Kenai will depend on the cooperation
of residents and visitors to coexist with bears. While residents are responsible for the
majority of DLPs, these DLPs occur on private and public lands with similar frequency.
By specifically addressing residents and visitors as well as management needs on private
and public land, the Kenai could be more successful in reducing the number of human
bear conflicts that result in DLPs.
Due to the high number of calls regarding wildlife complaints, and limited staff in
the ADF&G office in Soldotna, I would suggest that the ADF&G implement a program
similar to Florida‟s “Bear Response Agents.” The Florida program provides a handful of
individuals‟ extensive training regarding how to handle nuisance complaints. They are
then charged with the task of responding to complaints and speaking with landowners to
educate them about how to mitigate the problem (Gore, 2004). Bear Response Agents
could work with residents to survey property thoroughly for attractants and help them
figure out ways to reduce or eliminate attractants. This type of program would give
wildlife managers an opportunity to address the concerns of residents and help them
minimize the potential for human-bear conflicts while also strengthening communication
between residents and wildlife managers.
In my 2011 survey of residents on the Kenai, risk perception toward brown bears
was significantly higher in high DLP communities compared to low DLP communities.
To address this, wildlife managers should focus on communities with programs that
provide residents with the tools for how to handle an interaction. Research has shown
that learning about your own reaction when encountering a bear has reduced fear of those

92
interactions (Johansson & Karlsson, 2011). I would suggest offering the public the same
bear safety awareness classes that federal and state employees receive each year.
Providing this option to residents may help to reduce risk perception by increasing self-
confidence in their ability to handle an interaction successfully. In addition, offering
these classes to visitors could also help with human-bear conflicts that occur on public
property such as those in the backcountry.
Stronger promotion of non-lethal deterrents such as bear spray for residents and
visitors would be a very effective way to reduce human-bear conflicts. While the federal
agencies require their employees to carry bear spray in addition to firearms, there seems
to be little promotion of bear spray for the public. Research by Smith et al. (2008) and
Smith, Herrero, Layton, Larsen, & Johnson (2012) found that bear spray was often more
effective than lethal methods, especially for people not competent with the use of
firearms. In addition, the use of electric fencing can be an effective way to reduce
conflicts if more residents and visitors were aware of their effectiveness. As of 2011, less
than 3% of Kenai residents surveyed had electric fences on their property (Zulueta, 2012,
unpublished). In addition, although the WHIP program was established in 2010 to aid
residents in the purchase and set up of electric fencing, as of the summer of 2011 only
one party had completed all the paperwork necessary and set up a fence with these funds
(NRCS, Personal Communication, 2011). Promotion of electric fences on public land
could also be useful for hunters and campers on the Kenai as research in Banff National
Park found a decrease in human-bear conflicts after implementation of electric fencing
(Madel, 2012).

93
Education regarding the natural history of bears could be very useful for both
residents and visitors on the Kenai, as there is much controversy over bear numbers. In
the past, Miller and Ballard (1992) found that in many areas of Alaska there was great
support for proposals to reduce bear numbers mainly because residents were fearful of
bears and felt the populations were too high for optimal moose populations. In my 2011
survey of residents on the Kenai, some respondents mentioned that they felt the brown
bear population was too high and directly responsible for sub-optimal moose populations.
Education about the fluctuation of moose populations due to habitat factors and the fire
cycle could be useful in demonstrating other factors than bears that decrease moose
populations so as to not unnecessarily target brown bears as the primary cause of low
moose populations.
Evaluation of existing and new educational programs is critical and woefully
lacking. The use of performance indicators could help determine changes in behavior
and perceptions (Gore et al., 2006). Without such ways to evaluate the effectiveness of
programs, time, effort, and money could be lost.
Wildlife managers could also address human-bear conflicts on public land in a
temporal and spatial manner. Understanding the need to control human access has been
recognized in Banff (Gibeau, Hererro, McLellan, & Woods, 2001), Denali (Schirokauer
& Boyd, 1998), and Yellowstone National Parks (Gunther, 1994; 1998) and has been key
for bear management success. For example, areas of high human use due to a common
resource such as the Kenai and Russian River confluence during the salmon run could be
managed by limiting the hours the river is open to the public. If use of the area was only
allowed during the daytime, bears would be free to use it at night without humans.

94
Research has found that bears will recognize the pattern of human use to either
completely avoid humans and/or areas where humans frequent (Nevin & Gilbert, 2005).
Limiting the areas people are allowed to recreate could help avoid conflicts with bears.
The KENWR promotes limiting access as a way to decrease conflicts most years by
temporarily closing off sections of the refuge that start to have high levels of bear
activity, especially of sows and cubs.
The Kenai also lacks a peninsula-wide systematic collection of human-bear
conflicts data. As it stands, ADF&G holds all DLP reports and shares only certain
information with its federal partners. The KEFJ is the only state or federal agency to
have a comprehensive database on the Kenai, but is available to a limited number of
wildlife managers. The BHIMS was established to standardize the collection of bear data
across all national parklands in the Alaska Region. Data include bear-human conflicts,
bear observations, bear harvests, and bear natural history data. In addition, other forms
and images can be attached to each incident report to provide other information not
already stored in the system. The system automatically creates a Case Incident Record
from the data entered and a dynamic link to ArcView will display a visual map of the
incidents. From ArcView or Access one can also query incidents. While the individuals
responsible for creating this database work for the U.S. Fish and Wildlife Service, they
have yet to distribute the program to U.S. Fish and Wildlife Service users. If this program
were connected to all wildlife managers on the Kenai, it would be an effective way to
facilitate data sharing and strategize human-bear conflict mitigation.
In addition to collecting data on human-bear conflicts, it‟s important to consider
environmental factors that may contribute to fluctuations of conflict each year. Without

95
annual monitoring, it is difficult to determine the extent of environmental factors that
may be contributing to the increase or decrease of human-bear conflicts. ADF&G
already collects information each year about the salmon run. Other natural vegetation
data is collected by various agencies and with more collaboration, better analysis of
available bear habitat could be determined each year.
While it appears that human-bear conflict mitigation strategies on the Kenai
Peninsula have been a continual focus for wildlife management agencies, there needs to
be more comprehensive evaluations of efforts made. By doing so managers can better
direct their education and outreach strategies using their time and funds more efficiently.
Changing human behavior takes strong, consistent efforts as people are habitual
creatures. Creating fool proof measures to ensure compliance will aid in this process.

96
LITERATURE CITED
Alaska Board of Game (2012). 2012/2013 Proposal Book. Juneau, AK.
Alaska Department of Fish and Game (2012). Retrieved from www.adfg.alaska.gov
Alaska Department of Fish and Game (2012). Draft operational plan for intensive
management of moose in game management unit 15A during regulatory years
2012-2017. Juneau, AK.
Ajzen, I., & Fishbein, M. (1980). Understanding attitudes and predicting social behavior.
(1 ed.). Englewood Cliffs, NJ: Prentice-Hall.
Ballard, W. B., Spraker, T. H., Taylor, K. P. (1981). Causes of neonatal moose calf
mortality in South Central Alaska. The Journal of Wildlife Management, 45(2),
335-342.
Beckmann, J. P., & Berger, J. (2003). Rapid ecological and behavioural changes in
carnivores: The responses of black bears (Ursus americanus) to altered food.
Journal of the Zoological Society of London, 261, 207–212.
Beckmann, J. P., Lackey, C. W., & Berger, J. (2004). Evaluation of deterrent techniques
and dogs to alter behavior of “nuisance” black bears. Wildlife Society Bulletin,
32(4), 1141-1146.
Beckmann, J. P. & Lackey, C. W. (2008). Carnivores, urban landscapes, and longitudinal
studies: a case history of black bears. Human Wildlife Conflict, 2, 168–174.
Brady, J. R., & Maehr, D. S. (1982). A new method for dealing with apiary-raiding black
bears. Proceedings of the Annual Conference of Southeastern Association of Fish
and Wildlife Agencies, 36, 571-577.
Clark, J. E., van Manen, F. T., & Pelton, M. R. (2002). Correlates of success for on-site
releases of nuisance black bears in Great Smoky Mountains National Park. Wildlife
Society Bulletin, 30(1), 104-111.
DeBruyn, T. D., Harris, G., Morton, J. M., & Selinger, J., (2006). White Paper. Research
Directions for the Interagency Brown Bear Study Team. Anchorage, AK.
Fishbein, M., & Manfredo, M. J. (1992). A theory of behavior change. In Influencing
human behavior : Theory and applications in recreation, tourism, and natural
resource management. Champaign, IL: Sagamore.

97
Gibeau, M. L., Herrero, S., McLellan, B. N., & Woods, J. G. (2001). Managing for
grizzly bear security areas in Banff National Park and the Central Canadian Rocky
Mountains. Ursus, 12, 121-129.
Gore, M. L. (2004). Comparison of intervention programs designed to reduce human-
bear conflict: A review of literature. Human Dimensions Research Unit Publication
Series. Series 04-4. Cornell University, Ithaca, NY: New York State College of
Agriculture and Life Sciences.
Gore, M. L., Knuth, B. A., Curtis, P. D., & Shanahan, J. E. (2006). Education programs
for reducing American black bear–human conflict: Indicators of success? Ursus,
17, 75–80.
Gunther, K. A. (1994). Bear management in Yellowstone National Park, 1960-93.
International conference on bear research and management.
Gunther, K. A. (1998). Bear management area program, Yellowstone National Park.
Information paper No. BMO-5. Yellowstone National Park: Bear Management
Office
Herrero, S. (1985). Bear attacks: their causes and avoidance. New York, NY: Lyons and
Burford.
Herrero, S., & Fleck, S. (1990). Injury to people inflicted by black, grizzly or polar bears:
Recent trends and new insights. Bears: Their Biology and Management. A
Selection of Papers from the Eighth International Conference on Bear Research
and Management, Victoria, British Columbia, Canada.
Hristienko, H., & McDonald, J. E. Jr. (2007). Going into the 21st century: a perspective
on trends and controversies in the management of the American black bear. Ursus,
18(1), 72-88.
Johansson, M., & Karlsson, J. (2011). Subjective Experience of Fear and the Cognitive
Interpretation of Large Carnivores. Human Dimensions of Wildlife, 16(1), 15-29.
Jonker, S. A., Parkhurst, J. A., Field, R., & Fuller, T. K. (1998). Black bear depredation
on agricultural commodities in Massachusetts. Wildlife Society Bulletin, 26, 318–
324.
Kenai Peninsula Borough (2012). Retrieved from www.borough.kenai.ak.us
Kenai Peninsula Brown Bear Stakeholders Group (2000). Kenai Peninsula Brown Bear
Conservation Strategy. Juneau, AK: Alaska Department of Fish and Game.

98
Lackey, B. K., & Ham, S. H. (2003). Contextual analysis of interpretation focused on
human black bear conflicts in Yosemite National Park. Applied Environmental
Education and Communication, 2, 11-21.
Lewis, L., & Mooney, P. (2012). Taser electronic control devices for wildlife
management; history, case series and research. 4th
International Human-Bear
Conflict Workshop Summary. Missoula, MT.
Linnell, J. D. C., Odden, J., Smith, M. E., (1997). Translocation of carnivores as a
method for managing problem animals: a review. Biodiversity and Conservation, 6,
1245-1257.
Madel, M. (2012). Demonstration: Electric fencing to prevent conflicts. 4th
International
Human-Bear Conflict Workshop Summary. Missoula, MT.
McCarthy, M. T., & Seavoy, R. J. (1994). Reducing non-sport losses attributable to food
conditioning: Human and bear behavior modification in an urban environment.
Ninth International Conference on Bear Research and Management.
McCullough, D. A. (1982). Behavior, bears, and humans. Wildlife Society Bulletin, 10,
27–33.
Miller, S. D., & Ballard, W. B. (1992). Analysis of an effort to increase moose calf
survivorship by increased hunting of brown bears in South Central Alaska. Wildlife
Society Bulletin, 20, 445–454.
Miller, S. D., White, G. C., Sellers, R. A., Reynolds, H. V., Schoen, J. W., Titus, K.,
Barnes, V. G. Jr., Smith, R. B., Nelson, R. R., Ballard, W. B., & Schwartz, C. C.
(1997). Brown and black bear density estimation in Alaska using radio-telemetry
and replicated mark resight techniques. Wildlife Monographs, 133, 55.
Morton, J. M., Bray, M., Hayward, G., White, G., & Paetkau, D. (2012). The Kenai
brown bear population on the Kenai National Wildlife Refuge and Chugach
National Forest. Anchorage, AK: United States Fish and Wildlife Service.
Nevin, O. T., & Gilbert, B. K. (2005). Perceived risk, displacement and refuging in
brown bears: positive impacts of ecotourism? Biological Conservation, 121, 611-
622.
Nielsen, S. E., Herrero, S., Boyce, M. S., Mace, R. D., Benn, B., Gibeau, M. L., &
Jevons, S. (2004). Modeling the spatial distribution of human-caused grizzly bear
mortalities in the Central Rockies ecosystem of Canada. Biological Conservation,
120(1), 101-113.

99
Nielsen, S. E., Stenhouse, G. B., & Boyce, M. S. (2006). A habitat-based framework for
grizzly bear conservation in Alberta. Biological Conservation, 130(2), 217-229.
Peine, J. D. (2001). Nuisance bears in communities: Strategies to reduce conflict. Human
Dimensions of Wildlife, 6, 223–237.
Phillips, L., Thompson, M., Hilderbrand, G., & Adams, L., (2012). Kenai Fjords
National Park 2012 Interim Bear Management Plan. Seward, AK: National Park
Service, U.S. Department of the Interior.
Schirokauer, D. W., & Boyd, H. M. (1998). Bear-human conflict management in Denali
National Park and Preserve, 1982-94. Ursus, 10, 395-403.
Schwartz, D. (2012, October). Study: Moose calf survival low. Peninsula Clairon.
Retrieved from www.peninsulaclarion.com
Smith, T. S., Herrero, S., DeBruyn, T. D., & Wilder, J. M. (2008). Efficacy of bear
deterrent spray in Alaska. The Journal of Wildlife Management, 72(3), 640-645.
Smith, T. S., Herrero, S., Layton, Larsen, Johnson (2012). Efficacy of firearms for bear
deterrence in Alaska. The Journal of Wildlife Management, 76(5), 1021-1027.
Stowell, L. R., & Willging, R. C. (1992). Bear damage to agriculture in Wisconsin.
Proceedings of the 5th
Eastern Wildlife Damage Control Conference.
Suring, L. H., & Barber, K. R. (2010). Management of Brown Bears and Human Use at
the Russian River, Kenai Peninsula, Alaska, USA. Northern Ecologic L.L.C.
Technical Bulletin, 2010–2015.
Treves, A. (2002). Wolf justice: managing human-carnivore conflict in the 21st century.
Wolf Print, 13, 6-9.
Treves, A., Woodroffe, R., Thirgood, S. (2004). Evaluation of lethal control for the
reduction of human-wildlife conflict. People and wildlife: conflict or coexistence?
Cambridge, United Kingdom: Cambridge University Press.
United States Department of Agriculture, Forest Service (2002). Revised Land and
Resource Management Plan for the Chugach National Forest. Juneau, AK.
United States Fish and Wildlife Service, Kenai National Wildlife Refuge (2009). Final
Revised Comprehensive Conservation Plan and Environmental Impact Statement.
Anchorage, AK.

100
Wakkinen, W. L., & Kasworm, W. F. (2004). Demographics and population trends of
grizzly bears in the Cabinet–Yaak and Selkirk Ecosystems of British Columbia,
Idaho, Montana, and Washington. Ursus, 15, 65-75.
Zulueta, R. S. (2012). Residential perceptions of brown and black bears and human-bear
conflict mitigation on the Kenai Peninsula of Alaska. M.S. Thesis. University of
Wisconsin, Madison.
101
FIGURES- Chapter Two
Figure 1. Percentage and location of defense of life or property bear kills (DLP) on the Kenai
Peninsula of Alaska from 1960-2008.
Figure 2. Attractants on surveyed properties of the Kenai Peninsula, Alaska, 2011. Categories were
not mutually exclusive and more than one type of attractant may be found on each property.
106
49
109
0
20
40
60
80
100
120
Private State and Local
Government
Federal
Location of DLPs
Nu
mb
er o
f D
LP
s
49
2
51
13
0
20
40
60
80
100
None Garbage Human/Pet
Food
Pets/Livestock Beehives
Type of Attractant
Per
cen
tag
e

102
Figure 3. Map of State and Federal lands on the Kenai Peninsula of Alaska, 2012.

103
Figure 4. Total brown bear mortalities from 2000-2011 on the Kenai Peninsula due to harvest, non-
hunt kills (ex. road kill, illegal kills), and defense of life or property kills (DLP).

104
Figure 5. Intensive management area for moose in Game Management Unit (GMU) 15A and 15C on
the Kenai Peninsula of Alaska, 2012. Kenai National Wildlife Refuge boundaries are in yellow.

105
Appendix A- The Survey Instrument (questionnaire)

106

107

108

109

110

111

112

113
Appendix B- Assessing non-response bias (postcards)
FRONT
Sorry we missed you at home. Please help us provide an accurate response for our
survey of opinions on bears for the Kenai Peninsula. Just answer this anonymous survey
and place the postage paid card in the mail. Thank you for your help!
1. Have you hunted in the past two years? ……....Yes ………..….No
2. Please rate your overall experience with bears:
Somewhat Somewhat
Positive Positive Neutral Negative Negative
Brown bear…...… ……….…. …………. .…………. …………..
Black bear………. ……….…. …………. ………….. …………..
3. Has a bear been killed in a non-hunting related incident on your property?
Brown bear………………Yes .....……….......No ……..……Not sure
Black bear………………..Yes ......……..……No .……..…...Not sure
BACK
Rebecca Zulueta
University of Wisconsin
Forest &Wildlife Ecology Dept.
1630 Linden Dr.
Russell Labs A141
Madison, WI 53706

114
Appendix C- Kenai Peninsula Bear Awareness Materials
Examples of educational material and program information offered to the public by
various agencies on the Kenai Peninsula, 2011.
a. Pamphlets regarding natural history of bears and predator management.
b. Pamphlets regarding bear awareness during recreational activities.
c. Informational booklet on coexistence with bears and fact sheet on bear behavior.

115
d. Pamphlets regarding the Wildlife Habitat Incentive Program by the NRCS for electric
fencing as bear deterrent.

116
Appendix D- The New Bear Awareness Pamphlet

117

118

119