Residential Mortgage Lending in 2016: Evidence … Vol.103,No.6 Residential Mortgage Lending in...
27
November 2017 Vol. 103, No. 6 Residential Mortgage Lending in 2016: Evidence from the Home Mortgage Disclosure Act Data Neil Bhutta, Steven Laufer, and Daniel R. Ringo, of the Division of Research and Statistics, prepared this article. Jimmy Kelliher provided research assistance. This article provides an overview of residential mortgage lending in 2016 and discusses a number of changes in mortgage market activity over time based on data reported under the Home Mortgage Disclosure Act of 1975 (HMDA). Mortgage debt is by far the largest component of household debt in the United States, and mortgage transactions can have important implications for households’ financial well-being. The HMDA data are the most comprehensive source of publicly available information on the U.S. mortgage market, providing unique details on how much mortgage credit gets extended each year, who obtains this credit, and which institutions provide this credit. HMDA requires most mortgage lending institutions with offices in metropolitan areas to disclose to the public detailed information about their home-lending activity each year. The HMDA data include the disposition of each application for mortgage credit; the type, purpose, and characteristics of each home mortgage that lenders originate or purchase during the calendar year; the census-tract designations of the properties related to those loans; loan pricing information; personal demographic and other information about loan applicants, including their race or ethnicity and income; and information about loan sales (see appendix A for a full list of items reported under HMDA). 1 HMDA was enacted to help members of the public determine whether financial institu- tions are serving the housing needs of their local communities and treating borrowers and loan applicants fairly, to provide information that could facilitate the efforts of public enti- ties to distribute funds to local communities for the purpose of attracting private invest- ment, and to help households decide where they may want to deposit their savings. 2 The data have proven to be valuable for research and are often used in public policy delibera- tions related to the mortgage market. 3 1 The 2016 HMDA data reflect property locations using the census-tract geographic boundaries created for the 2010 decennial census as well as recent updates to the list of metropolitan statistical areas (MSAs) published by the Office of Management and Budget. The first year for which the HMDA data use this most recent list of MSAs is 2014. For further information, see Federal Financial Institutions Examination Council (2013), “OMB Announcement—Revised Delineations of MSAs,” press release, February 28, www.ffiec.gov/hmda/OMB_MSA.htm. 2 A brief history of HMDA is available at Federal Financial Institutions Examination Council, “History of HMDA,” webpage, www.ffiec.gov/hmda/history2.htm. 3 On July 21, 2011, rulemaking responsibility for HMDA was transferred from the Federal Reserve Board to the newly established Consumer Financial Protection Bureau. The Federal Financial Institutions Examination Council (FFIEC; www.ffiec.gov) continues to be responsible for collecting the HMDA data from reporting institutions and facilitating public access to the information. In September of each year, the FFIEC releases to the public summary disclosure tables pertaining to lending activity from the previous calendar year for each reporting lender as well as aggregations of home-lending activity for each metropolitan statistical area and for the nation as a whole. The FFIEC also makes available to the public a data file containing virtually all of the reported information for each lending institution as well as a file that includes key demographic and housing-related data for each census tract drawn from census sources.
Transcript of Residential Mortgage Lending in 2016: Evidence … Vol.103,No.6 Residential Mortgage Lending in...

November 2017Vol. 103, No. 6
Residential Mortgage Lending in 2016: Evidencefrom the Home Mortgage Disclosure Act Data
Neil Bhutta, Steven Laufer, and Daniel R. Ringo, of the Division of Research and Statistics,
prepared this article. Jimmy Kelliher provided research assistance.
This article provides an overview of residential mortgage lending in 2016 and discusses a
number of changes in mortgage market activity over time based on data reported under the
Home Mortgage Disclosure Act of 1975 (HMDA). Mortgage debt is by far the largest
component of household debt in the United States, and mortgage transactions can have
important implications for households’ financial well-being. The HMDA data are the most
comprehensive source of publicly available information on the U.S. mortgage market,
providing unique details on how much mortgage credit gets extended each year, who
obtains this credit, and which institutions provide this credit.
HMDA requires most mortgage lending institutions with offices in metropolitan areas to
disclose to the public detailed information about their home-lending activity each year. The
HMDA data include the disposition of each application for mortgage credit; the type,
purpose, and characteristics of each home mortgage that lenders originate or purchase
during the calendar year; the census-tract designations of the properties related to those
loans; loan pricing information; personal demographic and other information about loan
applicants, including their race or ethnicity and income; and information about loan sales
(see appendix A for a full list of items reported under HMDA).1
HMDA was enacted to help members of the public determine whether financial institu-
tions are serving the housing needs of their local communities and treating borrowers and
loan applicants fairly, to provide information that could facilitate the efforts of public enti-
ties to distribute funds to local communities for the purpose of attracting private invest-
ment, and to help households decide where they may want to deposit their savings.2 The
data have proven to be valuable for research and are often used in public policy delibera-
tions related to the mortgage market.3
1 The 2016 HMDA data reflect property locations using the census-tract geographic boundaries created for the 2010decennial census as well as recent updates to the list of metropolitan statistical areas (MSAs) published by the Office ofManagement and Budget. The first year for which the HMDA data use this most recent list of MSAs is 2014. Forfurther information, see Federal Financial Institutions Examination Council (2013), “OMB Announcement—RevisedDelineations of MSAs,” press release, February 28, www.ffiec.gov/hmda/OMB_MSA.htm.
2 A brief history of HMDA is available at Federal Financial Institutions Examination Council, “History of HMDA,”webpage, www.ffiec.gov/hmda/history2.htm.
3 On July 21, 2011, rulemaking responsibility for HMDA was transferred from the Federal Reserve Board to the newlyestablished Consumer Financial Protection Bureau. The Federal Financial Institutions Examination Council (FFIEC;www.ffiec.gov) continues to be responsible for collecting the HMDA data from reporting institutions and facilitatingpublic access to the information. In September of each year, the FFIEC releases to the public summary disclosuretables pertaining to lending activity from the previous calendar year for each reporting lender as well as aggregationsof home-lending activity for each metropolitan statistical area and for the nation as a whole. The FFIEC also makesavailable to the public a data file containing virtually all of the reported information for each lending institution aswell as a file that includes key demographic and housing-related data for each census tract drawn from census sources.

Mortgage lending during 2016 occurred in the context of rising house prices, the continua-
tion of an upward trend in prices evident since 2012.4 Mortgage interest rates remained low
for most of the year, hovering just slightly above their historical lows reached in late 2012
and early 2013. Mortgage rates jumped sharply, however, following the November elec-
tions. Mortgage credit conditions continued to slowly ease, but credit remained more diffi-
cult to obtain for individuals with lower credit scores or hard-to-document incomes.
According to the Senior Loan Officer Opinion Survey on Bank Lending Practices, much of
the easing in mortgage underwriting that occurred over the course of 2016 was for loans
that were eligible for purchase by the government-sponsored enterprises (GSEs).5 Growth
in new housing construction remained sluggish despite the gains in house prices and
strengthening demand for both new and existing homes.6
This article presents findings from the HMDA data describing mortgage market activity
and lending patterns over time, including the incidence of higher-priced lending and rates
of denial on mortgage applications, across different demographic groups and lender types.7
Some of the key findings are as follows:
1. The number of mortgage originations in 2016 rose 13 percent, to 8.4 million from
7.4 million in 2015. For loans secured by one- to four-family properties, growth was
strong in both home-purchase originations—which increased to 4.0 million from
3.7 million in 2015—and refinance originations—which increased to 3.8 million from
3.2 million in 2015.
2. Black and Hispanic white borrowers increased their share of home-purchase loans for
one- to four-family, owner-occupied, site-built properties in 2016, the third consecutive
annual rise for both groups. The HMDA data indicate that 6.0 percent of such loans
went to black borrowers, up from 5.5 percent in 2015, while 8.8 percent went to
Hispanic white borrowers, up from 8.3 percent in 2015. The share of home-purchase
loans to low- or moderate-income (LMI) borrowers decreased to 26 percent in 2016
from 28 percent in 2015.
3. The average value of home-purchase loans rose 3.2 percent in 2016, to $257,000, with
similar increases for loans made to borrowers of different racial and ethnic groups. The
average value of home-purchase loans to Hispanic white borrowers remained well
below the 2006 peak, while the averages for Asian, black, and non-Hispanic white
borrowers were all above their 2006–07 peaks.
4. Black and Hispanic white borrowers continued to be much more likely to use
nonconventional loans (that is, loans with mortgage insurance from the Federal
Housing Administration (FHA) or guarantees from the Department of Veterans
Affairs (VA), the Farm Service Agency (FSA), or the Rural Housing Service (RHS))
than conventional loans compared with other racial and ethnic groups. In 2016, among
home-purchase borrowers, 69 percent of blacks and 60 percent of Hispanic whites
took out a nonconventional loan, whereas about 35 percent of non-Hispanic whites
and just 16 percent of Asians did so.
4 For additional analysis of how rapid house price growth in some parts of the country could be deterring lower-income families’ homebuying, see Neil Bhutta, Steven Laufer, and Daniel Ringo (2017), “Are Rising HomeValues Restraining Homebuying for Lower-Income Families?” FEDS Notes (Washington: Board of Governorsof the Federal Reserve System, September 28), https://www.federalreserve.gov/econres/notes/feds-notes/are-rising-home-values-restraining-home-buying-for-lower-income-families-20170928.htm.
5 The survey is available on the Board’s website at www.federalreserve.gov/boarddocs/snloansurvey.6 For more information on credit and economic conditions during 2016, see Board of Governors of the Federal
Reserve System (2017),Monetary Policy Report (Washington: Board of Governors, February 14),www.federalreserve.gov/monetarypolicy/mpr_default.htm.
7 Some lenders file amended HMDA reports, which are not reflected in the initial public data release. The dataused to prepare this article are drawn from the initial public releases for 2016 and 2015 and from amendedHMDA data for previous years. Consequently, numbers in this article for the years 2014 and earlier may differsomewhat from numbers calculated from the public release files.
2 Federal Reserve Bulletin | November 2017

5. The share of mortgages origi-
nated by nondepository, inde-
pendent mortgage companies
has increased sharply in recent
years. In 2016, this group of
lenders accounted for
53 percent of first-lien owner-
occupant home-purchase
loans, up from 50 percent in
2015.8 Independent mortgage
companies also originated
52 percent of first-lien owner-
occupant refinance loans, an
increase from 48 percent in
2015. For the first time since at
least 1995, nondepository,
independent mortgage compa-
nies accounted for a majority
of each of these types of loans.
Mortgage Applications andOriginations
In 2016, 6,762 financial
institutions—banks, savings asso-
ciations, credit unions, and
nondepository mortgage lenders—
reported data under HMDA on the
nearly 14 million home mortgage
applications they received
(including about 2.4 million appli-
cations that were closed by the
lender for incompleteness or were
withdrawn by the applicant before a decision was made), which resulted in about
8.4 million originations. The number of originations in 2016 was up from 7.4 million origi-
nations in 2015 (table 1).
Refinance mortgages for one- to four-family properties increased by 530,000, or 16 percent,
from 2015 to 2016. One- to four-family home-purchase originations grew by 384,000, or
10 percent, from 2015. Most one- to four-family home-purchase loans are first liens for
owner-occupied properties. In the past five years, the number of such loans grew over
70 percent, from less than 2.1 million in 2011 to 3.5 million in 2016. However, the number
of such home-purchase originations remained well below its peak in 2005 and was near
levels observed in the mid-1990s (figure 1).9 The number of first-lien home-purchase loans
8 For additional analysis comparing patterns of lending to LMI borrowers by nonbanks and banks, see NeilBhutta, Steven Laufer, and Daniel Ringo (2017), “The Decline in Lending to Lower-Income Borrowers by theBiggest Banks,” FEDS Notes (Washington: Board of Governors of the Federal Reserve System,September 28), https://www.federalreserve.gov/econres/notes/feds-notes/the-decline-in-lending-to-lower-income-borrowers-by-the-biggest-banks-20170928.htm.
9 The HMDA data prior to 2004 did not provide lien status for loans, and thus the number of loans prior to 2004includes both first- and junior-lien loans. That said, including junior-lien home-purchase loans in 2016 does notchange the conclusion that home-purchase lending in 2016 was similar to that in the mid-1990s, particularly1994.
Figure 1. Number of home-purchase and refinancemortgage originations reported under the Home MortgageDisclosure Act, 1994–2016
0
3
6
9
12
15
B. Re�nanceMillions of loans
1994 19981996 2000 20042002 2006 20102008 2012 2014 2016
1994 19981996 2000 20042002 2006 20102008 2012 2014 2016
1
2
3
4
5
6
A. Home purchaseMillions of loans
Note: The data are annual. Mortgage originations for one- to four-family owner-occupied properties, with junior-lien loans excluded in 2004 and later.
Residential Mortgage Lending in 2016 3
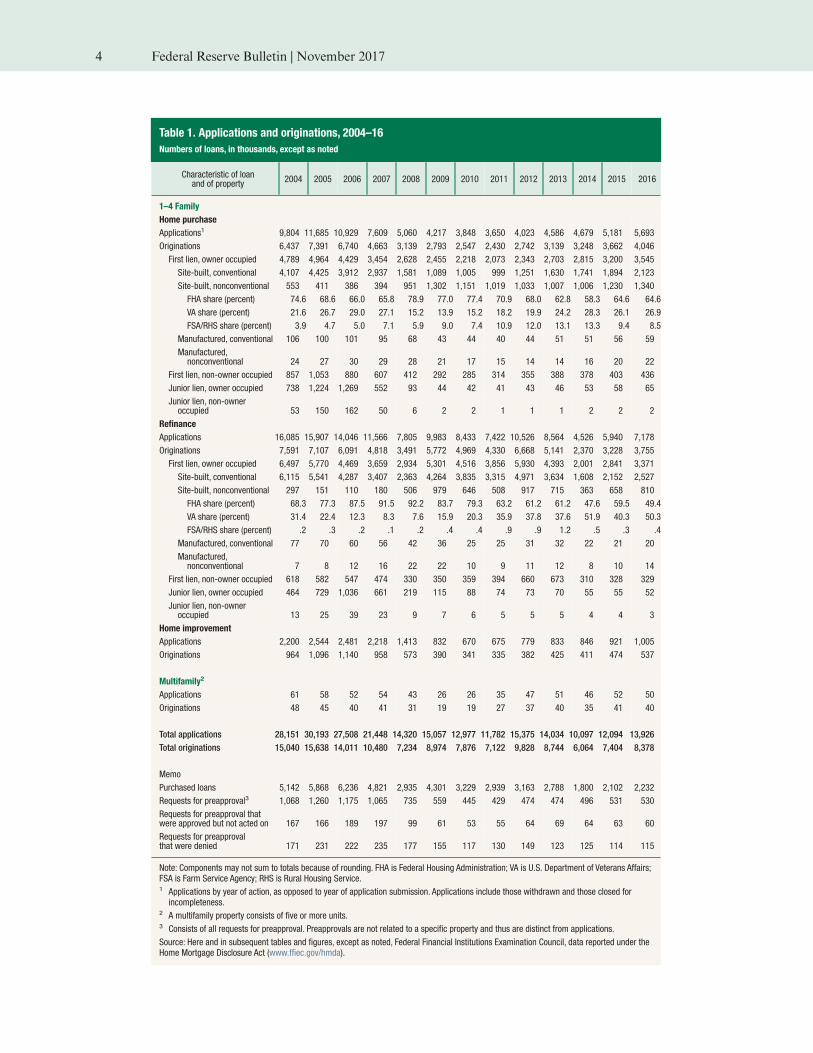
Table 1. Applications and originations, 2004–16
Numbers of loans, in thousands, except as noted
Characteristic of loanand of property
2004 2005 2006 2007 2008 2009 2010 2011 2012 2013 2014 2015 2016
1–4 Family
Home purchase
Applications1 9,804 11,685 10,929 7,609 5,060 4,217 3,848 3,650 4,023 4,586 4,679 5,181 5,693
Originations 6,437 7,391 6,740 4,663 3,139 2,793 2,547 2,430 2,742 3,139 3,248 3,662 4,046
First lien, owner occupied 4,789 4,964 4,429 3,454 2,628 2,455 2,218 2,073 2,343 2,703 2,815 3,200 3,545
Site-built, conventional 4,107 4,425 3,912 2,937 1,581 1,089 1,005 999 1,251 1,630 1,741 1,894 2,123
Site-built, nonconventional 553 411 386 394 951 1,302 1,151 1,019 1,033 1,007 1,006 1,230 1,340
FHA share (percent) 74.6 68.6 66.0 65.8 78.9 77.0 77.4 70.9 68.0 62.8 58.3 64.6 64.6
VA share (percent) 21.6 26.7 29.0 27.1 15.2 13.9 15.2 18.2 19.9 24.2 28.3 26.1 26.9
FSA/RHS share (percent) 3.9 4.7 5.0 7.1 5.9 9.0 7.4 10.9 12.0 13.1 13.3 9.4 8.5
Manufactured, conventional 106 100 101 95 68 43 44 40 44 51 51 56 59
Manufactured,nonconventional 24 27 30 29 28 21 17 15 14 14 16 20 22
First lien, non-owner occupied 857 1,053 880 607 412 292 285 314 355 388 378 403 436
Junior lien, owner occupied 738 1,224 1,269 552 93 44 42 41 43 46 53 58 65
Junior lien, non-owneroccupied 53 150 162 50 6 2 2 1 1 1 2 2 2
Refinance
Applications 16,085 15,907 14,046 11,566 7,805 9,983 8,433 7,422 10,526 8,564 4,526 5,940 7,178
Originations 7,591 7,107 6,091 4,818 3,491 5,772 4,969 4,330 6,668 5,141 2,370 3,228 3,755
First lien, owner occupied 6,497 5,770 4,469 3,659 2,934 5,301 4,516 3,856 5,930 4,393 2,001 2,841 3,371
Site-built, conventional 6,115 5,541 4,287 3,407 2,363 4,264 3,835 3,315 4,971 3,634 1,608 2,152 2,527
Site-built, nonconventional 297 151 110 180 506 979 646 508 917 715 363 658 810
FHA share (percent) 68.3 77.3 87.5 91.5 92.2 83.7 79.3 63.2 61.2 61.2 47.6 59.5 49.4
VA share (percent) 31.4 22.4 12.3 8.3 7.6 15.9 20.3 35.9 37.8 37.6 51.9 40.3 50.3
FSA/RHS share (percent) .2 .3 .2 .1 .2 .4 .4 .9 .9 1.2 .5 .3 .4
Manufactured, conventional 77 70 60 56 42 36 25 25 31 32 22 21 20
Manufactured,nonconventional 7 8 12 16 22 22 10 9 11 12 8 10 14
First lien, non-owner occupied 618 582 547 474 330 350 359 394 660 673 310 328 329
Junior lien, owner occupied 464 729 1,036 661 219 115 88 74 73 70 55 55 52
Junior lien, non-owneroccupied 13 25 39 23 9 7 6 5 5 5 4 4 3
Home improvement
Applications 2,200 2,544 2,481 2,218 1,413 832 670 675 779 833 846 921 1,005
Originations 964 1,096 1,140 958 573 390 341 335 382 425 411 474 537
Multifamily2
Applications 61 58 52 54 43 26 26 35 47 51 46 52 50
Originations 48 45 40 41 31 19 19 27 37 40 35 41 40
Total applications 28,151 30,193 27,508 21,448 14,320 15,057 12,977 11,782 15,375 14,034 10,097 12,094 13,926
Total originations 15,040 15,638 14,011 10,480 7,234 8,974 7,876 7,122 9,828 8,744 6,064 7,404 8,378
Memo
Purchased loans 5,142 5,868 6,236 4,821 2,935 4,301 3,229 2,939 3,163 2,788 1,800 2,102 2,232
Requests for preapproval3 1,068 1,260 1,175 1,065 735 559 445 429 474 474 496 531 530
Requests for preapproval thatwere approved but not acted on 167 166 189 197 99 61 53 55 64 69 64 63 60
Requests for preapprovalthat were denied 171 231 222 235 177 155 117 130 149 123 125 114 115
Note: Components may not sum to totals because of rounding. FHA is Federal Housing Administration; VA is U.S. Department of Veterans Affairs;FSA is Farm Service Agency; RHS is Rural Housing Service.1 Applications by year of action, as opposed to year of application submission. Applications include those withdrawn and those closed forincompleteness.
2 A multifamily property consists of five or more units.3 Consists of all requests for preapproval. Preapprovals are not related to a specific property and thus are distinct from applications.
Source: Here and in subsequent tables and figures, except as noted, Federal Financial Institutions Examination Council, data reported under theHome Mortgage Disclosure Act (www.ffiec.gov/hmda).
4 Federal Reserve Bulletin | November 2017

for non-owner-occupied
properties—which are primarily
used as rental properties and
second homes—increased
8 percent, from 403,000 in 2015 to
436,000 in 2016.
In table 1, the volume of first-lien
lending for owner-occupied proper-
ties is further disaggregated by loan
and property type. (Versions of
table 1 containing loan counts and
dollar values by month are available
in the Excel file posted online with
this article.)10 In addition to lien
and occupancy status, the HMDA
data provide details on the type of
property securing the loan (site-
built or manufactured home) and
on the type of loan (conventional
or not).11 As noted earlier,
nonconventional lending involves
loans with mortgage insurance or
other guarantees from federal government agencies, including the FHA, the VA, the RHS,
and the FSA. Conventional lending encompasses all other loans, including those sold to the
GSEs Fannie Mae and Freddie Mac as well as those held in banks’ portfolios.
Nonconventional loans usually involve high loan-to-value (LTV) ratios—that is, the
borrowers provide relatively small down payments. For site-built properties,
nonconventional home-purchase loans increased about 9 percent in 2016, while conven-
tional loans rose about 12 percent. The nonconventional share of first-lien home-purchase
loans for one- to four-family, owner-occupied, site-built properties stood at about
39 percent in 2016, little changed from 2015 and down from a peak of 54 percent in 2009
(figure 2).12
Figure 2 shows that the marked decline in the nonconventional share since 2009 reflects a
decrease in the FHA share of loans, while the VA and FSA/RHS shares have been steadier.
One factor that appears to help explain the fluctuations in the FHA share concerns
changes in the up-front and annual mortgage insurance premiums (MIPs) that the FHA
charges borrowers. For example, between October 2010 and April 2013, the annual MIP for
10 In addition to the monthly data at the national level posted online, a data set providing the count of home-purchase and refinance applications and originations, and the dollar volume of home-purchase and refinanceoriginations, by month and county since 1994 for the 500 largest counties each year is provided online as well.Both files are available on the Board’s website at https://www.federalreserve.gov/publications/bulletin.htm.
11 Manufactured-home lending differs from lending on site-built homes, in part because most of the homes aresold without land and are treated as chattel-secured lending, which typically carries higher interest rates andshorter terms to maturity than those on loans to purchase site-built homes (for pricing information on manu-factured home loans, see table 8). This article focuses almost entirely on site-built mortgage originations, whichconstitute the vast majority of originations (as shown in table 1). That said, it is important to keep in mindthat, because manufactured homes typically are less expensive than site-built homes, they provide a low-costhousing option for households with more moderate incomes.
12 For a more detailed discussion of the post-crisis rise in nonconventional lending, see Robert B. Avery, NeilBhutta, Kenneth P. Brevoort, and Glenn B. Canner (2010), “The 2009 HMDA Data: The Mortgage Market ina Time of Low Interest Rates and Economic Distress,” Federal Reserve Bulletin, vol. 96 (December),pp. A39–A77, https://www.federalreserve.gov/pubs/bulletin/2010/articles/2009HMDA/default.htm.
Figure 2. Nonconventional share of home-purchasemortgage originations, 1994–2016
100
90
80
70
60
50
40
30
20
10
0
Percent
FSA/RHS
VA
FHA
Conventional
1994 19981996 2000 20042002 2006 20102008 2012 2014 2016
Note: The data are annual. Home-purchase mortgage originations for one- tofour-family owner-occupied properties, with junior-lien loans excluded in 2004and later. Nonconventional loans are those insured by the Federal HousingAdministration (FHA) or backed by guarantees from the U.S. Department ofVeterans Affairs (VA), the Farm Service Agency (FSA), or the Rural HousingService (RHS).
Residential Mortgage Lending in 2016 5
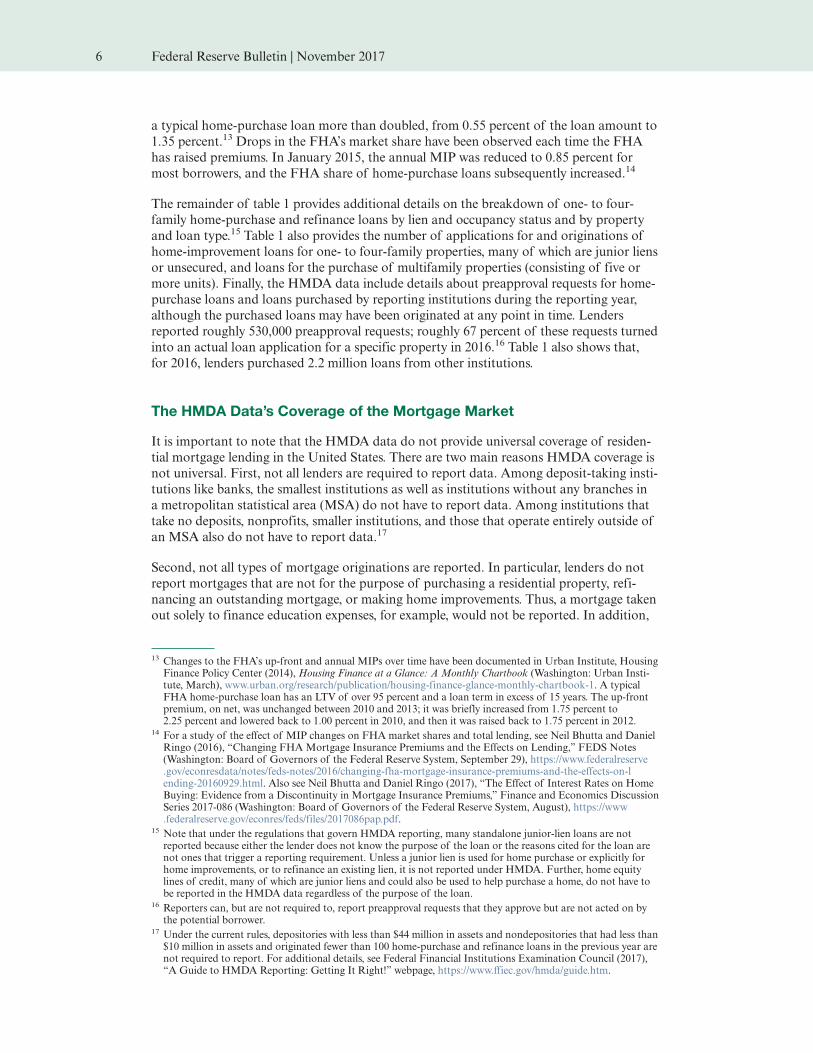
a typical home-purchase loan more than doubled, from 0.55 percent of the loan amount to
1.35 percent.13 Drops in the FHA’s market share have been observed each time the FHA
has raised premiums. In January 2015, the annual MIP was reduced to 0.85 percent for
most borrowers, and the FHA share of home-purchase loans subsequently increased.14
The remainder of table 1 provides additional details on the breakdown of one- to four-
family home-purchase and refinance loans by lien and occupancy status and by property
and loan type.15 Table 1 also provides the number of applications for and originations of
home-improvement loans for one- to four-family properties, many of which are junior liens
or unsecured, and loans for the purchase of multifamily properties (consisting of five or
more units). Finally, the HMDA data include details about preapproval requests for home-
purchase loans and loans purchased by reporting institutions during the reporting year,
although the purchased loans may have been originated at any point in time. Lenders
reported roughly 530,000 preapproval requests; roughly 67 percent of these requests turned
into an actual loan application for a specific property in 2016.16 Table 1 also shows that,
for 2016, lenders purchased 2.2 million loans from other institutions.
The HMDA Data’s Coverage of the Mortgage Market
It is important to note that the HMDA data do not provide universal coverage of residen-
tial mortgage lending in the United States. There are two main reasons HMDA coverage is
not universal. First, not all lenders are required to report data. Among deposit-taking insti-
tutions like banks, the smallest institutions as well as institutions without any branches in
a metropolitan statistical area (MSA) do not have to report data. Among institutions that
take no deposits, nonprofits, smaller institutions, and those that operate entirely outside of
an MSA also do not have to report data.17
Second, not all types of mortgage originations are reported. In particular, lenders do not
report mortgages that are not for the purpose of purchasing a residential property, refi-
nancing an outstanding mortgage, or making home improvements. Thus, a mortgage taken
out solely to finance education expenses, for example, would not be reported. In addition,
13 Changes to the FHA’s up-front and annual MIPs over time have been documented in Urban Institute, HousingFinance Policy Center (2014),Housing Finance at a Glance: A Monthly Chartbook (Washington: Urban Insti-tute, March), www.urban.org/research/publication/housing-finance-glance-monthly-chartbook-1. A typicalFHA home-purchase loan has an LTV of over 95 percent and a loan term in excess of 15 years. The up-frontpremium, on net, was unchanged between 2010 and 2013; it was briefly increased from 1.75 percent to2.25 percent and lowered back to 1.00 percent in 2010, and then it was raised back to 1.75 percent in 2012.
14 For a study of the effect of MIP changes on FHA market shares and total lending, see Neil Bhutta and DanielRingo (2016), “Changing FHAMortgage Insurance Premiums and the Effects on Lending,” FEDS Notes(Washington: Board of Governors of the Federal Reserve System, September 29), https://www.federalreserve.gov/econresdata/notes/feds-notes/2016/changing-fha-mortgage-insurance-premiums-and-the-effects-on-lending-20160929.html. Also see Neil Bhutta and Daniel Ringo (2017), “The Effect of Interest Rates on HomeBuying: Evidence from a Discontinuity in Mortgage Insurance Premiums,” Finance and Economics DiscussionSeries 2017-086 (Washington: Board of Governors of the Federal Reserve System, August), https://www.federalreserve.gov/econres/feds/files/2017086pap.pdf.
15 Note that under the regulations that govern HMDA reporting, many standalone junior-lien loans are notreported because either the lender does not know the purpose of the loan or the reasons cited for the loan arenot ones that trigger a reporting requirement. Unless a junior lien is used for home purchase or explicitly forhome improvements, or to refinance an existing lien, it is not reported under HMDA. Further, home equitylines of credit, many of which are junior liens and could also be used to help purchase a home, do not have tobe reported in the HMDA data regardless of the purpose of the loan.
16 Reporters can, but are not required to, report preapproval requests that they approve but are not acted on bythe potential borrower.
17 Under the current rules, depositories with less than $44 million in assets and nondepositories that had less than$10 million in assets and originated fewer than 100 home-purchase and refinance loans in the previous year arenot required to report. For additional details, see Federal Financial Institutions Examination Council (2017),“A Guide to HMDA Reporting: Getting It Right!” webpage, https://www.ffiec.gov/hmda/guide.htm.
6 Federal Reserve Bulletin | November 2017

home equity lines of credit (HELOCs), regardless of their purpose, are not required to be
reported under current rules.18
One way to assess the coverage of the HMDA data is to compare the number of loans
reported under HMDA with the number of loans reported in consumer credit files. In
contrast to the HMDA data, all mortgage loans regardless of purpose can be reported in
consumer credit files, and all financial institutions have an incentive to report their mort-
gage loans to consumer credit bureaus, since reporting encourages borrowers to make
on-time payments.19 According to estimates based on the consumer credit records main-
tained by Equifax, one of the three nationwide consumer credit-reporting agencies, about
8.4 million first-lien home-purchase and refinance loans were originated during 2016,
compared with nearly 7.7 million first-lien home-purchase and refinance loans for one- to
four-family properties reported under HMDA.20 Thus, the number of first-lien home-
purchase and refinance loans in the HMDA data is approximately 90 percent of the
number reported in consumer credit files.21
In addition, Equifax estimates that about 874,000 home equity loans and 1.4 million
HELOCs were originated in 2016. Many of these loans may not be reported under HMDA
for the reasons stated earlier. If they were reported under HMDA, they would be classified
as home-improvement loans or as junior-lien home-purchase or junior-lien refinance
loans. Lenders reported about 658,000 such loans in the 2016 HMDA data, less than
30 percent of the number of home equity loans and HELOCs reported by Equifax.
Mortgage Outcomes by Income and by Race and Ethnicity
A key attribute of the HMDA data is that they help policymakers and the broader public
better understand the distribution of mortgage credit across different demographic groups.
The next set of tables provides information on loan shares, product usage, denial rates and
reasons, and mortgage pricing for population groups defined by applicant income, neigh-
borhood income, and applicant race and ethnicity (tables 2–8). With the exception of
table 8, which includes loans for manufactured homes (and contains information by type of
loan rather than by applicant or neighborhood characteristic), these tables focus on first-
lien home-purchase and refinance loans for one- to four-family, owner-occupied, site-built
properties. Such loans accounted for about 81 percent of all HMDA originations in 2016.
18 Beginning on January 1, 2018, covered loans under the HMDA rule (Regulation C) generally will includeclosed-end mortgage loans and open-end lines of credit secured by a dwelling. For more information, seeConsumer Financial Protection Bureau (2017), “Home Mortgage Disclosure Act Rule Implementation:Resources to Help Industry Understand, Implement, and Comply with the Home Mortgage Disclosure Actand Regulation C,” webpage, https://www.consumerfinance.gov/policy-compliance/guidance/implementation-guidance/hmda-implementation.
19 In some cases, institutions may be required to report loans to the credit bureaus; for example, the GSEs requireservicers to report data on GSE loans to all of the major credit bureaus. In other cases, home-purchase andrefinance loans taken out by companies that are reported under HMDA may not be reported in consumercredit bureau data. For example, the HMDA data indicate that in 2016, about 97,000 first-lien home-purchaseand refinance mortgages for one- to four-family non-owner-occupied properties were issued to applicantswhose sex and race were reported as “not applicable,” which implies that the borrower was not a “naturalperson” (an individual, as opposed to a company, government agency, or nongovernmental organization) andthat the loan may not appear on any individual’s credit record.
20 See Equifax (2017),Quarterly U.S. Consumer Credit Trends (Atlanta: Equifax, July), https://investor.equifax.com/~/media/Files/E/Equifax-IR/reports-and-presentations/events-and-presentation/consumer-credit-trends-report-2q-2017.pdf.
21 The dollar volume of first-lien home-purchase and refinance loans for one- to four-family properties reportedunder HMDA is about 94 percent of the dollar volume of first-lien home-purchase and refinance originationsestimated by Equifax for 2016.
Residential Mortgage Lending in 2016 7
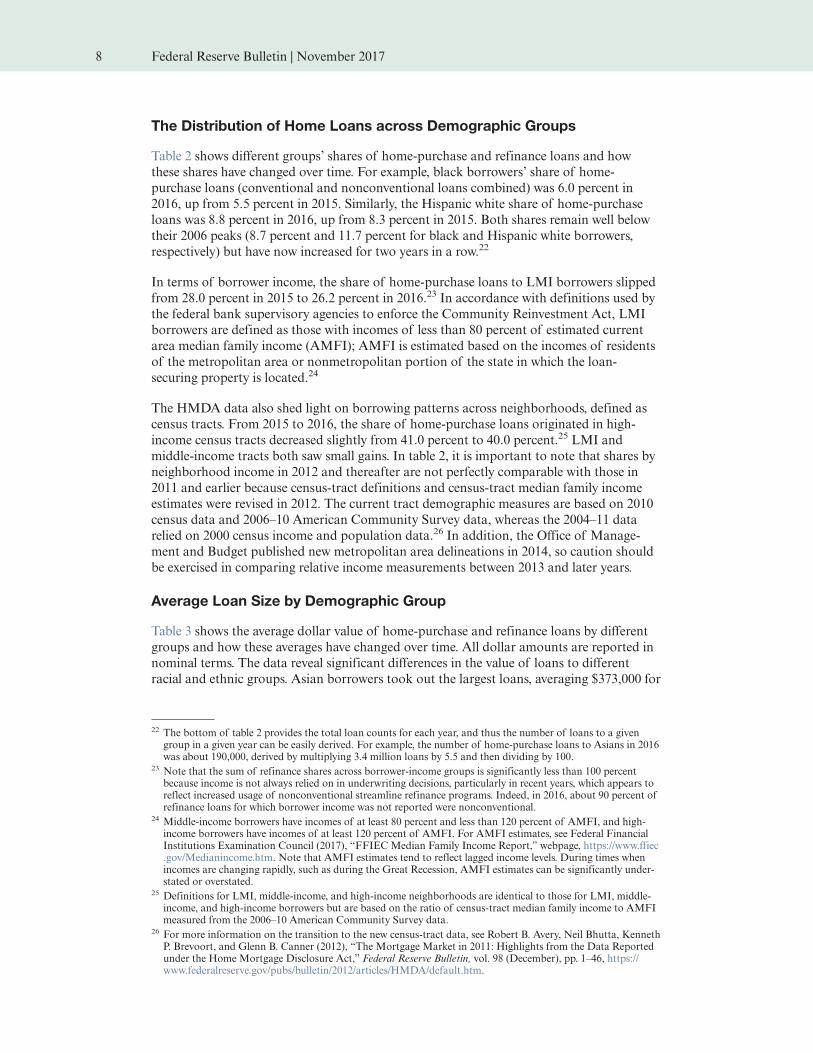
The Distribution of Home Loans across Demographic Groups
Table 2 shows different groups’ shares of home-purchase and refinance loans and how
these shares have changed over time. For example, black borrowers’ share of home-
purchase loans (conventional and nonconventional loans combined) was 6.0 percent in
2016, up from 5.5 percent in 2015. Similarly, the Hispanic white share of home-purchase
loans was 8.8 percent in 2016, up from 8.3 percent in 2015. Both shares remain well below
their 2006 peaks (8.7 percent and 11.7 percent for black and Hispanic white borrowers,
respectively) but have now increased for two years in a row.22
In terms of borrower income, the share of home-purchase loans to LMI borrowers slipped
from 28.0 percent in 2015 to 26.2 percent in 2016.23 In accordance with definitions used by
the federal bank supervisory agencies to enforce the Community Reinvestment Act, LMI
borrowers are defined as those with incomes of less than 80 percent of estimated current
area median family income (AMFI); AMFI is estimated based on the incomes of residents
of the metropolitan area or nonmetropolitan portion of the state in which the loan-
securing property is located.24
The HMDA data also shed light on borrowing patterns across neighborhoods, defined as
census tracts. From 2015 to 2016, the share of home-purchase loans originated in high-
income census tracts decreased slightly from 41.0 percent to 40.0 percent.25 LMI and
middle-income tracts both saw small gains. In table 2, it is important to note that shares by
neighborhood income in 2012 and thereafter are not perfectly comparable with those in
2011 and earlier because census-tract definitions and census-tract median family income
estimates were revised in 2012. The current tract demographic measures are based on 2010
census data and 2006–10 American Community Survey data, whereas the 2004–11 data
relied on 2000 census income and population data.26 In addition, the Office of Manage-
ment and Budget published new metropolitan area delineations in 2014, so caution should
be exercised in comparing relative income measurements between 2013 and later years.
Average Loan Size by Demographic Group
Table 3 shows the average dollar value of home-purchase and refinance loans by different
groups and how these averages have changed over time. All dollar amounts are reported in
nominal terms. The data reveal significant differences in the value of loans to different
racial and ethnic groups. Asian borrowers took out the largest loans, averaging $373,000 for
22 The bottom of table 2 provides the total loan counts for each year, and thus the number of loans to a givengroup in a given year can be easily derived. For example, the number of home-purchase loans to Asians in 2016was about 190,000, derived by multiplying 3.4 million loans by 5.5 and then dividing by 100.
23 Note that the sum of refinance shares across borrower-income groups is significantly less than 100 percentbecause income is not always relied on in underwriting decisions, particularly in recent years, which appears toreflect increased usage of nonconventional streamline refinance programs. Indeed, in 2016, about 90 percent ofrefinance loans for which borrower income was not reported were nonconventional.
24 Middle-income borrowers have incomes of at least 80 percent and less than 120 percent of AMFI, and high-income borrowers have incomes of at least 120 percent of AMFI. For AMFI estimates, see Federal FinancialInstitutions Examination Council (2017), “FFIECMedian Family Income Report,” webpage, https://www.ffiec.gov/Medianincome.htm. Note that AMFI estimates tend to reflect lagged income levels. During times whenincomes are changing rapidly, such as during the Great Recession, AMFI estimates can be significantly under-stated or overstated.
25 Definitions for LMI, middle-income, and high-income neighborhoods are identical to those for LMI, middle-income, and high-income borrowers but are based on the ratio of census-tract median family income to AMFImeasured from the 2006–10 American Community Survey data.
26 For more information on the transition to the new census-tract data, see Robert B. Avery, Neil Bhutta, KennethP. Brevoort, and Glenn B. Canner (2012), “The Mortgage Market in 2011: Highlights from the Data Reportedunder the Home Mortgage Disclosure Act,” Federal Reserve Bulletin, vol. 98 (December), pp. 1–46, https://www.federalreserve.gov/pubs/bulletin/2012/articles/HMDA/default.htm.
8 Federal Reserve Bulletin | November 2017

Table 2. Distribution of home loans, by purpose of loan, 2004–16
Percent except as noted
Characteristic of borrowerand of neighborhood
2004 2005 2006 2007 2008 2009 2010 2011 2012 2013 2014 2015 2016
A. Home purchase
Borrower race and ethnicity1
Asian 4.8 5.0 4.5 4.5 4.9 5.3 5.5 5.2 5.3 5.7 5.4 5.3 5.5
Black or African American 7.1 7.7 8.7 7.6 6.3 5.7 6.0 5.5 5.1 4.8 5.2 5.5 6.0
Hispanic white 7.6 10.5 11.7 9.0 7.9 8.0 8.1 8.3 7.7 7.3 7.9 8.3 8.8
Non-Hispanic white 57.1 61.7 61.2 65.4 67.5 67.9 67.6 68.7 70.0 70.2 69.1 68.1 66.4
Other minority2 1.4 1.3 1.1 1.0 .9 .9 .9 .8 .8 .7 .8 .8 .8
Joint 2.3 2.3 2.3 2.5 2.8 2.8 2.7 2.8 2.9 3.1 3.4 3.5 3.6
Missing 19.8 11.5 10.5 10.1 9.6 9.3 9.1 8.6 8.2 8.2 8.3 8.5 8.9
All 100 100 100 100 100 100 100 100 100 100 100 100 100
Borrower income3
Low or moderate 27.7 24.6 23.6 24.7 28.1 36.7 35.5 34.4 33.3 28.5 27.0 28.0 26.2
Middle 26.9 25.7 24.7 25.2 27.1 26.7 25.6 25.2 25.2 25.2 25.6 26.1 26.4
High 41.4 45.5 46.7 47.0 43.1 34.7 37.4 38.8 40.0 44.7 46.1 44.8 46.4
Income not used or notapplicable 4.0 4.2 5.0 3.1 1.7 1.9 1.5 1.6 1.5 1.6 1.2 1.2 1.0
All 100 100 100 100 100 100 100 100 100 100 100 100 100
Neighborhood income4
Low or moderate 14.5 15.1 15.7 14.4 13.1 12.6 12.1 11.0 12.8 12.7 13.3 13.5 14.1
Middle 48.7 49.2 49.5 49.6 49.8 50.2 49.4 49.4 43.6 43.7 44.7 45.2 45.8
High 35.8 34.7 33.7 35.1 35.9 35.8 37.7 39.1 43.2 43.2 41.8 41.0 40.0
All 100 100 100 100 100 100 100 100 100 100 100 100 100
B. Refinance
Borrower race and ethnicity1
Asian 3.5 2.9 3.0 3.1 3.1 4.1 5.2 5.4 5.5 4.7 4.3 5.0 5.5
Black or African American 7.4 8.3 9.6 8.4 6.0 3.5 2.9 3.1 3.3 4.4 5.4 5.0 5.0
Hispanic white 6.2 8.6 10.1 8.7 5.3 3.2 3.0 3.3 3.9 5.0 6.2 6.3 6.2
Non-Hispanic white 57.2 60.9 59.6 62.7 70.7 74.6 74.3 73.5 72.5 70.5 67.8 67.2 65.2
Other minority2 1.4 1.4 1.3 1.1 .8 .6 .5 .6 .6 .7 .9 .8 .9
Joint 2.1 2.1 1.9 2.0 2.2 2.6 2.7 2.8 3.1 3.1 3.2 3.3 3.4
Missing 22.1 15.7 14.6 14.1 11.9 11.4 11.4 11.3 11.1 11.6 12.2 12.4 13.8
All 100 100 100 100 100 100 100 100 100 100 100 100 100
Borrower income3
Low or moderate 26.2 25.5 24.7 23.3 23.5 19.6 19.0 19.2 19.6 21.1 22.1 19.0 16.9
Middle 26.3 26.8 26.1 25.6 25.5 22.5 22.5 21.3 21.8 21.7 21.9 21.0 20.3
High 38.8 40.8 43.7 46.1 44.8 45.8 49.6 48.1 47.7 46.3 44.9 45.1 47.5
Income not used or notapplicable 8.7 6.9 5.5 5.0 6.2 12.1 8.9 11.4 10.9 10.9 11.1 14.9 15.3
All 100 100 100 100 100 100 100 100 100 100 100 100 100
Neighborhood income4
Low or moderate 15.3 16.5 17.9 16.1 11.9 7.7 7.2 7.4 10.1 12.1 13.3 12.3 12.0
Middle 50.0 51.3 52.0 52.2 51.9 47.5 46.1 46.1 41.9 43.7 45.3 43.8 43.4
High 33.9 31.6 29.4 31.0 35.2 43.5 46.0 46.0 47.6 43.9 41.3 43.7 44.4
All 100 100 100 100 100 100 100 100 100 100 100 100 100
Memo
Number of home-purchaseloans (thousands) 4,660 4,836 4,298 3,331 2,533 2,391 2,157 2,018 2,284 2,638 2,747 3,124 3,463
Number of refinance loans(thousands) 6,412 5,692 4,397 3,588 2,869 5,243 4,481 3,823 5,888 4,349 1,971 2,810 3,338
Note: First-lien mortgages for one- to four-family, owner-occupied, site-built homes. Rows may not sum to 100 because of rounding or, for thedistribution by neighborhood income, because property location is missing.1 Applications are placed in one category for race and ethnicity. The application is designated as joint if one applicant was reported as whiteand the other was reported as one or more minority races or if the application is designated as white with one Hispanic applicant and onenon-Hispanic applicant. If there are two applicants and each reports a different minority race, the application is designated as two or moreminority races. If an applicant reports two races and one is white, that applicant is categorized under the minority race. Otherwise, theapplicant is categorized under the first race reported. “Missing” refers to applications in which the race of the applicant(s) has not beenreported or is not applicable or the application is categorized as white but ethnicity has not been reported.
2 Consists of applications by American Indians or Alaska Natives, Native Hawaiians or other Pacific Islanders, and borrowers reporting two ormore minority races.
3 The categories for the borrower-income group are as follows: Low- or moderate-income (or LMI) borrowers have income that is less than80 percent of estimated current area median family income (AMFI), middle-income borrowers have income that is at least 80 percent andless than 120 percent of AMFI, and high-income borrowers have income that is at least 120 percent of AMFI.
4 The categories for the neighborhood-income group are based on the ratio of census-tract median family income to area median familyincome from the 2006–10 American Community Survey data for 2012–16 and from the 2000 census for 2004–11, and the three categorieshave the same cutoffs as the borrower-income groups (see note 3).
Residential Mortgage Lending in 2016 9
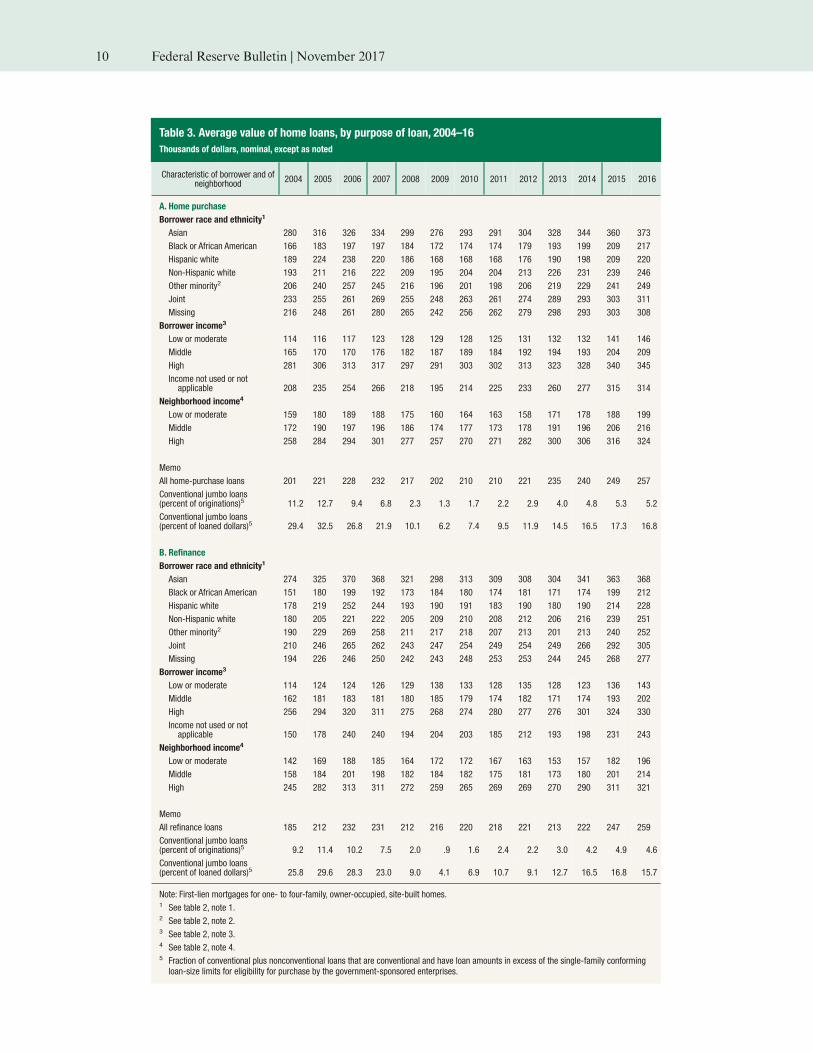
Table 3. Average value of home loans, by purpose of loan, 2004–16
Thousands of dollars, nominal, except as noted
Characteristic of borrower and ofneighborhood
2004 2005 2006 2007 2008 2009 2010 2011 2012 2013 2014 2015 2016
A. Home purchase
Borrower race and ethnicity1
Asian 280 316 326 334 299 276 293 291 304 328 344 360 373
Black or African American 166 183 197 197 184 172 174 174 179 193 199 209 217
Hispanic white 189 224 238 220 186 168 168 168 176 190 198 209 220
Non-Hispanic white 193 211 216 222 209 195 204 204 213 226 231 239 246
Other minority2 206 240 257 245 216 196 201 198 206 219 229 241 249
Joint 233 255 261 269 255 248 263 261 274 289 293 303 311
Missing 216 248 261 280 265 242 256 262 279 298 293 303 308
Borrower income3
Low or moderate 114 116 117 123 128 129 128 125 131 132 132 141 146
Middle 165 170 170 176 182 187 189 184 192 194 193 204 209
High 281 306 313 317 297 291 303 302 313 323 328 340 345
Income not used or notapplicable 208 235 254 266 218 195 214 225 233 260 277 315 314
Neighborhood income4
Low or moderate 159 180 189 188 175 160 164 163 158 171 178 188 199
Middle 172 190 197 196 186 174 177 173 178 191 196 206 216
High 258 284 294 301 277 257 270 271 282 300 306 316 324
Memo
All home-purchase loans 201 221 228 232 217 202 210 210 221 235 240 249 257
Conventional jumbo loans(percent of originations)5 11.2 12.7 9.4 6.8 2.3 1.3 1.7 2.2 2.9 4.0 4.8 5.3 5.2
Conventional jumbo loans(percent of loaned dollars)5 29.4 32.5 26.8 21.9 10.1 6.2 7.4 9.5 11.9 14.5 16.5 17.3 16.8
B. Refinance
Borrower race and ethnicity1
Asian 274 325 370 368 321 298 313 309 308 304 341 363 368
Black or African American 151 180 199 192 173 184 180 174 181 171 174 199 212
Hispanic white 178 219 252 244 193 190 191 183 190 180 190 214 228
Non-Hispanic white 180 205 221 222 205 209 210 208 212 206 216 239 251
Other minority2 190 229 269 258 211 217 218 207 213 201 213 240 252
Joint 210 246 265 262 243 247 254 249 254 249 266 292 305
Missing 194 226 246 250 242 243 248 253 253 244 245 268 277
Borrower income3
Low or moderate 114 124 124 126 129 138 133 128 135 128 123 136 143
Middle 162 181 183 181 180 185 179 174 182 171 174 193 202
High 256 294 320 311 275 268 274 280 277 276 301 324 330
Income not used or notapplicable 150 178 240 240 194 204 203 185 212 193 198 231 243
Neighborhood income4
Low or moderate 142 169 188 185 164 172 172 167 163 153 157 182 196
Middle 158 184 201 198 182 184 182 175 181 173 180 201 214
High 245 282 313 311 272 259 265 269 269 270 290 311 321
Memo
All refinance loans 185 212 232 231 212 216 220 218 221 213 222 247 259
Conventional jumbo loans(percent of originations)5 9.2 11.4 10.2 7.5 2.0 .9 1.6 2.4 2.2 3.0 4.2 4.9 4.6
Conventional jumbo loans(percent of loaned dollars)5 25.8 29.6 28.3 23.0 9.0 4.1 6.9 10.7 9.1 12.7 16.5 16.8 15.7
Note: First-lien mortgages for one- to four-family, owner-occupied, site-built homes.1 See table 2, note 1.2 See table 2, note 2.3 See table 2, note 3.4 See table 2, note 4.5 Fraction of conventional plus nonconventional loans that are conventional and have loan amounts in excess of the single-family conformingloan-size limits for eligibility for purchase by the government-sponsored enterprises.
10 Federal Reserve Bulletin | November 2017

home purchases and $368,000 for refinancings in 2016, whereas loans to black borrowers
averaged $217,000 for home purchases and $212,000 for refinancings.27
Over time, home-purchase dollar values have followed the historical trend of home prices,
rising during the mid-2000s, falling sharply through 2008 and 2009, and then beginning to
recover since about 2011. The trends differ substantially by race and ethnicity, however.
The average home-purchase loan to a Hispanic white borrower in 2016 was for $220,000,
up from $209,000 in 2015 but still well below the peak of $238,000 in 2006. In contrast, the
average home-purchase loan amount for a non-Hispanic white borrower was about
$246,000 in 2016, higher than the pre-crisis peak in 2007 of about $222,000. The values of
loans to Asian and black borrowers in 2016 were also higher than their 2006–07 peaks.
In terms of borrower income, for LMI borrowers, the average home-purchase loan amount
increased to $146,000 in 2016 from $141,000 in 2015; loan amounts increased by a similar
magnitude for middle- and high-income borrowers. Average loan values also increased
across all borrower-income groups for refinance loans.
Jumbo Lending
The share of conventional jumbo loans—those with loan amounts in excess of the GSEs’
conforming loan limits and no other government guarantee—was about 5 percent in 2016,
little changed from 2015. As shown in table 3, conventional jumbo loans made up
5.2 percent of all first-lien home-purchase loans for owner-occupied, one- to four-family,
site-built homes in 2016, roughly the same as in 2015.28 Among refinance loans, the
conventional jumbo fraction decreased to 4.6 percent from 4.9 percent in 2015. Because of
their larger size, jumbo loans make up a correspondingly larger share of the dollar
volume of mortgages, accounting for 16.8 percent of home-purchase loans and
15.7 percent of refinance loans in 2016. Since the financial crisis, most new jumbo loans
have been held on the originating bank’s portfolio, as the market for mortgage-backed
securities without a government guarantee is thin.29
Variation across Demographic Groups in Nonconventional Loan Use
Table 4 shows that black and Hispanic white borrowers are much more likely to use
nonconventional loans (FHA, VA, RHS, and FSA loans) than conventional loans
compared with other racial and ethnic groups. In 2016, among home-purchase borrowers,
about 69 percent of blacks and 60 percent of Hispanic whites took out a nonconventional
loan, whereas about 35 percent of non-Hispanic whites and just 16 percent of Asians did
so. These numbers have declined from their peaks in 2009 and 2010, when well over three-
fourths of black and Hispanic white borrowers and over one-half of non-Hispanic white
borrowers took out nonconventional loans.
27 Median loan amounts (not shown in tables) followed similar trends as average loan amounts.28 A loan qualifies as jumbo in table 3 if the loan amount is above the GSEs’ conforming loan-size limit for a
single-family home for that year and location. The conforming loan-size limit was mostly uniform across thenation prior to 2008. The limits in Alaska, Hawaii, the U.S. Virgin Islands, and Guam are 50 percent higherthan in the nation at large. For the years 2008 and thereafter, designated higher-cost areas have elevated limits.For 2016, the general conforming loan-size limit was $417,000, and the maximum high-cost area loan-size limitwas $625,000 (and 50 percent higher in Alaska, Hawaii, the U.S. Virgin Islands, and Guam). Conformingloan-size limits increase with the number of units that make up the property, but the HMDA data do not differ-entiate between properties with anywhere from one to four units. Some loans in the table may therefore havebeen misclassified as jumbo despite being eligible for purchase by a GSE.
29 See Neil Bhutta, Jack Popper, and Daniel R. Ringo (2015), “The 2014 Home Mortgage Disclosure Act Data,”Federal Reserve Bulletin, vol. 101 (November), pp. 1–43, https://www.federalreserve.gov/pubs/bulletin/2015/default.htm.
Residential Mortgage Lending in 2016 11

Table 4. Nonconventional share of home loans, by purpose of loan, 2004–16
Percent except as noted
Characteristic of borrowerand of neighborhood
2004 2005 2006 2007 2008 2009 2010 2011 2012 2013 2014 2015 2016
A. Home purchase
Borrower race and ethnicity1
Asian 2.9 1.8 2.1 2.6 13.4 26.1 26.6 25.8 21.9 16.1 14.7 16.6 15.6
Black or African American 21.7 14.3 13.6 21.7 64.1 82.0 82.9 80.3 77.2 70.8 68.0 70.2 68.5
Hispanic white 13.7 7.5 7.0 12.4 51.4 75.4 77.0 74.1 70.7 63.1 59.6 62.6 59.8
Non-Hispanic white 11.1 8.9 9.5 11.5 35.4 52.0 50.3 47.4 42.2 35.5 33.4 36.0 35.2
Other minority2 14.0 9.3 9.4 14.8 48.4 67.6 68.8 65.9 62.2 55.5 54.0 55.1 54.2
Joint 16.9 12.8 14.4 17.2 46.4 59.4 56.3 53.6 48.9 42.1 41.3 43.7 43.1
Missing 11.3 5.1 5.7 8.8 32.7 50.6 49.4 45.9 39.4 31.9 32.2 35.0 34.7
Borrower income3
Low or moderate 20.3 15.2 14.9 16.0 46.1 65.3 66.6 64.5 59.7 52.5 50.3 53.3 51.7
Middle 14.3 11.0 12.6 16.8 46.1 60.4 59.3 57.0 51.5 45.6 44.8 47.6 47.5
High 5.3 3.9 4.9 7.5 26.7 38.5 37.2 34.3 29.5 25.1 24.2 26.3 26.7
Neighborhood income4
Low or moderate 15.8 9.7 9.6 13.8 45.5 64.4 65.1 61.2 57.9 49.9 48.1 50.3 48.7
Middle 14.1 10.2 10.8 14.2 42.7 59.8 59.4 56.9 52.0 44.7 43.0 45.6 44.6
High 7.1 5.4 6.1 7.6 27.4 43.4 42.0 39.5 34.6 28.2 26.1 28.9 28.4
Memo
All borrowers 11.9 8.5 9.0 11.8 37.6 54.4 53.4 50.5 45.2 38.2 36.6 39.4 38.7
B. Refinance
Borrower race and ethnicity1
Asian 1.2 .7 .6 1.0 4.6 5.7 4.7 4.3 5.9 6.7 6.8 9.8 8.3
Black or African American 11.1 5.8 4.4 10.2 39.2 53.8 42.0 37.8 38.6 37.1 39.1 49.4 53.0
Hispanic white 5.6 2.6 1.9 3.9 20.5 36.2 28.1 22.9 26.9 25.8 21.2 32.0 30.5
Non-Hispanic white 4.0 2.4 2.6 4.9 15.9 16.8 13.6 12.2 14.2 14.8 16.3 21.0 21.7
Other minority2 5.5 3.4 2.4 4.9 20.0 28.3 23.3 21.9 25.5 24.9 25.0 32.6 36.6
Joint 7.5 3.7 3.4 6.2 19.5 21.1 16.6 16.3 20.1 20.5 25.5 28.0 29.2
Missing 4.2 1.9 1.7 4.1 18.7 19.0 12.5 13.6 16.5 16.7 21.5 25.5 27.6
Borrower income3
Low or moderate 2.3 1.6 2.9 5.7 18.3 16.6 14.0 11.5 9.3 9.3 13.0 16.5 18.3
Middle 1.7 1.3 2.7 6.2 19.6 13.2 12.2 10.9 8.9 9.5 13.2 14.8 15.2
High .8 .6 1.1 2.7 10.5 7.2 6.7 6.3 5.5 6.1 8.8 9.2 9.2
Neighborhood income4
Low or moderate 5.9 3.2 2.9 6.3 24.6 31.3 23.1 19.7 22.2 22.1 22.4 29.5 30.4
Middle 5.2 3.0 2.9 5.8 20.2 22.3 17.5 16.1 18.4 19.0 20.9 26.8 28.1
High 2.9 1.7 1.6 3.0 11.3 12.1 10.0 9.3 11.7 12.4 14.5 18.4 18.9
Memo
All borrowers 4.6 2.6 2.5 5.0 17.6 18.7 14.4 13.3 15.6 16.4 18.4 23.4 24.3
Note: First-lien mortgages for one- to four-family, owner-occupied, site-built homes. Excludes applications where no credit decision was made.Nonconventional loans are those insured by the Federal Housing Administration or backed by guarantees from the U.S. Department of VeteransAffairs, the Farm Service Agency, or the Rural Housing Service.1 See table 2, note 1.2 See table 2, note 2.3 See table 2, note 3.4 See table 2, note 4.
12 Federal Reserve Bulletin | November 2017

Nonconventional usage is also more prevalent for borrowers with lower incomes and in
neighborhoods with lower incomes. In 2016, about 52 percent of LMI home-purchase
borrowers and 49 percent of those borrowing to purchase homes in LMI neighborhoods
used nonconventional loans, compared with about 27 percent of high-income borrowers
and 28 percent of borrowers in high-income neighborhoods. While black and Hispanic
white borrowers tend to have lower incomes, on average, than non-Hispanic white
borrowers, the previously mentioned racial and ethnic differences in nonconventional loan
use persist within income groups.30 With respect to refinance loans, minority and lower-
income borrowers are again more likely to use nonconventional than conventional loans. In
general, however, nonconventional loans are less prevalent in refinance lending.31
Greater reliance on nonconventional loans may reflect the relatively low down-payment
requirements of the FHA and VA lending programs, which serve the needs of borrowers
who have few assets to meet down-payment and closing-cost requirements.32 The patterns
of product incidence could also reflect the behavior of lenders to some extent; for example,
concerns have been raised about the possibility that lenders steer borrowers in certain
neighborhoods toward such loans.33
Denial Rates and Denial Reasons
In 2016, the overall denial rate on applications for home-purchase loans was 11.4 percent,
somewhat lower than in 2015 (table 5). The decrease in 2016 continues a trend of declining
denial rates for home-purchase mortgages over the past decade.34 In addition, denial rates
have exhibited significant variation, and changes in denial rates have differed by type of
loan. For example, for conventional home-purchase loan applications, the denial rate of
10.2 percent in 2016 was 8.3 percentage points lower than in 2006, while for
nonconventional home-purchase loan applications, the denial rate of 13.4 percent in 2016
was 1.3 percentage points higher than in 2006. Variations in raw denial rates over time
reflect not only changes in credit standards, but also changes in the demand for credit and
in the composition of borrowers applying for mortgages. For example, the denial rate on
applications for conventional home-purchase loans was lower in 2016 than during the
housing boom years, even though most measures of credit availability suggest that credit
standards are tighter today.35 This result may stem from a relatively large drop in applica-
tions from riskier applicants.
As in past years, black, Hispanic white, and “other minority” borrowers had notably higher
denial rates in 2016 than non-Hispanic white borrowers, while denial rates for Asian
30 See Bhutta, Popper, and Ringo, “The 2014 Home Mortgage Disclosure Act Data,” in note 29.31 The reported nonconventional share of refinance loans is lower than the true share for the groups categorized
by borrower income because, in most nonconventional refinance loans, income is not reported. Thus, whenincome is reported on a refinance loan, the loan is likely to be conventional.
32 Findings of the Federal Reserve Board’s Survey of Consumer Finances for 2013 indicate that liquid asset levelsand financial wealth holdings for minorities and lower-income groups are substantially smaller than they arefor non-Hispanic white borrowers or higher-income populations. See Board of Governors of the FederalReserve System, “2013 Survey of Consumer Finances,” webpage, www.federalreserve.gov/econresdata/scf/scfindex.htm.
33 See, for example, Glenn B. Canner, Stuart A. Gabriel, and J. Michael Woolley (1991), “Race, Default Risk andMortgage Lending: A Study of the FHA and Conventional Loan Markets,” Southern Economic Journal, vol. 58(July), pp. 249–62.
34 Denial rates are calculated as the number of denied loan applications divided by the total number of applica-tions, excluding withdrawn applications and application files closed for incompleteness.
35 Both the Mortgage Bankers Association and the Urban Institute publish indexes of mortgage credit availabilitysuggesting that standards have been much tighter since the crisis. See Wei Li, Laurie Goodman, Ellen Seidman,Jim Parrott, Jun Zhu, and Bing Bai (2014), “Measuring Mortgage Credit Accessibility,” working paper(Washington: Urban Institute, November), www.urban.org/research/publication/measuring-mortgage-credit-accessibility.
Residential Mortgage Lending in 2016 13
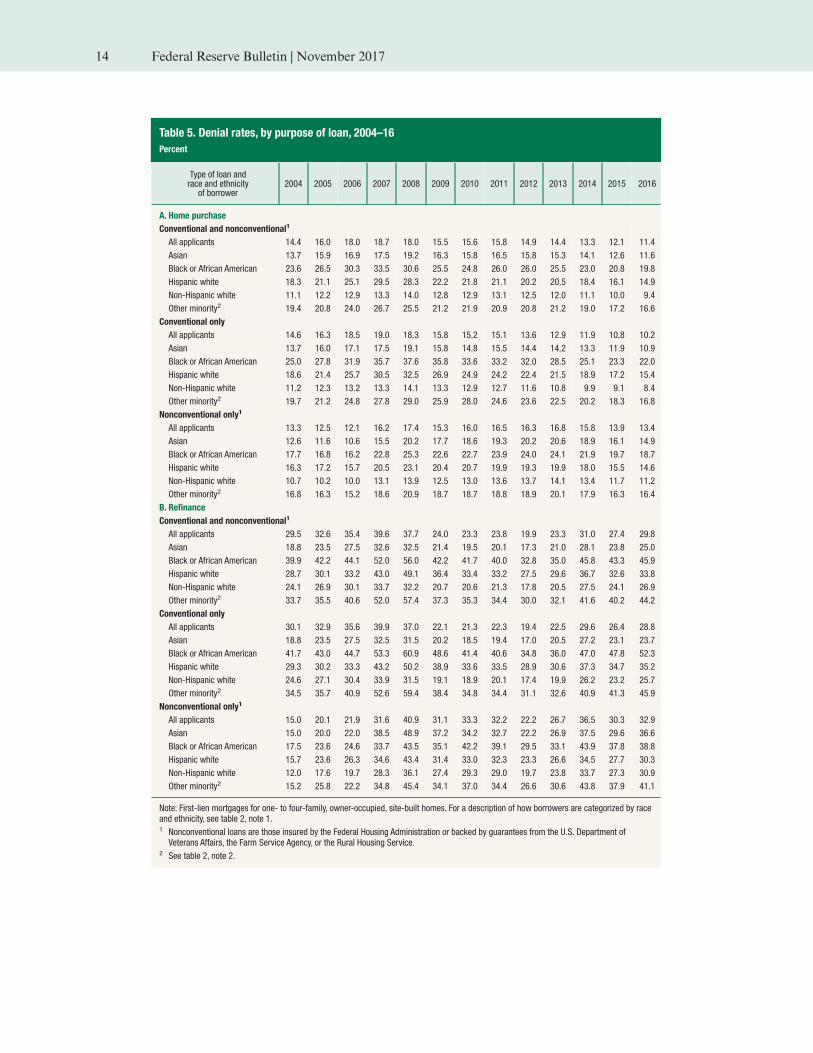
Table 5. Denial rates, by purpose of loan, 2004–16
Percent
Type of loan andrace and ethnicity
of borrower2004 2005 2006 2007 2008 2009 2010 2011 2012 2013 2014 2015 2016
A. Home purchase
Conventional and nonconventional1
All applicants 14.4 16.0 18.0 18.7 18.0 15.5 15.6 15.8 14.9 14.4 13.3 12.1 11.4
Asian 13.7 15.9 16.9 17.5 19.2 16.3 15.8 16.5 15.8 15.3 14.1 12.6 11.6
Black or African American 23.6 26.5 30.3 33.5 30.6 25.5 24.8 26.0 26.0 25.5 23.0 20.8 19.8
Hispanic white 18.3 21.1 25.1 29.5 28.3 22.2 21.8 21.1 20.2 20.5 18.4 16.1 14.9
Non-Hispanic white 11.1 12.2 12.9 13.3 14.0 12.8 12.9 13.1 12.5 12.0 11.1 10.0 9.4
Other minority2 19.4 20.8 24.0 26.7 25.5 21.2 21.9 20.9 20.8 21.2 19.0 17.2 16.6
Conventional only
All applicants 14.6 16.3 18.5 19.0 18.3 15.8 15.2 15.1 13.6 12.9 11.9 10.8 10.2
Asian 13.7 16.0 17.1 17.5 19.1 15.8 14.8 15.5 14.4 14.2 13.3 11.9 10.9
Black or African American 25.0 27.8 31.9 35.7 37.6 35.8 33.6 33.2 32.0 28.5 25.1 23.3 22.0
Hispanic white 18.6 21.4 25.7 30.5 32.5 26.9 24.9 24.2 22.4 21.5 18.9 17.2 15.4
Non-Hispanic white 11.2 12.3 13.2 13.3 14.1 13.3 12.9 12.7 11.6 10.8 9.9 9.1 8.4
Other minority2 19.7 21.2 24.8 27.8 29.0 25.9 28.0 24.6 23.6 22.5 20.2 18.3 16.8
Nonconventional only1
All applicants 13.3 12.5 12.1 16.2 17.4 15.3 16.0 16.5 16.3 16.8 15.8 13.9 13.4
Asian 12.6 11.6 10.6 15.5 20.2 17.7 18.6 19.3 20.2 20.6 18.9 16.1 14.9
Black or African American 17.7 16.8 16.2 22.8 25.3 22.6 22.7 23.9 24.0 24.1 21.9 19.7 18.7
Hispanic white 16.3 17.2 15.7 20.5 23.1 20.4 20.7 19.9 19.3 19.9 18.0 15.5 14.6
Non-Hispanic white 10.7 10.2 10.0 13.1 13.9 12.5 13.0 13.6 13.7 14.1 13.4 11.7 11.2
Other minority2 16.8 16.3 15.2 18.6 20.9 18.7 18.7 18.8 18.9 20.1 17.9 16.3 16.4
B. Refinance
Conventional and nonconventional1
All applicants 29.5 32.6 35.4 39.6 37.7 24.0 23.3 23.8 19.9 23.3 31.0 27.4 29.8
Asian 18.8 23.5 27.5 32.6 32.5 21.4 19.5 20.1 17.3 21.0 28.1 23.8 25.0
Black or African American 39.9 42.2 44.1 52.0 56.0 42.2 41.7 40.0 32.8 35.0 45.8 43.3 45.9
Hispanic white 28.7 30.1 33.2 43.0 49.1 36.4 33.4 33.2 27.5 29.6 36.7 32.6 33.8
Non-Hispanic white 24.1 26.9 30.1 33.7 32.2 20.7 20.6 21.3 17.8 20.5 27.5 24.1 26.9
Other minority2 33.7 35.5 40.6 52.0 57.4 37.3 35.3 34.4 30.0 32.1 41.6 40.2 44.2
Conventional only
All applicants 30.1 32.9 35.6 39.9 37.0 22.1 21.3 22.3 19.4 22.5 29.6 26.4 28.8
Asian 18.8 23.5 27.5 32.5 31.5 20.2 18.5 19.4 17.0 20.5 27.2 23.1 23.7
Black or African American 41.7 43.0 44.7 53.3 60.9 48.6 41.4 40.6 34.8 36.0 47.0 47.8 52.3
Hispanic white 29.3 30.2 33.3 43.2 50.2 38.9 33.6 33.5 28.9 30.6 37.3 34.7 35.2
Non-Hispanic white 24.6 27.1 30.4 33.9 31.5 19.1 18.9 20.1 17.4 19.9 26.2 23.2 25.7
Other minority2 34.5 35.7 40.9 52.6 59.4 38.4 34.8 34.4 31.1 32.6 40.9 41.3 45.9
Nonconventional only1
All applicants 15.0 20.1 21.9 31.6 40.9 31.1 33.3 32.2 22.2 26.7 36.5 30.3 32.9
Asian 15.0 20.0 22.0 38.5 48.9 37.2 34.2 32.7 22.2 26.9 37.5 29.6 36.6
Black or African American 17.5 23.6 24.6 33.7 43.5 35.1 42.2 39.1 29.5 33.1 43.9 37.8 38.8
Hispanic white 15.7 23.6 26.3 34.6 43.4 31.4 33.0 32.3 23.3 26.6 34.5 27.7 30.3
Non-Hispanic white 12.0 17.6 19.7 28.3 36.1 27.4 29.3 29.0 19.7 23.8 33.7 27.3 30.9
Other minority2 15.2 25.8 22.2 34.8 45.4 34.1 37.0 34.4 26.6 30.6 43.8 37.9 41.1
Note: First-lien mortgages for one- to four-family, owner-occupied, site-built homes. For a description of how borrowers are categorized by raceand ethnicity, see table 2, note 1.1 Nonconventional loans are those insured by the Federal Housing Administration or backed by guarantees from the U.S. Department ofVeterans Affairs, the Farm Service Agency, or the Rural Housing Service.
2 See table 2, note 2.
14 Federal Reserve Bulletin | November 2017

borrowers were more similar to those for non-Hispanic white borrowers. For example, the
denial rates for conventional home-purchase loans were about 22 percent for black
borrowers, 15 percent for Hispanic white borrowers, 11 percent for Asian borrowers,
17 percent for other minority borrowers, and 8 percent for non-Hispanic white borrowers.
Previous research and experience gained in the fair lending enforcement process show that
differences in denial rates and in the incidence of higher-priced lending (the topic of the
next subsection) among racial or ethnic groups stem, at least in part, from factors related to
credit risk that are not available in the HMDA data, such as credit history (including credit
score), ratio of total debt service payments to income (DTI), and LTV ratio. Differential
costs of loan origination and the local competitive environment, as well as illegal discrimi-
nation, may also bear on the differences in pricing.
Despite these limitations, the HMDA data play an important role in fair lending enforce-
ment. The data are regularly used by bank examiners to facilitate the fair lending examina-
tion and enforcement processes. When examiners for the federal banking agencies evaluate
an institution’s fair lending risk, they analyze HMDA price data and loan application
outcomes in conjunction with other information and risk factors that can be drawn directly
from loan files or electronic records maintained by lenders, as directed by the Interagency
Fair Lending Examination Procedures.36 The availability of broader information allows
the examiners to draw stronger conclusions about institution compliance with the fair
lending laws.
Lenders can, but are not required to, report up to three reasons for denying a mortgage
application, selecting from nine potential denial reasons (as shown in table 6). Among
denied first-lien applications for one- to four-family, owner-occupied, site-built properties
in 2016, about 72 percent of denied home-purchase applications and about 46 percent of
denied refinance applications had at least one reported denial reason. The two most
frequently cited denial reasons for both home-purchase and refinance loans were the appli-
cant’s credit history and DTI ratio (note that the sum across columns in table 6 can add
up to more than 100 percent because lenders can cite more than one denial reason). For
both home-purchase and refinance applications, the DTI ratio and collateral are more
likely to be cited as denial reasons on conventional than nonconventional applications.
Denial reasons vary across racial and ethnic groups to some degree. For example, among
denied home-purchase loan applications in 2016, credit history was cited as a denial reason
for about 24 percent of denied black applicants, 17 percent of denied Hispanic white
applicants, 18 percent of denied non-Hispanic white applicants, and just 11 percent of
denied Asian applicants. The DTI ratio was cited most often as a denial reason for home-
purchase applicants in all racial and ethnic groups. For Asian home-purchase applicants,
collateral was the second most common reason cited for denial, while for other groups,
credit history was the second most common reason cited.
The Incidence of Higher-Priced Lending
Current price-reporting rules under HMDA, in effect since October 2009, define higher-
priced first-lien loans as those with an annual percentage rate (APR) of at least
1.5 percentage points above the average prime offer rate (APOR) for loans of a similar type
(for example, a 30-year fixed-rate mortgage).37 The spread for junior-lien loans must be at
36 The Interagency Fair Lending Examination Procedures are available at www.ffiec.gov/PDF/fairlend.pdf.37 For more information about the rule changes related to higher-priced lending and the ways in which they affect
the incidence of reported higher-priced lending over time, see Avery and others, “The 2009 HMDA Data,” innote 12.
Residential Mortgage Lending in 2016 15

Table 6. Reasons for denial, by purpose of loan, 2016
Percent
Type of loanand race and ethnicity
of borrower
Debt-to-incomeratio
Employ-menthistory
Credithistory
CollateralInsuf-ficientcash
Unveri-fiable
informa-tion
Creditapplica-tion
incom-plete
Mortgageinsurancedenied
OtherNo
reasongiven
A. Home purchase
Conventional and nonconventional1
All applicants 23.1 3.8 18.5 13.8 7.1 5.8 9.0 .4 10.1 27.6
Asian 29.5 5.0 11.0 11.7 9.4 9.6 11.1 .3 11.2 23.3
Black or African American 26.1 3.2 24.0 10.4 7.9 4.6 6.7 .4 10.1 28.7
Hispanic white 25.4 4.4 17.2 11.7 7.3 7.2 6.7 .4 11.7 29.5
Non-Hispanic white 21.7 3.8 18.2 15.0 6.7 5.5 9.1 .5 9.9 27.9
Other minority2 24.8 4.1 20.9 10.7 8.0 4.9 7.0 .6 10.6 29.8
Conventional only
All applicants 24.7 3.2 19.2 15.8 7.9 6.1 9.8 .7 9.9 23.4
Asian 29.9 4.7 10.6 12.1 10.2 9.9 11.9 .4 11.0 21.8
Black or African American 27.6 2.6 29.3 12.8 9.3 4.2 6.7 .9 10.7 22.0
Hispanic white 27.2 3.2 19.7 14.6 8.2 7.0 6.9 .8 11.9 24.0
Non-Hispanic white 23.4 3.2 18.6 16.8 7.4 5.9 9.7 .7 9.3 24.4
Other minority2 26.5 3.6 24.3 12.2 9.9 5.1 6.7 1.3 12.1 24.7
Nonconventional only1
All applicants 21.3 4.5 17.7 11.5 6.2 5.4 8.0 .1 10.4 32.5
Asian 27.8 6.1 12.7 10.0 6.2 8.5 8.2 .20 12.0 29.0
Black or African American 25.3 3.6 21.0 9.0 7.1 4.9 6.7 .2 9.8 32.5
Hispanic white 24.1 5.3 15.3 9.6 6.6 7.3 6.7 .2 11.5 33.4
Non-Hispanic white 19.3 4.6 17.7 12.5 5.8 4.9 8.3 .1 10.6 32.8
Other minority2 23.4 4.6 18.0 9.5 6.3 4.7 7.3 .0 9.2 34.2
B. Refinance
Conventional and nonconventional1
All applicants 12.0 .7 12.5 9.7 2.3 2.3 9.5 .1 6.1 53.8
Asian 18.3 1.1 10.3 7.3 2.9 3.9 9.8 .1 7.0 50.1
Black or African American 9.2 .4 15.2 7.8 2.2 1.5 7.0 .0 6.2 58.9
Hispanic white 18.1 .9 17.6 7.8 3.2 3.3 8.8 .1 8.6 44.9
Non-Hispanic white 11.5 .7 11.7 9.8 2.1 2.3 8.4 .1 5.7 56.0
Other minority2 10.4 .6 12.6 6.3 1.9 1.9 7.2 .0 5.4 61.8
Conventional only
All applicants 14.5 .8 13.4 10.0 2.4 2.7 8.7 .1 6.1 51.5
Asian 20.2 1.2 10.6 7.8 3.1 4.2 9.6 .1 7.1 47.7
Black or African American 11.9 .4 16.7 8.0 2.2 1.6 5.7 .1 6.2 57.5
Hispanic white 21.6 .9 19.3 8.4 3.5 3.5 7.7 .1 8.5 41.6
Non-Hispanic white 13.9 .8 12.6 10.5 2.2 2.6 7.8 .1 5.8 53.3
Other minority2 12.9 .6 14.1 6.6 2.2 2.2 6.1 .0 5.7 59.2
Nonconventional only1
All applicants 5.5 .5 10.1 8.8 1.9 1.5 11.6 .03 6.2 59.4
Asian 7.8 .5 8.7 4.5 1.7 2.2 10.9 .0 6.3 64.0
Black or African American 5.3 .3 12.9 7.5 2.4 1.3 8.9 .01 6.1 61.0
Hispanic white 8.4 .7 13.0 6.0 2.4 2.7 11.9 .06 9.1 53.9
Non-Hispanic white 4.9 .6 9.2 8.0 1.7 1.4 10.3 .03 5.6 63.4
Other minority2 5.3 .4 9.6 5.7 1.4 1.2 9.3 .0 4.9 67.2
Note: Denied first-lien mortgage applications for one- to four-family, owner-occupied, site-built homes. Columns sum to more than 100 becauselenders may report up to three denial reasons. For a description of how borrowers are categorized by race and ethnicity, see table 2, note 1.1 See table 5, note 1.2 See table 2, note 2.
16 Federal Reserve Bulletin | November 2017

least 3.5 percentage points for such loans to be considered higher priced. The APR of a
mortgage differs from the interest rate because the APR measure incorporates up-front fees
and other loan costs such as mortgage insurance. The APOR, which is published weekly by
the Federal Financial Institutions Examination Council, is an estimate of the APR on
loans being offered to high-quality prime borrowers based on the contract interest rates
and discount points reported by Freddie Mac in its Primary Mortgage Market Survey.38
In 2016, the fraction of home-purchase loans (again, first liens for one- to four-family,
owner-occupied, site-built properties) above the higher-priced threshold was 7.7 percent
(table 7.A). Although the overall fraction of higher-priced loans was little changed from
2015, there were moderate changes in the share of higher-priced lending among different
types of loans. In particular, the higher-priced share of nonconventional loans declined
from 14.5 percent to 13.9 percent, while the higher-priced share of conventional loans rose
from 3.2 percent to 3.7 percent.
Table 7.A also shows that, in 2016 as well as earlier years, black and Hispanic white
borrowers had the highest incidences of higher-priced loans within both the conventional
and nonconventional loan types. This table provides the raw rates of higher-priced lending
by group from 2004 to 2016, but, as discussed in detail in previous Bulletin articles, the
raw rates reported in the public HMDA data can be difficult to compare over longer time
horizons for two main reasons. First, a different price-reporting rule was in place prior to
October 2009, with the spread between a mortgage’s APR and the rate on a Treasury bond
of comparable term (rather than the APOR) reported if it rose above 3 percentage points.39
Second, even data from years prior to 2009 are not easily comparable from year to year, as
the price-reporting rule used during this period created unintended distortions in reporting
over time (which is why the reporting rule was changed).40
Table 7.B provides adjusted rates of higher-priced lending that are intended to be more
comparable over time. Using the dates of application and origination (which are not
released in the public HMDA data files) and assuming all loans are 30-year fixed-rate
mortgages, we can estimate the APR of loans that were originated when the old pricing
rule was in effect.41 This estimated APR can then be compared with the APOR, as is done
under the new price-reporting rule. Finally, because the implied threshold spread over the
APOR during the previous reporting regime got to as high as about 2.5 percentage points,
table 7.B reports the fraction of loans with an estimated APR spread over the APOR (or
the actual reported spread for loans made under the new rules) of at least 2.5 percentage
points—rather than 1.5 percentage points, as in table 7.A.42 Higher-priced lending by this
measure virtually disappeared by 2008 and has not reemerged, likely reflecting the lack of
subprime mortgage lending.
38 See Freddie Mac, “Mortgage Rates Survey,” webpage, www.freddiemac.com/pmms; and Federal FinancialInstitutions Examination Council, “FFIEC Rate Spread Calculator,” webpage, www.ffiec.gov/ratespread/newcalc.aspx.
39 The reporting threshold for junior liens was 5 percentage points.40 These distortions are related to the fact that changes in long-term Treasury rates do not always lead to parallel
changes in mortgage rates. For a discussion of how the old rule could produce misleading data about trendsin higher-priced lending, see Neil Bhutta and Daniel R. Ringo (2014), “The 2013 Home Mortgage DisclosureAct Data,” Federal Reserve Bulletin, vol. 100 (November), pp. 1–32, https://www.federalreserve.gov/pubs/bulletin/2014/articles/hmda/2013-HMDA-Data.htm.
41 The assumption that all mortgages were fixed rate likely understates the extent of higher-priced lending duringthe early years of the housing boom. During this period, adjustable-rate mortgages were quite prevalent, andthe APRs on such loans are tied to even shorter-term Treasury rates than are the APRs on fixed-rate mort-gages. Thus, when the yield curve is relatively steep, as it was in 2004, the bar for adjustable-rate mortgages tobe reported as higher priced would have been even higher than for fixed-rate mortgages.
42 For a more detailed discussion of this adjustment technique, see Avery and others, “The 2009 HMDA Data,” innote 12.
Residential Mortgage Lending in 2016 17
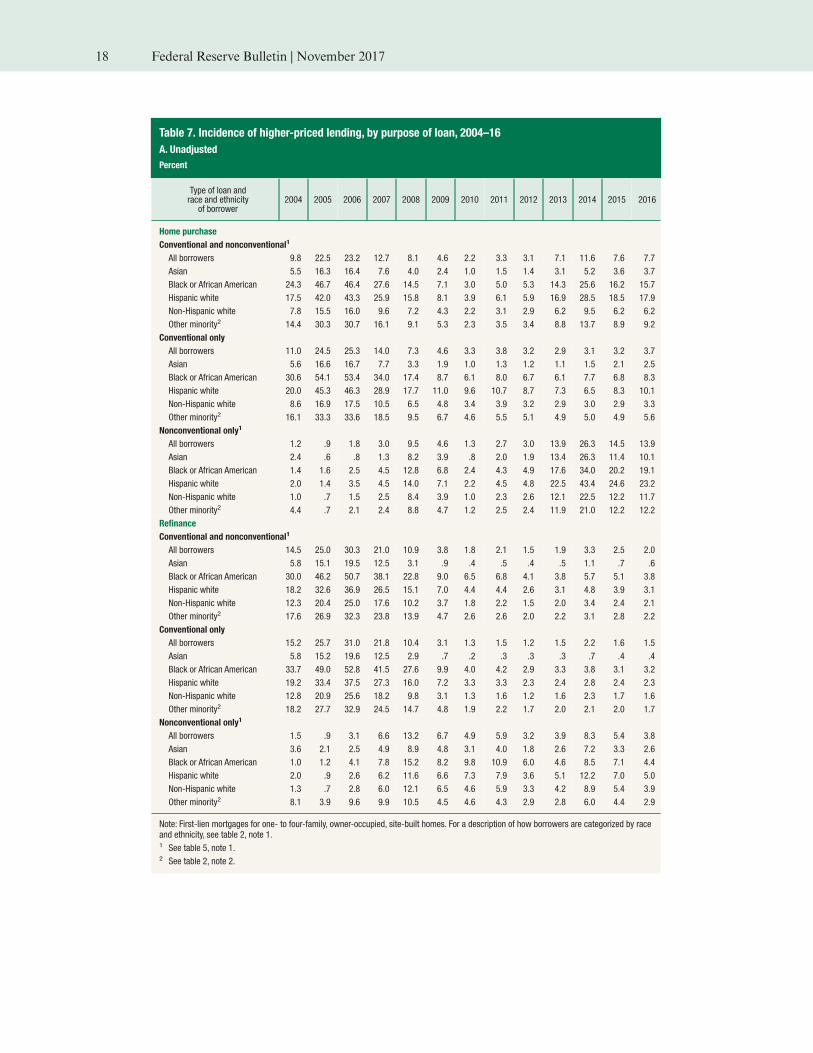
Table 7. Incidence of higher-priced lending, by purpose of loan, 2004–16
A. Unadjusted
Percent
Type of loan andrace and ethnicity
of borrower2004 2005 2006 2007 2008 2009 2010 2011 2012 2013 2014 2015 2016
Home purchase
Conventional and nonconventional1
All borrowers 9.8 22.5 23.2 12.7 8.1 4.6 2.2 3.3 3.1 7.1 11.6 7.6 7.7
Asian 5.5 16.3 16.4 7.6 4.0 2.4 1.0 1.5 1.4 3.1 5.2 3.6 3.7
Black or African American 24.3 46.7 46.4 27.6 14.5 7.1 3.0 5.0 5.3 14.3 25.6 16.2 15.7
Hispanic white 17.5 42.0 43.3 25.9 15.8 8.1 3.9 6.1 5.9 16.9 28.5 18.5 17.9
Non-Hispanic white 7.8 15.5 16.0 9.6 7.2 4.3 2.2 3.1 2.9 6.2 9.5 6.2 6.2
Other minority2 14.4 30.3 30.7 16.1 9.1 5.3 2.3 3.5 3.4 8.8 13.7 8.9 9.2
Conventional only
All borrowers 11.0 24.5 25.3 14.0 7.3 4.6 3.3 3.8 3.2 2.9 3.1 3.2 3.7
Asian 5.6 16.6 16.7 7.7 3.3 1.9 1.0 1.3 1.2 1.1 1.5 2.1 2.5
Black or African American 30.6 54.1 53.4 34.0 17.4 8.7 6.1 8.0 6.7 6.1 7.7 6.8 8.3
Hispanic white 20.0 45.3 46.3 28.9 17.7 11.0 9.6 10.7 8.7 7.3 6.5 8.3 10.1
Non-Hispanic white 8.6 16.9 17.5 10.5 6.5 4.8 3.4 3.9 3.2 2.9 3.0 2.9 3.3
Other minority2 16.1 33.3 33.6 18.5 9.5 6.7 4.6 5.5 5.1 4.9 5.0 4.9 5.6
Nonconventional only1
All borrowers 1.2 .9 1.8 3.0 9.5 4.6 1.3 2.7 3.0 13.9 26.3 14.5 13.9
Asian 2.4 .6 .8 1.3 8.2 3.9 .8 2.0 1.9 13.4 26.3 11.4 10.1
Black or African American 1.4 1.6 2.5 4.5 12.8 6.8 2.4 4.3 4.9 17.6 34.0 20.2 19.1
Hispanic white 2.0 1.4 3.5 4.5 14.0 7.1 2.2 4.5 4.8 22.5 43.4 24.6 23.2
Non-Hispanic white 1.0 .7 1.5 2.5 8.4 3.9 1.0 2.3 2.6 12.1 22.5 12.2 11.7
Other minority2 4.4 .7 2.1 2.4 8.8 4.7 1.2 2.5 2.4 11.9 21.0 12.2 12.2
Refinance
Conventional and nonconventional1
All borrowers 14.5 25.0 30.3 21.0 10.9 3.8 1.8 2.1 1.5 1.9 3.3 2.5 2.0
Asian 5.8 15.1 19.5 12.5 3.1 .9 .4 .5 .4 .5 1.1 .7 .6
Black or African American 30.0 46.2 50.7 38.1 22.8 9.0 6.5 6.8 4.1 3.8 5.7 5.1 3.8
Hispanic white 18.2 32.6 36.9 26.5 15.1 7.0 4.4 4.4 2.6 3.1 4.8 3.9 3.1
Non-Hispanic white 12.3 20.4 25.0 17.6 10.2 3.7 1.8 2.2 1.5 2.0 3.4 2.4 2.1
Other minority2 17.6 26.9 32.3 23.8 13.9 4.7 2.6 2.6 2.0 2.2 3.1 2.8 2.2
Conventional only
All borrowers 15.2 25.7 31.0 21.8 10.4 3.1 1.3 1.5 1.2 1.5 2.2 1.6 1.5
Asian 5.8 15.2 19.6 12.5 2.9 .7 .2 .3 .3 .3 .7 .4 .4
Black or African American 33.7 49.0 52.8 41.5 27.6 9.9 4.0 4.2 2.9 3.3 3.8 3.1 3.2
Hispanic white 19.2 33.4 37.5 27.3 16.0 7.2 3.3 3.3 2.3 2.4 2.8 2.4 2.3
Non-Hispanic white 12.8 20.9 25.6 18.2 9.8 3.1 1.3 1.6 1.2 1.6 2.3 1.7 1.6
Other minority2 18.2 27.7 32.9 24.5 14.7 4.8 1.9 2.2 1.7 2.0 2.1 2.0 1.7
Nonconventional only1
All borrowers 1.5 .9 3.1 6.6 13.2 6.7 4.9 5.9 3.2 3.9 8.3 5.4 3.8
Asian 3.6 2.1 2.5 4.9 8.9 4.8 3.1 4.0 1.8 2.6 7.2 3.3 2.6
Black or African American 1.0 1.2 4.1 7.8 15.2 8.2 9.8 10.9 6.0 4.6 8.5 7.1 4.4
Hispanic white 2.0 .9 2.6 6.2 11.6 6.6 7.3 7.9 3.6 5.1 12.2 7.0 5.0
Non-Hispanic white 1.3 .7 2.8 6.0 12.1 6.5 4.6 5.9 3.3 4.2 8.9 5.4 3.9
Other minority2 8.1 3.9 9.6 9.9 10.5 4.5 4.6 4.3 2.9 2.8 6.0 4.4 2.9
Note: First-lien mortgages for one- to four-family, owner-occupied, site-built homes. For a description of how borrowers are categorized by raceand ethnicity, see table 2, note 1.1 See table 5, note 1.2 See table 2, note 2.
18 Federal Reserve Bulletin | November 2017

Table 7. Incidence of higher-priced lending, by purpose of loan, 2004–16
B. Adjusted
Percent
Type of loan and race andethnicity of borrower
2004 2005 2006 2007 2008 2009 2010 2011 2012 2013 2014 2015 2016
Home purchase
Conventional and nonconventional1
All borrowers 7.4 18.3 17.1 6.3 1.3 1.3 .6 .8 .8 .7 .8 .7 .8
Asian 3.8 13.0 11.4 3.1 .5 .5 .3 .3 .3 .3 .4 .5 .6
Black or African American 19.3 40.3 38.5 16.7 1.9 1.3 .6 .7 .9 1.0 1.2 1.2 1.2
Hispanic white 12.3 34.5 32.8 13.0 2.1 1.4 1.0 1.3 1.6 1.5 1.6 1.5 1.6
Non-Hispanic white 5.8 12.1 10.9 4.3 1.3 1.4 .7 .8 .8 .7 .7 .6 .7
Other minority2 10.5 24.7 22.7 8.0 1.5 1.4 .8 .9 1.1 .9 .9 .9 .8
Conventional only
All borrowers 8.2 20.0 18.7 7.1 1.9 2.3 1.3 1.4 1.2 .9 .8 .8 .8
Asian 3.8 13.3 11.6 3.2 .5 .6 .3 .4 .4 .3 .4 .5 .7
Black or African American 24.4 46.9 44.5 21.2 4.7 4.0 2.6 2.6 2.7 1.7 1.4 1.8 1.6
Hispanic white 14.0 37.2 35.2 14.8 3.9 4.6 3.9 4.1 4.5 2.8 2.3 2.8 2.9
Non-Hispanic white 6.5 13.2 12.0 4.9 1.9 2.6 1.3 1.5 1.2 .8 .8 .7 .7
Other minority2 11.6 27.2 25.0 9.3 2.7 3.7 2.3 2.5 2.6 1.7 1.3 1.5 1.3
Nonconventional only1
All borrowers .9 .3 .2 .3 .4 .4 .1 .2 .3 .5 .8 .5 .6
Asian 2.2 .3 .1 .2 .2 .2 .1 .2 .2 .3 .5 .2 .3
Black or African American 1.0 .5 .3 .6 .4 .7 .2 .3 .3 .8 1.1 1.0 1.1
Hispanic white 1.6 .3 .3 .2 .5 .4 .1 .3 .3 .8 1.1 .7 .7
Non-Hispanic white .8 .2 .2 .2 .3 .3 .1 .2 .3 .5 .7 .5 .6
Other minority2 3.9 .3 .2 .2 .3 .3 .1 .1 .2 .3 .6 .4 .4
Refinance
Conventional and nonconventional1
All borrowers 11.3 20.1 21.3 12.7 4.3 1.4 .6 .8 .7 .7 1.0 .6 .4
Asian 4.1 12.2 12.1 5.4 .8 .2 .1 .2 .1 .1 .2 .1 .1
Black or African American 24.3 38.5 39.0 26.4 10.6 3.5 2.6 3.3 2.5 1.6 2.1 1.3 .6
Hispanic white 13.4 27.0 25.8 14.8 5.6 2.5 1.8 1.8 1.1 .9 1.1 .7 .5
Non-Hispanic white 9.5 15.9 16.9 10.3 4.1 1.4 .6 .8 .7 .7 1.1 .6 .4
Other minority2 13.2 22.0 22.3 14.5 7.1 2.1 .9 1.1 1.1 .8 1.1 .7 .3
Conventional only
All borrowers 11.8 20.7 21.9 13.3 5.1 1.5 .5 .6 .4 .4 .7 .5 .4
Asian 4.1 12.3 12.1 5.4 .9 .2 .1 .1 .0 .0 .1 .1 .1
Black or African American 27.3 40.8 40.7 29.4 17.1 6.3 2.0 1.8 1.0 1.0 1.4 1.1 1.0
Hispanic white 14.1 27.7 26.2 15.4 6.9 3.5 1.4 1.3 .8 .7 .8 .8 .6
Non-Hispanic white 9.9 16.3 17.3 10.9 4.8 1.6 .5 .6 .4 .5 .8 .5 .4
Other minority2 13.6 22.6 22.7 14.9 8.3 2.8 .9 .9 .7 .7 .7 .6 .4
Nonconventional only1
All borrowers 1.0 .6 .7 .5 .4 .5 1.2 2.5 2.4 1.8 2.5 .9 .3
Asian 2.9 1.8 1.3 1.4 .5 .3 .5 1.5 1.4 1.1 2.0 .4 .3
Black or African American .6 .8 1.2 .6 .5 1.1 3.5 5.9 4.9 2.6 3.2 1.5 .2
Hispanic white 1.4 .4 .3 .6 .7 .8 2.8 3.5 1.9 1.3 2.1 .6 .3
Non-Hispanic white .8 .4 .4 .3 .4 .5 1.0 2.4 2.5 2.1 3.0 1.0 .4
Other minority2 6.3 3.4 7.8 6.3 1.9 .4 1.1 2.0 2.2 1.2 2.2 .8 .1
Note: First-lien mortgages for one- to four-family, owner-occupied, site-built homes. For a description of how borrowers are categorized by raceand ethnicity, see table 2, note 1. See text for details on how adjusted incidences of higher-priced lending are calculated.1 See table 5, note 1.2 See table 2, note 2.
Residential Mortgage Lending in 2016 19
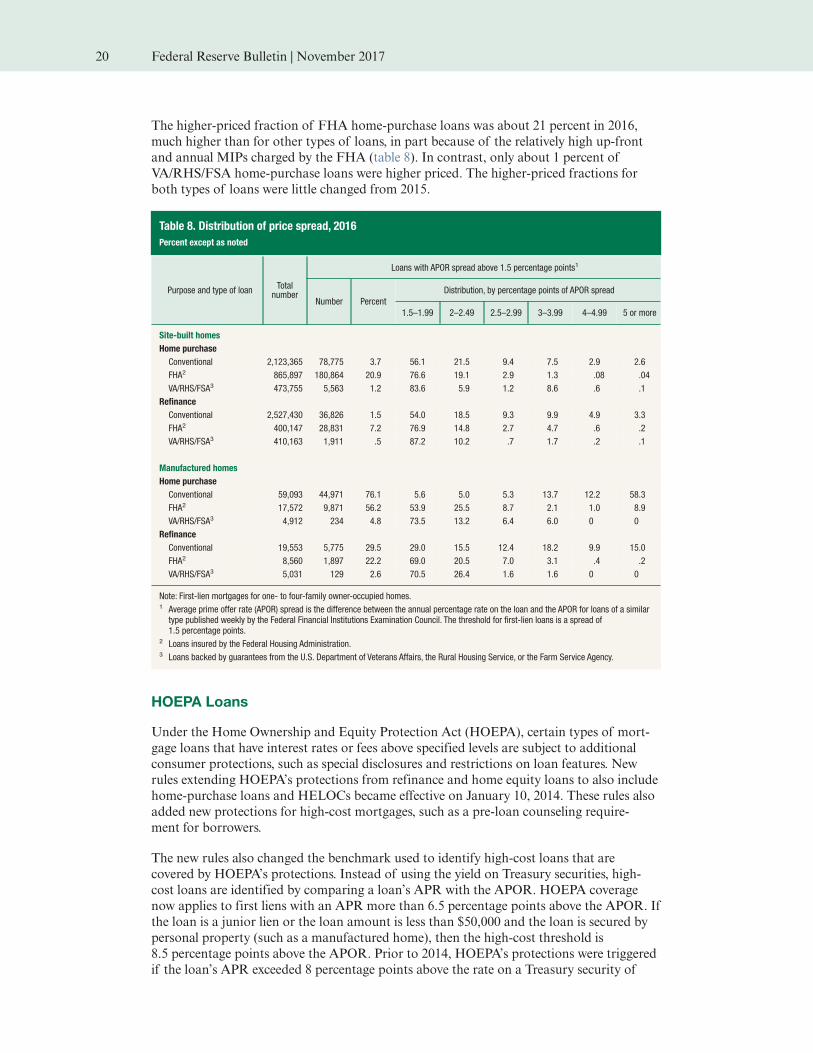
The higher-priced fraction of FHA home-purchase loans was about 21 percent in 2016,
much higher than for other types of loans, in part because of the relatively high up-front
and annual MIPs charged by the FHA (table 8). In contrast, only about 1 percent of
VA/RHS/FSA home-purchase loans were higher priced. The higher-priced fractions for
both types of loans were little changed from 2015.
HOEPA Loans
Under the Home Ownership and Equity Protection Act (HOEPA), certain types of mort-
gage loans that have interest rates or fees above specified levels are subject to additional
consumer protections, such as special disclosures and restrictions on loan features. New
rules extending HOEPA’s protections from refinance and home equity loans to also include
home-purchase loans and HELOCs became effective on January 10, 2014. These rules also
added new protections for high-cost mortgages, such as a pre-loan counseling require-
ment for borrowers.
The new rules also changed the benchmark used to identify high-cost loans that are
covered by HOEPA’s protections. Instead of using the yield on Treasury securities, high-
cost loans are identified by comparing a loan’s APR with the APOR. HOEPA coverage
now applies to first liens with an APR more than 6.5 percentage points above the APOR. If
the loan is a junior lien or the loan amount is less than $50,000 and the loan is secured by
personal property (such as a manufactured home), then the high-cost threshold is
8.5 percentage points above the APOR. Prior to 2014, HOEPA’s protections were triggered
if the loan’s APR exceeded 8 percentage points above the rate on a Treasury security of
Table 8. Distribution of price spread, 2016
Percent except as noted
Purpose and type of loanTotal
number
Loans with APOR spread above 1.5 percentage points1
Number Percent
Distribution, by percentage points of APOR spread
1.5–1.99 2–2.49 2.5–2.99 3–3.99 4–4.99 5 or more
Site-built homes
Home purchase
Conventional 2,123,365 78,775 3.7 56.1 21.5 9.4 7.5 2.9 2.6
FHA2 865,897 180,864 20.9 76.6 19.1 2.9 1.3 .08 .04
VA/RHS/FSA3 473,755 5,563 1.2 83.6 5.9 1.2 8.6 .6 .1
Refinance
Conventional 2,527,430 36,826 1.5 54.0 18.5 9.3 9.9 4.9 3.3
FHA2 400,147 28,831 7.2 76.9 14.8 2.7 4.7 .6 .2
VA/RHS/FSA3 410,163 1,911 .5 87.2 10.2 .7 1.7 .2 .1
Manufactured homes
Home purchase
Conventional 59,093 44,971 76.1 5.6 5.0 5.3 13.7 12.2 58.3
FHA2 17,572 9,871 56.2 53.9 25.5 8.7 2.1 1.0 8.9
VA/RHS/FSA3 4,912 234 4.8 73.5 13.2 6.4 6.0 0 0
Refinance
Conventional 19,553 5,775 29.5 29.0 15.5 12.4 18.2 9.9 15.0
FHA2 8,560 1,897 22.2 69.0 20.5 7.0 3.1 .4 .2
VA/RHS/FSA3 5,031 129 2.6 70.5 26.4 1.6 1.6 0 0
Note: First-lien mortgages for one- to four-family owner-occupied homes.1 Average prime offer rate (APOR) spread is the difference between the annual percentage rate on the loan and the APOR for loans of a similartype published weekly by the Federal Financial Institutions Examination Council. The threshold for first-lien loans is a spread of1.5 percentage points.
2 Loans insured by the Federal Housing Administration.3 Loans backed by guarantees from the U.S. Department of Veterans Affairs, the Rural Housing Service, or the Farm Service Agency.
20 Federal Reserve Bulletin | November 2017

similar term for first liens, and 10 percentage points for junior liens. Finally, under the new
rules, HOEPA coverage is also triggered if the points and fees exceed certain thresholds.43
While HOEPA loans were never a large fraction of the mortgage market, they have become
even rarer since the housing boom. In 2005, lenders reported nearly 36,000 HOEPA loans
(table 9). In 2016, the total was only 1,903 loans, despite the extension of HOEPA protec-
tions to home-purchase loans.44
Lending Institutions
In 2016, there were 6,762 reporting institutions (table 10). The total consisted of 3,805
banks and thrifts (hereafter, banks), of which 3,033 were small, defined as having assets of
less than $1 billion; 1,939 credit unions; 131 mortgage companies affiliated with deposi-
tories (banks and credit unions); and 887 independent mortgage companies.45 Banks
collectively accounted for about 38 percent of all reported mortgage originations; indepen-
dent mortgage companies, about 48 percent; credit unions, about 9 percent; and affiliates,
the remainder. Over the past few years, the share of loans originated by independent mort-
gage companies has risen sharply. In 2016, these lenders originated 53 percent of first-lien
owner-occupant home-purchase loans, up from 50 percent in 2015 and just 35 percent in
2010. Independent mortgage companies also originated 52 percent of first-lien owner-
occupant refinance loans, an increase from 48 percent in 2015.
43 Under the new rules, a loan is also considered high cost if the points and fees exceed 5 percent of the total loanamount for a loan amount equal to or more than $20,000 and 8 percent of the total loan amount or $1,000 fora loan less than $20,000, with the loan amounts adjusted annually for inflation from the base year of 2014.
44 For an analysis of the potential effects of the new HOEPA rule on lending patterns, see Bhutta, Popper, andRingo, “The 2014 Home Mortgage Disclosure Act Data,” in note 29.
45 Data on bank assets were drawn from the Federal Deposit Insurance Corporation Reports of Condition andIncome. The $1 billion threshold is based on the combined assets of all banks within a given banking organiza-tion. Data available in the HMDA Reporter Panel (available at https://www.ffiec.gov/hmda/hmdaflat.htm) canbe used to help identify the various types of institutions. Affiliate institutions include all mortgage companiesknown to be wholly or partially owned by a depository—that is, institutions for which the “other lender code”in the Reporter Panel equals 1, 2, or 5. Most credit unions report to the National Credit Union Administration,except a few large credit unions, which report to the Consumer Financial Protection Bureau.
Table 9. Distribution of HOEPA loans, by characteristic of loan, 2004–16
Percent except as noted
Loans by purpose, lienstatus, property type,
and amount2004 2005 2006 2007 2008 2009 2010 2011 2012 2013 2014 2015 2016
HOEPA loans (total) 24,437 35,985 15,195 10,780 8,577 6,446 3,407 2,373 2,193 1,868 1,271 1,248 1,903
Loan purpose
Home purchase 0 0 0 0 0 0 0 0 0 0 31.4 39.5 58.7
Home improvement 37.7 26.1 42.4 45.4 30.5 31.1 32.6 32.3 31.5 30.1 17.9 14.9 14.9
Refinance 62.3 73.9 57.6 54.6 69.5 68.9 67.4 67.7 68.5 69.9 50.7 45.6 26.3
Lien status
First 55.5 60.5 53.6 52.8 78.5 84.1 83.9 82.8 84.6 84.2 90.3 88.4 90.0
Junior 44.5 39.5 46.4 47.2 21.5 15.9 16.1 17.2 15.4 15.8 9.7 11.6 10.0
Property type
Site built 88.0 91.8 83.7 81.0 72.7 67.8 68.3 65.7 65.7 68.8 75.4 83.3 86.3
Manufactured home 12.0 8.2 16.3 19.0 27.3 32.2 31.7 34.3 34.3 31.2 24.6 16.7 13.7
Loan amount
Less than $50,000 72.4 48.4 72.1 74.3 66.7 72.5 76.5 77.8 75.6 71.3 52.9 36.9 35.0
Greater than $50,000 27.6 51.6 27.9 25.7 33.3 27.5 23.5 22.2 24.4 28.7 47.1 63.1 65.0
Note: Mortgages for one- to four-family homes. HOEPA loans are mortgages with terms that triggered the additional protections provided by theHome Ownership and Equity Protection Act.
Residential Mortgage Lending in 2016 21

Many institutions report little activity. About 43 percent of institutions (2,900 out of 6,762)
reported fewer than 100 mortgage originations in 2016, accounting for about 118,000
originations, or less than 2 percent of all originations. About 15 percent of institutions
originated fewer than 25 loans, in total accounting for about one-tenth of 1 percent of all
originations.46
46 Under changes to the HMDA regulations (Regulation C) finalized in 2015, banks, savings associations, andcredit unions that originated fewer than 25 home-purchase loans (including refinancings of home-purchaseloans) in either 2015 or 2016 will not be subject to HMDA reporting requirements in 2017. Beginning in 2018,lending institutions will not be subject to HMDA reporting requirements unless they originated at least25 covered closed-end mortgage loans or 100 covered open-end lines of credit in each of the two precedingcalendar years. For a more detailed description of these and other changes to Regulation C, see Consumer
Table 10. Lending activity, by type of institution, 2016
Percent except as noted
Institutions and type of activity
Type of institution1
Small bank Large bank Credit unionAffiliatedmortgagecompany
Independentmortgagecompany
All
Number of institutions 3,033 772 1,939 131 887 6,762
Applications (thousands) 894 4,059 1,190 567 7,216 13,926
Originations (thousands) 651 2,573 724 384 4,046 8,378
Purchases (thousands) 23 1,099 18 182 910 2,232
Number of institutions with fewer than 100 loans 1,630 136 1,025 25 84 2,900
Originations (thousands) 66.9 5.9 40.5 .9 3.4 117.5
Number of institutions with fewer than 25 loans 557 39 374 11 37 1,018
Originations (thousands) 7.0 .4 4.5 .1 .4 12.4
Home-purchase loans (thousands)2 246 948 215 210 1,845 3,463
Conventional 71.9 77.3 86.7 58.0 49.1 61.3
Higher-priced share of conventional loans 10.4 2.3 5.0 2.2 3.5 3.7
LMI borrower3 28.1 21.8 25.2 29.2 27.9 26.2
LMI neighborhood4 12.4 12.0 13.2 13.4 15.5 14.1
Non-Hispanic white5 79.1 68.4 69.2 69.6 62.9 66.4
Minority borrower5 13.0 18.7 15.8 17.0 24.5 21.1
Sold6 75.2 71.5 48.2 97.0 97.2 85.5
Refinance loans (thousands)2 179 1,007 277 130 1,744 3,338
Conventional 83.5 91.7 96.0 71.5 62.8 75.7
Higher-priced share of conventional loans 6.2 1.2 2.6 .6 .8 1.5
LMI borrower3 17.1 17.3 21.2 15.6 16.0 16.9
LMI neighborhood4 9.5 10.5 12.8 11.5 13.1 12.0
Non-Hispanic white5 82.2 68.9 68.9 69.3 60.4 65.2
Minority borrower5 8.5 16.9 15.1 14.9 19.6 17.6
Sold6 73.9 70.5 39.6 97.2 98.5 84.0
1 Small banks consist of those banks with assets (including the assets of all other banks in the same banking organization) of less than$1 billion at the end of 2016. Affiliated mortgage companies are nondepository mortgage companies owned by or affiliated with a bankingorganization or credit union.
2 First-lien mortgages for one- to four-family, owner-occupied, site-built homes.3 See table 2, note 3.4 See table 2, note 4.5 See table 2, note 1. “Minority borrower” refers to nonwhite (excluding joint or missing) or Hispanic white applicants.6 Excludes originations made in the last quarter of the year because the incidence of loan sales tends to decline for loans originated toward theend of the year, as lenders report a loan as sold only if the sale occurs within the same year as origination.
Source: FFIEC HMDA data; bank asset data drawn from Federal Deposit Insurance Corporation Reports of Condition and Income(https://www.fdic.gov).
22 Federal Reserve Bulletin | November 2017
Table 10 provides several other statistics to help compare the lending patterns of different
types of institutions in 2016, and we discuss some highlights here. First, depositories tend
to originate a significantly higher fraction of conventional loans than nondepositories.
Second, small banks and credit unions have accounted for a highly disproportionate share
of conventional higher-priced loans in recent years.
Third, independent mortgage companies originated a higher share of their home-purchase
loans to minority borrowers and in LMI neighborhoods than other types of lenders.
Fourth, large banks originate a significantly lower share of home-purchase mortgages to
LMI borrowers compared with other types of lenders. In a supplementary analysis, we
show that much of the decline in lending by large banks to LMI borrowers in recent years
can be explained by their decreasing share of FHA-guaranteed mortgages, which are more
likely to be originated to LMI borrowers.47
Finally, the HMDA data provide information on whether originated loans were sold within
the same calendar year and the type of institution to which they were sold, such as one of
the GSEs or a banking institution (see appendix A for a full list of purchaser types).
Table 10 displays the fraction of loans sold within the calendar year, as opposed to being
held in portfolio.48 Nondepositories sold virtually all of their loans in 2016. In contrast,
credit unions sold about one-half of the home-purchase loans they originated and about
40 percent of the refinance loans they originated. That said, portfolio lending among
depositories has declined significantly over the longer term.49
Table 11 lists the top 25 reporting institutions according to their total number of origina-
tions, along with the same set of lending characteristics as those listed in table 10.50 Wells
Fargo reported the most originations, with about 438,000.51 The next-highest total was for
Quicken Loans, followed by JPMorgan Chase (JPMC) and Bank of America. Overall, the
top 25 lenders accounted for about 34 percent of all loan originations in 2016, up slightly
from 33 percent in 2015. These same firms also provided additional funding by purchasing
over 1.2 million loans from other lending institutions during 2016 (these loans could have
been originated in 2015 or in earlier years), equal to about 43 percent of the number of
loans they originated during the year.
The top institutions differ significantly in their lending patterns. Some of this variation
reflects differences between types of institutions, which were discussed earlier. For example,
Financial Protection Bureau (2015), “New Rule Summary: Home Mortgage Disclosure (Regulation C),”October 15, http://files.consumerfinance.gov/f/201510_cfpb_hmda-executive-summary.pdf.
47 See Bhutta, Laufer, and Ringo, “Decline in Lending to Lower-Income Borrowers,” in note 8.48 Because loan sales are recorded in the HMDA data only if the loans are originated and sold in the same
calendar year, loans originated toward the end of the year are less likely to be reported as sold. For that reason,statistics on loan sales are computed using only loans originated during the first three quarters of the year.
49 See table 13 in Bhutta, Popper, and Ringo, “The 2014 Home Mortgage Disclosure Act Data,” in note 29.50 Some institutions may be part of a larger organization; however, the data in table 11 are at the reporter level.
Because affiliate activity has declined markedly since the housing boom, a top 25 list at the organization level isnot likely to be significantly different. SunTrust is one notable exception. Combined mortgage originationsacross its bank and mortgage affiliates totaled about 75,000.
51 Notably, loan counts and market shares derived from the HMDA data can differ markedly from market sharesbased on information compiled by Inside Mortgage Finance. For HMDA reporting purposes, institutionsreport only mortgage applications in which they make the credit decision. Under HMDA, if an application isapproved by a third party (such as a correspondent) rather than the lending institution, then that party reportsthe loan as its own origination and the lending institution reports the loan as a purchased loan. Alternatively, ifa third party forwards an application to the lending institution for approval, then the lending institutionreports the application under HMDA (and the third party does not report anything). In contrast, Inside Mort-gage Finance considers loans to have been originated by the acquiring institution even if a third party makesthe credit decision. Thus, many of the larger lending organizations that work with sizable networks of corre-spondents report considerable volumes of purchased loans in the HMDA data, while Inside Mortgage Financeconsiders many of these purchased loans to be originations.
Residential Mortgage Lending in 2016 23

table 11 shows that large banks like Bank of America have a higher share of conventional
mortgages and a smaller share of lending in LMI neighborhoods compared with indepen-
dent mortgage companies like Quicken Loans.
In addition to the variation across lender types, there is substantial variation in lending
patterns within lender types. For example, regarding large banks, about 97 percent of
JPMC’s home-purchase loans were conventional, compared with about 82 percent for U.S.
Bank. There is also significant variation among the large banks in the fraction of loans
sold, with Wells Fargo selling almost 73 percent of its home-purchase originations,
compared with less than 46 percent for Bank of America.
Table 11. Top 25 respondents in terms of total originations, 2016
Percent except as noted
RespondentInstitutiontype1
Totalorigin-ations
(thousands)
Totalpurchases(thousands)
Home-purchase loans2
Number(thous-ands)
Con-ven-tional
Higherpriced3
LMIbor-rower4
LMIneigh-bor-hood5
Non-Hispanicwhite6
Minorityborrower6
Sold7
Wells Fargo Bank, NA Large bank 438 513 154 85.1 2.2 16.2 11.2 66.4 21.2 72.9
Quicken Loans, Inc. Ind. mort. co. 436 0 89 52.8 .5 29.1 14.8 53.2 13.6 99.9
JPMorgan Chase Bank, NA Large bank 185 154 56 96.7 .8 10.9 8.8 60.5 23.0 47.7
Bank of America, NA Large bank 159 30 47 91.1 .1 15.4 10.9 58.7 30.2 45.7
Freedom Mortgage Corp. Ind. mort. co. 155 87 22 33.5 1.9 29.0 17.2 55.2 32.1 99.7
loanDepot.com Ind. mort. co. 133 0 36 58.6 3.4 18.6 14.4 52.5 28.8 98.7
U.S. Bank, NA Large bank 122 139 34 82.4 1.2 26.7 11.8 68.3 13.5 75.8
Caliber Home Loans, Inc. Ind. mort. co. 108 49 65 52.6 4.2 30.4 16.2 60.2 25.7 99.8
Flagstar Bank, FSB Large bank 103 18 43 53.3 2.8 24.7 13.4 65.6 25.8 98.3
United Shore FinancialServices, LLC
Ind. mort. co. 83 0 32 84.3 2.2 27.1 14.6 60.2 29.7 98.7
Fairway IndependentMortgage Corp.
Ind. mort. co. 73 0 52 51.7 4.1 31.3 15.0 70.8 18.4 99.7
Nationstar Mortgage Ind. mort. co. 70 29 1 74.5 2.4 16.1 13.8 48.9 19.7 90.9
Guild Mortgage Co. Ind. mort. co. 67 3 38 47.1 5.0 28.7 18.0 57.8 20.3 99.9
USAA Federal Savings Bank Large bank 67 0 42 31.1 .1 14.0 10.5 65.1 15.7 96.6
Guaranteed Rate, Inc. Ind. mort. co. 65 0 32 73.8 1.8 21.2 14.1 71.2 17.4 100.0
PrimeLending, aPlainsCapital Company
Affiliatedmort. co.
64 1 44 57.9 4.5 28.8 14.1 67.3 17.8 99.9
Navy Federal Credit Union Credit union 64 0 29 42.3 26.5 19.8 12.6 55.8 23.2 56.4
PNC Bank, NA Large bank 64 1 17 74.2 .0 30.5 13.8 61.1 13.5 83.1
Finance of America Mortgage Ind. mort. co. 62 0 30 48.9 1.4 24.7 18.6 61.6 24.7 99.9
Citibank, NA Large bank 55 22 17 97.9 .0 16.0 16.6 37.3 38.7 51.3
Movement Mortgage, LLC Ind. mort. co. 54 0 43 46.0 3.8 30.8 16.7 68.7 24.7 87.8
Stearns Lending, Inc. Ind. mort. co. 54 40 27 47.6 2.5 26.7 17.5 59.4 28.8 100.0
SunTrust Mortgage, Inc. Affiliatedmort. co.
51 59 16 87.1 .2 16.5 10.8 62.4 17.8 98.9
Ditech Financial, LLC Ind. mort. co. 47 58 3 78.4 1.2 23.9 13.3 75.0 16.2 98.0
Mortgage ResearchCenter, LLC
Ind. mort. co. 46 0 36 1.6 .0 28.2 14.0 61.7 21.9 100.0
Top 25 institutions … 2,828 1,203 1,004 62.6 2.8 23.2 13.7 62.0 22.0 86.3
All institutions … 8,378 2,232 3,463 61.3 3.7 26.2 14.1 66.4 21.1 85.5
1 See table 10, note 1.2 First-lien mortgages for one- to four-family, owner-occupied, site-built homes.3 Share of conventional loans that are higher priced.4 See table 2, note 3.5 See table 2, note 4.6 See table 2, note 1. “Minority borrower” refers to nonwhite (excluding joint or missing) or Hispanic white applicants.7 See table 10, note 6.
. . . Not applicable.
Source: FFIEC HMDA data; bank asset data drawn from Federal Deposit Insurance Corporation Reports of Condition and Income (https://www.fdic.gov).
(continued on next page)
24 Federal Reserve Bulletin | November 2017

Finally, the composition of borrowers varied across the top 25 institutions, both within and
across lender types. For some institutions, more than 30 percent of home-purchase
borrowers were LMI, while at other institutions, fewer than 20 percent of borrowers were
in that category.52 Although it is difficult to know precisely why such variation exists, these
differences could reflect different business strategies or different customer demands in the
markets and geographic regions the institutions serve, among other possibilities.
52 Note that for lenders with a significant nonconventional share of refinance loans (for example, FreedomMort-gage Corporation), borrower income may not be reported for most loans, thus pushing down the LMI share ofborrowers.
Table 11. Top 25 respondents in terms of total originations, 2016–continued
Percent except as noted
RespondentInstitutiontype1
Refinance loans2
Number(thous-ands)
Con-ven-tional
Higherpriced3
LMIbor-rower4
LMIneigh-bor-hood5
Non-Hispanicwhite6
Minorityborrower6
Sold7
Wells Fargo Bank, NA Large bank 195 88.7 1.0 16.8 11.2 66.9 19.7 88.1
Quicken Loans, Inc. Ind. mort. co. 325 67.2 .1 23.3 13.0 46.6 10.8 100.0
JPMorgan Chase Bank, NA Large bank 102 97.2 .8 16.6 9.7 65.5 20.3 60.9
Bank of America, NA Large bank 88 99.5 .1 19.1 11.5 63.1 24.9 61.0
Freedom Mortgage Corp. Ind. mort. co. 123 10.6 .0 4.1 15.1 59.6 24.4 99.8
loanDepot.com Ind. mort. co. 88 64.5 1.9 16.7 12.1 65.0 18.0 99.9
U.S. Bank, NA Large bank 62 95.9 3.1 20.9 12.3 65.7 12.8 43.8
Caliber Home Loans, Inc. Ind. mort. co. 31 72.0 .9 15.4 11.9 63.9 20.1 99.9
Flagstar Bank, FSB Large bank 47 76.5 .7 13.1 11.0 61.7 27.3 97.6
United Shore FinancialServices, LLC
Ind. mort. co. 42 96.1 .2 13.9 11.1 59.0 27.8 98.9
Fairway Independent MortgageCorp.
Ind. mort. co. 13 80.3 .6 16.3 10.9 76.1 11.8 99.9
Nationstar Mortgage Ind. mort. co. 59 72.2 1.2 9.8 17.2 59.9 25.6 99.9
Guild Mortgage Co. Ind. mort. co. 17 68.8 .2 17.5 15.6 64.2 16.5 100.0
USAA Federal Savings Bank Large bank 20 33.9 .1 6.4 9.5 60.7 18.4 90.9
Guaranteed Rate, Inc. Ind. mort. co. 25 93.4 .4 11.3 9.7 75.4 13.1 100.0
PrimeLending, a PlainsCapitalCompany
Affiliatedmort. co.
12 89.1 1.3 17.1 10.7 73.6 14.0 99.9
Navy Federal Credit Union Credit union 17 49.8 2.2 12.9 11.1 54.4 25.6 62.8
PNC Bank, NA Large bank 30 90.6 .0 25.3 12.1 67.1 11.6 58.6
Finance of America Mortgage Ind. mort. co. 26 81.3 .0 14.4 13.8 62.6 24.3 99.9
Citibank, NA Large bank 28 97.1 .0 19.9 12.2 56.3 20.0 82.1
Movement Mortgage, LLC Ind. mort. co. 6 78.4 .5 19.6 12.5 75.8 17.5 77.3
Stearns Lending, Inc. Ind. mort. co. 22 69.4 .2 14.4 13.6 62.6 24.4 100.0
SunTrust Mortgage, Inc. Affiliatedmort. co.
29 89.5 .1 18.9 10.6 63.8 15.0 99.1
Ditech Financial, LLC Ind. mort. co. 34 94.9 .0 36.4 16.8 65.0 19.8 99.8
Mortgage Research Center, LLC Ind. mort. co. 10 1.6 .0 7.3 12.1 62.9 20.6 99.9
Top 25 institutions … 1,453 74.1 .6 17.3 12.4 60.1 18.5 88.9
All institutions … 3,338 75.7 1.5 16.9 12.0 65.2 17.6 84.0
Residential Mortgage Lending in 2016 25
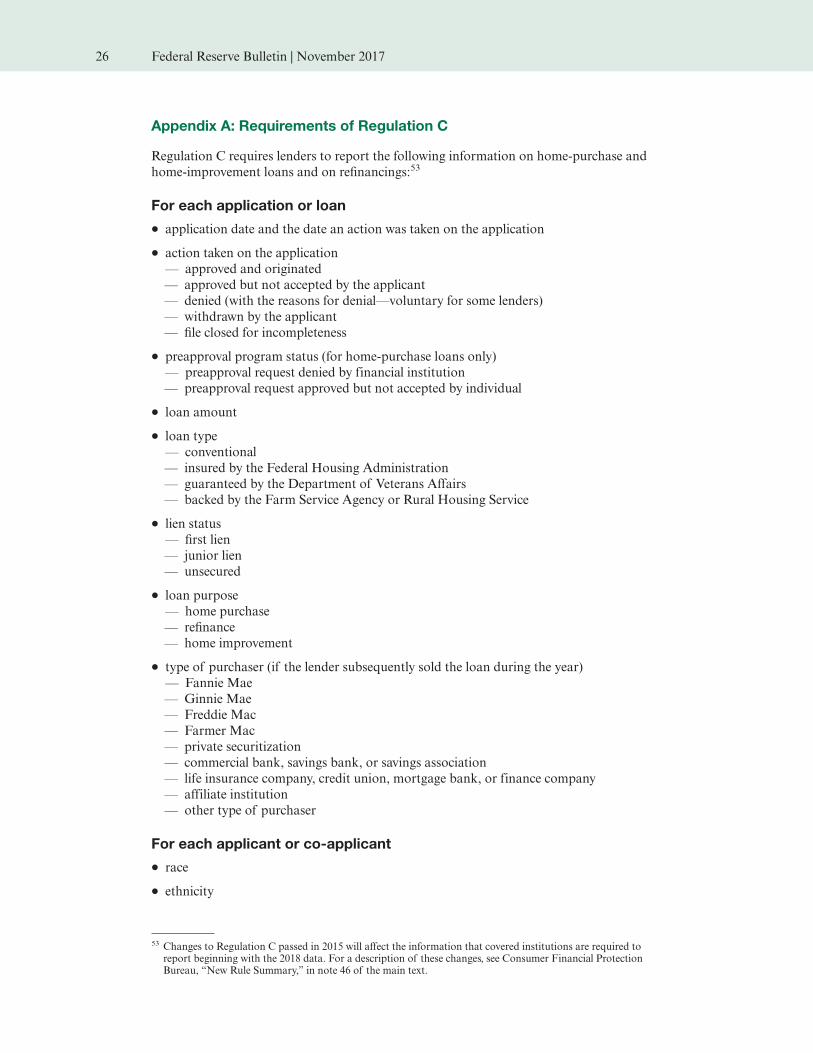
Appendix A: Requirements of Regulation C
Regulation C requires lenders to report the following information on home-purchase and
home-improvement loans and on re�nancings:53
For each application or loan
‰ application date and the date an action was taken on the application
‰ action taken on the application
— approved and originated
— approved but not accepted by the applicant
— denied (with the reasons for denial—voluntary for some lenders)
— withdrawn by the applicant
— �le closed for incompleteness
‰ preapproval program status (for home-purchase loans only)
— preapproval request denied by financial institution
— preapproval request approved but not accepted by individual
‰ loan amount
‰ loan type
— conventional
— insured by the Federal Housing Administration
— guaranteed by the Department of Veterans Affairs
— backed by the Farm Service Agency or Rural Housing Service
‰ lien status
— �rst lien
— junior lien
— unsecured
‰ loan purpose
— home purchase
— re�nance
— home improvement
‰ type of purchaser (if the lender subsequently sold the loan during the year)
— Fannie Mae
— Ginnie Mae
— Freddie Mac
— Farmer Mac
— private securitization
— commercial bank, savings bank, or savings association
— life insurance company, credit union, mortgage bank, or finance company
— affiliate institution
— other type of purchaser
For each applicant or co-applicant
‰ race
‰ ethnicity
53 Changes to Regulation C passed in 2015 will affect the information that covered institutions are required toreport beginning with the 2018 data. For a description of these changes, see Consumer Financial ProtectionBureau, “New Rule Summary,” in note 46 of the main text.
26 Federal Reserve Bulletin | November 2017

‰ sex
‰ income relied on in credit decision
For each property
‰ location, by state, county, metropolitan statistical area, and census tract
‰ type of structure
— one- to four-family dwelling
— manufactured home
— multifamily property (dwelling with �ve or more units)
‰ occupancy status (owner occupied, non-owner occupied, or not applicable)
For loans subject to price reporting
‰ spread above comparable Treasury security for applications taken prior to
October 1, 2009
‰ spread above average prime offer rate for applications taken on or after October 1, 2009
For loans subject to the Home Ownership and Equity Protection Act
‰ indicator of whether loan is subject to the Home Ownership and Equity Protection Act
Residential Mortgage Lending in 2016 27