
RESIDENTIAL MARKET ANALYSIS - pdx.edu Residential - Terry.pdfRESIDENTIAL MARKET ANALYSIS ......
28
■ Clancy Terry is a Master of Real Estate Development candidate through a joint program of Portland State University’s School of Business Administration and School of Urban Studies and Planning. He is the 2015 RMLS Student Fellow at PSU’s Center for Real Estate. Any errors or omissions are the author’s responsibility. Any opinions expressed are those of the author solely and do not represent the opinions of any other person or entity. Center for Real Estate Quarterly Report, vol. 9, no. 1. Winter 2015 27 RESIDENTIAL MARKET ANALYSIS CLANCY TERRY RMLS Student Fellow Master of Real Estate Development Candidate As the U.S. economy continued its recovery from recession during the closing months of 2014, a number of noteworthy trends played out in housing markets. Several market measures declined in the fourth quarter both nationally and in Oregon, but this is typical as temperatures decline at the end of each calendar year. RealtyTrac’s reports that during 2014, 49.5 million residential homes were mortgaged—a portfolio whose aggregate negative equity totaled an estimated $1.4 trillion for the year. While this number has been falling since its peak in the second quarter of 2012, the longer it persists on household balance sheets, the greater concern becomes over default risk. RealtyTrac indicates this is because “seriously underwater homeowners are more than 2.5 times more likely to fall into foreclosure than the overall population of homeowners with a mortgage, and they are nearly 9 times more likely to fall into foreclosure than homeowners who have at least 50 percent equity in their homes, RealtyTrac data shows.” RealtyTrac pegs the population of seriously underwater borrowers—those with a loan-to-value of 125 percent or more—at approximately 8.1 million, or 15 percent of total mortgage holders. Additionally, another 8.4 million borrowers are reported to
Transcript of RESIDENTIAL MARKET ANALYSIS - pdx.edu Residential - Terry.pdfRESIDENTIAL MARKET ANALYSIS ......

■ Clancy Terry is a Master of Real Estate Development candidate through a joint program of Portland State University’s School of Business Administration and School of Urban Studies and Planning. He is the 2015 RMLS Student Fellow at PSU’s Center for Real Estate. Any errors or omissions are the author’s responsibility. Any opinions expressed are those of the author solely and do not represent the opinions of any other person or entity. Center for Real Estate Quarterly Report, vol. 9, no. 1. Winter 2015 27
RESIDENTIAL MARKET ANALYSIS
CLANCY TERRY
RMLS Student Fellow Master of Real Estate Development Candidate
As the U.S. economy continued its recovery from recession during the closing months of 2014, a number of noteworthy trends played out in housing markets. Several market measures declined in the fourth quarter both nationally and in Oregon, but this is typical as temperatures decline at the end of each calendar year.
RealtyTrac’s reports that during 2014, 49.5 million residential homes were mortgaged—a portfolio whose aggregate negative equity totaled an estimated $1.4 trillion for the year. While this number has been falling since its peak in the second quarter of 2012, the longer it persists on household balance sheets, the greater concern becomes over default risk. RealtyTrac indicates this is because “seriously underwater homeowners are more than 2.5 times more likely to fall into foreclosure than the overall population of homeowners with a mortgage, and they are nearly 9 times more likely to fall into foreclosure than homeowners who have at least 50 percent equity in their homes, RealtyTrac data shows.”
RealtyTrac pegs the population of seriously underwater borrowers—those with a loan-to-value of 125 percent or more—at approximately 8.1 million, or 15 percent of total mortgage holders. Additionally, another 8.4 million borrowers are reported to

HOUSING MARKET ANALYSIS TERRY 28
have “resurfacing equity,” with LTV rates between 90 percent and 110 percent. In contrast, a healthy housing market, has about 5 percent of homeowners underwater.
RealtyTrac agrees with a recent publication from UC Berkeley’s Haas Institute for a Fair and Inclusive Society that recent appreciation in home prices is mitigating negative equity to only a limited extent. The federal HAMP and HARP distressed borrower programs also had anemic overall impacts on total negative equity, and academic economists Atif Mian and Amir Sufi argue a principal reduction strategy would more effectively make inroads within this upside-down segment.
Axiometrics reports that U.S. housing starts totaled 1,009,000 units at a seasonally adjusted annual rate in October 2014, a rise of 7.8 percent over the same month last year. Single family saw a 15.4 percent increase over last year.
Berlinberg Properties reports 4.93 million existing home sales in the U.S. in November 2014, a 2.3 percent increase over the same time last year. The median home price came in at $205,300 in November 2014, approximately 5 percent higher than November 2013. Berlinberg says, “In 2014, we’ve seen housing prices return to sustainable growth rates in the 4-6% range. This pattern will likely continue in 2015, with some potential for slightly lower year-over-year gains, depending on how inventory and new home construction develop next year.” In terms of inventory, 2.09 million homes were on the market in November 2014, a 2 percent year-over-year increase representing 5.1 months of supply. Regarding the 1.1 percent drop in median price, Berlinberg suggests this “may be due in part to some uncertainty in equity markets as oil prices continued to fall in November. Anticipation of a continued drop in mortgage rates may also have played a role, as rates have

HOUSING MARKET ANALYSIS TERRY 29
continued to decline despite already having dipped below the previous year’s rates.” He presents Freddie Mac’s snapshot of mortgage interest rates as follows, suggesting concerns over global growth and other global events may be exerting downward pressure:
Product Rate
30-year fixed 3.80% 15-year fixed 3.09% 5/1 ARM 2.95% Historical Average 8.90%
RealtyTrac reports that the share of existing home buyers purchasing their first home fell to 33 percent in 2014 from 38 percent in 2013. The National Association of Realtors indicates that this is the lowest since 1987. RealtyTrac also reports the following:
• “Mortgage originations hit a 13-year low in November, with 2014 on pace to be the weakest year for new loans since 2001, according to the Federal Reserve Bank of New York. According to the Federal Reserve report, mortgage lending has averaged $357 billion per quarter over the prior quarters, the lowest since 2001. Unless the fourth quarter is unusually strong—and housing typically slows in the winter—that will leave 2014 as the worst year for mortgage volume since 2000. Most of the decline has been driven by the falloff in refinancing. But the Fed data doesn’t separate refinancing from purchase mortgages.”
• HELOC originations are up. Nearly 800,000 HELOCs were originated in the 12 months ending June 2014, up 20.6 percent from a year prior. During the first eight months of 2014, HELOC originations represented 15 percent of all loan originations across the U.S., a market share not seen since 2008.
• “Thanks to stagnant wages and rising costs, nearly 40 million Americans are spending over 30 percent of their income on housing payments, property taxes and other home expenses, according to a survey of 10,000 U.S. households conducted by the Demand Institute. After the housing bubble burst in 2008, a spike in foreclosures forced millions of Americans to start renting. That sent rents soaring by more than 25 percent since 2005, according to the Census Bureau. Since wages have been relatively stagnant it also meant that renters were spending a larger percentage of their income on housing costs each month. ‘Home ownership has become more affordable but many renters have still been unable to transition into homeowners,’ said Jeremy Burbank, vice president of the Demand Institute. Demand’s survey found that the hardest hit group has been the Millennial generation. The survey found that heavy student loan debt and lack of well paying jobs have many Millennials postponing home buying.
HOUSING MARKET ANALYSIS TERRY 30
• Single-family construction starts fell in November in the U.S. by 5.4 percent to a seasonally adjusted rate of 677,000. In the same period, permits for single-family housing dropped 1.2 percent to a 639,000 unit rate.
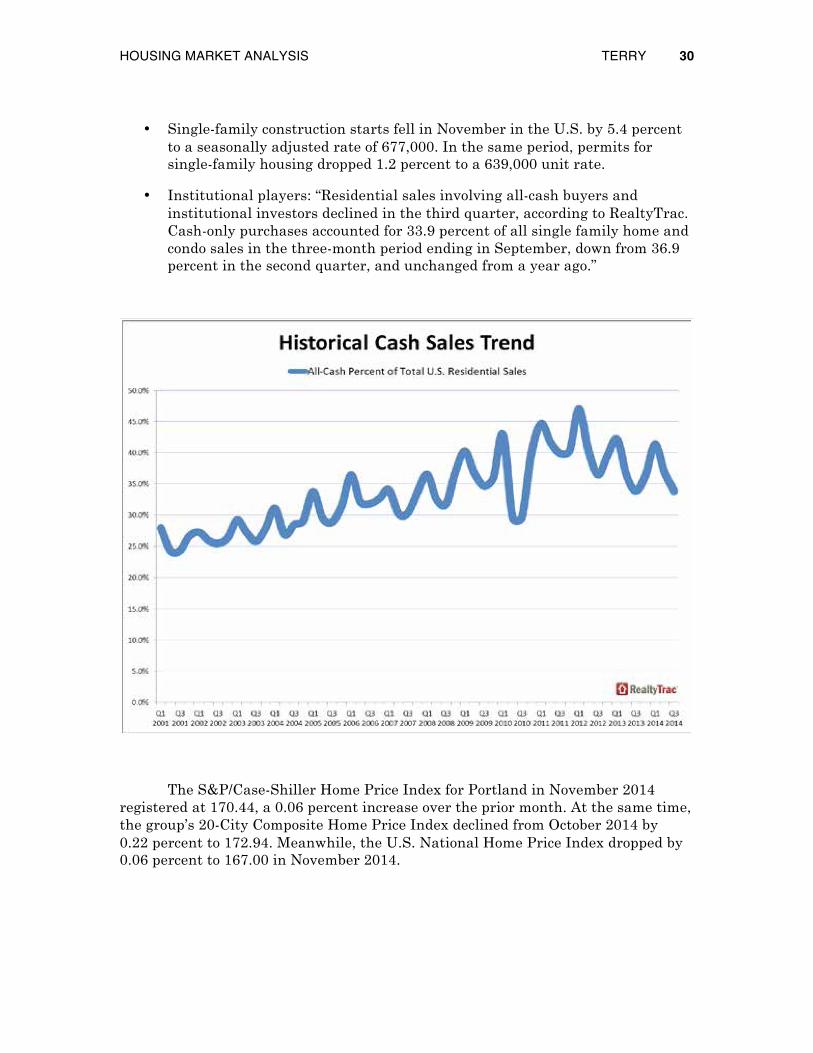
• Institutional players: “Residential sales involving all-cash buyers and institutional investors declined in the third quarter, according to RealtyTrac. Cash-only purchases accounted for 33.9 percent of all single family home and condo sales in the three-month period ending in September, down from 36.9 percent in the second quarter, and unchanged from a year ago.”
The S&P/Case-Shiller Home Price Index for Portland in November 2014 registered at 170.44, a 0.06 percent increase over the prior month. At the same time, the group’s 20-City Composite Home Price Index declined from October 2014 by 0.22 percent to 172.94. Meanwhile, the U.S. National Home Price Index dropped by 0.06 percent to 167.00 in November 2014.

HOUSING MARKET ANALYSIS TERRY 31
-10%
0%
10%
20%
30%
40%
50%
60%
70% 20
03
2004
2005
2006
2007
2008
2009
2010
2011
2012
2013
2014
2015
Case-Shiller Price Index Portland and 20-City Average
Portland
20-City Avg.

HOUSING MARKET ANALYSIS TERRY 32
BUILDING PERMITS
In January, the Oregon Office of Economic Analysis provided an economic forecast for the state. Their research finds that currently 1 housing permit is issued in the Portland Metropolitan Statistical Area (MSA) for every 2.3 new residents. In addition, unlike other places in the U.S., Portland did not overbuild by much during the boom, and in fact suggests a degree of underbuilding may be binding the local housing market today in terms of constrained supply. The analysis also points out the housing bust was greater in magnitude than the boom that it “corrected.”
The Office of Economic Analysis reports that household formation in Oregon is currently in a positive growth cycle, but is still relatively constrained due to poor wage growth, slower immigration, lower marriage rates, limited access to credit, degraded mobility, and student loan burdens.
HOUSING MARKET ANALYSIS TERRY 33
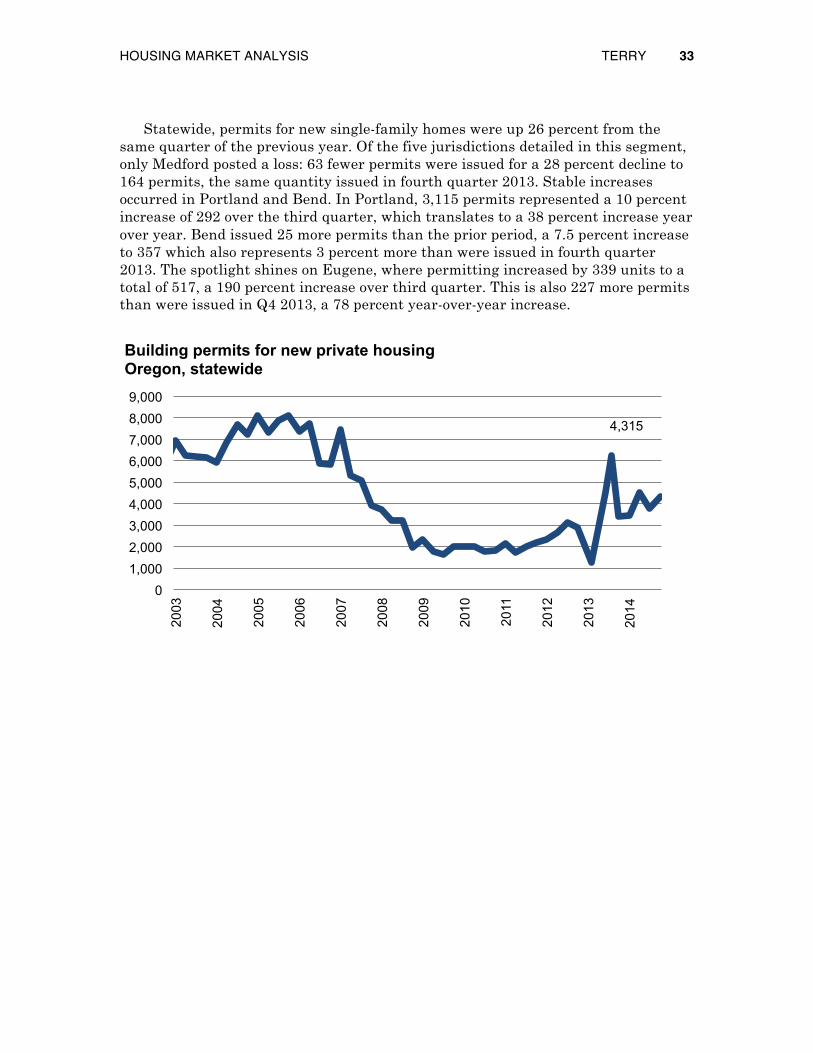
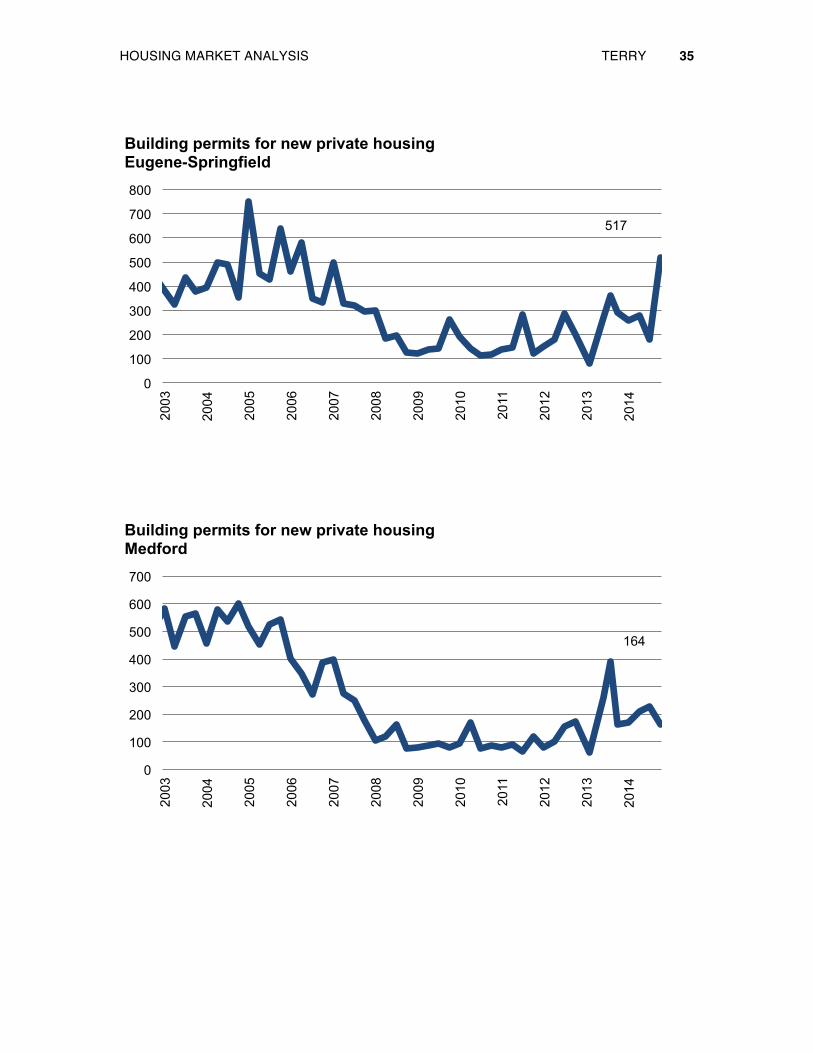
Statewide, permits for new single-family homes were up 26 percent from the same quarter of the previous year. Of the five jurisdictions detailed in this segment, only Medford posted a loss: 63 fewer permits were issued for a 28 percent decline to 164 permits, the same quantity issued in fourth quarter 2013. Stable increases occurred in Portland and Bend. In Portland, 3,115 permits represented a 10 percent increase of 292 over the third quarter, which translates to a 38 percent increase year over year. Bend issued 25 more permits than the prior period, a 7.5 percent increase to 357 which also represents 3 percent more than were issued in fourth quarter 2013. The spotlight shines on Eugene, where permitting increased by 339 units to a total of 517, a 190 percent increase over third quarter. This is also 227 more permits than were issued in Q4 2013, a 78 percent year-over-year increase.
4,315
0 1,000 2,000 3,000 4,000 5,000 6,000 7,000 8,000 9,000
2003
2004
2005
2006
2007
2008
2009
2010
2011
2012
2013
2014
Building permits for new private housing Oregon, statewide

HOUSING MARKET ANALYSIS TERRY 34
3,115
0 500
1,000 1,500 2,000 2,500 3,000 3,500 4,000 4,500 5,000
2003
2004
2005
2006
2007
2008
2009
2010
2011
2012
2013
2014
Building permits for new private housing Portland-Vancouver-Beaverton MSA
357
0
200
400
600
800
1,000
1,200
1,400
2003
2004
2005
2006
2007
2008
2009
2010
2011
2012
2013
2014
Building permits for new private housing Bend
HOUSING MARKET ANALYSIS TERRY 35
517
0
100
200
300
400
500
600
700
800
2003
2004
2005
2006
2007
2008
2009
2010
2011
2012
2013
2014
Building permits for new private housing Eugene-Springfield
164
0
100
200
300
400
500
600
700
2003
2004
2005
2006
2007
2008
2009
2010
2011
2012
2013
2014
Building permits for new private housing Medford
HOUSING MARKET ANALYSIS TERRY 36
PORTLAND
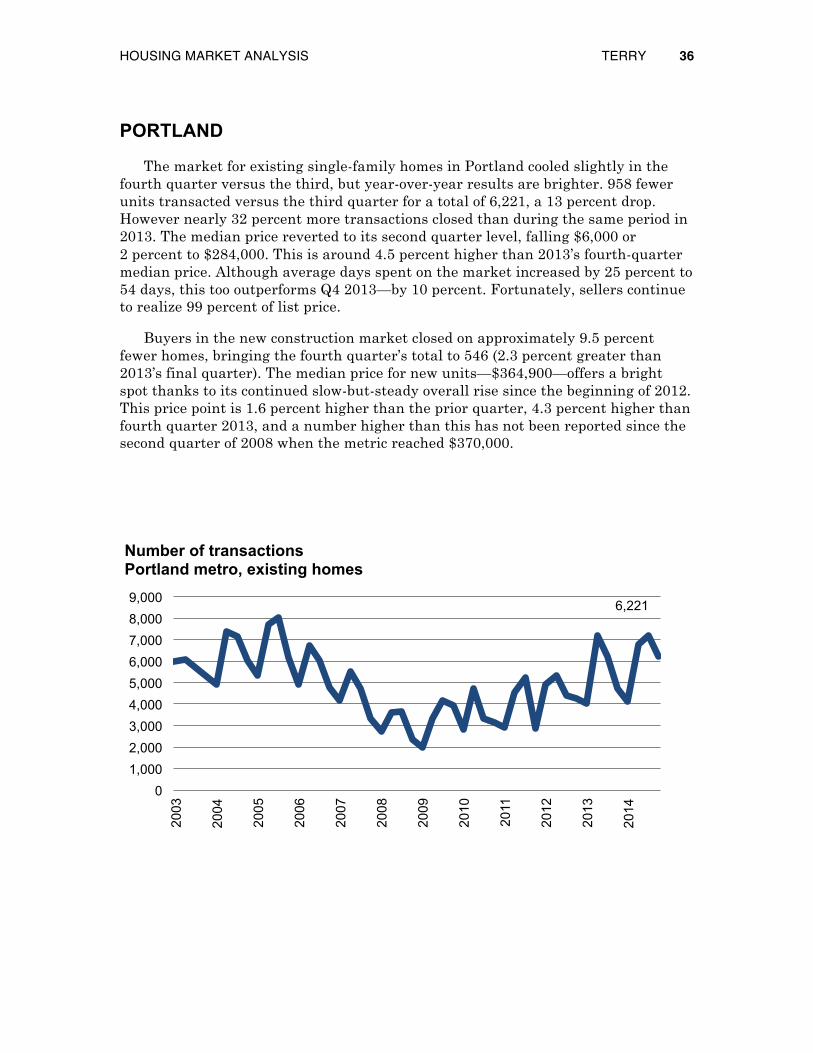
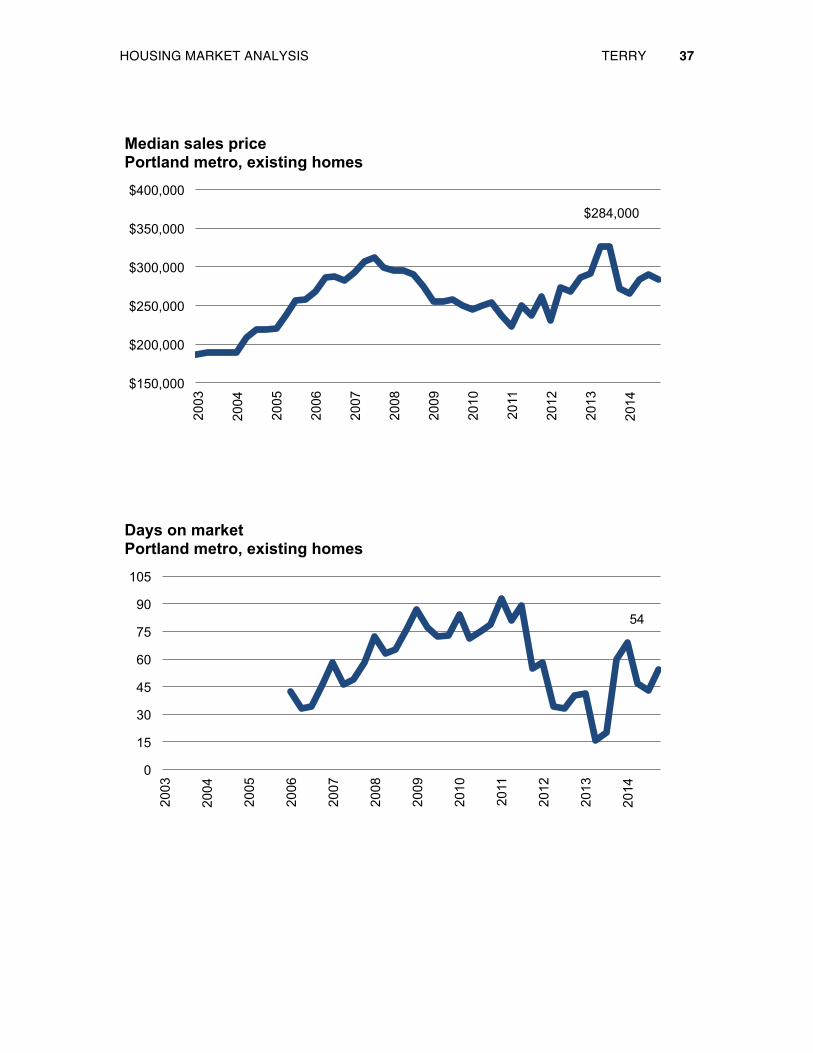
The market for existing single-family homes in Portland cooled slightly in the fourth quarter versus the third, but year-over-year results are brighter. 958 fewer units transacted versus the third quarter for a total of 6,221, a 13 percent drop. However nearly 32 percent more transactions closed than during the same period in 2013. The median price reverted to its second quarter level, falling $6,000 or 2 percent to $284,000. This is around 4.5 percent higher than 2013’s fourth-quarter median price. Although average days spent on the market increased by 25 percent to 54 days, this too outperforms Q4 2013—by 10 percent. Fortunately, sellers continue to realize 99 percent of list price.
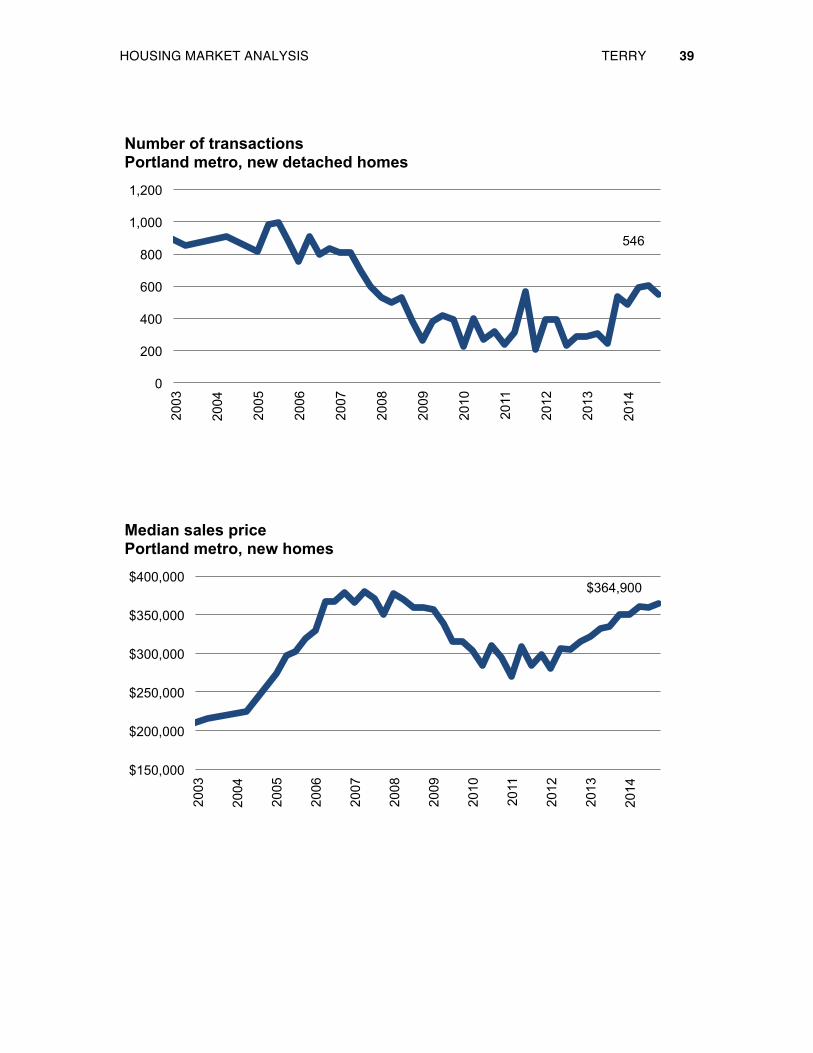
Buyers in the new construction market closed on approximately 9.5 percent fewer homes, bringing the fourth quarter’s total to 546 (2.3 percent greater than 2013’s final quarter). The median price for new units—$364,900—offers a bright spot thanks to its continued slow-but-steady overall rise since the beginning of 2012. This price point is 1.6 percent higher than the prior quarter, 4.3 percent higher than fourth quarter 2013, and a number higher than this has not been reported since the second quarter of 2008 when the metric reached $370,000.
6,221
0 1,000 2,000 3,000 4,000 5,000 6,000 7,000 8,000 9,000
2003
2004
2005
2006
2007
2008
2009
2010
2011
2012
2013
2014
Number of transactions Portland metro, existing homes
HOUSING MARKET ANALYSIS TERRY 37
$284,000
$150,000
$200,000
$250,000
$300,000
$350,000
$400,000 20
03
2004
2005
2006
2007
2008
2009
2010
2011
2012
2013
2014
Median sales price Portland metro, existing homes
54
0
15
30
45
60
75
90
105
2003
2004
2005
2006
2007
2008
2009
2010
2011
2012
2013
2014
Days on market Portland metro, existing homes

HOUSING MARKET ANALYSIS TERRY 38
99%
85%
90%
95%
100%
105% 20
03
2004
2005
2006
2007
2008
2009
2010
2011
2012
2013
2014
Ratio of sales price to list price Portland metro, existing homes
HOUSING MARKET ANALYSIS TERRY 39
546
0
200
400
600
800
1,000
1,200 20
03
2004
2005
2006
2007
2008
2009
2010
2011
2012
2013
2014
Number of transactions Portland metro, new detached homes
$364,900
$150,000
$200,000
$250,000
$300,000
$350,000
$400,000
2003
2004
2005
2006
2007
2008
2009
2010
2011
2012
2013
2014
Median sales price Portland metro, new homes

HOUSING MARKET ANALYSIS TERRY 40
VANCOUVER/CLARK COUNTY
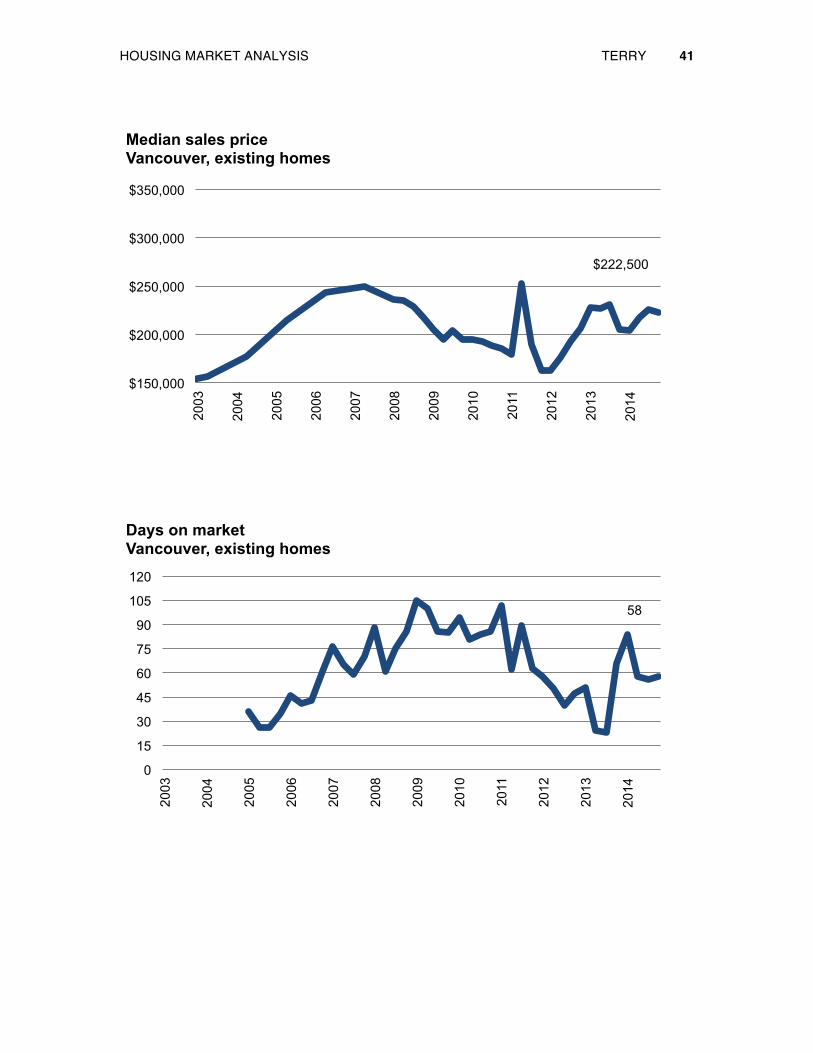
Trends in Vancouver’s and Clark County’s existing housing stock resembled those in Portland during the fourth quarter of 2014. Transactions in Vancouver dropped by 223 from the third quarter to 915, a decrease of almost 20 percent. Compared to the fourth quarter of 2013, however, nearly 28 percent more closings were booked. Vancouver’s median price contracted by around 1.5 percent or $3,500 to $222,500, yet this is $17,500 greater year over year. Average days on market increased by 2 to 58, returning to the same total seen in the second quarter of 2014; this is 8 days faster than fourth quarter 2013.
Against third quarter 2014, Clark County excluding Vancouver showed a more modest decrease in number of transactions but a steeper drop in prices relative to the same metrics in Vancouver proper. Transactions decreased by 81 or 11 percent to 680 units, yet this is 28 percent higher than the same period a year earlier. The median price fell by 5 percent or $14,550 to $259,450, yet this is 5 percent better than Q4 2013’s $246,950. Houses averaged 75 days on the market, 7 more days than in the prior period but exactly the same as fourth quarter 2013.
915
0
250
500
750
1,000
1,250
1,500
2003
2004
2005
2006
2007
2008
2009
2010
2011
2012
2013
2014
Number of transactions Vancouver, existing homes
HOUSING MARKET ANALYSIS TERRY 41
$222,500
$150,000
$200,000
$250,000
$300,000
$350,000 20
03
2004
2005
2006
2007
2008
2009
2010
2011
2012
2013
2014
Median sales price Vancouver, existing homes
58
0
15
30
45
60
75
90
105
120
2003
2004
2005
2006
2007
2008
2009
2010
2011
2012
2013
2014
Days on market Vancouver, existing homes

HOUSING MARKET ANALYSIS TERRY 42
680
0
250
500
750
1,000 20
03
2004
2005
2006
2007
2008
2009
2010
2011
2012
2013
2014
Number of transactions Clark County, excluding Vancouver, existing homes
$259,450
$150,000
$200,000
$250,000
$300,000
$350,000
2003
2004
2005
2006
2007
2008
2009
2010
2011
2012
2013
2014
Median sales price Clark County, excluding Vancouver, existing homes

HOUSING MARKET ANALYSIS TERRY 43
75
0 15 30 45 60 75 90
105 120 135
2003
2004
2005
2006
2007
2008
2009
2010
2011
2012
2013
2014
Days on market Clark County, excluding Vancouver, existing homes

HOUSING MARKET ANALYSIS TERRY 44
CENTRAL OREGON
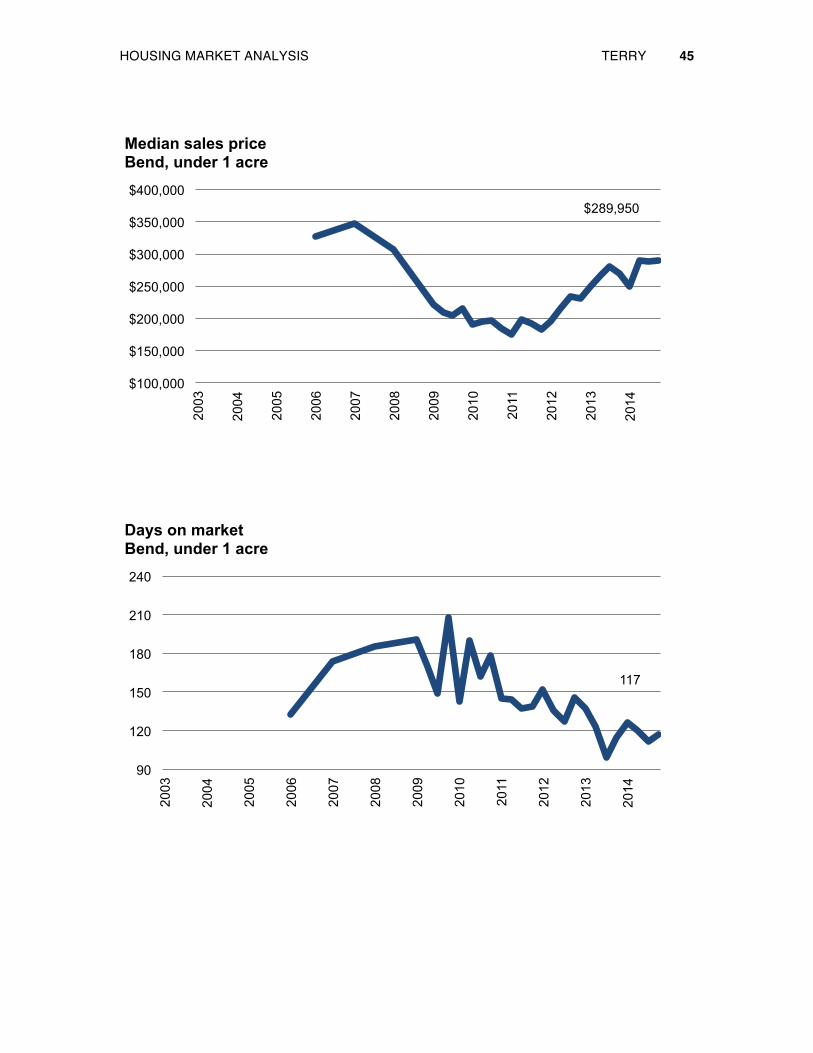
Over the last two years, transaction volumes of existing properties under 1 acre in Bend and Redmond have exhibited distinctly shaped annual cycles, starting low at the beginning of the year, peaking in second or third quarter, and falling again, as the corresponding charts demonstrate. Prices are among the most noteworthy factors for the final quarter of 2014 because they made negligible movements over the prior quarter but gained noticeably year over year and have reached levels not seen since mid-2008. Anecdotally, the author’s mid-January 2015 visit to Bend revealed readily observable construction activity in housing, education, and retail properties.
For Bend, transactions fell by 112 to 556, a nearly 17 percent contraction. This is 8 units more than Q4 2013. Sliced either way, median price rose—by $850 or 0.3 percent to $289,950 which is $20,000 or 7 percent greater than fourth quarter 2013. From third quarter 2014, average marketing time increased 5 days to 117; this is 2 days longer than the same period in 2013.
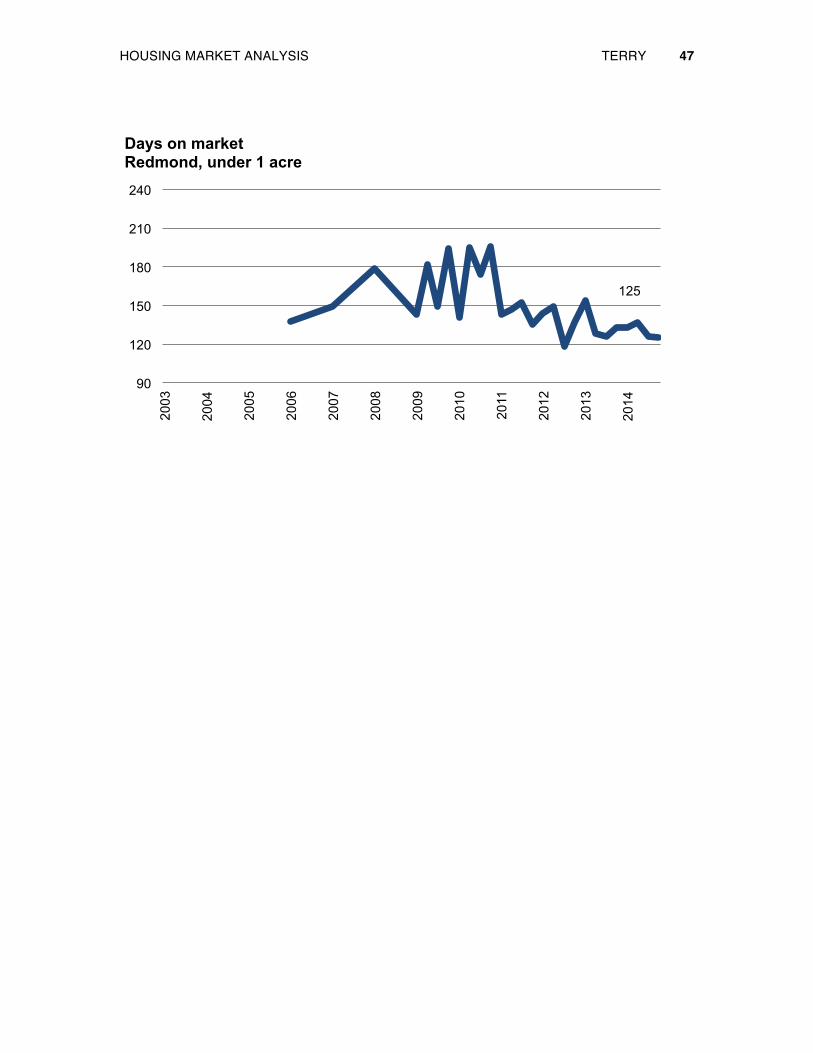
For Redmond, transaction volume declined by 87 units or 34 percent to 166 homes, which is still 19 percent more than Q4 2013. Median price declined very slightly by 0.4 percent or $725 to $196,276, still 9 percent better than fourth quarter 2013. Marketing time actually decreased by 1 day to 125 days, and this is 8 days less than fourth quarter 2013.
556
0
100
200
300
400
500
600
700
800
2003
2004
2005
2006
2007
2008
2009
2010
2011
2012
2013
2014
Number of transactions Bend, under 1 acre
HOUSING MARKET ANALYSIS TERRY 45
$289,950
$100,000
$150,000
$200,000
$250,000
$300,000
$350,000
$400,000 20
03
2004
2005
2006
2007
2008
2009
2010
2011
2012
2013
2014
Median sales price Bend, under 1 acre
117
90
120
150
180
210
240
2003
2004
2005
2006
2007
2008
2009
2010
2011
2012
2013
2014
Days on market Bend, under 1 acre

HOUSING MARKET ANALYSIS TERRY 46
166
0
50
100
150
200
250
300
2003
2004
2005
2006
2007
2008
2009
2010
2011
2012
2013
2014
Number of transactions Redmond, under 1 acre
$196,275
$100,000
$150,000
$200,000
$250,000
$300,000
$350,000
$400,000
2003
2004
2005
2006
2007
2008
2009
2010
2011
2012
2013
2014
Median sales price Redmond, under 1 acre
HOUSING MARKET ANALYSIS TERRY 47
125
90
120
150
180
210
240
2003
2004
2005
2006
2007
2008
2009
2010
2011
2012
2013
2014
Days on market Redmond, under 1 acre

HOUSING MARKET ANALYSIS TERRY 48
WILLAMETTE VALLEY
Median prices in the counties comprising the Willamette Valley were a mixed bag in the final quarter of 2014. Excluding Salem, Marion County and Polk County’s price changes amounted to movements of less than 1 percent versus the third quarter. Lane County (excluding Eugene), Linn County, and Benton County all posted single-digit changes, albeit in varying directions. Note that the price level relationships among these five counties continue in the same descending order as inception of data collection in 2006.
• Benton County: $243,000, 7 percent decrease of $18,000; 6.5 percent decrease of $17,000 year over year
• Lane County (excluding Eugene): $215,500, 1.7 percent increase of $3,500; 10 percent increase of $19,500 year over year
• Marion County (excluding Salem): $198,000, 1 percent decrease of $1,900; 10 percent increase of $18,000 year over year
• Polk County (excluding Salem): $177,250, 0.5 percent increase of $850; 11 percent increase of $17,350 year over year
• Linn County: $156,000, 3.7 percent decrease of $6,000; 4 percent increase of $6,100 year over year

HOUSING MARKET ANALYSIS TERRY 49
†Excluding Eugene
*Excluding Salem
$198,000
$215,500
$177,250 $156,000
$243,000
$100,000
$150,000
$200,000
$250,000
$300,000 20
03
2004
2005
2006
2007
2008
2009
2010
2011
2012
2013
2014
Median sales price Willamette Valley, existing homes
Benton
Lane†
Marion* Polk*
Linn
HOUSING MARKET ANALYSIS TERRY 50
SALEM
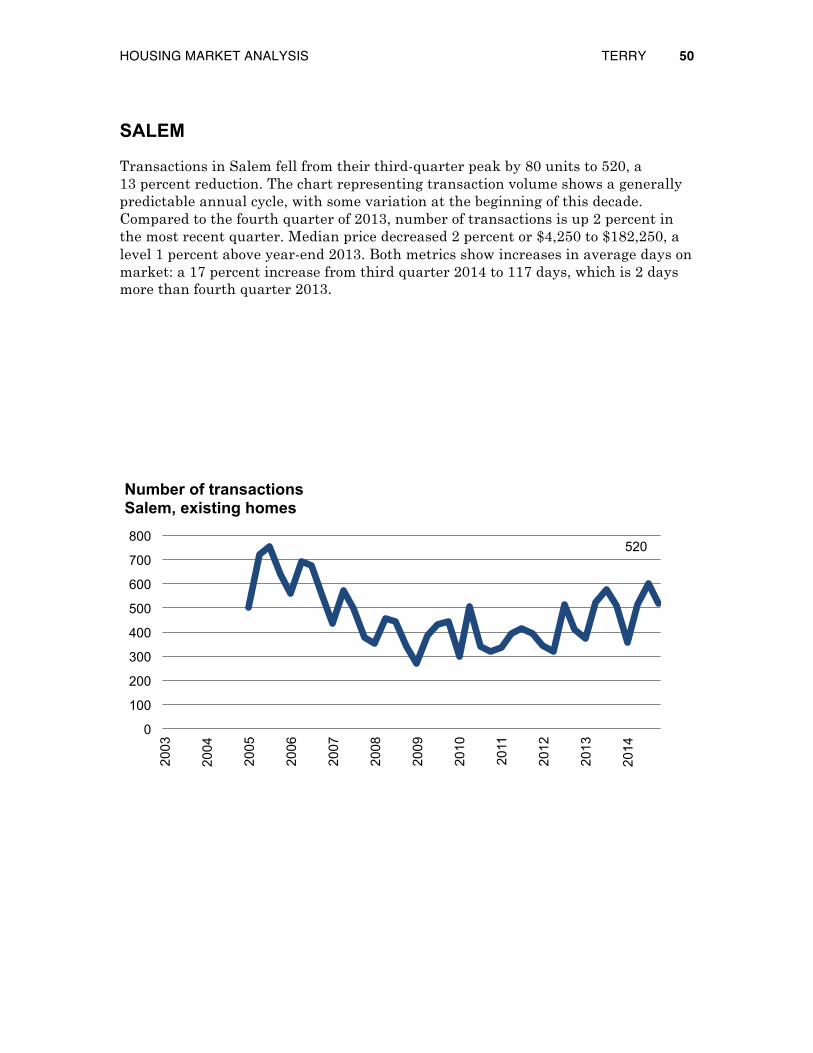
Transactions in Salem fell from their third-quarter peak by 80 units to 520, a 13 percent reduction. The chart representing transaction volume shows a generally predictable annual cycle, with some variation at the beginning of this decade. Compared to the fourth quarter of 2013, number of transactions is up 2 percent in the most recent quarter. Median price decreased 2 percent or $4,250 to $182,250, a level 1 percent above year-end 2013. Both metrics show increases in average days on market: a 17 percent increase from third quarter 2014 to 117 days, which is 2 days more than fourth quarter 2013.
520
0
100
200
300
400
500
600
700
800
2003
2004
2005
2006
2007
2008
2009
2010
2011
2012
2013
2014
Number of transactions Salem, existing homes

HOUSING MARKET ANALYSIS TERRY 51
$182,250
$100,000
$150,000
$200,000
$250,000 20
03
2004
2005
2006
2007
2008
2009
2010
2011
2012
2013
2014
Median sales price Salem, existing homes
117
0
30
60
90
120
150
180
210
2003
2004
2005
2006
2007
2008
2009
2010
2011
2012
2013
2014
Days on market Salem, existing homes
HOUSING MARKET ANALYSIS TERRY 52
EUGENE–SPRINGFIELD
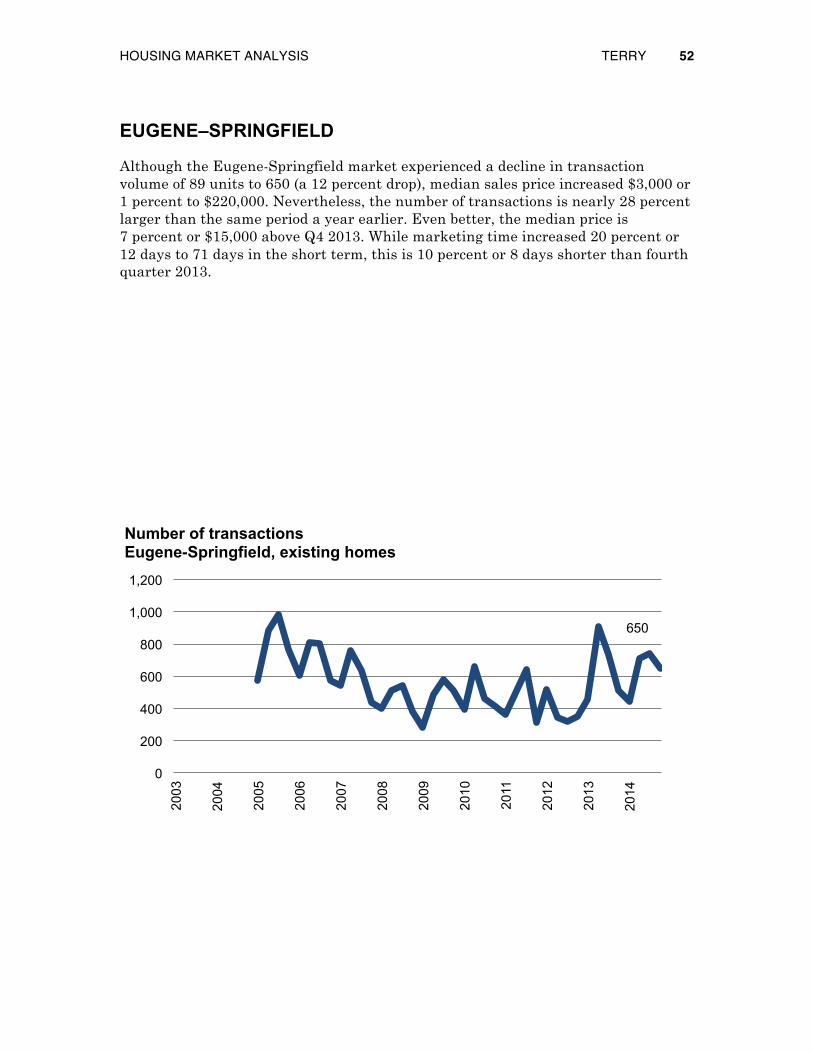
Although the Eugene-Springfield market experienced a decline in transaction volume of 89 units to 650 (a 12 percent drop), median sales price increased $3,000 or 1 percent to $220,000. Nevertheless, the number of transactions is nearly 28 percent larger than the same period a year earlier. Even better, the median price is 7 percent or $15,000 above Q4 2013. While marketing time increased 20 percent or 12 days to 71 days in the short term, this is 10 percent or 8 days shorter than fourth quarter 2013.
650
0
200
400
600
800
1,000
1,200
2003
2004
2005
2006
2007
2008
2009
2010
2011
2012
2013
2014
Number of transactions Eugene-Springfield, existing homes

HOUSING MARKET ANALYSIS TERRY 53
$220,000
$100,000
$150,000
$200,000
$250,000
$300,000 20
03
2004
2005
2006
2007
2008
2009
2010
2011
2012
2013
2014
Median sales price Eugene-Springfield, existing homes
71
0 15 30 45 60 75 90
105 120 135
2003
2004
2005
2006
2007
2008
2009
2010
2011
2012
2013
2014
Days on market Eugene-Springfield, existing homes
HOUSING MARKET ANALYSIS TERRY 54
SOUTHERN OREGON
Data for southern Oregon comes to us on a rolling three-month basis—the following information pertains to the period September 1, 2014 – November 30, 2014.
During this time, Josephine County posted a median sales price of $182,679 on 123 transactions that averaged 69 days on the market.
Meanwhile, Jackson County’s median price landed at $205,000 on a more robust 546 transactions that averaged a quicker 56 days on the market. n