ELECTRICITY MARKET DESIGN: Coordination, Pricing and Incentives
Upload
richard-fordCategory
view
386download
0
Residential Electricity Pricing in Canada
pg. 1 ©Sageline Consulting - 2015
Residential Electricity Pricing in Canada
A Report by Sageline Consulting
August 2015

Residential Electricity Pricing in Canada
pg. 2 ©Sageline Consulting - 2015
DISCLAIMER
This report is © Sageline Consulting 2015
Sageline Consulting has used its best efforts in collecting the information published in this report.
Sageline Consulting does not assume, and hereby disclaims any liability for any loss or damage caused
by errors or omissions in this report, whether such errors or omissions result from negligence, accident
or other causes. Notice: No part of this publication may be reproduced, stored in a retrieval system, or
transmitted in any form or by any means, electrical or mechanical, without the prior written permission
of Sageline Consulting.
www.sageline.ca
email: [email protected]
Residential Electricity Pricing in Canada
pg. 3 ©Sageline Consulting - 2015
Residential Electricity Pricing in Canada
1 CONTENTS
2 Summary ............................................................................................................................................... 5
3 Introduction .......................................................................................................................................... 6
4 Pricing .................................................................................................................................................... 7
4.1 Pricing Structures .......................................................................................................................... 7
4.2 Pricing to Encourage Conservation ............................................................................................... 8
4.2.1 Flat rates ............................................................................................................................... 8
4.2.2 High rates .............................................................................................................................. 8
4.2.3 Tiered rates ........................................................................................................................... 8
4.2.4 Time of Use rates .................................................................................................................. 8
4.3 Taxes ............................................................................................................................................. 9
4.3.1 Government Sales Tax (GST) ................................................................................................. 9
4.3.2 Provincial Sales Tax (PST) ...................................................................................................... 9
4.3.3 Provincial Rebates ................................................................................................................. 9
4.3.4 Local Taxes ............................................................................................................................ 9
5 Breakdown of Costs ............................................................................................................................ 10
5.1 Energy Charges ............................................................................................................................ 11
5.2 Service Charges ........................................................................................................................... 12
5.3 Taxation ....................................................................................................................................... 13
5.3.1 Provincial Taxation .............................................................................................................. 13
5.3.2 Surcharges and rate riders .................................................................................................. 13
5.3.3 Rebates ............................................................................................................................... 14
6 Conclusions ......................................................................................................................................... 15
Appendix - City Studies ............................................................................................................................... 16
Whitehorse ............................................................................................................................................. 16
Vancouver ............................................................................................................................................... 17
Yellowknife .............................................................................................................................................. 18
Calgary..................................................................................................................................................... 19

Residential Electricity Pricing in Canada
pg. 4 ©Sageline Consulting - 2015
Edmonton ............................................................................................................................................... 20
Regina ..................................................................................................................................................... 21
Winnipeg ................................................................................................................................................. 22
Toronto ................................................................................................................................................... 23
Ottawa .................................................................................................................................................... 24
Montreal ................................................................................................................................................. 25
Iqaluit ...................................................................................................................................................... 26
Labrador City ........................................................................................................................................... 27
Fredericton .............................................................................................................................................. 28
Halifax ..................................................................................................................................................... 29
Charlottetown ......................................................................................................................................... 30
St John’s .................................................................................................................................................. 31

Residential Electricity Pricing in Canada
pg. 5 ©Sageline Consulting - 2015
2 SUMMARY
The sixteen cities chosen for this report represent a cross section of all Canadian customers.
Cumulatively, these cities hold a quarter of the nation’s population.
Sageline Consulting has developed a tool that allows residential bills to be accurately calculated for any
utility, no matter how complicated the design of the rate structure. This tool has been used to calculate
comparative monthly bills for each of the sixteen cities in this report.
Monthly bills for residential electricity customers vary from $41 in Labrador City to $397 in Iqaluit.
This high level conclusion is underpinned by further analysis of the core components of the residential
electricity bill. It quantifies the substantial differences between the amounts charged for energy,
service, and taxation and suggests that federal coordination of provincial energy policies could benefit
consumers.
This report also identifies and evaluates the different rate designs used in Canada to encourage energy
conservation by residential customers.

Residential Electricity Pricing in Canada
pg. 6 ©Sageline Consulting - 2015
3 INTRODUCTION
This report investigates the variety of prices offered to Canadian residential customers. Taking data
from utility websites and regulatory filing documents it exposes the wide variation in electricity pricing
across the country. The sixteen city vignettes in this report take the reader across Canada - from sea to
shining sea – visiting every province and territory along the way.
This report is not intended to be a comprehensive catalogue of every community in Canada.
Undoubtedly there will be customers who are subject to rates higher (or lower) than the extremes
identified here. The sixteen cities highlighted here have been chosen to illustrate the range of customer
experience in major population centers across the country. In doing so it also shines a light on the
different utility structures and regulatory regimes that have evolved in different provinces and
territories.

Residential Electricity Pricing in Canada
pg. 7 ©Sageline Consulting - 2015
4 PRICING
This chart summarizes the monthly cost of an average residential user, assuming consumption of
900kWh each month.
Monthly bills vary by a factor of 10. The highest charges, as might be expected, are in the territories
where isolated communities rely on diesel generators. The fuel for these generators has to be shipped
in or, sometimes, flown in which adds to the cost.
The lowest rates identified in this report are in Labrador City. This reflects the abundance of low cost
hydro generation available in Labrador.
4.1 PRICING STRUCTURES The pricing structure varies from province to province and is influenced by the local industry
structure.
In British Columbia - where there is a single utility responsible for all aspects of the market – there
is a monthly fixed charge and a single usage rate. This is simple for the customer to understand
but provides no transparency into how these rates are set.
Alberta and Ontario both operate wholesale markets for procuring generation of electricity. In
Alberta competition between supply companies has been also been extended to all customers. In
both of these provinces rates are separated into their constituent parts: energy; transmission;
distribution; losses; and regulatory charges. This can be confusing for residential customers as
the headline rate quoted by the utility is typically only the energy component. Since this is around

Residential Electricity Pricing in Canada
pg. 8 ©Sageline Consulting - 2015
60% of the combined rate, customers may, with some justification, ask why their final bills are
high when the quoted rates are low.
4.2 PRICING TO ENCOURAGE CONSERVATION The structure of electricity rates can be designed to encourage conservation by customers. There
are a number of ways in which this may be achieved.
4.2.1 Flat rates
Uniform (flat) rates do not encourage any form of conservation from customers. This is
the case in 10 of the 16 cities reviewed in this report. This is a lost opportunity.
4.2.2 High rates
Setting high charges would encourage consumers to use less energy. It is a discriminatory
practice as it has a disproportionate impact on low income households. Regulatory
bodies across Canada encourage utilities to set charges that reflect the costs imposed by
customers and would not approve the application of high uniform rates purely to reduce
overall demand. There is no evidence to suggest that any utility in Canada marks up rates
to encourage demand reduction. The high rates seen in Iqaluit and Yellowknife reflect the
high costs of electricity generation in those areas.
4.2.3 Tiered rates
Tiered rates, which progressively increase with a customer’s consumption do provide
some encouragement to reduce usage. This is a simple rate design that is easily
understood by customers. Setting the lowest rate for the first tranche of energy
consumed, avoids discrimination against low income households (which tend to have
lower than average usage).
Vancouver and Montreal both have 2 tier rates. The second tier is approximately 50%
higher than the first tier. The higher rates are imposed after the first 666kWh
(Vancouver) or 900kWh (Montreal)
Whitehorse has a 3 tier rate. The second tier is 6% higher than the first tier and applies
after the first 1000kWh each month. The third tier is 15% higher than the first tier and
applies after the first 2500kWh per month. The higher usage needed to incur the higher
rates and the lower differential between rates means that Whitehorse customers are
subject to a lower conservation incentive than customers in Vancouver or Montreal.
Charlottetown customers are subject to a 2 tier rate. However the rate for high usage
(above 2000kWh in a month) is 20% lower than the first tier rate. This provides no
incentive to customers to conserve energy – in fact it actively rewards the highest usage
customers.
4.2.4 Time of Use rates
Ontario has installed smart meters for all residential customers and operates Time of Use
rates. These rates do not provide incentives for customers to reduce overall consumption
in the way that tiered rates do. Instead they encourage customers to shift demands from

Residential Electricity Pricing in Canada
pg. 9 ©Sageline Consulting - 2015
peak times to off-peak times. This in turn reduces the need for generation at peak times
and reduces the wholesale market price at times of peak.
Off-peak times in Ontario are 7pm to 7am and all day on weekends and public holidays.
Peak times in Ontario are 11am to 5pm in Summer and 7am to 11am and 5pm to 7pm in
Winter. Other periods are classified as mid-peak.
Published peak rates are 100% higher than offpeak rates. However, other elements of the
customer’s bill are charged at flat rates per kWh. This has the effect of diluting the
differential of peak to offpeak prices. The final incentive as seen on customer bills is that
peak prices are approximately 65% higher than offpeak prices.
4.3 TAXES No comparison of electricity prices across Canada would be complete without accounting for taxes. The
tax regime varies across the country and complicates like for like comparisons between jurisdictions.
4.3.1 Government Sales Tax (GST)
GST at the federal rate of 5% is applied to all electricity sales in Canada
4.3.2 Provincial Sales Tax (PST)
Provincial Sales Tax is applied to electricity sales in some, but not all, provinces. PST of 8%
apples in Manitoba, Ontario, New Brunswick, and Newfoundland and Labrador. PST of 9%
applies in PEI. PST of 9.75% applies in Quebec. PST of 10% applies in Nova Scotia.
4.3.3 Provincial Rebates
To mitigate the impact of Provincial Sales Tax, some provinces provide rebates to the
customers bills. These have typically been introduced at the time that provincial Sales Tax
has been applied to customer bills and they are generally calculated to cancel out the
provincial element of the taxation. Currently provincial rebates are provided in Ontario
and Nova Scotia.
Provincial rebates may be offered as a time limited program. For example the Clean
Energy Benefit in Ontario expires in December 2015.
In Yukon Territory, the Government applies an Interim Electrical Rebate of 2.9 c/kWh for
the first 1000kWh consumed each month. This rebate offsets (at least for residential
customers) surcharges that are currently applied to Yukon electricity bills in response to
under recovery by the industry in previous years. The Interim Electrical Rebate has
recently been extended to March 2016.
4.3.4 Local Taxes
In addition to federal and provincial taxes, some utilities are also required to tax electricity
customers on behalf of municipal governments. These local taxes take a variety of forms.
In Alberta, both Calgary and Edmonton levy a Local Access Fee of between 0.4 to 0.7 cents
per kWh. This can add $6 per month to an average bill. Customers in Yellowknife pay a
Franchise Fee of 2.26% added to their bill.

Residential Electricity Pricing in Canada
pg. 10 ©Sageline Consulting - 2015
5 BREAKDOWN OF COSTS
The chart in Chapter 4 can be redrawn to highlight individual components of the residential bill. The
core components are Service Charges, Energy Charges and Tax. Although energy charges are the
dominant component of the bill, service charges vary widely and are an important element in
determining ranking between cities.
Residential Electricity Pricing in Canada
pg. 11 ©Sageline Consulting - 2015
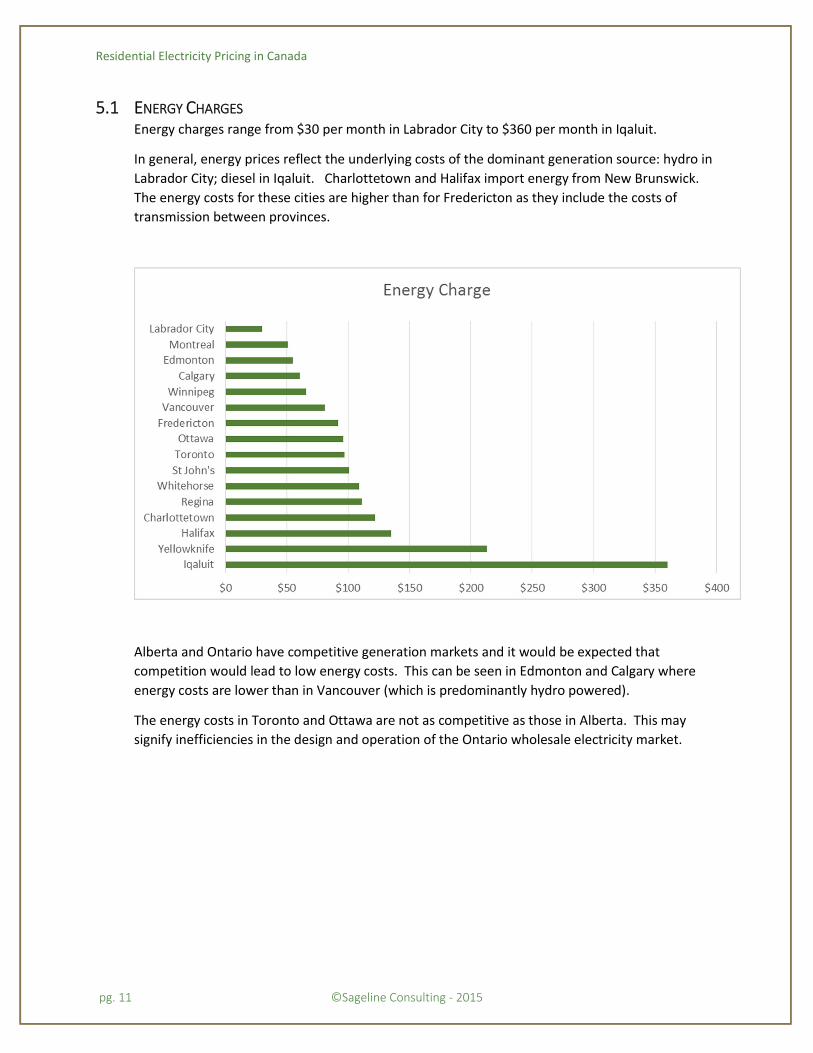
5.1 ENERGY CHARGES Energy charges range from $30 per month in Labrador City to $360 per month in Iqaluit.
In general, energy prices reflect the underlying costs of the dominant generation source: hydro in
Labrador City; diesel in Iqaluit. Charlottetown and Halifax import energy from New Brunswick.
The energy costs for these cities are higher than for Fredericton as they include the costs of
transmission between provinces.
Alberta and Ontario have competitive generation markets and it would be expected that
competition would lead to low energy costs. This can be seen in Edmonton and Calgary where
energy costs are lower than in Vancouver (which is predominantly hydro powered).
The energy costs in Toronto and Ottawa are not as competitive as those in Alberta. This may
signify inefficiencies in the design and operation of the Ontario wholesale electricity market.
Residential Electricity Pricing in Canada
pg. 12 ©Sageline Consulting - 2015
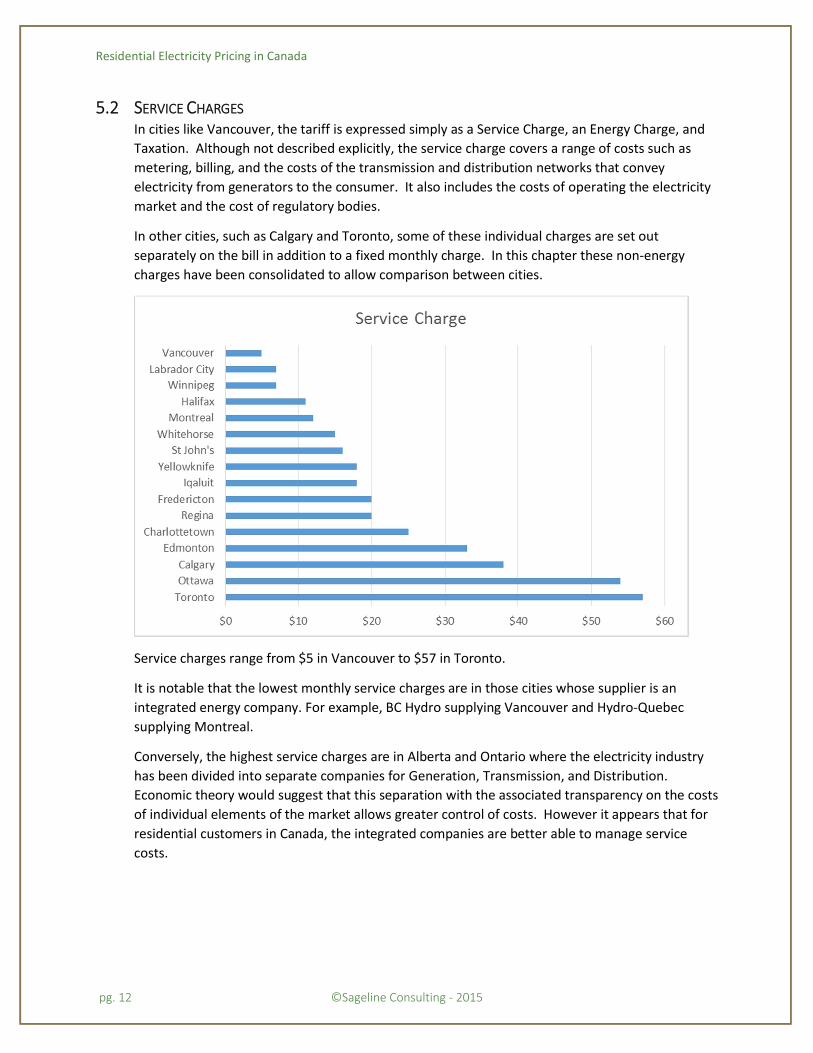
5.2 SERVICE CHARGES In cities like Vancouver, the tariff is expressed simply as a Service Charge, an Energy Charge, and
Taxation. Although not described explicitly, the service charge covers a range of costs such as
metering, billing, and the costs of the transmission and distribution networks that convey
electricity from generators to the consumer. It also includes the costs of operating the electricity
market and the cost of regulatory bodies.
In other cities, such as Calgary and Toronto, some of these individual charges are set out
separately on the bill in addition to a fixed monthly charge. In this chapter these non-energy
charges have been consolidated to allow comparison between cities.
Service charges range from $5 in Vancouver to $57 in Toronto.
It is notable that the lowest monthly service charges are in those cities whose supplier is an
integrated energy company. For example, BC Hydro supplying Vancouver and Hydro-Quebec
supplying Montreal.
Conversely, the highest service charges are in Alberta and Ontario where the electricity industry
has been divided into separate companies for Generation, Transmission, and Distribution.
Economic theory would suggest that this separation with the associated transparency on the costs
of individual elements of the market allows greater control of costs. However it appears that for
residential customers in Canada, the integrated companies are better able to manage service
costs.
Residential Electricity Pricing in Canada
pg. 13 ©Sageline Consulting - 2015
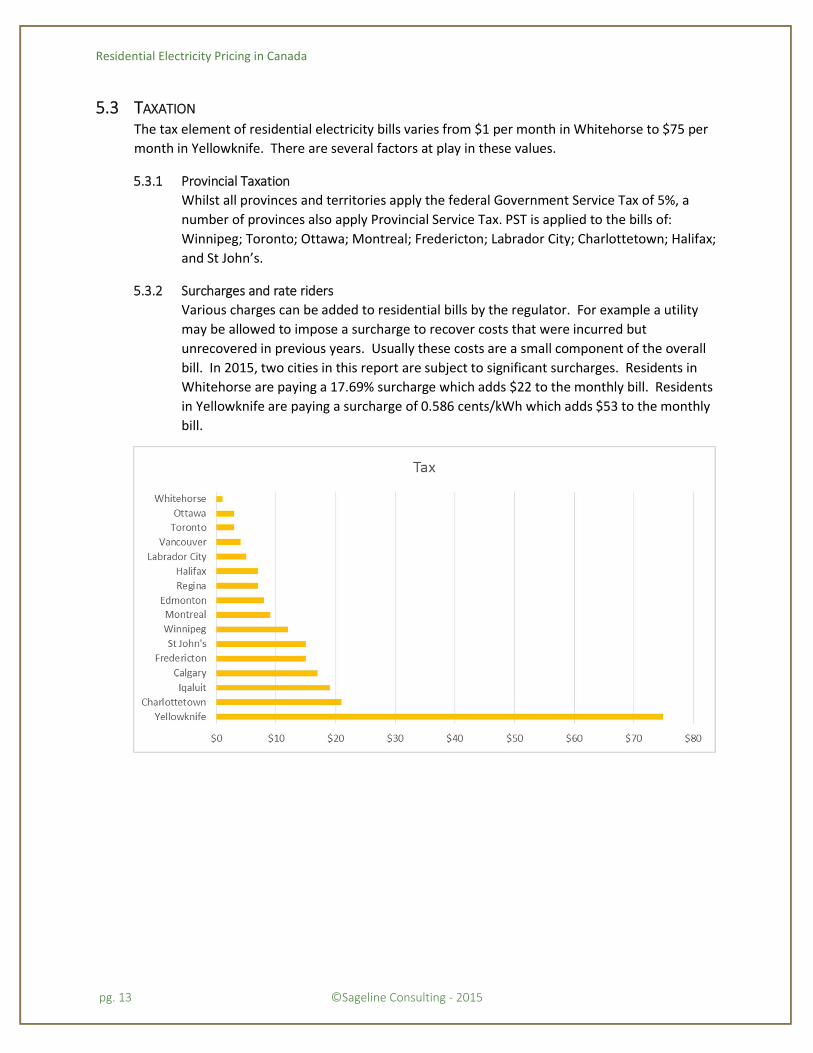
5.3 TAXATION The tax element of residential electricity bills varies from $1 per month in Whitehorse to $75 per
month in Yellowknife. There are several factors at play in these values.
5.3.1 Provincial Taxation
Whilst all provinces and territories apply the federal Government Service Tax of 5%, a
number of provinces also apply Provincial Service Tax. PST is applied to the bills of:
Winnipeg; Toronto; Ottawa; Montreal; Fredericton; Labrador City; Charlottetown; Halifax;
and St John’s.
5.3.2 Surcharges and rate riders
Various charges can be added to residential bills by the regulator. For example a utility
may be allowed to impose a surcharge to recover costs that were incurred but
unrecovered in previous years. Usually these costs are a small component of the overall
bill. In 2015, two cities in this report are subject to significant surcharges. Residents in
Whitehorse are paying a 17.69% surcharge which adds $22 to the monthly bill. Residents
in Yellowknife are paying a surcharge of 0.586 cents/kWh which adds $53 to the monthly
bill.

Residential Electricity Pricing in Canada
pg. 14 ©Sageline Consulting - 2015
5.3.3 Rebates
In Toronto, Ottawa, and Halifax, the provincial government provides a rebate that broadly
cancels out the provincial component of taxation. These rebates are time limited and will
expire at the end of 2015. In Whitehorse, the territorial government provides a rebate
that broadly offsets the surcharge. This rebate has been extended to March 2016. The
graph below shows how the 16 cities in this report compare in terms of taxation on
monthly electricity bills if the rebates were not applied.
Whilst the rebates in Whitehorse may well be continued indefinitely, residents in Toronto,
Ottawa and Halifax should be prepared for an increase of around $15 per month to their
monthly bills in 2016.
Residential Electricity Pricing in Canada
pg. 15 ©Sageline Consulting - 2015
6 CONCLUSIONS
Residential electricity pricing in Canada is primarily influenced by three factors: available energy
sources, electrical connectivity, and politics.
Utilities that have access to low cost hydro generation pass this benefit to consumers. This can be seen
in British Columbia, Quebec, and Labrador. Conversely, North West Territories and Nunavut rely on
imported diesel fuel and have no choice but to pass these costs onto their consumers.
Electrical connectivity allows the lowest cost generation to be shared amongst all customers. In general,
those utilities with the most extensive transmission system and interconnectors to other systems are
able to offer lower residential prices. The geography of Canada is not always favourable to electrical
networking. Where generation sources are distant from customers, the cost of transmitting electricity
can be significant. ATCO Electric Yukon deserves special mention here. Its ability to harness hydro
energy with a series of local electricity networks allows it to provide electricity to residential customers
at prices below the Canadian average.
The politics emerges in the industry structure and the range of surcharges, taxes and rebates applied to
electricity bills. Those provinces which allow a single integrated electricity utility generally see lower
service charges than those provinces where the industry has been fragmented. The local taxation
arrangements vary widely form province to province. Municipal taxation is incorporated into electricity
bills in Edmonton, Calgary and Yellowknife. Provincial Service Tax is applied in 7 of the 13 provinces and
territories. Rebates in Ontario and Nova Scotia which were introduced to mask the introduction of
provincial Sales Tax will soon expire.
Energy is a provincial responsibility. Given the differences in geography and environment between
provinces and territories, there would be challenges to development of a federal energy policy.
However, without a detailed understanding of the differences in market design and rate setting in each
province and territory it becomes impossible to tell if customers across Canada are being treated fairly
and equitably. Federal co-ordination of the provincial energy programs would benefit all customers.

Residential Electricity Pricing in Canada
pg. 16 ©Sageline Consulting - 2015
APPENDIX - CITY STUDIES
WHITEHORSE
Background
Whitehorse is the capital of Yukon Territory and the largest city in Northern Canada. Its population of
28,000 is supplied by the distribution utility ATCO Electric Yukon. AEY purchases the bulk of its
electricity from the Yukon Electric Company. There are no connections from the Yukon Electric Grid to
other networks. The Yukon electricity mix is predominantly hydro with diesel generation maintained as
backup. The rates in Whitehorse incorporate a three tier structure which should discourage excessive
consumption. However the spread between high and low rates is modest.
Monthly bills
The average monthly bill in Whitehorse is $125.
Components of residential bill
Service charge: $14.65
Energy charges: 12.14c/kWh for first 1000kW;
12.82c/kWh between 1000 and 2500kWh;
13.99c/kWh above 2500kWh
Additional charges: 16.9% surcharge on bills
Government Rebate: 2.9c/kWh on first 1000 kWh each month
Taxes: GST at 5%
Residential Electricity Pricing in Canada
pg. 17 ©Sageline Consulting - 2015
VANCOUVER
Background
Vancouver is the largest city in British Columbia. Its population of 603,000 is supplied from BC Hydro, an
integrated utility that encompasses Generation, Distribution and retail supply of electricity. The BC
Hydro transmission system has interconnections to Alberta and to the state of Washington in the US.
The British Columbia electricity mix is overwhelmingly (95%) hydro-powered with the balance provided
by gas fired generation.
The rates in Vancouver incorporate a two tier structure which should discourage excessive consumption.
The rate for consumption above 666kWh per month is 50% higher than the base rate.
Monthly bills
The average monthly bill in Vancouver is $91.
Components of residential bill
Service charge: $5.29
Energy charges: 7.97 c/kWh for first 666kWh;
11.95 c/kWh above 666kWh
Additional charges: none
Government Rebate: none
Taxes: GST at 5%
Residential Electricity Pricing in Canada
pg. 18 ©Sageline Consulting - 2015
YELLOWKNIFE
Background
Yellowknife is the capital city and largest community of the Northwest Territories. Its population of
19,000 is supplied by Northland Utilities an investor owned distribution utility. The majority stake in
Northland Utilities is owned by the Alberta based ATCO Electric. Northland Utilities purchases
electricity from the Northwest Territories Power Corporation. The electricity mix for Yellowknife is
predominantly hydro (from the Snare Dam) backed up by diesel generation.
The NWT electricity grid has no interconnections to other provinces or territories.
The rates in Yellowknife incorporate a single tier structure which provides no incentive to discourage
excessive consumption.
Monthly bills
The average monthly bill in Yellowknife is $308.
Components of residential bill
Service charge: $18
Energy charges: 23.72 c/kWh
Additional charges: 0.635% rate surcharge; 0.586c/kWh energy surcharge,
Government Rebate: none
Taxes: Yellowknife Franchise Fee of 2.262%;
GST at 5%
Residential Electricity Pricing in Canada
pg. 19 ©Sageline Consulting - 2015
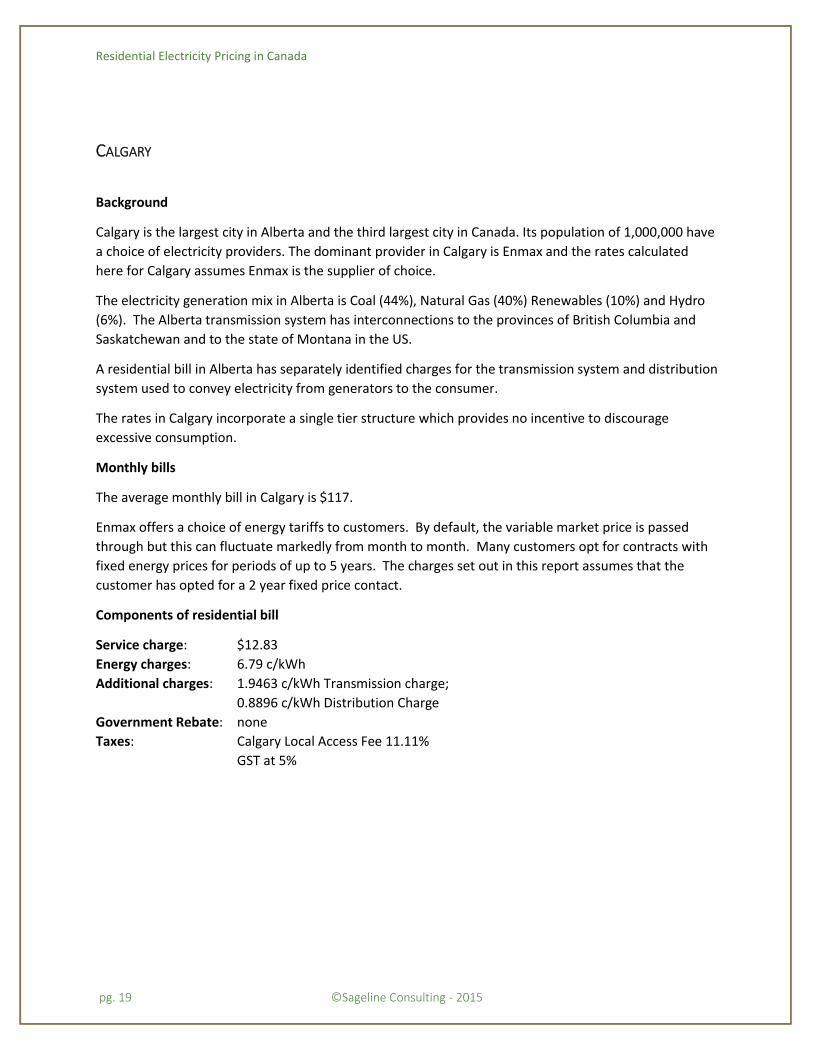
CALGARY
Background
Calgary is the largest city in Alberta and the third largest city in Canada. Its population of 1,000,000 have
a choice of electricity providers. The dominant provider in Calgary is Enmax and the rates calculated
here for Calgary assumes Enmax is the supplier of choice.
The electricity generation mix in Alberta is Coal (44%), Natural Gas (40%) Renewables (10%) and Hydro
(6%). The Alberta transmission system has interconnections to the provinces of British Columbia and
Saskatchewan and to the state of Montana in the US.
A residential bill in Alberta has separately identified charges for the transmission system and distribution
system used to convey electricity from generators to the consumer.
The rates in Calgary incorporate a single tier structure which provides no incentive to discourage
excessive consumption.
Monthly bills
The average monthly bill in Calgary is $117.
Enmax offers a choice of energy tariffs to customers. By default, the variable market price is passed
through but this can fluctuate markedly from month to month. Many customers opt for contracts with
fixed energy prices for periods of up to 5 years. The charges set out in this report assumes that the
customer has opted for a 2 year fixed price contact.
Components of residential bill
Service charge: $12.83
Energy charges: 6.79 c/kWh
Additional charges: 1.9463 c/kWh Transmission charge;
0.8896 c/kWh Distribution Charge
Government Rebate: none
Taxes: Calgary Local Access Fee 11.11%
GST at 5%
Residential Electricity Pricing in Canada
pg. 20 ©Sageline Consulting - 2015
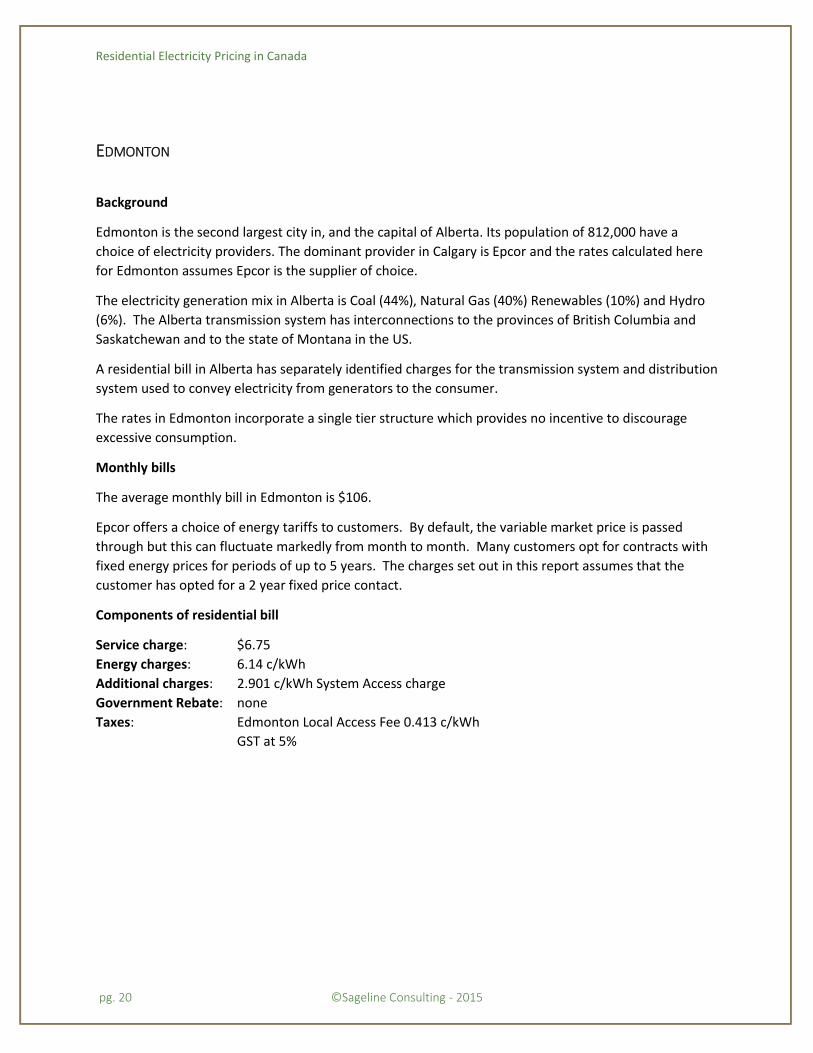
EDMONTON
Background
Edmonton is the second largest city in, and the capital of Alberta. Its population of 812,000 have a
choice of electricity providers. The dominant provider in Calgary is Epcor and the rates calculated here
for Edmonton assumes Epcor is the supplier of choice.
The electricity generation mix in Alberta is Coal (44%), Natural Gas (40%) Renewables (10%) and Hydro
(6%). The Alberta transmission system has interconnections to the provinces of British Columbia and
Saskatchewan and to the state of Montana in the US.
A residential bill in Alberta has separately identified charges for the transmission system and distribution
system used to convey electricity from generators to the consumer.
The rates in Edmonton incorporate a single tier structure which provides no incentive to discourage
excessive consumption.
Monthly bills
The average monthly bill in Edmonton is $106.
Epcor offers a choice of energy tariffs to customers. By default, the variable market price is passed
through but this can fluctuate markedly from month to month. Many customers opt for contracts with
fixed energy prices for periods of up to 5 years. The charges set out in this report assumes that the
customer has opted for a 2 year fixed price contact.
Components of residential bill
Service charge: $6.75
Energy charges: 6.14 c/kWh
Additional charges: 2.901 c/kWh System Access charge
Government Rebate: none
Taxes: Edmonton Local Access Fee 0.413 c/kWh
GST at 5%
Residential Electricity Pricing in Canada
pg. 21 ©Sageline Consulting - 2015
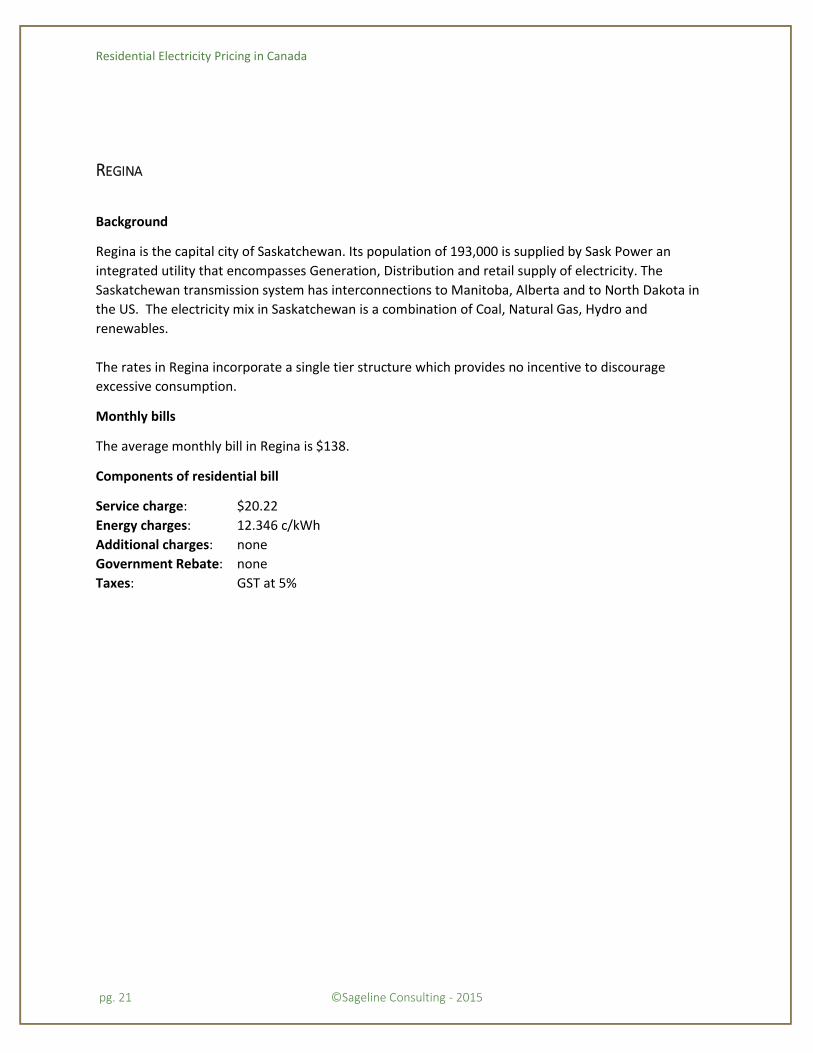
REGINA
Background
Regina is the capital city of Saskatchewan. Its population of 193,000 is supplied by Sask Power an
integrated utility that encompasses Generation, Distribution and retail supply of electricity. The
Saskatchewan transmission system has interconnections to Manitoba, Alberta and to North Dakota in
the US. The electricity mix in Saskatchewan is a combination of Coal, Natural Gas, Hydro and
renewables.
The rates in Regina incorporate a single tier structure which provides no incentive to discourage
excessive consumption.
Monthly bills
The average monthly bill in Regina is $138.
Components of residential bill
Service charge: $20.22
Energy charges: 12.346 c/kWh
Additional charges: none
Government Rebate: none
Taxes: GST at 5%

Residential Electricity Pricing in Canada
pg. 22 ©Sageline Consulting - 2015
WINNIPEG
Background
Winnipeg is the capital and largest city of Manitoba. It’s population of 663,000 is supplied by Manitoba
Hydro an integrated utility that encompasses Generation, Distribution and retail supply of electricity.
The Manitoba transmission system has interconnections to the provinces of Saskatchewan and Ontario,
and to the states of North Dakota and Minnesota in the US. The electricity mix in Saskatchewan is
overwhelmingly Hydro. An HVDC system, the Nelson River Bipole connects hydro generation in
northern Manitoba to customers in the south.
The rates in Winnipeg incorporate a single tier structure which provides no incentive to discourage
excessive consumption.
Monthly bills
The average monthly bill in Winnipeg is $85.
Components of residential bill
Service charge: $7.28
Energy charges: 7.381 c/kWh
Additional charges: none
Government Rebate: none
Taxes: City of Winnipeg Tax 2.5%;
HST at 13%
Residential Electricity Pricing in Canada
pg. 23 ©Sageline Consulting - 2015
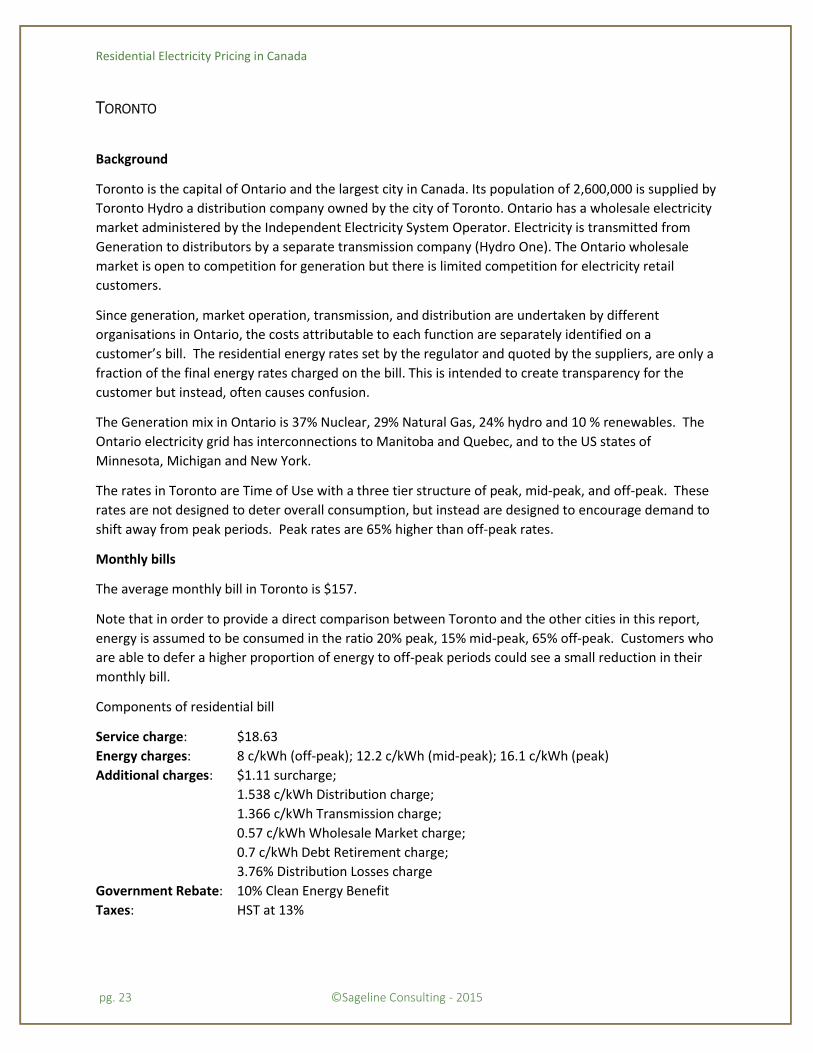
TORONTO
Background
Toronto is the capital of Ontario and the largest city in Canada. Its population of 2,600,000 is supplied by
Toronto Hydro a distribution company owned by the city of Toronto. Ontario has a wholesale electricity
market administered by the Independent Electricity System Operator. Electricity is transmitted from
Generation to distributors by a separate transmission company (Hydro One). The Ontario wholesale
market is open to competition for generation but there is limited competition for electricity retail
customers.
Since generation, market operation, transmission, and distribution are undertaken by different
organisations in Ontario, the costs attributable to each function are separately identified on a
customer’s bill. The residential energy rates set by the regulator and quoted by the suppliers, are only a
fraction of the final energy rates charged on the bill. This is intended to create transparency for the
customer but instead, often causes confusion.
The Generation mix in Ontario is 37% Nuclear, 29% Natural Gas, 24% hydro and 10 % renewables. The
Ontario electricity grid has interconnections to Manitoba and Quebec, and to the US states of
Minnesota, Michigan and New York.
The rates in Toronto are Time of Use with a three tier structure of peak, mid-peak, and off-peak. These
rates are not designed to deter overall consumption, but instead are designed to encourage demand to
shift away from peak periods. Peak rates are 65% higher than off-peak rates.
Monthly bills
The average monthly bill in Toronto is $157.
Note that in order to provide a direct comparison between Toronto and the other cities in this report,
energy is assumed to be consumed in the ratio 20% peak, 15% mid-peak, 65% off-peak. Customers who
are able to defer a higher proportion of energy to off-peak periods could see a small reduction in their
monthly bill.
Components of residential bill
Service charge: $18.63
Energy charges: 8 c/kWh (off-peak); 12.2 c/kWh (mid-peak); 16.1 c/kWh (peak)
Additional charges: $1.11 surcharge;
1.538 c/kWh Distribution charge;
1.366 c/kWh Transmission charge;
0.57 c/kWh Wholesale Market charge;
0.7 c/kWh Debt Retirement charge;
3.76% Distribution Losses charge
Government Rebate: 10% Clean Energy Benefit
Taxes: HST at 13%

Residential Electricity Pricing in Canada
pg. 24 ©Sageline Consulting - 2015
OTTAWA
Background
Ottawa is the capital of Canada and the second largest city in Ontario. Its population of 883,000 is
supplied by Hydro Ottawa a distribution company owned by the city of Ottawa. Ontario has a wholesale
electricity market administered by the Independent Electricity System Operator. Electricity is
transmitted from Generation to distributors by a separate transmission company (Hydro One). The
Ontario wholesale market is open to competition for generation but there is limited competition for
electricity retail customers.
Since generation, market operation, transmission, and distribution are undertaken by different
organisations in Ontario, the costs attributable to each function are separately identified on a
customer’s bill. The residential energy rates set by the regulator and quoted by the suppliers, are only a
fraction of the final energy rates charged on the bill. This is intended to create transparency for the
customer but instead, often causes confusion.
The Generation mix in Ontario is 37% Nuclear, 29% Natural Gas, 24% hydro and 10 % renewables. The
Ontario electricity grid has interconnections to Manitoba and Quebec, and to the US states of
Minnesota, Michigan and New York.
The rates in Ottawa are Time of Use with a three tier structure of peak, mid-peak, and off-peak. These
rates are not designed to deter overall consumption, but instead are designed to encourage demand to
shift away from peak periods. Peak rates are 65% higher than off-peak rates.
Monthly Bills
The average monthly bill in Ottawa is $154.
Note that in order to provide a direct comparison between Ottawa and the other cities in this report,
energy is assumed to be consumed in the ratio 20% peak, 15% mid-peak, 65% off-peak. Customers who
are able to defer a higher proportion of energy to off-peak periods could see a small reduction in their
monthly bill.
Components of residential bill
Service charge: $9.67
Energy charges: 8 c/kWh (off-peak); 12.2 c/kWh (mid-peak); 16.1 c/kWh (peak)
Additional charges: $1.04 surcharge;
2.34 c/kWh Distribution charge;
1.19 c/kWh Transmission charge;
0.57 c/kWh Wholesale Market charge;
0.694 c/kWh Debt Retirement charge;
3.58% Distribution Losses charge
Government Rebate: 10% Clean Energy Benefit
Taxes: GST at 13%

Residential Electricity Pricing in Canada
pg. 25 ©Sageline Consulting - 2015
MONTREAL
Background
Montreal is the largest city in Quebec and the second largest city in Canada. Its population of 1,600,000
is supplied by Hydro Quebec an integrated utility that encompasses Generation, Distribution and retail
supply of electricity. Hydro Quebec’s electricity grid has interconnections to the provinces of Ontario,
Newfoundland and Labrador, and New Brunswick and to the US province of Vermont.
Hydro Quebec’s generation is overwhelmingly hydro powered and as a result, the rates in Montreal are
among the lowest in Canada.
The rates in Montreal incorporate a two tier structure which should discourage excessive consumption.
The rate for consumption above 900kWh per month is 50% higher than the base rate.
Monthly bills
The average monthly bill in Montreal is $73.
Components of residential bill
Service charge: $12.19
Energy charges: 5.68 c/kWh for first 900kWh;
8.6 c/kWh above 900kWh
Additional charges: none
Government Rebate: none
Taxes: HST at 14.975%

Residential Electricity Pricing in Canada
pg. 26 ©Sageline Consulting - 2015
IQALUIT
Background
Iqaluit is the largest city in and capital of the territory of Nunavut. Its population of 6,000 is supplied by
Qulliq Energy. There is no interconnected grid system in Nunavut. Each community relies on
independent diesel generators, with fuel shipped in each summer.
The resultant energy charges on an Nunavut electricity bill are the highest in Canada and reflect the cost
of imported diesel fuel. However, residential customers may qualify for an energy allowance that
offsets the monthly costs.
The rates in Iqaluit incorporate a single tier structure which provides no incentive to discourage
excessive consumption.
Monthly bills
The average monthly bill in Iqaluit is $397.
Note this figure is calculated at the residential rate for a monthly consumption of 900kWh purely for
comparison with the other cities in this report. The average residential consumption may be
significantly higher than this especially in Winter when temperatures average -25degC. Residential
customers in Iqaluit may qualify for an allowance of 700kWh per month in Summer and 1000kWh per
month in Winter. Consumption in excess of this is charged at the residential rate.
Components of residential bill
Service charge: $18
Energy charges: 40 c/kWh
Additional charges: none
Government Rebate: none
Taxes: GST at 5%

Residential Electricity Pricing in Canada
pg. 27 ©Sageline Consulting - 2015
LABRADOR CITY
Background
Labrador City is a mining town situated in the west of Labrador near the border with Quebec. Together
with the nearby township of Wabush, it is the largest population centre on the mainland of Labrador
and Newfoundland. Its population of 9,000 is supplied by Newfoundland and Labrador Hydro an
integrated utility that encompasses Generation, Transmission, Distribution and retail supply of
electricity. NLH is a major generator of electricity. Its portfolio includes the 5428MW Hydro generation
facility at Churchill Falls which is the second largest underground power station in the world. The low
cost of generation at Churchill Falls is reflected in the energy rates charged to Labrador residents, who
enjoy the lowest electricity charges noted in this report.
The rates in Labrador City incorporate a single tier structure which provides no incentive to discourage
excessive consumption.
Monthly bills
The average monthly bill in Labrador City is $41.
Components of residential bill
Service charge: $7.15
Energy charges: 3.28 c/kWh
Additional charges: none
Government Rebate: none
Taxes: HST at 13%

Residential Electricity Pricing in Canada
pg. 28 ©Sageline Consulting - 2015
FREDERICTON
Background
Fredericton is the capital of New Brunswick. Its population of 56,000 is supplied by NB Power an
integrated utility that encompasses Generation, Transmission, Distribution and retail supply of
electricity. The New Brunswick electricity grid has connections to the provinces of Quebec, Prince
Edward Island and Nova Scotia and to the state of Maine in the US. The electricity generation mix in
New Brunswick is a combination of Coal, Oil, Nuclear, Diesel and Hydro.
The rates in Fredericton incorporate a single tier structure which provides no incentive to discourage
excessive consumption.
Monthly bills
The average monthly bill in Fredericton is $127.
Components of residential bill
Service charge: $20.48
Energy charges: 10.25 c/kWh
Additional charges: none
Government Rebate: none
Taxes: HST at 13%
Residential Electricity Pricing in Canada
pg. 29 ©Sageline Consulting - 2015
HALIFAX
Background
Halifax is the capital of Nova Scotia. Its population of 390,000 is supplied by Nova Scotia Power an
integrated utility that encompasses Generation, Transmission, Distribution and retail supply of
electricity. The electricity generation mix in Nova Scotia is a combination of Coal, Natural Gas, Hydro,
and renewables. The Nova Scotia electricity grid has connections to New Brunswick.
Plans exist to create an interconnection to the island of Newfoundland. This project is dependent on
completion of an interconnection between Newfoundland and Labrador. Once both links are complete,
Nova Scotia will have access to the hydro generation at Churchill Falls. This will allow for the closure of
some thermal generation. However, the additional infrastructure costs will offset the fuel cost savings
and are unlikely to reduce customer rates in Nova Scotia in the near-term.
The rates in Halifax incorporate a single tier structure which provides no incentive to discourage
excessive consumption.
Monthly bills
The average monthly bill in Halifax is $153.
Components of residential bill
Service charge: $10.83
Energy charges: 14.947 c/kWh
Additional charges: none
Government Rebate: 10%
Taxes: HST at 15%

Residential Electricity Pricing in Canada
pg. 30 ©Sageline Consulting - 2015
CHARLOTTETOWN
Background
Charlottetown is the capital of Prince Edward Island. Its population of 34,000 is supplied by Maritime
Electric. Prince Edward Island is the only province in Canada that is dependent on electricity imports.
Maritime Electric operates two diesel generation stations as backup plant but is dependent on
interconnectors from New Brunswick.
The rates in Charlottetown incorporate a two tier structure. Uniquely in Canada the base rate is higher
than the rate for high consumption. This rate will not discourage excessive consumption and may
encourage high consumption. The rate for consumption above 2000kWh per month is 21% lower than
the base rate.
Monthly bills
The average monthly bill in Charlottetown is $163.
Components of residential bill
Service charge: $24.57
Energy charges: 13.16 c/kWh for first 2000kWh; 10.38 c/kWh above 2000kWh
Additional charges: none
Government Rebate: none
Taxes: HST at 14%
Residential Electricity Pricing in Canada
pg. 31 ©Sageline Consulting - 2015
ST JOHN’S
Background
St. John's is the capital and largest city in Newfoundland and Labrador. It is located on the eastern tip of
the Avalon Peninsula on the island of Newfoundland. Its population of 211,000 is supplied by the
Newfoundland and Labrador Hydro an integrated utility that encompasses Generation, Transmission,
Distribution and retail supply of electricity. The island of Newfoundland has no electrical connections to
the mainland and its electricity generation portfolio is a mixture of hydro and thermal generation. The
cost of the thermal generation is reflected in the electricity rates charged to customers in St Johns’s.
A planned electrical interconnection between Labrador and the island of Newfoundland will provide St
John’s residents with access to the cheap hydro generation of Churchill Falls and eliminate the need for
the thermal generation. However, the additional infrastructure costs will offset the fuel cost savings and
will not reduce customer rates on the island in the near-term.
The rates in St John’s incorporate a single tier structure which provides no incentive to discourage
excessive consumption.
Monthly bills
The average monthly bill in St John’s is $131.
Components of residential bill
Service charge: $15.68
Energy charges: 11.178 c/kWh
Additional charges: none
Government Rebate: none
Taxes: HST at 13%