Residential Air Conditioning Fault Detection and...
25
Residential Air Conditioning Fault Detection and Diagnostics (FDD) and Protocols to Support Efficient Operation DOE - Building America Program Residential Buildings Integration Meeting - July 20-22, 2010 Todd M. Rossi, Ph.D. President
Transcript of Residential Air Conditioning Fault Detection and...
Residential Air Conditioning Fault Detection and Diagnostics (FDD) and
Protocols to Support Efficient OperationDOE - Building America Program
Residential Buildings Integration Meeting - July 20-22, 2010
Todd M. Rossi, Ph.D.President

Agenda• Common residential air conditioning
systems• Faults, diagnostic algorithms and factors
that impact energy efficiency• Technical protocols and program designs
to measure and improve energy efficiency• Improved protocols and program designs
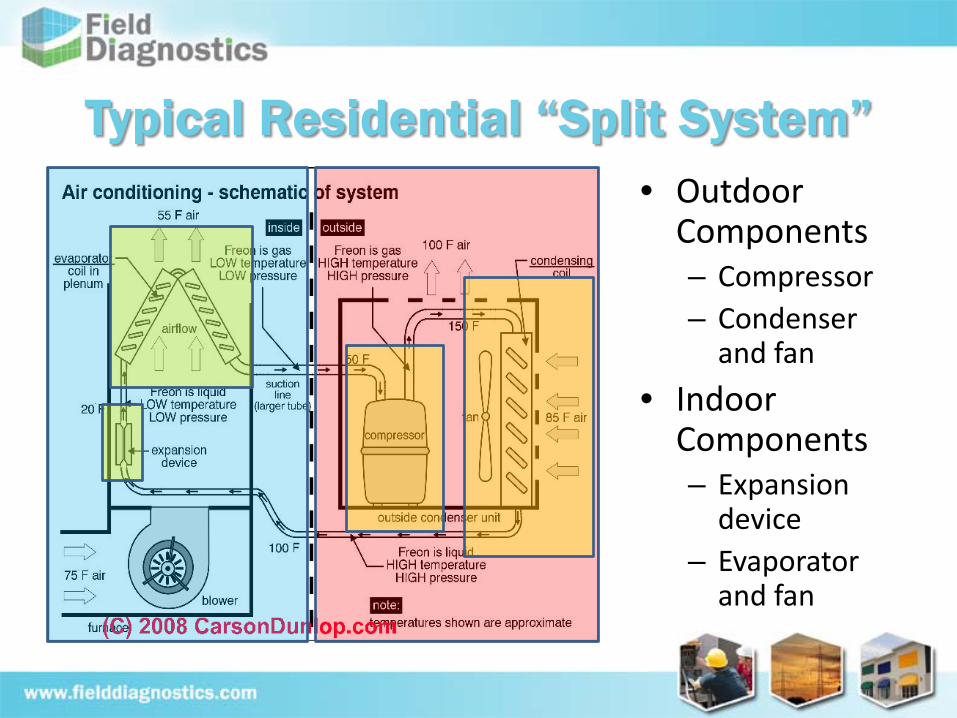
• Outdoor Components– Compressor– Condenser
and fan• Indoor
Components– Expansion
device– Evaporator
and fan
Typical Residential “Split System”

• Compressor– Inefficient pump
• Condenser– High-side heat transfer
problem
• Refrigerant– Too little– Too much– Non-condensibles
• Expansion device– Liquid line restriction
• Evaporator and Fan– Low-side heat transfer
problem• Dirty filter• Dirty indoor coil• Restricted ducts• Ineffective fan (e.g.
slipping belt)
Common Degradation Faults

Refrigeration Cycle Measurements
ST
SAT
Comp.
RAH
RAT
Elec
tric o
r Gas
Hea
t
LTLP
FanFan
Indoor Unit
Out
door
Coi
l
Outdoor Unit
Indo
or C
oil
SAH
LTLT
STST
SP
Expansion Device
LTOAT
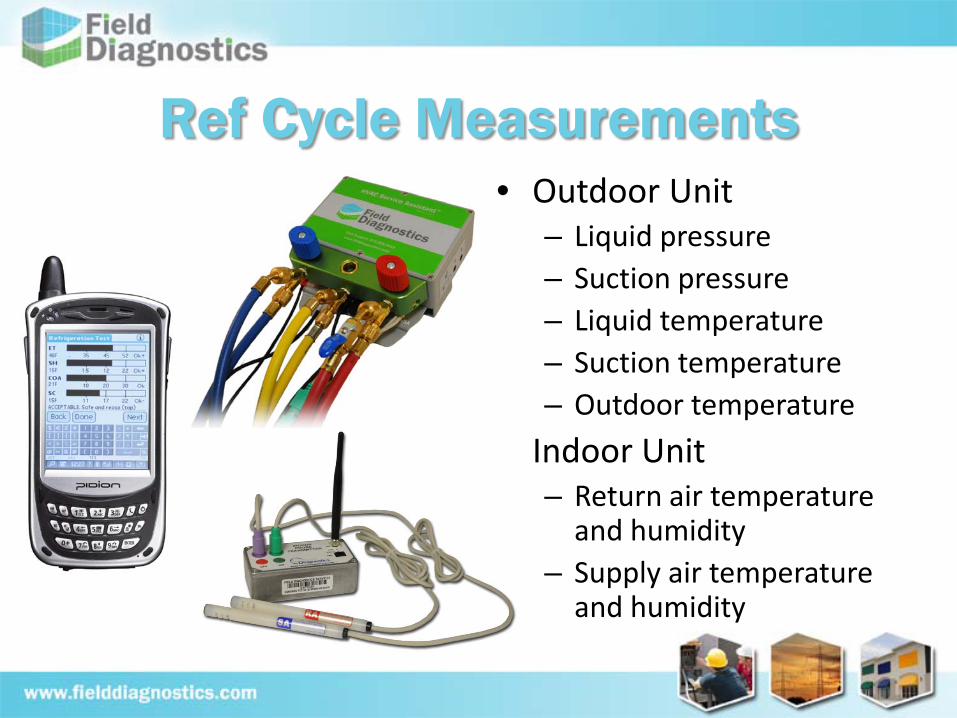
• Outdoor Unit– Liquid pressure– Suction pressure– Liquid temperature– Suction temperature– Outdoor temperature
• Indoor Unit– Return air temperature
and humidity– Supply air temperature
and humidity
Ref Cycle Measurements
7
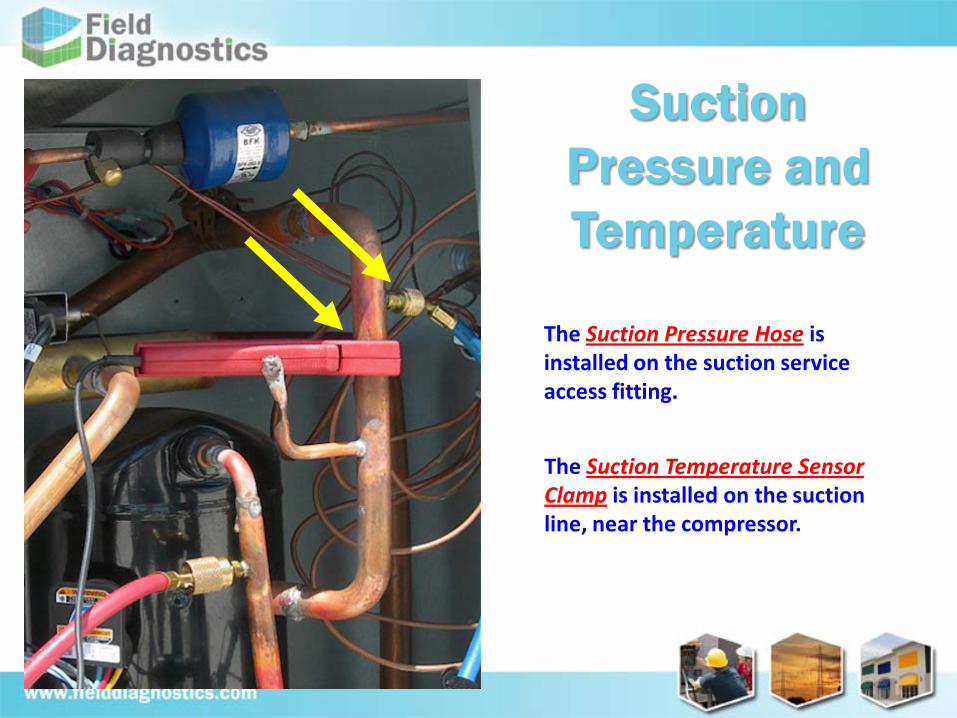
Suction Pressure and Temperature
The Suction Pressure Hose is installed on the suction service access fitting.
The Suction Temperature Sensor Clamp is installed on the suction line, near the compressor.

8
Air-side Temperature and Humidity
SensorsThe Return Air Sensor measures the temperature and humidity of the air entering the evaporator.
The Supply Air Sensor measures the temperature and humidity of the air leaving the evaporator.

9
Ref Cycle MeasurementsThe Service Assistant measures:
• Suction pressure
• Liquid pressure
• Suction temperature
• Liquid temperature
• Ambient temperature
• Return air temperature and humidity sensors
• Supply air temperature and humidity sensors

10
Ref Cycle MeasurementsThe Service Assistant measures:
• Suction pressure
• Liquid pressure
• Suction temperature
• Liquid temperature
• Ambient temperature
• Return air temperature and humidity sensors
• Supply air temperature and humidity sensors

11
Ref Cycle Performance Indices
The Service Assistant calculates:
• Evaporator Temperature (ET)
• Superheat (SH)
• Condensing Temp over Ambient (COA)
• Subcooling (SC)
• Highest acceptable value
• Goal value
• Lowest acceptable value
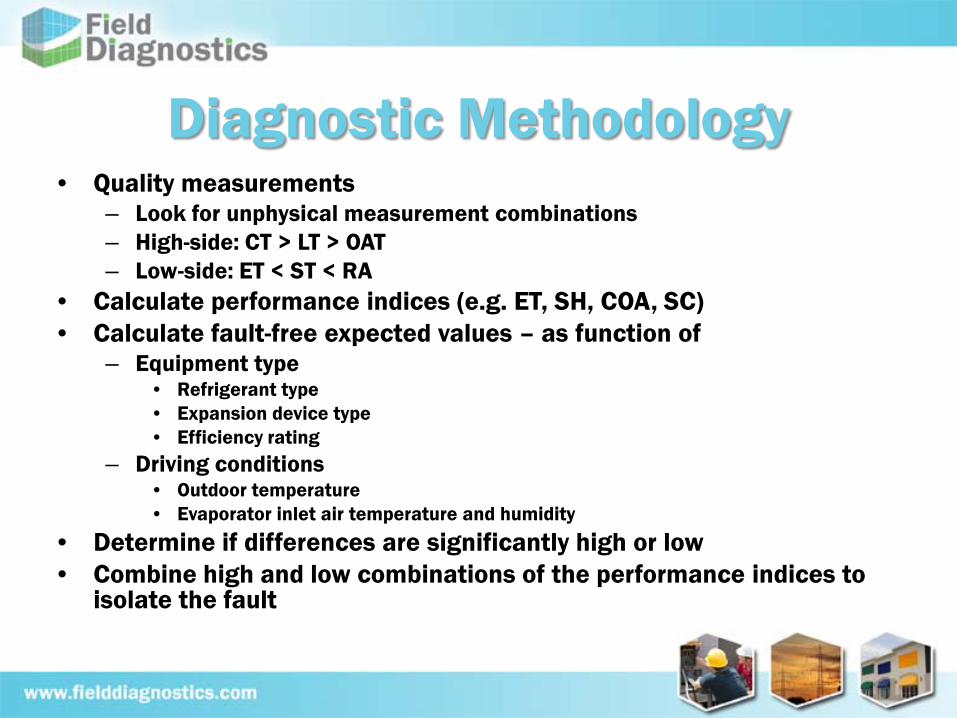
Diagnostic Methodology • Quality measurements
– Look for unphysical measurement combinations– High-side: CT > LT > OAT– Low-side: ET < ST < RA
• Calculate performance indices (e.g. ET, SH, COA, SC)• Calculate fault-free expected values – as function of
– Equipment type• Refrigerant type• Expansion device type• Efficiency rating
– Driving conditions• Outdoor temperature• Evaporator inlet air temperature and humidity
• Determine if differences are significantly high or low• Combine high and low combinations of the performance indices to
isolate the fault
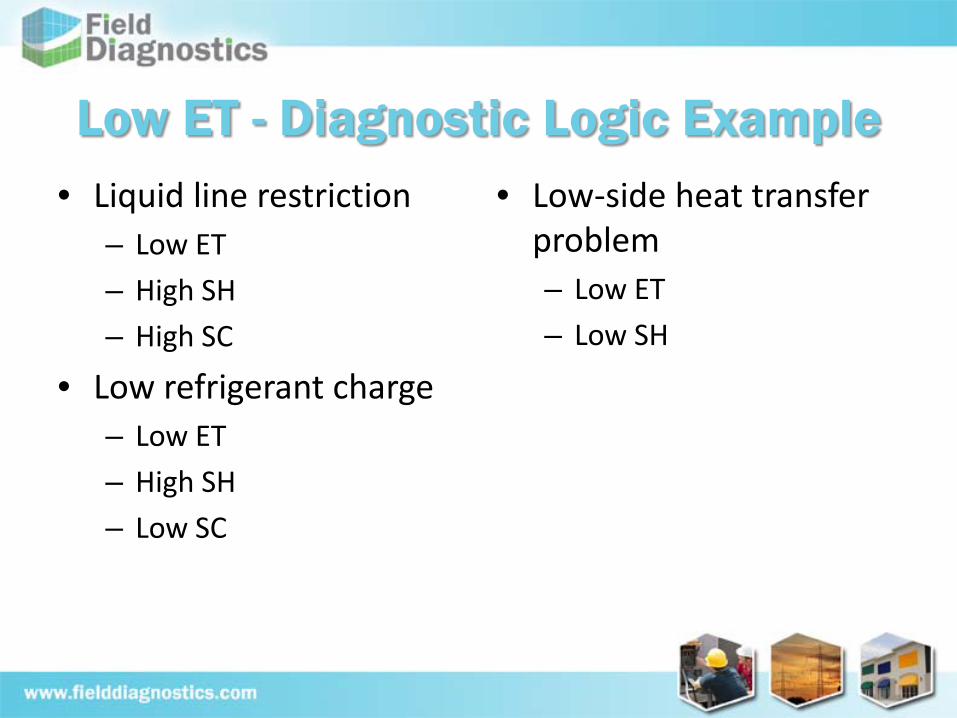
• Liquid line restriction– Low ET– High SH– High SC
• Low refrigerant charge– Low ET– High SH– Low SC
• Low-side heat transfer problem– Low ET– Low SH
Low ET - Diagnostic Logic Example

Impact of Faults on EfficiencyChanges in rooftop operation due to refrigerant leakage
(% leakage) % Change in
Capacity % Change in COP Change in T sh ( F) Change in Thg ( F)
3.5 3.0 2.7 3.5 3.3
7.0 3.8 2.8 7.0 6.1
10.5 5.6 3.6 9.9 8.4
14.0 8.0 4.6 11.1 10.0
Changes in rooftop operation due to liquid line restriction
(% AP) % Change in
Capacity % Change in COP Change in T sh ( F) Change in Thg ( F)
5 3.5 3.0 5.5 5.8
10.0 5.2 3.7 8.7 8.8
15.0 8.8 5.1 11.9 12.2
20.0 17.2 8.7 16.0 16.6
Smart Maintenance For Rooftop UnitsBy Mark Breuker, Todd Rossi, Ph.D., and Jim Braun, Ph.D.ASHRAE Journal November, 2000
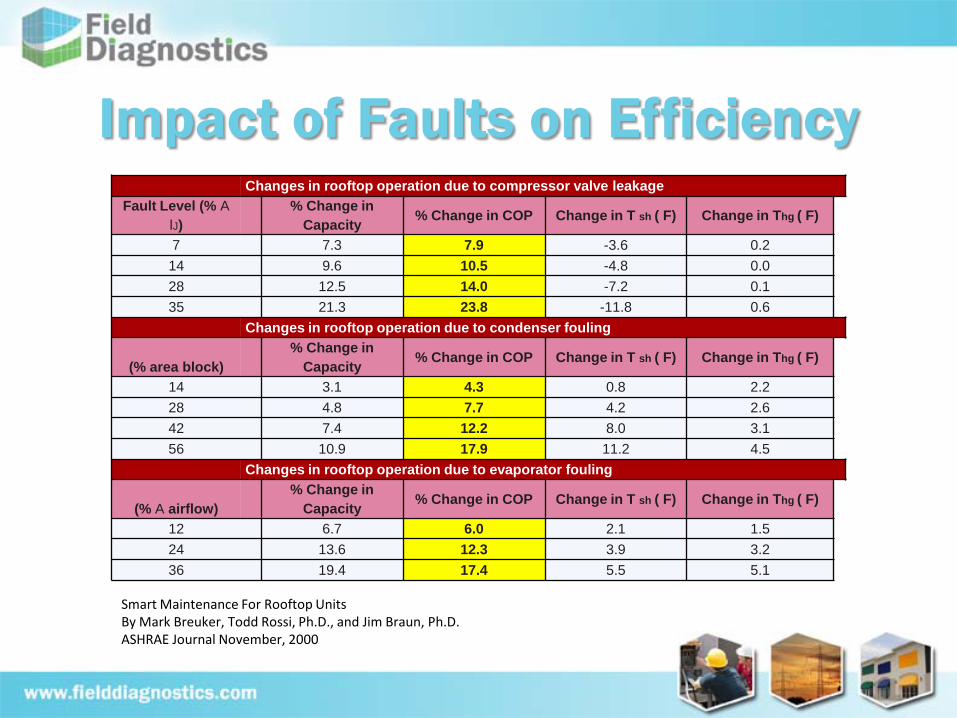
Impact of Faults on EfficiencyChanges in rooftop operation due to compressor valve leakage
Fault Level (% A lJ)
% Change in Capacity % Change in COP Change in T sh ( F) Change in Thg ( F)
7 7.3 7.9 -3.6 0.2 14 9.6 10.5 -4.8 0.0 28 12.5 14.0 -7.2 0.1 35 21.3 23.8 -11.8 0.6
Changes in rooftop operation due to condenser fouling
(% area block) % Change in
Capacity % Change in COP Change in T sh ( F) Change in Thg ( F)
14 3.1 4.3 0.8 2.2 28 4.8 7.7 4.2 2.6 42 7.4 12.2 8.0 3.1 56 10.9 17.9 11.2 4.5
Changes in rooftop operation due to evaporator fouling
(% A airflow) % Change in
Capacity % Change in COP Change in T sh ( F) Change in Thg ( F)
12 6.7 6.0 2.1 1.5 24 13.6 12.3 3.9 3.2 36 19.4 17.4 5.5 5.1
Smart Maintenance For Rooftop UnitsBy Mark Breuker, Todd Rossi, Ph.D., and Jim Braun, Ph.D.ASHRAE Journal November, 2000
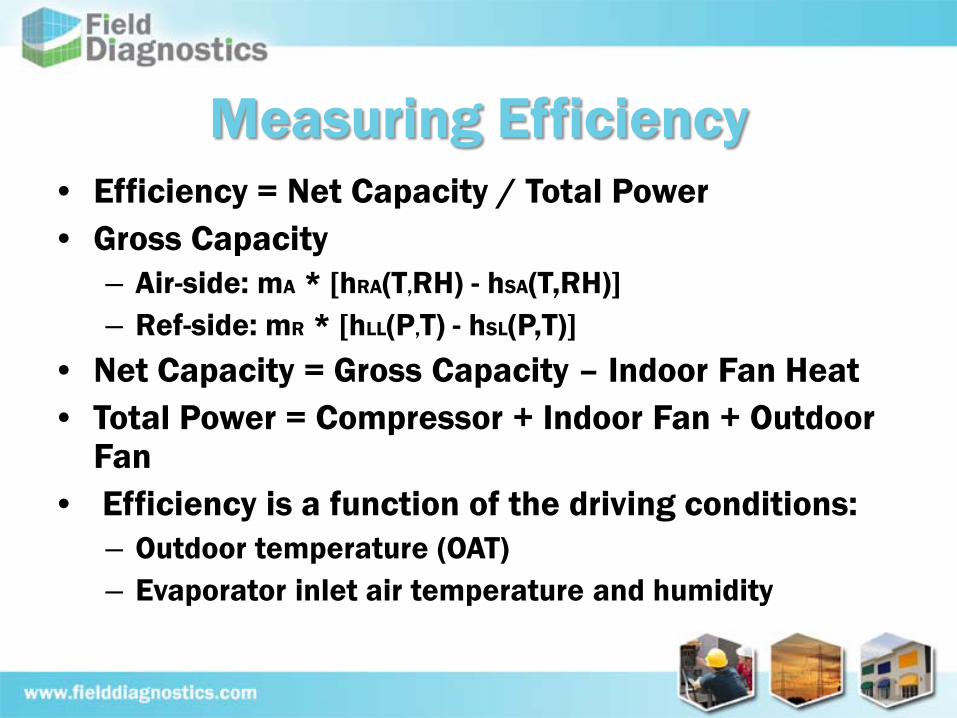
Measuring Efficiency• Efficiency = Net Capacity / Total Power• Gross Capacity
– Air-side: mA * [hRA(T,RH) - hSA(T,RH)]– Ref-side: mR * [hLL(P,T) - hSL(P,T)]
• Net Capacity = Gross Capacity – Indoor Fan Heat• Total Power = Compressor + Indoor Fan + Outdoor
Fan• Efficiency is a function of the driving conditions:
– Outdoor temperature (OAT)– Evaporator inlet air temperature and humidity
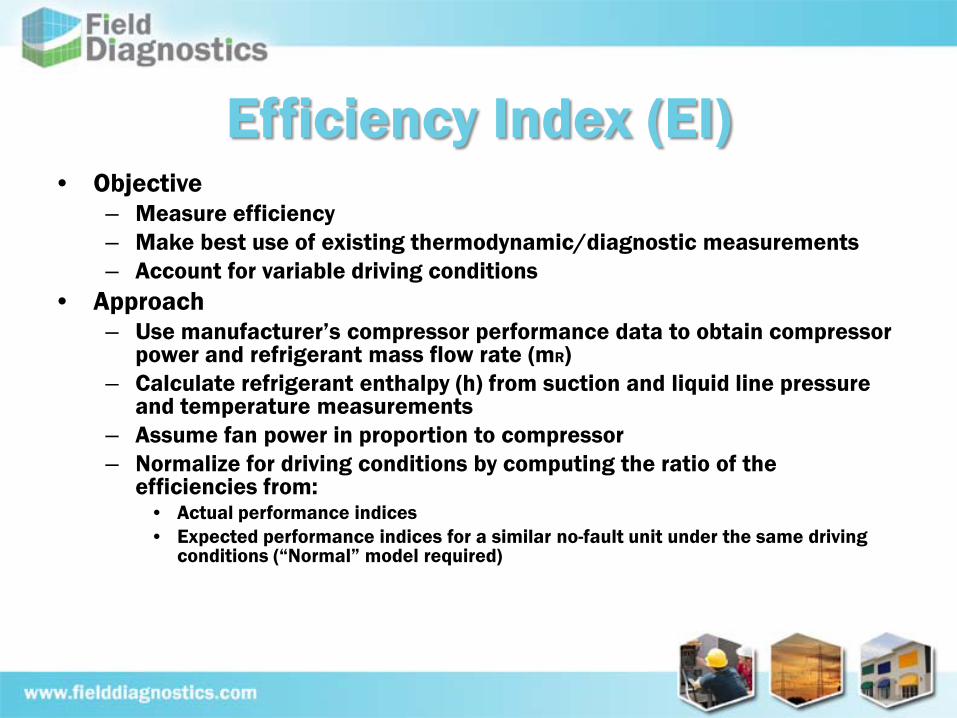
Efficiency Index (EI)• Objective
– Measure efficiency– Make best use of existing thermodynamic/diagnostic measurements– Account for variable driving conditions
• Approach– Use manufacturer’s compressor performance data to obtain compressor
power and refrigerant mass flow rate (mR)– Calculate refrigerant enthalpy (h) from suction and liquid line pressure
and temperature measurements– Assume fan power in proportion to compressor– Normalize for driving conditions by computing the ratio of the
efficiencies from:• Actual performance indices• Expected performance indices for a similar no-fault unit under the same driving
conditions (“Normal” model required)

18
Example Performance Report
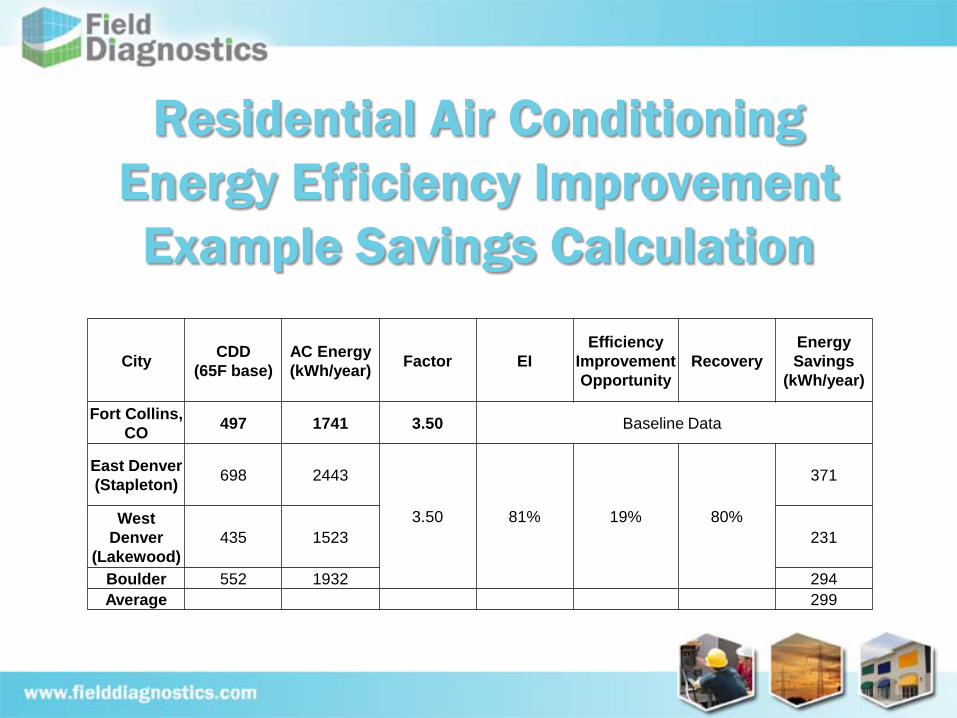
Residential Air ConditioningEnergy Efficiency ImprovementExample Savings Calculation
City CDD (65F base)
AC Energy (kWh/year) Factor EI
Efficiency Improvement Opportunity
RecoveryEnergy Savings
(kWh/year)
Fort Collins, CO 497 1741 3.50 Baseline Data
East Denver (Stapleton) 698 2443
3.50 81% 19% 80%
371
West Denver
(Lakewood)435 1523 231
Boulder 552 1932 294Average 299

Simple FDSI Tune-up Protocol• Test all or suspect units
– Pay “Audit” incentive if test-in passes
• Repair problem units and test-out– Pay “Performance Improvement” incentive if
test-in fails and test-out passes
Measure Incentive
Refrigeration Cycle Audit $25Refrigeration Cycle Performance Improvement (single circuit) $125

Ref Cycle Pass/Fail Criteria• Correct unit information
– SEER or EER is entered correctly– Capacity is entered correctly
• Diagnosis is “Safe and Reasonable”• EI (efficiency index) is at least 90
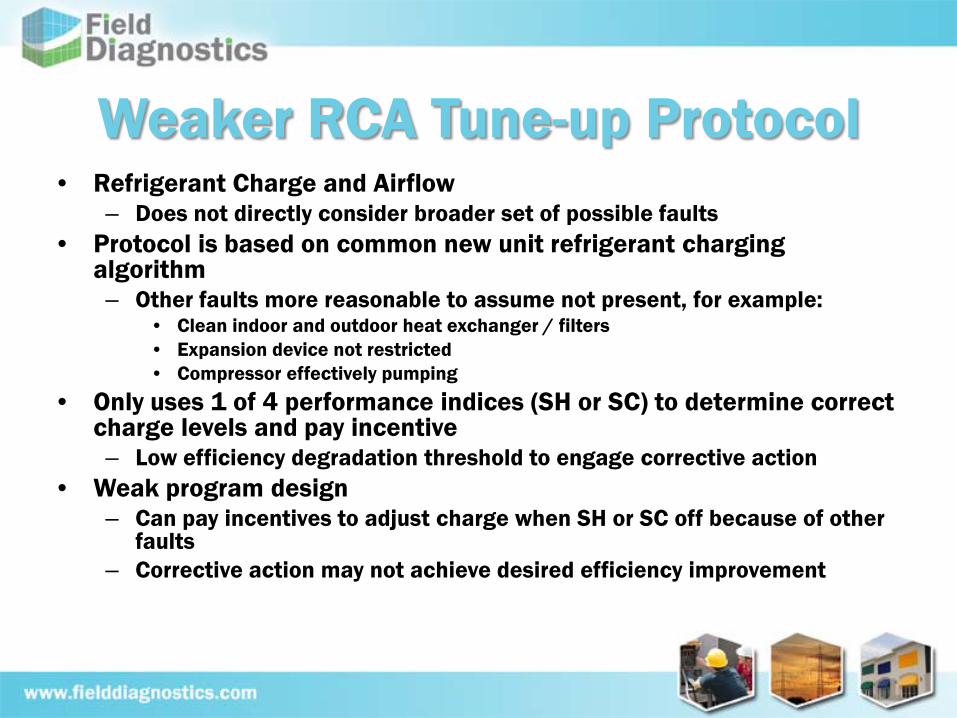
Weaker RCA Tune-up Protocol• Refrigerant Charge and Airflow
– Does not directly consider broader set of possible faults• Protocol is based on common new unit refrigerant charging
algorithm– Other faults more reasonable to assume not present, for example:
• Clean indoor and outdoor heat exchanger / filters• Expansion device not restricted• Compressor effectively pumping
• Only uses 1 of 4 performance indices (SH or SC) to determine correct charge levels and pay incentive– Low efficiency degradation threshold to engage corrective action
• Weak program design– Can pay incentives to adjust charge when SH or SC off because of other
faults– Corrective action may not achieve desired efficiency improvement

• Standard protocol has problems in hot/dry climates where indoor coils are more likely to be dry
• Fixed orifice expansion device units have expected superheat (SH) values of zero
• Innovative algorithm adapts diagnostics and efficiency estimator to these conditions
– See “Expanded Range”
Protocol Challenge: Hot/Dry Climates

Next Generation Protocols• Look for opportunities to replace units when appropriate
– Incentivized tune-up provides opportunity to test units and improve performance
– When unit performance problems are beyond tune-up scope to repair – move to replacement scenario
• Help make business case to customer• Automate Manual-J sizing calculations• Administer new unit incentives
– Bigger savings achieved and more contractor revenue generation (promotes more production)
• Embedded 24/7 “Smart Grid” monitoring solutions– Find problem units remotely– Incentivize repairs– Manage workflow via PDA platform

Conclusion• HVAC equipment performance provides significant
opportunity to improve residential energy efficiency• Efficiency is dependent on common service tasks, for
example:– Clean indoor and outdoor coils– Clean filters– Correct refrigerant charge
• FDSI has effective technology and program platform to:– Measure equipment performance– Standardize and document customized field protocols for
program implementation– Implement and administer scaled programs