RESEARCH WORKING PAPER - World...
60
_____) /6 574 POLICY RESEARCH WORKING PAPER 1656 The Investment Decision Forfirms thesinglemost important determinant of capital spending appears to A Re-Examination of Competing be cashflow. Firm managers Theories Using Panel Data care more about cash flow and cost of capital than about Cherian Samuel stock market signals and level of output. The World Bank Operations Policy Department Operations Policy Group September 1996 Public Disclosure Authorized Public Disclosure Authorized Public Disclosure Authorized Public Disclosure Authorized
Transcript of RESEARCH WORKING PAPER - World...

_____) /6 574
POLICY RESEARCH WORKING PAPER 1656
The Investment Decision Forfirms thesinglemostimportant determinant of
capital spending appears to
A Re-Examination of Competing be cash flow. Firm managers
Theories Using Panel Data care more about cash flowand cost of capital than about
Cherian Samuel stock market signals and levelof output.
The World Bank
Operations Policy Department
Operations Policy Group
September 1996
Pub
lic D
iscl
osur
e A
utho
rized
Pub
lic D
iscl
osur
e A
utho
rized
Pub
lic D
iscl
osur
e A
utho
rized
Pub
lic D
iscl
osur
e A
utho
rized

POLICY RESEARCH WORKING PAPER 1656
Summary findingsIn the United States, gross business investments in plant If the results from cross-section regressions can beand equipment (fixed investments) constitute only about viewed as representing the long-term equilibrium, the10 percent of GNP, but such investments may represent single most important determinant of capital spendingGNP's most important component because (1) plant and appears to be cash flow.equipment have a long-term effect on the economy's Apparently, managers care more about cash flow andproductive capacity, (2) changes in investment spending cost of capital than about stock market signals and thedirectly affect levels of employment and workers' level of output. And at the firm level, managerialincomes in durable goods industries, and (3) supply and perceptions about fundamentals are more important thandemand are sensitive to changes in investment, which is market perceptions. For managers, the stock market maythe most volatile component of GNP. be a side show to capital spending decisions.
Economists have long been concerned about what - To generalize in a way that might be useful forin the economy, the industry, and the firm - determines developing countries: Financial decisions at the firm levelinvestments in capital spending. Using a panel of data for are closely linked to real decisions in the economy.U.S. manufacturing firms for 1972-90, Samuel compares Internal finance is the most important source of funds,five theories of investment: accelerator theory, cash flow and capital spending is the most important use of funds,theory (liquidity model, managerial model, and so there is a close relationship betwen real and financialinformation-theoretic model), neoclassical theory, decisions.modified neoclassical (Bischoff) theory, and Q theory.
This paper - a product of the Operations Policy Group, Operations Policy Department - is part of a larger effort in thedepartment to disseminate results of policy analysis. Copies of the paper are available free from the World Bank, 1818 HStreet NW, Washington, DC 20433. Please contact Cherian Samuel, room MC10-362, telephone 202-473-0802, fax 202-522-3253, Internet address [email protected]. September 1996. (51 pages)
The Policy Research Working Paper Series disseminates the findings of work in progress to encourage the exchange of ideas aboutdevelopment issues. An objective of the series is to get the findings out quickly, even if the presentations are less than fully polished. Thepapers carry the names of the authors and should be used and cited accordingly. The findings, interpretations, and conclusions are theauthors' own and should not be attributed to the World Bank, its Executive Board of Directors, or any of its member countries.
Produced by the Policy Research Dissemination Center

The Investment Decision: A Re-examination of Competing Theories Using Panel Data*
CHERIAN SAMUEL
Operations Policy Group
Operations Policy Department
World Bank
*I like to thank Drew Lyon, Plutarchos Sakellaris, and Dennis Mueller for their comments onan earlier version of this paper.

-

The Investment Decision: A Re-examination of Competing Theories Using Panel Data
Even though business expenditures on plant and equipment gross investment (business
fixed investment) in the United States constitute only about 10% of GNP, it is still perhaps the
most important component of GNP because: (i) plant and equipment are durable goods and
therefore variations in investment expenditures have long-term consequences for the economy's
productive capacity; (ii) investment expenditures affect demands for the products of the
construction and producer's durable goods industries. Therefore, changes in investment
expenditures lead to shifts in the aggregate levels of employment and personal income through
both direct and indirect effects; and (iii) since investment is the most volatile component of
GNP, aggregate supply and demand are very sensitive to changes in investment.
Given these considerations, economists have been concerned with the analysis of the
determinants of investment (capital) expenditures for a long time. This analysis has been
conducted at all levels of disaggregation viz. economy, industry, and the firm. This paper
compares the alternative theories of investment using a panel of U.S. manufacturing firms for
the 1972-1990 period.
The study is organized into four sections. Section I begins with a discussion of the
alternative models of investment, then examines the empirical evidence for these models, and
considers the policy implications of the different models. Section II reports the results of the
time-series regressions. Section III has results from cross-section regressions. Section IV deals
with fixed effects models. The final section concludes the study and discusses the implications
for developing countries.
1

I
Models of investment
Broadly speaking, one can distinguish at least five theories of investment: (i) accelerator
theory; (ii) cash flow theory; (iii) neoclassical theory; (iv) modified neoclassical (Bischoff)
theory; and (v) Q theory.' Within the rubric of the cash flow theory, there are three variants:
(a) liquidity model; (b) managerial model; and (c) information-theoretic model.
For analytical purposes, the alternative theories of investment can be classified in various
ways. One division could be based on the optimal adjustment path for the firm's capital stock.
While the accelerator, neoclassical, modified neoclassical, and the cash flow models do not
explicitly consider the optimal adjustment path for the firm's capital stock when it is away from
that level, the Q theory characterizes the complete evolution of the capital stock from the
underlying optimization problem.2 This therefore provides a rationale for expectational lags and
leaves room for lags in delivery and installation only.
Another way to think about the different models of investment is to highlight the factors
that underlay the marginal returns to investment and the marginal cost of finance in the different
models. For instance, a sharp distinction can be drawn between the managerial and neoclassical
theories of investment (Grabowski and Mueller (1972)). In the neoclassical theory, internal and
external finance are perfect substitutes, following Modigliani-Miller(1956) theorems, and
therefore the marginal cost of finance equals the shareholder's opportunity cost of capital. In the
managerial theory of investment however, managers prefer to use internal funds since they are
I See Appendix I for a description of these models.
2 This feature is also present in the irreversibility models. See Dixit and Pindyck (1994) for a moredetailed discussion of irreversibility models.
2

the most accessible part of the capital market and hence most malleable to managerial desires
for growth. The marginal cost of capital is significantly lower for internal finance compared to
external finance, and therefore not equal to the shareholder's opportunity cost of capital, but
some much lower totally subjective value set by the managers. In equilibrium, marginal returns
to investment equal the marginal cost of finance.
The alternative models of investment can also be classified in terms of the relative
importance of price variables like taxes and interest rates, quantity variables like output and
liquidity, and autonomous shocks like "animal spirits" and technology shocks as determinants
of capital expenditures (Chirinko (1993)). For the neoclassical model, only price variables
matter; for the accelerator and cash flow models, only quantity variables matter. For the Q
theory, what is relevant is autonomous shocks, and for the modified neoclassical model, what
matters is a combination of price and quantity variables, with the latter being somewhat more
important.
These five basic models of investment are useful for a relative ranking of the various
factors (output, cash flows, cost of capital, prices, technology shocks etc.) that are important in
shaping investment decisions. In addition to these five models that emphasize the role of a
single factor to the exclusion of all others in the determination of investment expenditures, one
can think of at least two other composite models that are combinations of these basic models that
emphasize a number of factors: (i) accelerator-cash flow; and (ii) Q-cash flow.3 These
composite formulations are essentially a recognition of the complexities involved in the
I Even the Bischoff (1971) model can be viewed as a composite model, i.e., the neoclassical-accelerator model.
3

investment process, the attempt being to capture the multitude of constraints that are operative
with regard to capital expenditure decisions.
Like many other topics in economics, research on investment demand has been through
its share of cycles over time. Thus, the early writers of the subject emphasized the accelerator
approach (Clark (1917), Chenery (1952), Koyck (1954) and others). The original contribution
of Clark (1917) was in fact part of an overall explanation for business cycles.
The next theory of investment to emerge was the liquidity (residual funds) theory
(Dusenberry (1958), Meyer and Kuh (1957), Kuh (1963), Meyer and Glauber (1964), and Meyer
and Strong (1990)). According to the liquidity theory, investment depends primarily on cash
flows/internal finance--the sum of retained earnings and depreciation. In other words,
investment may be constrained by the supply of internal funds. Past levels of profits may also
be an adequate proxy for future levels and hence might be relevant for capital expenditures
decisions.
In part, the liquidity theory can be viewed as an attempt to explain the existence of
financing hierarchy, which constitutes one of the most well-documented facts of corporate
finance (Koch (1943), Donaldson (1961)), wherein the firm's preferred ordering of the sources
of finance is: (1) internal finance; (2) external debt; and (3) new equity. In fact, Donaldson
(1961) found that firms sold cash and investments (marketable securities) before taking on
external debt.
In the meantime, Grunfeld (1960) proposed the use of the firm's market value as a proxy
for expected profitability. Therefore, investment depends on the market value of the firm. In a
4

way, the market value approach of Grunfeld can be viewed as a sort of a precursor to Tobin's
Q theory.
Then came along the neoclassical model formulation by Jorgensen (1963, 1966, 1967,
1971) and associates, in the wake of the Modigliani-Miller (1958) theorems. The neoclassical
model of investment implies that investment decisions depend mainly upon the cost of capital,
and that the real and financial decisions undertaken by the firm are separate. The departure of
the Jorgensonian approach was also in providing a structural formulation of the investment
decision, based on profit maximizing behavior by firms. The earlier approaches lacked an
explicit theoretical basis and were even deemed ad hoc at one level.
About the same time, in a series of studies, Eisner and associates (1963, 1964, 1967,
1969, 1970, 1978) revived the accelerator approach, adding profits as well to the investment
equation. Therefore, it is probably more accurate to characterize the Eisner model as the
accelerator-profits model. Without surprise, a serious debate emerged between Jorgensen and
Eisner regarding the relative merits of neoclassical and accelerator models of investment.
Professional economic journals of the late 1960s and the early 1970s are littered with these
debates.
The Q theory of investment, due to Brainard and Tobin (1968) and Tobin (1969), was
in sharp contrast to the output-oriented models discussed above in that it attempted to explain
investment on a financial basis in terms of portfolio balance, i.e., based on the q ratio--the ratio
of the market value of capital to its replacement cost. If managers seek to maximize the market
value of firms, they will add to their capital stock whenever the marginal addition to the firm's
market value exceed the replacement cost of the capital stock.
5

Bischoff (1971) proposed an important extension to the standard Jorgensonian neoclassical
model with the putty-clay approach. i.e., Bischoff (1971) pointed out that it is often easier to
modify factor proportions and thus the capital-output ratio ex ante; ex post, the substitution
between factors is zero. Consequently, investment may be more responsive to changes in output
compared to changes in the cost of capital. In other words, the distributed lag of investment on
changes in the relative prices of capital services has a different shape from the distributed lag
of investment on changes in output. In the literature, this model is known as the modified
neoclassical model.
In a broad sense, the managerial and the information-theoretic approaches to investment,
that are currently in vogue, can be viewed as modem versions of the liquidity theory. Both
approaches emphasize the role of internal finance as the fundamental determinant of investment
decisions. i.e., Both theories predict a positive relationship between cash flows and investment.
In the information-theoretic view, internal and external finance are not substitutes because
of information asymmetries between insiders and outsiders. In the managerial view, internal
finance is preferred since it facilitates discretionary behavior by managers that may run counter
to the interests of the shareholders. Managers may pursue goals that are separate from the
welfare maximization of shareholders, either through the pursuit of growth maximization or
through the excessive consumption of perquisites.4
In a chronological sense, the managerial approach to investment predates the information-
theoretic approach. While the managerial theory of the firm is due to Marris (1963, 1964), the
' See Samuel (1996a) for a more detailed discussion of the managerial and information-theoreticapproaches. The original thesis of separation of ownership and control (management) is due to Berle andMeans (1932).
6

formal modelling and testing of the managerial theory of investment came with Grabowski and
Mueller (1972). The information-theoretic approach to investment is really an off-shoot of
Akerloff's (1970) paper on the market for lemons. Akerloff (1970) showed that information
asymmetries could interfere with the normal functioning of markets and could lead to their
breakdown. The problems could be particularly acute in some markets.
Stiglitz and Weiss (1981) and Myers and Majluff (1984) proposed important applications
of the lemons framework to the study of equity and loan markets. They pointed out that
information asymmetries could also lead to credit rationing and explain the existence of the
financing hierarchy. In fact, Greenwald et al. (1984) argued that under conditions of credit
rationing, it is the availability of capital rather than the cost of capital that matters for investment
decisions.
As far as composite models go, the accelerator-profit (cash flow) model is due to Eisner
(1978) and others. In the Eisner model, gross capital expenditures is a function of sales,
depreciation, and profits. Eisner (1978) argued that the rate of expected output should be the
primary determinant of investment. In practice, this translates to formulating investment as a
distributed lag function of current and past changes in sales. Other forces influencing the
expected profitability of investment is captured in current and past profits, which may also
capture some capital supply effects. i.e., To the extent that capital markets are imperfect, firms
tend to invest more when profits are high and less when profits are low.
In the empirical literature, the Q-cash flow model has been motivated by at least two
strands of research: (i) the information-theoretic approach to the study of investment (Fazzari
7

et al. (1988)); and (ii) the study of managerial perception versus market valuation factors in
investment decisions (Blanchard et al. (1993), Rhee and Rhee(1991)).
Fazzari et al. (1988) estimate a reduced form investment equation with cash flows and
the q ratio as the independent variables. One criticism against this reduced form approach has
been that cash flows may proxy investment demand even if the q-ratio, the supposed proxy for
investment demand, is included in the regression. Poterba (1988), for instance, notes that if
measured (average) q is a poor proxy for the true marginal q, it could be that cash flows and
true (marginal) q are also correlated. This could also lead to simultaneity bias in the estimation
process.
Blanchard et al. (1993) consider the role of the stock market as a signal to managers with
regard to investment decisions. The issue here is whether managers take cognisance of the
signals given by the stock market or by the q ratio, while undertaking capital expenditure
decisions, even if the market valuation does not match their own valuations or perceptions of
fundamentals.5
In any case, from a purely statistical/econometric point of view, the composite models
can be expected to perform better than the basic models in that the former regressions include
more independent variables. However, the empirical evidence presented in this paper is limited
to the five basic models of investment discussed above.
Empirical evidence
The validity of any model of investment is ultimately judged by its ability to explain past
data as well to make future predictions. In two separate studies, Jorgensen and Siebert (1968a,
5 See Samuel (1996b) for a detailed discussion and empirical evidence.
8

1968b) carried out detailed empirical testing of competing models--accelerator, neoclassical,
liquidity, and market value--at the firm-level and found the neoclassical model to be the best.
The Jorgensen and Siebert sample consisted of fifteen large manufacturing firms for the 1949-
1963 period.6
However, Elliott (1973) re-estimated the models of the original Jorgensen sample and
cane to quite different conclusions. Elliott's sample consisted of 184 firms for the 1947-1963
period. In cross-section estimates, cash flow model was found to be the best, while in time-series
estimates, the accelerator model was better than all others. In general, Elliott's results nullified
Jorgensen's results for the neoclassical model and confirmed the need to have a more eclectic
framework towards understanding investment decisions by firms.
As noted earlier, Eisner's studies consistently indicated the superiority of the
accelerator/accelerator-cash flow models compared to the neoclassical model of investment.
Grabowski and Mueller (1972) carried out a testing of the managerial and stockholder welfare
(neoclassical) models of firm expenditures using data for 66 firms for the 1959-1966 period.
Their empirical results indicated the managerial variant of the model to be far superior to the
stockholder welfare maximization version.
From this point onwards, almost all the testing of alternative models of investment that
has been undertaken in the literature has been confined to the level of the aggregate economy.
One addition to the research agenda has been the estimation of separate models for structures
and equipment. In particular, there has been an emphasis on understanding the role of tax policy
6See Jorgensen (1971) for a survey of other studies of investment up to the 1970s.
9

in influencing overall investment expenditures as well as its composition between equipment and
structures.
For instance, Bischoff (1971) compared the alternative models of investment for the
1953-1968 period using quarterly data for the U.S. economy; separate regressions were
estimated for equipment and structures. In the case of both equipment and structures investment,
the modified neoclassical model was found to be the best, followed by the accelerator model.
Clark (1979) also undertook an investigation of the alternative investment models for the
1954-1973 period using quarterly data for the U.S. economy, with separate regressions for
equipment and structures. Like the results obtained by Bischoff (1971), Clark found modified
neoclassical model followed by the accelerator model to be the best for structures as well as
equipment. Clark therefore concluded that output was the primary determinant of non-residential
fixed investment in the economy; variables like the rental price of capital services, interest rates,
and tax rates proved to be not very helpful.
Likewise, Bernanke et al. (1988) carried out non-nested specification tests of time-series
investment models at the level of the economy; separate equations were estimated for equipment
and structures using quarterly U.S. data for the 1955-1983 period.7 The conventional goodness-
of-fit statistics indicated that no one model of investment uniformly outperformed all other
models. Of the four models, the accelerator and the modified neoclassical model were found to
be the best models for equipment investment. In the case of structures investment, Q model was
found to be the best. However, when non-nested tests that takes into account serial correlation
7 One difference between the specifications in Bernanke et al. (1988) and those of Bischoff (1971)and Clarke (1979) was that Bernanke et al. (1988) tested only four models: (i) accelerator; (ii)neoclassical; (iii) modified neoclassical; and (iv) Q. Somewhat surprisingly, they did not test the cashflow model.
10

in the residuals were performed, the Q model was found to be the best. Also, detailed Monte
Carlo evaluations did not turn up any conclusive evidence for any of the competing models of
investment.
Empirical testing of the information-theoretic approach to investment began with Fazzari
and Athey (1987) and Fazzari et al. (1988). This also marked the revival of panel data
econometrics to the study of investment decisions.1 The information-theoretic approach has
really blossomed since then.9
What is interesting to note from this discussion is that there has not been any comparison
of alternative models of investment based on firm-level data after Elliott's study in 1973. Even
in the studies done at the economy-level after 1973, the pure cash flow model has not been
tested.'° On both these counts, this paper differs from the rest of the literature. The choice of
the firm as the unit of analysis is also appropriate, given that investment decisions are
fundamentally made at the firm-level. More generally, this approach is also consistent with the
view in the literature that sees the world as a collection of firms."'
It is also somewhat ironic that even after Kuh (1963) demonstrated the appropriateness
of the fixed effects approach to the estimation of investment regressions in panel data, it was
largely ignored. For instance, Jorgensen and Siebert (1968a, 1968b) largely concentrated on
I As noted by Hsiao (1986), Kuh (1963) can be regarded as the seminal work in panel dataeconometrics.
I See for exanple the collection of papers in Hubbard (ed.) (1990). See also Hoshi et al. (1991),Oliner and Rudebusch (1993), and others.
10 While Bischoff (1971) and Clark (1979) tested the cash flow-accelerator model, Bernanke et al.(1988) did not include the cash flow model in any fbrm at all.
" See Mueller (1993) for instance.
11

time-series procedures, believing that the time-structure of investment is the key element.
Likewise, Elliott (1973) focussed on cross-section results."2
Policy implications
A proper understanding of the determinants of investment is also crucial from the
perspective of economic policy. In what follows, the policy implications of the alternative
models of investment are discussed briefly.
Since the neoclassical theory of investment regards the cost of capital as the most
important determinant, its principal policy recommendation is in terms of tax measures that
would lower the cost of capital and therefore stimulate investment."3 On the other hand, the cash
flow theories of investment argue that what matters for investment is the availability of capital
rather than the cost of capital. However, the policy implications of two of the variants of the
cash flow theory, the managerial and information-theoretic approaches, are quite different.
As noted before, the information-theoretic approach, like the neoclassical theory, is based
on the assumption of profit-maximizing behavior by firms. In the information-theoretic view,
firms are credit-constrained only because of the asymmetry of information between managers
and outside suppliers of finance. The information-theoretic approach therefore implies that funds
aix. invested at rates of return above the shareholder opportunity cost of capital.
On the other hand, managerial theory of investment argues that mangers prefer to use
intemal finance due to considerations of managerial discretion. Overinvestment of the firm's
12 The time-series approach of Bischoff (1971), Clark (1979), and Bernanke et al. (1988) are perhapsmore justified since they use aggregate rather than disaggregated data.
'3 In fact it is a common practice to use tax-adjusted user cost of capital in empirical estimations ofthe neoclassical model; likewise, tax-adjusted q ratio is also deployed in estimating the Q model.
12

resources at rates of return below the shareholder's opportunity cost of capital"4 is a matter of
great concern in the managerial theory of the firm. In particular, overinvestment by old, mature
firms could displace investment by young, dynamic firms at or above the market discount rate.
Therefore, the attendant resource allocation may not be optimal from the point of view of social
welfare."5
Another implication of the cash flow theories of investment is that since investment is
positively related to internal finance, the severity of recessions could get exacerbated. Therefore,
countercyclical policies may be helpful. Tax policy also plays a part in the cash flow theories
of investment in that they can change the amount of internal finance available firms.
The accelerator theory of investment is basically driven by demand considerations
wherein investment depends on the level of output. Therefore, fiscal and monetary policies
aimed at a steady increase in output could have a positive effect on investment.
The Q theory of investment also implies significant role for tax policy in influencing
investment decisions through modifying the q ratio and strengthening its positive relationship to
investment. Summers (1981) has shown the importance of the announcement and timing effects
of tax changes on investment using the Q-theoretic framework. While increases in the investment
14 See Mueller and Reardon (1993) for recent evidence. Brainard et al. (1980) also found thatsubstantial volume of investment in the U.S. economy had been undertaken below the opportunity costof capital, which is inconsistent with the predictions of the neoclassical theory.
" As noted by Friedman and Laibson (1989), a corporation that is largely dependent on internalfinance is not totally insulated from the judgement of the stock market. The market still prices thecompany's shares, and shareholders seeking improved returns may exert some influence on the firm'smanagement. In addition, if the market places too low a value on the firm's shares, it could become atarget for take-overs. However, there are well-known inefficiencies in the corporate governancemechanisms and the market for corporate control.
13

tax credit or accelerated depreciation stimulate investment, the effects of those increases depend
critically on the timing of the announcement and its enactment.
Given these policy implications, it is indeed important to have a proper understanding
of the determinants of capital expenditures, especially at the firm-level where these decisions are
ultimately made. This is the primary objective of this study and forms the basis for the
comparison of the alternative models of investment.
Data and variables
The objective of this paper therefore is to compare the competing models of investment
using panel data. In particular, one could question the premise of some recent research that
argues that the Q-theoretic approach is the best way to think about investment decisions."6 This
study goes back one step, and re-examines the competing theories of investment using firm-level
data. In that sense, this paper is very similar in spirit to that of Kuh (1963), Jorgenson and
Siebert (1968a, 1968b), and Elliott (1973), albeit with a bigger sample and for a later time-
period. This study is based on the capital expenditure decisions of a panel of 331 U.S.
manufacturing firms, taken from Standard and Poor's COMPUSTAT database for the 1972-1990
period. As noted before, this is the first comparison of alternative models of investment after
1973 using firm-level data.
In estimating the neoclassical and Bischoff models, two measures of the opportunity cost
of capital--used in turn for computing the user cost of capital--have been used in this paper. In
time-series regressions, the real rate of interest--the nominal rate less inflation--is used as the
16 Chirinko (1993) provides a comprehensive survey of the current state of research on investmenttheory, with particular emphasis on Q-theoretic models.
14

opportunity cost of capital. In cross-section regressions, the opportunity cost of capital is
proxied by the rate of return on firms belonging to similar risk-classes, following the procedure
outlined in Grabowski and Mueller (1972).'7 The q ratio has been computed following the
procedure in Salinger and Summers (1983).
II
Time-series estimates (Tables 1, 2, 3, 4, 5, 6, 7)
Traditionally, time-series regression estimates have been viewed as reflecting short-run
reactions. For each firm, regressions are run for each model for the 1972-1990 period. Then,
a relative ranking of the models for each firm is done, based on adjusted r2, F-ratio, and the
standard error of the regression. The estimation has been done in first differences so as to
correct for serial correlation. All the variables have been adjusted for inflation.
Regressions without lagged variables
It may be noted that for the cash flow and Q models, data is available for 18 years; for
the accelerator, neoclassical, and Bischoff models, it is 16 years. These different time periods
are due to the differences in the specifications of the models. For the neoclassical and the
Bischoff models, the opportunity cost of capital was proxied by the real rate of interest.
" For each firm, the market rate of return--dividend plus capital gains-is computed for each yearduring the 1972-90 period. Next, firms are ranked based on the variance in these returns and groupedinto risk classes consisting of the contiguous 30 firms. The average rate of return of the 30 stocks ineach sample firm's risk class is used as the estimate of the firm's opportunity cost of capital. SeeGrabowski and Mueller (1972) for more details.
15

For the whole sample of 331 firms, the rakng of models is as follows: (1) neoclassical
model; (2) Bischoff model; (3) cash flow model; (4) acceleator model;1 and (5) Q model."
Nedt, each of the models was examined in deail across firms.
(a) Aceltor model: Out of the 331 regssions, there were only 70(21%) with significant
F-ratios. Within here, the parametes were significant(5% level or better) in all 70 cases, and
the signs were correct for 69 firms.
(b) Neocla model: 129(31%) out of the 331 regressions had significant F-ratios. The
pameters were significant in 102 cases. The signs were cofrect in 100 of these regressions.
(c) Bischoffumodel: 63(19%) out of the 331 regressions had significant F-ratios. The paramets
of ineres rat to pW,Y,/cF,(say bl) and pNjY>,I/cq(say b2). Out of the 63 significant
regessions, both bl and b2 were significant in 31 cases, and were insignificant in 6 cases. In
18 instances, bI alone was significant, and in 8 cases, b2 alone was significant. In the 18 cases
that bl alone was significant, it had the correct signs (positive) in 17 instances. Likewise, in
the 8 cases that b2 alone was significant, the signs were correct in 4 cases and wrong in 4 cases.
Out of the 31 cases where both bl and b2 were significant, the signs were correct in 29 cases
and wrong in only two cases.
It should be noted that evem though the change in output is theoretically more appropria tan thelevel of outpt fr the accelerator model, the lattr fared better in empirical specifications, suggetn thatbusinessmen work towards a targeted capital-output ratio. This result is also consistent with the findingsof Clark (1979).
9 Two vemrions of the Q model were tred; one with capital expenditures (I) as the dependent variableand the other with the ratio of capital expenditures to the replacement cost of capital (MK) as thedependent variable. The latter fired better in empirical specifications and only these results are shownhere.
16

(d) Cash flow model: 62(19%) of the 331 regressions had significant F-ratios. The parameters
were significant in all of the 62 cases. The signs were correct in 57 cases.
(e) Q model: Only 25(8%) of the 331 regressions had significant F-ratios. The parameters were
significant in all the 25 cases. The signs were correct in only 9 of these cases.
Based on these results, the ranking of the models now is: (1) neoclassical model; (2)
accelerator model; (3) Bischoff model; (4) cash flow model; and (5) Q model. For the most
part, this ranking is similar to the earlier ranking, except that the accelerator model is now
ranked second (fourth earlier), and the Bischoff model is ranked fourth (second earlier). This
ranking can be considered more meaningful than the earlier one in that it is based only on
regressions with significant F-ratios. The earlier procedure was much less stringent in that it
did not require the individual regressions to be significant (in the F-ratio sense), and merely
focussed on their relative ranking, based on adjusted r. Therefore, the results based on time-
series regressions suggest that at the level of the firm, the primary determinant of capital
expenditures is the cost of capital, based here on the real interest rate. i.e., In the short-run,
the cost of capital is the most important determinant of capital expenditures.
Regressions with lagged variables
Quite clearly, one of the important determinants that of capital expenditure decisions at
the firm-level are the expectations about the future. Given the nature of the data, one cannot
capture these ex-ante elements. The next best thing is to relate capital expenditures in the
current period to variables of the previous periods. This can be done by running regressions that
include lagged variables. The results presented below are based on a one-period lag (one year).
Lags of higher order were tried, but turned out to be insignificant.
17

As before, the ranking of the competing models has been done on the basis of adjusted
r2, F-ratio, and the standard error of the regression. For the total sample of 331 firms, the
ranking is as follows: (1) neoclassical; (2) cash flow; (3) Bischoff; (4) accelerator; and (5) Q.
Next, each of these models was examined in detail across firms.
(a) Accelerator model: With the addition of lagged values, 78 regressions (compared to 70
before) are now significant, indicating an overall improvement. i.e., Adding lagged values of
changes in output increases the explanatory power of the model. Out of these 78 regressions,
both the current and lagged terms are significant in 18 cases. Of these, the signs are correct in
16 cases. In the case of the remaining regressions, the current term alone is significant in 37
cases, and in 20 cases, the lagged term alone is significant. There are 3 cases where neither the
current term nor the lagged terms are significant. The signs are correct in almost all of the
regressions.
(b) Neoclassical model: The addition of the lagged term brings about a minor decline in the
number of significant regressions from 102 to 93. In other words, the addition of the lagged
term is not important for the neoclassical model. Out of the 93 regressions, both the current and
lagged terms are significant in 29 cases. In the case of the remaining regressions, the current
term alone is significant in 51 cases, and the lagged term alone is significant in 9 cases. There
are 4 cases where both the current term and the lagged terms are not significant at all. This
result also implies that lagged terms are not important for the neoclassical model. This in tum
suggests speedy adjustment by firms to changes in cost of capital while undertaking investment.
The signs are also correct in most instances.
18

(c) Bischoff model: With the addition of lagged variables, 76 regressions have significant F-
ratios, compared to 63 before. As discussed before, the parameters of interest with regard to
the Bischoff model are the ones associated with p,.1Y,/c ,-(say bl) and p,1Y1.J/c, .(say b2). As in
the case of the regression without the lagged term, the b2 term has the correct, negative sign in
most of the cases. For instance, in the 2 cases that the current term alone is significant, it is
negative in 1 case; out of the 34 cases that the lagged term alone is significant, it is negative in
30 instances. In the 14 regressions that the current and lagged terms for b2 is significant, the
signs are correct in 12 cases. Therefore, the addition of lagged terms renders more regressions
significant and therefore strengthens the case for the Bischoff model.
(d) Cash flow model: Addition of lagged variables improves the performance of the cash flow
model as well. There are now 69 regressions with significant F-ratios, compared to 62
previously. In 16 cases, both the current and lagged terms are significant. In 28 cases, the
current term alone is significant, while the lagged term alone is significant in the remaining 23
cases. The signs are also correct in almost all the instances.
(e) Q model: Like all other models (except the neoclassical model), additional lagged variables
improve the performance somewhat. The number of significant regressions rises to 46 from 25
before. There are 12 cases where both current and lagged terms are significant; in 13 instances,
current term alone is significant and in 20 cases, the lagged term alone is significant. When the
signs of the coefficients are examined, the picture is similar. In the 20 times that the lagged
term alone is significant, the signs are correct 15 times. Likewise, out of the 13 times that both
current and lagged terms are significant, the signs are correct in 10 instances. In the 12 cases
that both the current and the lagged terms are significant, the signs of both terms are correct in
19

only 2 cases. In 9 cases, the current term has the wrong sign, while the lagged term has the
correct sign. In the remaining one instance, the current term has the right sign and the lagged
term the wrong sign. The importance of the lagged q ratio clearly underscores the forward-
looking aspect of the q ratios, guided by the stock market, in influencing investment decisions.
On the basis of these results, the ranking of models is: (1) neoclassical; (2) accelerator;
(3) Bischoff; (4) cash flow; and (5) Q. With the exception of the neoclassical model, lagged
variables improve the fit of the regressions in all cases. This certainly makes intuitive sense
since the past levels of output, cash flows, and the q ratio are expected to be important
determinants of the capital expenditure decisions at the firm-level. It is also interesting to note
that the finding with regard to the superiority of the neoclassical model in time-series regressions
is consistent with that of Jorgenson and Siebert (1968a, 1968b).
Cross-section estimates (Tables 8, 9, 10, 11, 12)
In the literature, cross-section regressions are viewed as more nearly representing
adjusted long-run equilibrium. Cross-section regressions were run for the 1972-1990 period.
For each of these years, the regression models were estimated across firms and then the models
were ranked for each year based on adjusted r2, standard error of the regression, and the F-ratio.
Given the way that the models are formulated, only the cash flow and Q models have
been estimated for 1972, and all the five models for the years from 1974 to 1990. All the
variables have been deflated by total assets to adjust for heteroscadasticity.
When the models are judged on the basis of the F-ratio, all the models turn out to be
significant, possibly due to the large sample size (N=331). The ranking of the models based
20

on adjusted r, F-ratio, and the standard error of the regression is as follows: (1) cash flow; (2)
Bischoff; (3) neoclassical; (4) accelerator; and (5) Q.
Next, these regressions were analyzed in detail in terms of the significance and signs of
coefficients. In the case of the cash flow and Q models, the coefficients are significant and have
the correct signs in all the cases. In the case of the accelerator model, the coefficients are
significant in 12 out of the 17 cases. Out of these 12 cases, the signs are correct in 9 instances.
In the case of the neoclassical model, the coefficients are significant in 16 of the 17 cases. The
signs are correct in 13 of these 17 cases. In the case of the Bischoff model, there are only eight
instances where the parameters associated with both pA Yt/c ,(say bl) and p,1,Yt_1/c, 1(say b2) are
significant. In all these eight instances, both bl and b2 have the right signs. In the remaining
nine cases, only bl is significant and the signs are correct in all the nine cases.
Therefore, the revised ranking of the models is: (1) cash flow; (2) neoclassical; (3)
accelerator; (4) Q; and (5) Bischoff. It is interesting to note that the finding with regard to the
superiority of the cash flow model in cross-section regressions is consistent with that of Elliott
(1973).
IV
Fixed effects estimates (Tables 13, 14. 15, 16, 17, 18, 19)
Fixed effects model procedures are designed to take advantage of the panel nature of the
data explicitly. They are useful in eliminating the idiosyncratic differences across firms with
regard to investment expenditures, i.e., differences that cannot be captured adequately by other
independent variables. The primary objective of fixed effects estimation is to control for
characteristics that are specific to the firm but invariant over time, over and above elements that
21

are captured through other independent variables. In other words, fixed effects procedures
reduce the omitted variable bias.
In the literature, fixed effects are also termed as individual time-invariant and period
individual-invariant variables.20 The individual time-invariant variables are variables that are the
same for a given cross-sectional unit (firm) through time, but vary across cross-sectional units.
Examples include firm-management, ability, sex, and socioeconomic background variables. The
period individual-invariant variables are variables that are the same for all cross-sectional units
at a given point in time, but vary through time. Examples include prices, interest rates, and
business confidence.
As first step, a pooled Ordinary Least Squares (OLS) regression can be run based on the
model
yit = a + (SXi + u1t (1)
Then, a fixed effects model can be done
Yit= -i + (Xit + Uit (2)
where a; captures the effects that are specific to the firm. Once the two models are estimated,
an F-test can be done for testing whether aj==a or not; i.e., whether fixed firm effects are
important or not.
Broadly speaking, there are two equivalent approaches to estimate equation (2): (i) OLS
with firm-specific dummies; and (ii) OLS based on deviations from means (for each firm, the
mean over time is computed and the deviation taken from this mean). This estimate is known
as the Least Squares Dummy Variable (LSDV) estimate, or the within-group estimate. This is
m See Hsiao (1986) for a more detailed discussion.
22

also the time-series estimate, since it only exploits the variation across years.2 ' The analysis can
be enriched by controlling for year-specific characteristics by inserting year dummies, either in
conjunction with firm-specific effects or alone. In what follows, both of these approaches have
been carried out.
Fixed versus Random effects: The next issue to consider is fixed versus random effects. One
way to think about the difference between fixed and random effects is to view the former as
applying only to the cross-sectional units (firms) in the study, and not to additional ones outside
the sample. Random effects, or the error components model, is more appropriate if the sampled
cross-sectional units are drawn from a larger population.22
In the context of this study, it would seem therefore that the random effects estimation
may be more appropriate. A general model would be
Yit = c + 3Xjt + ui +e i, (3)
While a, is fixed in the fixed effect estimation, it is random (ot+uj) in the random effects model.
Consequently, the random effects model has to be estimated using Generalized Least Squares
(GLS). The Hausman test (1978) has also been used to see if fixed or random effects is more
appropriate for the data.
Tables 13 to 19 show the results of the estimation of fixed effects and random effects
models. Model (1) incorporates both firm effects and year effects. Model (2) has only firm
effects, and no year effects; model (3) has only year effects, and no firm effects. Therefore,
21 It should be noted that while (i) and (ii) are equivalent in terms of parameter estimates, it is notso with regard to r2. Estimation under (ii) leads to much lower r2 compared to (i). This is because thedeviations from means procedure reduces the model variation(sum of squares). This paper uses approach(i).
2 See Greene (1994) for a more detailed discussion.
23

models (1), (2), and (3) represent within group estimates of the fixed effects model. Model (4)
has no firm effects and no year effects, and is simply the OLS estimate for the pooled
regression. Between group estimates are shown next. GLS(1) and GLS(2) are random effects
estimates; while GLS(1) includes year effects, GLS(2) does not have year effects. Model (5)
is a regression with only the firm effects on the right hand side. Model (6) is a regression with
only the year effects on the right hand side.
Following the practice in the literature, F-ratios have been computed to make inferences
from the various models presented. Following Hsiao (1986), model (1) can be viewed as the
unrestricted model, and models (2), (3), (4), (5), and (6) as restricted models; in practice, the
significance of the particular restriction in question is tested for. This is another way to get at
the importance of firm-specific and year-specific effects.
It is interesting to start the discussion of the results with models (5), and (6). As noted
before, model (5) is a regression with only firm dummies on the right hand side and model (6)
has only year dummies. These models attempt to answer the following question. If only the
identities (names) of the firms and time-periods (years) were known, how much of the variation
in capital expenditures could be explained?. The surprising result is that firm effects matter a
lot, while year effects alone are not so important. For instance, in the case of the model with
(I/K) and firm dummies, r9 is 0.49. Not surprisingly, this level of explanation(value of r) is
not exceeded by any of the models that do not involve fixed firm effects.
Accelerator model (Table 13)
While year effects together with firm effects turn out to be significant, year effects alone
are not significant. Comparison of models (4) and (1) clearly shows the improvement in brought
24

about by the addition of fixed firm and year effects; r2 increases from 0.73 to 0.89. Given that
year effects are not significant, it is no surprise that the parameter estimates from model (1) and
model (2) are similar, as are the estimates from models (3), (4), and the between group model.
The r2 values for the GLS models are significantly lower than those for other models. In fact,
the results from the Hausman test (based on models (1) and GLS(1)) categorically reject the
random effects model.
Neoclassical model I, I (Tables 14, 15)
The basic result is that year effects and firm effects are important, separately as well as
together. Again, the improvement in the fit of the regression is considerably better with the
addition of fixed firm effects, compared to fixed year effects. When the Hausman test is done,
the null hypothesis cannot be rejected implying that the random effects model is more
appropriate for the neoclassical model.
Bischoff model I, II (Tables 16, 17)
The results support the Bischoff model, especially the version that uses real interest rate
as the opportunity cost of capital. This makes intuitive sense, since the within-group estimates
are based on the time-series dimension of the data. When the Hausman test is done, the null
hypothesis cannot be rejected implying that the random effects model is more appropriate for
the neoclassical model.
Cash flow model (Table 18)
The basic result is that year effects and firm effects are important, separately as well as
together. However, year effects are only weakly important, since the improvement in the fit of
the regression is significantly better with the addition of fixed firm effects, compared to fixed
25

year effects. When the Hausman test is done, the null hypothesis is rejected and therefore the
fixed effects model can be accepted as being more appropriate for the cash flow model.
Q model (Table 19)
Again, year effects and firm effects are important, separately as well as together. The
fit of the regression improves significantly with the addition of fixed firm effects, compared to
fixed year effects. When the Hausman test is done, the null hypothesis is rejected and therefore
the fixed effects model can be accepted as being more appropriate for the Q model.
The ranking of the models based on the above regressions is: (1) cash flow; (2) Bischoff;
(3) neoclassical; (4) accelerator; and (5) Q.
V
Conclusions and discussion
The results of the study clearly support an eclectic approach to the study of capital
expenditure decisions at the firm-level.23 While the time-series analysis ranks the neoclassical
model as the best, the cross-section regressions gives the No. 1 spot to the cash flow model
(Table 20). Likewise, the fixed effects model regressions support the cash flow model and
emphasize the prevalence of firm-specific, idiosyncratic differences regarding capital expenditure
decisions. This result can also be viewed as vindicating the choice of the firm as the basic unit
of analysis in the study. As noted earlier, these findings of the study are consistent with earlier
evidence in the literature. If the results from cross-section regressions can be viewed as
m This is similar to the result of the pioneering study my Meyer and Kuh (1957) who fbund that theinvestment decision is subject to a multiplicity of influences and evidences different behavior underdifferent circumstances and time-periods.
26

representing the long-run equilibrium, the single-most important determinant of capital
expenditures appears to be cash flows.
These results based on the comparison of alternative models of investment are indicative
of the relative importance of the determinants of capital expenditures at the firm-level. The
results suggest that managers care more about cash flows and cost of capital than the level of
output and stock market signals (q ratio). In other words, managerial perceptions of
fundamentals facing the firm are more important than market perceptions with regard to capital
expenditure decisions at the firm-level.24
These results also suggest that contrary to the presumption in the literature, the Q model
of investment performs the worst among competing models of investment in empirical
specifications, even though it is superior to other models in terms of theoretical elegance. This
finding regarding the poor empirical performance of the Q model is consistent with the results
of Bischoff (1971), Clark (1979), and Bemanke et al. (1988) based on aggregate data.
Given this overall lackluster performance of the Q model, it would seem that mangers
are not primarily guided by the stock market with regard to investment decisions. In other
words, the stock market may be a sideshow as far as capital expenditures at the firm-level are
concerned. Therefore, these models are consistent with the findings of Morck et al. (1990) and
Samuel (1996b) regarding the limited implications of stock market activity for the resource
allocation process in the economy. This conclusion then raises two related issues: (i) if the stock
market is really a sideshow, market volatility may not really be an issue from the point of view
24 See Samuel (1996b) for a more detailed analysis of the relative importance of managerial andmarket perceptions with regard to capital expenditure decisions at the firm-level. See Blanchard et al.(1993) for a similar analysis at the aggregate level.
27

of resource allocation in the economy; and (ii) if the stock market is not important for the firm
with regard to the investment decision, what are the other implications of stock market activity
for the firm.25
With regard to developing countries, the testing of investment theories has been confined
to accelerator, neoclassical, and cash flow theories of investment.26 The application of the Q
model has been limited, given the rather exacting data requirements for the computation of the
Q ratio, following the methodology outlined in Salinger and Summers (1983). In particular, it
is difficult to estimate the replacement cost of the firm's capital stock precisely and one has to
use the book value instead.
These results are also interesting in the context of ongoing economic reforms in
developing countries. Without doubt, increasing private investment by providing appropriate
incentives has been perhaps the most critical challenge for these reforming countries and having
a proper understanding of the determinants of capital expenditures is a crucial component of this
challenge. This has become especially important for countries that are undertaking significant
privatization of economic activities and are attempting to reduce the role of the State in economic
activities in general and the size of the public investment program in particular.
In addition, the response of investment--especially private investment--to macroeconomic
stabilization in general and structural adjustment in particular has been an important issue of
' Samuel (1995) provides a detailed analysis of the financing role of the stock market and Samuel(1996c) provides a detailed analysis of the governance role of the market.
' Athey and Laumas (1994) found support for the cash flow theory of investment for India. Usingpanel data, Harris et al. (1994) and Jaramillo et al. (1993a, 1993b) found support for the cash flow theoryof investment for Indonesia and Ecuador respectively. Likewise, Nabi (1989) and Tybout (1983) foundsupport for the cash flow theory for Pakistan and Colombia respectively. Also, Bilsborrow (1977) foundsupport for accelerator and cash flow theories using panel data for manufacturing firms in Colombia.
28

debate.' Research has suggested that investment typically pauses in the wake of adjustment
lending and this pause has been attributed to the overall uncertainty that accompanies adjustment
lending, which in turn has a negative effect on investment.28 Therefore, over and above the
various factors highlighted by the alternative theories of investment that was discussed earlier,
it is necessary to consider uncertainty as an additional factor in the context of developing
countries undertaking economic reforms. This issue has also become an important for
transitional economies.2 '
A proper appreciation of the underlying factors behind capital expenditure decisions at
the firm-level in the case of developing countries has also become important in the context of
the recent world-wide interest in emerging markets. Increasingly, capital flows to developing
countries have become rapid, though transient at times, in the wake of the constant search for
unexploited arbitrage opportunities by global investors, especially institutional investors, on a
world-wide basis. From the perspective of portfolio investment as well as foreign direct
investment, a proper understanding of the dynamics of investment and economic growth in these
emerging markets is essential for sustaining these flows for the long-term.
The results of the study also has some interesting methodological and data-related issues
for developing countries. As discussed earlier, this study has shown that the firm rather than
7 See Corbo et al. (1992) for a discussion of issues related to structural adjustment and adjustmentlending. Pritchett and Summers (1993) also provide a recent overview of the issues.
I See Serven and Solimano (1994) for a recent survey of evidence regarding the negative effect ofuncertainty on investment. See Dixit and Pindyck (1994) for a more general treatment of issues relatingto uncertainty and investment. See also, Chhibber et al. (1992), Bleaney and Greenaway (1993), andBranson and Jayarajah (1995) for discussions of the impact of adjustment on investment.
2 See World Bank (1996) for an interesting review of the evidence relating to transitional economies.
29

the industry or the economy is the most appropriate unit of analysis for understanding capital
expenditure decisions at the firm-level. In particular, panel data is most useful for distinguishing
between alternative models of investment, since it controls for firm-specific and time-specific
fixed effects. This in turn is a significant challenge for developing countries, which traditionally
have had poor database infrastructure compared to developed countries.
The findings of the study also become interesting in the context of the emerging
consensus in the economics profession on looking at economic theory as being capable of
explaining economic phenomenon on a global basis, rather than being compartmentalized to
address the problems of developing and developed countries separately.30 This is of course a
fundamental departure from the earlier view in the profession and strikes at the very root of a
discipline such as development economics. In the new perspective, what distinguishes countries
are the conduct of economic policies rather than initial conditions which formed the basis for the
earlier notion of different theories being necessary to understand economic phenomenon in
developed and developing countries. If one were to go by the emerging view, the findings of
this study with regard to the determinants of capital expenditures at the firm-level for a panel
of U. S. manufacturing firms could equally be applicable to firms in developing countries.
These findings regarding the relative importance of various factors that underpin the
alternative theories of investment are also related to the larger issue of the relationship between
financial and real factors in the economy. The evidence presented in this paper regarding the
superiority of the cash flow theories of investment in cross-section and fixed effects regressions
suggest that financial decisions are indeed closely linked to real decisions in the economy. This
30 See Agenor and Montiel (1996) for an interesting exposition of this view.
30

finding is consistent with the evidence from other studies of sources and uses of funds for firms
that have shown internal finance to be the most important source of funds and capital
expenditures to be the most important use of funds and therefore a close relationship between
real and financial decisions.3 '
Last, but not least, a proper understanding of the determinants of capital expenditures at
the firm-level is also crucial for policy making purposes in developing countries. As discussed
earlier, the varying nature of policy implications associated with different models of investment
implies that policy formulation has to be closely grounded to the underlying theory of
investment. This becomes so much more critical, given the current emphasis on reducing the
role of the State in economic activity, in the overall context of economic reforms in developing
countries, that was noted earlier.
3' See Samuel (1995) for instance.
31

REFERENCES
Agenor, Pierre-Richard and Peter J. Montiel. 1996. Development Macroeconomics. Princeton,N.J.: Princeton University Press.
Akerloff, George A. 1970. The market for "lemons": Quality uncertainty and the marketmechanism. Quarterly Journal of Economics 84: 488-500.
Berle, Adolph and Gardner Means. 1932. The modem corporation and private property. NewYork: Macmillan.
Bernake, Ben, Henning Bohn, and Peter C. Reiss. 1988. Altemative non-nested specificationtests of time-series investment models. Journal of Econometrics 37: 293-326.
Bischoff, Charles W. 1971. Business investment in the 1970s:A comparison of models.Brookings Papers on Economic Activity, no.l: 13-58.
Blanchard, Olivier J., Changyong Rhee, and Lawrence H. Summers. 1993. The stock market,profit, and investment. Quarterly Journal of Economics 108: 115-36.
Bleaney, Michael and David Greenaway. 1993. Adjustment to external imbalance andinvestment slumps in developing countries. European Economic Review 37: 576-85.
Brainard, William C., and James Tobin. 1968. Pitfalls in financial model building, AmericanEconomic Review 58: 99-122.
Brainard, William C., John B. Shoven, and Laurence Weiss. 1980. The financial valuation andthe returns to capital. Brookings Papers on Economic Activity 2: 453-511.
Branson, William H. and Carl Jayarajah. 1995. Evaluating the impacts of policy adjustment.IMF seminar series.
Chenery, Hollis B. 1952. Overcapacity and the acceleration principle. Econometrica 20: 1-28.
Chhibber, Ajay, Mansoor Dailami, and Nemat Shafik. 1992. Reviving private investment indeveloping countries. New York: North-Holland.
Chirinko, Robert S. 1993. Business fixed investment spending:Modeling strategies, empiricalresults, and policy implications. Joumal of Economic Literature 31: 1875-1911.
Clark, Maurice J. 1917. Business acceleration and the law of demand: A technical factor ineconomic cycles. Journal of Political Economy 25: 217-235.
32

Clark, Peter K. 1979. Investment in the 1970s: Theory, performance, and prediction. BrookingsPapers on Economic Activity, no.1: 73-113.
Corbo, Vittorio, Stanley Fischer, and Steven B. Webb. 1992. Adjustment lending revisited:policies to restore growth. World Bank.
Dixit, Avinash K. and Robert S. Pindyck. 1994. Investment under uncertainty. Princeton,N.J.: Princeton University Press.
Donaldson, Gordon. 1961. Corporate debt capacity: A study of corporate debt policy and thedeterminants of corporate debt capacity. Boston: Division of Research, Harvard Business School.
Duesenberry, James S. 1958. Business cycles and economic growth. New York: McGraw-Hill.
Eisner, Robert. 1964. Capital expenditures, profits, and the acceleration principle. In Modelsof Income Determination, Studies in Income and Wealth 28: 137-65, 172-76. Princeton: NBER.
Eisner, Robert. 1967. A permanent income theory for investment: Some empirical explorations.American Economic Review 57: 363-90.
Eisner, Robert. 1978. Factors in Business Investment. Cambridge:Ballinger.
Eisner, Robert, and Ishaq M. Nadiri. 1968. On investment behavior and the neoclassical theory.Review of Economics and Statistics 50: 369-82.
Eisner, Robert, and Ishaq M. Nadiri. 1970. Neoclassical theory of investment behavior:Acomment. Review of Economic Statistics 52: 216-22.
Eisner, Robert, and Robert H. Strotz. 1963. Determinants of Investment. In Commission onMoney and Credit. Impacts of Monetary Policy. Englewood Cliffs, N.J.: Prentice-Hall.
Elliot, John W. 1973. Theories of corporate investment behavior revisited. American EconomicReview 63: 195-207.
Fazzari, Steven M., and Michael Athey. 1987. Asymmetric information, financing constraints,and investment. Review of Economics and Statistics 69 (3).
Fazzari, Steven M., R. Glenn Hubbard, and Bruce Peterson. 1988. Financing constraints andcorporate investment. Brookings Papers on Economic Activity 1: 141-195.
Friedman, Benjamin. M. and David I. Laibson. 1989. Economic implications of extraordinarymovements in stock prices. Brookings Papers on Economic Activity No.2; 137-89.
33

Grabowski, Henry G. and Dennis C. Mueller. 1972. Managerial and stockholder welfare modelsof firm expenditures. Review of Economics and Statistics 54: 9-24.
Greene, William H. 1993. Econometric analysis (second edition). Englewood Cliffs, N.J.:Prentice-Hall.
Greenwald, Bruce C., Joseph E. Stiglitz, and Andrew Weiss. 1984. Informational imperfectionsin capital markets and macroeconomic fluctuations. American Economic Review 74: 194-199.
Grunfeld, Yehuda. 1960. The determinants of corporate investment. In The Demand forDurable Goods, ed. Arnold C.Harberger. Chicago: University of Chicago Press.
Harris, John R., Fabio Schiantarelli, and Miranda G. Siregar. 1994. Effect of financialliberalization on the capital structure and investment decisions of Indonesian manufacturingestablishments. World Bank Economic Review 8: 17-47.
Hausman, Jerry A. 1978. Specification Tests in Econometrics. Econometrica 46: 1251-1272.
Hoshi, Takeo, Anil K. Kashyap, and David Scharfstein. 1991. Corporate structure, liquidity,and investment: Evidence from Japanese industrial groups. Quarterly Journal of Economics 106:33-60.
Hsiao, Cheng. 1986. Analysis of Panel Data. Cambridge, UK: Cambridge University Press.
Hubbard, Glenn. (ed.). 1990. Asymmetric information, capital markets and InvestmentChicago: Chicago University Press for NBER.
Hubbard, R. Glenn, Anil K. Kashyap, and Toni M. Whited. 1995. Internal finance andinvestment. Journal of Money, Credit and Banking 27: 683-701.
Jaramillo, Fidel, Fabio Schiantarelli, and Andrew Weiss. 1993a. Capital market imperfectionsbefore and after financial liberalization: A Euler equation approach to panel data for Ecuadorianmanufacturing firms. Policy Research Working Paper No. 1091. World Bank.
Jaramillo, Fidel, Fabio Schiantarelli, and Andrew Weiss. 1993b. The effect of financialliberalization on the allocation of credit: panel data evidence for Ecuador. Policy ResearchWorking Paper No. 1092. World Bank.
Jorgenson, Dale W. 1963. Capital theory and investment behavior. American Economic Review,Papers and Proceedings 53: 247-59.
Jorgenson, Dale W. 1966. Rational distributed lag functions. Econometrica 34: 135-149.
34

Jorgenson, Dale W. 1967. The theory of investment behavior. In Determinants of investmentbehavior ed., Robert Ferber, Universities-National Bureau Conference Series No.19. New York,Columbia University Press.
Jorgenson, Dale W. 1971. Econometric studies of investment behavior:A survey. Journal ofEconomic Literature 9: 1111-1147.
Jorgenson, Dale W., and Calvin D. Siebert. 1968a. A comparison of alternative theories ofcorporate investment behavior. American Economic Review 58: 681-712.
Jorgenson, Dale W., and Calvin D. Siebert. 1968b. Optimal capital accumulation and corporateinvestment behavior. Journal of Political Economy 76: 1123-51.
Koch, Alfred R. 1943. The financing of large corporations, 1920-1939. New York, NBER.
Koyck, Leendert M. 1954. Distributed lags and investment analysis. Amsterdam: North-Holland.
Kuh, Edwin. 1963. Capital stock growth: A micro econometric approach. Amsterdam: Elsevier.
Marris, Robin. 1963. A model of the "managerial" enterprise. Quarterly Journal of Economics77: 1-33.
Marris, Robin. 1964. The economic theory of managerial capitalism. Glencoe: Free Press.
Meyer, John R., and Robert R. Glauber. 1964. Investment decisions, economic forecasting, andpublic policy. Boston:Harvard University, Graduate School of Business Administration, Divisionof Research.
Meyer, John R., and Edwin Kuh. 1957. The investment decision. Cambridge, Mass.: HarvardUniversity Press.
Meyer, John R., and John S. Strong. 1990. Sustaining investment, discretionary investment, andvaluation: A residual funds study of the Paper industry. In Asymmetric Information, Corporationfinance, and Investment ed. R. Glenn Hubbard. Chicago: University of Chicago Press.
Modigliani, Franco and Merton Miller. 1958. The cost of capital, corporation finance, and thetheory of investment. American Economic Review 48: 261-297.
Morck, Randall, Andrei Shleifer, and Robert Vishny. 1990. The stock market and investment:Is the market a sideshow. Brookings Papers on Economic Activity 2: 157-216.
Mueller, Dennis C. 1993. Comment on Blair and Schary. In M. Blair (ed.) The Deal Decade:What Takeovers and Leveraged Buy-outs mean for Corporate Governance. Washington, D.C.:Brookings Institution.
35

Mueller, Dennis C. and Elizabeth Reardon. 1993. Rates of return on corporate investment.Southern Economic Journal 60: 430-453.
Myers, Stewart C. and Nicholas S. Majluff. 1984. Corporate financing and investment decisionswhen firms have information that investors do not have. Journal of Financial Economics 13:187-221.
Oliner, Steven D. and G.D. Rudebusch. 1993. Sources of the financing hierarchy for businessinvestment. Review of Economics and Statistics: 643-654.
Poterba, James M. 1988. Comments on Fazzari, Hubbard and Petersen. Brookings Papers onEconomic Activity, no.1: 200-204.
Pritchen, Lant H. and Lawrence H. Summers. 1993. The structural adjustment debate.American Economic Review 83: 383-89.
Rhee, Changyong and W. Rhee. 1991. Fundamental value and investment: Micro data evidence.Rochester Center for Economic Research Working Paper No. 282.
Salinger, Michael and Lawrence H. Summers. 1983. Tax reform and corporate investment: Amicroeconomic simulation study. In Behavioral simulation methods in tax policy analysis, ed.Martin Feldstein. Chicago: University of Chicago Press for NBER.
Samuel, Cherian. 1995. Stock market and the efficiency of investment: The financing role ofthe market. Paper presented at the Association of Indian Economic Studies's Conference.Chicago: May 19-20.
Samuel, Cherian. 1996a. Internal finance and investment: Another look. Mimeo. WorldBank.
Samuel, Cherian. 1996b. Stock market and investment: The signalling role of the market.Policy Research Working Paper No. 1612. World Bank.
Samuel, Cherian. 1996c. Stock market and investment: The governance role of the market.Policy Research Working Paper No. 1578. World Bank.
Serven, Luis and Andre Solimano (ed.) 1994. Striving for growth after adjustment: the roleof capital formation. World Bank.
Stiglitz, Joseph E., and Andrew Weiss. 1981. Credit rationing in markets with imperfectinformation. American Economic Review 71: 393-410.
Summers, Lawrence H. 1981. Taxation and corporate investment: A q-theory approach.Brookings Papers on Economic Activity 1: 67-127.
36

Tobin, James. 1969. A genal equilibrium approach to monetay theory. Journal of Money,Credit and Banking 1: 15-29.
World Bank. 1996. From plan to market. World Development Report.
37


Appendix I
Investment Models
(I) Neoclassical ModelIt = a + Efi1j(A(pY/c))t-5+Ut
(II) Modified Neoclassical (Bischoff) Model
I = of + saOl(pt-FlY.-1/ct-E,) + E02.(Pt-Ilyt-ll/ct-ll) + Ut
(III) Accelerator ModelIt = ci+ F- 1Yt + ut
(IV) Cash flow ModelI= + EOj5(CF),. + ut
(V) Q ModelLog(,/Kt) = a + EOl.Qt. + ut
where I-real capital expenditures, p-price of output, Y-quantity of output, c-usercost of capital (c=(r+d)pk, r-opportunity cost of capital, d-depreciation rate, Pk-investment goods price index. Two measures of r have been used, viz. r, and r2;r, follows the methodology outlined in Grabowski and Mueller (1972), and r2 isthe real rate of interest. In cross-section analysis, r, was used and in time-seriesanalysis, r2 was used.); Y-level of output, CF-cashflow (net income+depreciation), Q-Tobin's q ratio, the ratio of market value of the firm to thereplacement value of its assets, based on the methodology in Salinger andSummers (1983), and u, the standard error term.
Predictions:In general, the parameters associated with all the variables in the various modelsare expected to be positive. However, for the Bischoff model, the parameterassociated with the p,.1Y.,1/ct-I term is expected to be negative.
38

Table 1: Time-series estimates (N=331)Number of times the ranks is:
1__ _ 1 12 3 4 5
_ 1I UlI 1I 11 I II I II I 1I
Accelerator 44 53 93 90 77 83 81 79 36 26
Neoclassical 126 106 48 55 57 70 54 58 46 42
Biscboff 67 64 80 83 51 48 31 36 102 100
Cashflow 65 66 64 58 66 69 84 90 52 48
Q 130 42 43 T45 79 61 8s 68 93 115
I-Regressions without lags.fl-Regressions with lags.
39

Table 2: Tlme-series estimates (without lags: N=331)Number of tdas the left hand side models is better than the right hand side model
L_______ |Accelerator Neocassical Bischoff Cashflow Q
Accelerator T 130 187 163 201
Neoclassical 201 223 199 237
Bischoff 144 108 142 180
Cashflow 168 132 189 204
Q 130 94 151 127
Note: Based on the methodology in Elliott (1973).
Table 3: Time-series estimates (with lags: N=331)Number of thnes the left hand side models is better than the right hand side model
Accelerator Neoclassical Bischoff Cashflow Q
Accelerator *** 147 207 170 216
Neoclassical 184 216 189 239
Bischoff 124 115 139 185
Cashflow 161 142 192 211
Q 115 92 146 120 ***
Note: Based on the methodology in Elliott (1973).
40

Table 4: Tlme-sertes estimates (without lags: N=331)Model diagnostics
| Accelerator Neoclassical Cashflow Q
F=0 261 129 269 306
F#0 70 102 62 25
Signiflcance ofparameters*
t#O 70 102 62 25
t=o 0 0 0
Signs ofParameters
Correct signs 69 100 57 9
Wrong signs 1 2 5 16
e 5% or better.
Table 5: Time-series estimates (without lags: N=331)Model diagnostics: Bischoff model
_____________ p,__ Y_ P,__y_ p, YA/c. 1 & p, YJc,. 1
Significance ofparameterse
t=O 8 18 6
t#O 18 8 31
Signs for significantparameters
Correct signs 17 4 29
Wrong signs 1 4 2
* 5% or better.F ratio is significant for 63 regressions
41

Table 6: lime-series estimates (with lags: N=331)Model diagnostics
Accelerator Neoclasical Cashflow Q
F=0 253 238 262 285
F#0 78 93 69 46
Significance I n III II III I II III I II IIIofparameters*
t=0 20 37 3 9 51 4 23 28 2 20 13 1
t#0 37 20 18 51 9 29 28 23 16 13 20 12
Signs ofParameters
Correct signs 37 1 16 49 9 27 25 23 14 10 15 2
Wrong signs 0 1 ** 2 0 __ 3 0 *. 3 5 **
Current(Yes) ** ** 2 ** .. 2 ** * 2 ** ** 1,Lagged(No) I _ _
Current(No), *s ** 0 ** 0 ** ** 0 ** ** 9Lagged(Yes) _ ___
I-Current term only 11-Lagged term only III-Current term & Lagged term8 5% or better
42

Table 7: Time-series estimates (with lags: N=331)Model diagnostics: Bischoff model
Current term only Lagged term only Current & Lagged
Significance of p, Yt/ct l Pt Yt.1/ct-I pl1y,/Ct-1p t-,yt 1/ct-I Pt-lYt/Ct-i plYt-1 l/c,-parameters* l
t=O 2 36 34 7 15 29
t#O 36 2 7 34 19 14
Signs for parameters
Correct signs 36 1 6 30 19 12
Wrong signs 0 1 1 4 0 0
Current(Yes), 1Lagged(No)
Current(No), 1Lagged(Yes)
5 5% or betterF-ratio is significant for 76 regressions
43
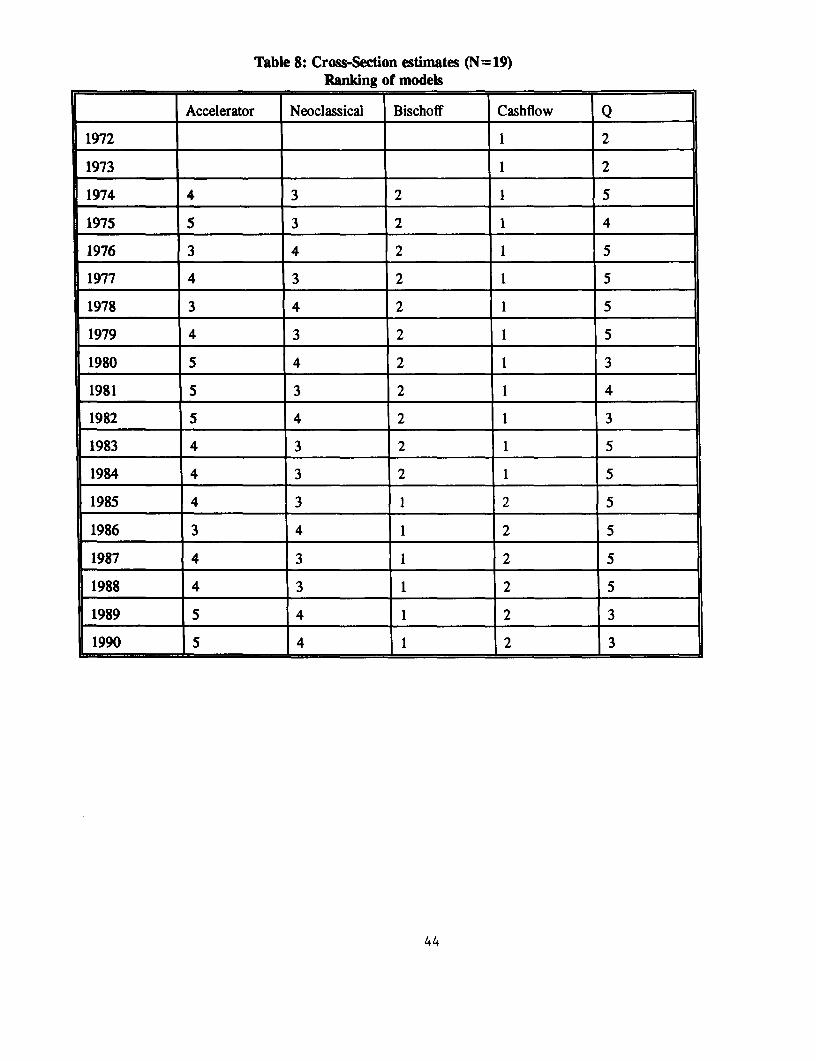
Table 8: Cross-Section estimates (N 19)Ranking of models
Accelerator Neoclassical Bischoff Cashflow Q
1972 L 1 2 1973_ _ _ _ _ _ _1 2
1974 4 3 ~ ~~~~2 1 5
1975 5 _3 2 1 4
1976 3 4 2 1 5
1977 ;4 23 2 1 5
1978 3 4 2 1 5
1979 4 3 2 1 5
1980 5 4 2 1 3
1981 5 3 2 1 4
1982 5 4 2 1 3
1983 4 3 2 1 5
1984 4 3 2 1 5
1985 4 3 1 2 5
1986 3 4 1 2 5
1987 4 3 1 2 5
1988 4 3 1 2 5
1989 5 4 1 2 3
1990 5 4 1 2 3
44

Table 9: Cross-section estimates (N =19)Number of times the rank is:
Accelerator Neoclassical Bischoff Cashflow Q1 0 0 6 13 0
2 0 0 11 6 2
3 3 10 0 0 4
4 8 7 0 0 2
5 6 0 0 0 11
Total 17 17 17 19 19
Table 10: Cross-section estimates (N= 19)Number of times the left hand side models is better than the right hand side model
_________Accelerator Neoclassical Bischoff Cashflow Q
Accelerator *** 3 0 0 11
Neoclassical 14 _ ** _ O |0 0 13
Bischoff 17 17 6 17
Cashfow 17 17 13 *** 19
IQ 6 4 0 0 ***
Note: Based on the methodology in Elliott (1973).
45

Table 11: Cross-Section estimatesModel diagnostics
Accelerator Neoclassical Cashflow Q
N 17 17 19 19
F=O 0 0 0 0
F#O 17 17 19 19
Significance ofparameters*
t#0 12 16 19 19
t=O 5 1 0 0
Signs ofParameters
Correct signs 9 13 19 19
Wrong signs 3_ 3 0 0
* 5% or better
Table 12: Cross-Section estimates (N=17)Model diagnostics: Bischoff model
.___. __P_ _lyt/Ci_ p,,,Y,,,/c,- Pt Iyt/Cpt1 &PtIcyt l/Ct
Significance ofparameters_
t=O 0 9 0
t#O 9 0 8
Signs for significantparameters
Correct signs 9 8
Wrong signs 0 0
Note: F ratio is significant for all 17 regressions5% or better
46
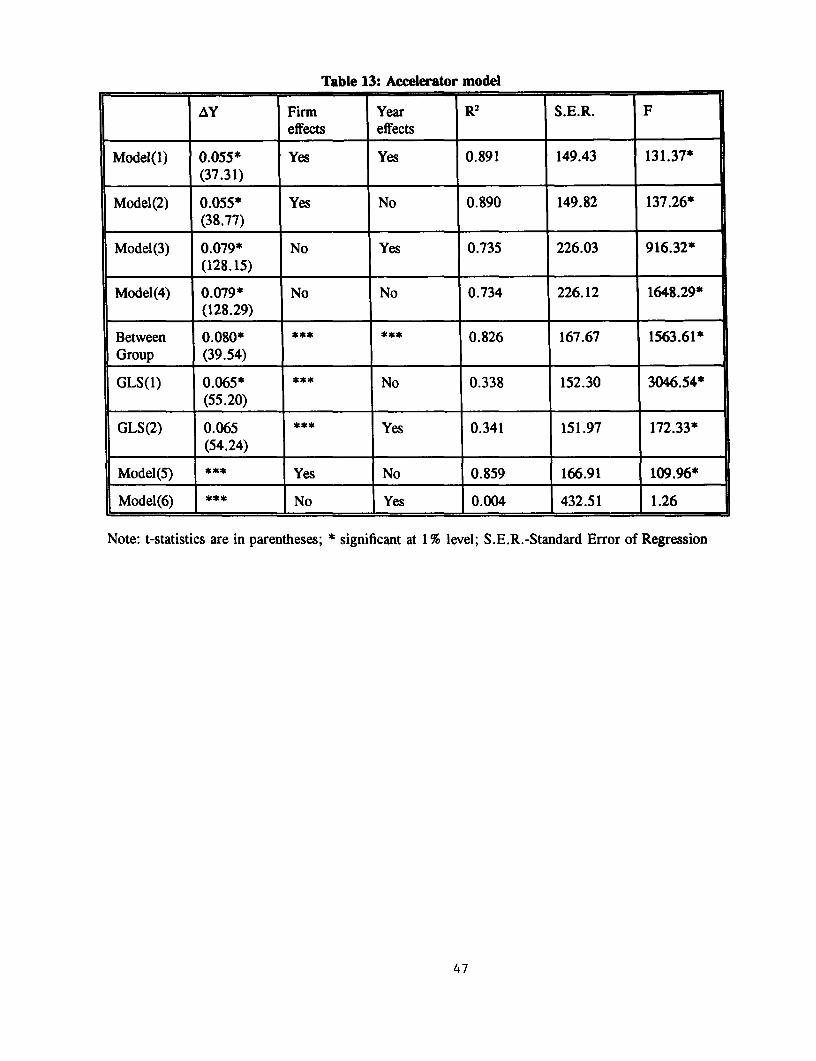
Table 13: Accelerator model
AY Firm Year R2 S.E.R. Feffects effects
Model(l) 0.055* Yes Yes 0.891 149.43 131.37*l _________ (37.31)
Model(2) 0.055* Yes No 0.890 149.82 137.26*(38.77) l
Model(3) 0.079* No Yes 0.735 226.03 916.32*(128.15)
Model(4) 0.079* No No 0.734 226.12 1648.29*__________ (128.29) l
Between 0.080* *** *** 0.826 167.67 1563.61*Group (39.54)
GLS(1) 0.065* *** No 0.338 152.30 3046.54*(55.20)
GLS(2) 0.065 *** Yes 0.341 151.97 172.33*l __________ (54.24) l
Model(5) *** Yes No 0.859 166.91 109.96*
Model(6) * No Yes 0.004 432.51 1.26
Note: t-statistics are in parentheses; * significant at 1% level; S.E.R.-Standard Error of Regression
47

Table 14: Neoclassical model I
A(pL,Yt/c) Firm Year S.E.R. Feffects effects l
Model(1) 0.006* Yes Yes 0.867 166.98 98.94*_ _ _ _ _ _ _ _ _ (14 .16 )_ _ _ _ _ _ _ _ _ _ _ _ _ _ _ _ _ _ _ _ _ _ _ _ _ _
Model(2) 0.005* Yes No 0.864 168.71 101.23*_____ _____ (13.90) _ _ _ _ _ __ _ _ _ _ _ _ _ _ _ _
Model(3) 0.015* No Yes 0.043 434.19 14.72*(15.23) _ _ _ _ _ __ _ _ _ _ _
Model(4) 0.014* No No 0.037 434.73 219.68*_____ _____ (14.82) _ _ _ _ _
Between 0.265* *** *** 0.523 277.38 362.58*Group (19.04)
GLS(l) 0.006* No 0.033 177.46 190.87*_____ _____ (13 .82 ) _ _ _ _ _ _ _ _ _ _ _ _ _ _ _ _ _ _ _ _ _ _ _ _ _ _ _ _ _
GLS(2) 0.006* l Yes 0.049 175.92 18.17*(14.07) _ _ _ _ _ _ _ _ _ _ _ _ _ _ _
Table 15: Neoclassical model II
A(pIYJ/c Firm Year R2 S.E.R. Feffects effects
Model(1) 0.063* Yes Yes 0.871 164.34 102.63_____ _____ (19 .43) _ _ _ _ _ __ _ _ _ _ _ _ _ _ _ _
Model(2) 0.063* Yes No 0.868 165.85 105.30*(19.60) _ _ _ _ __ _ _ _ _
Model(3) 0.242* No Yes 0.164 405.83 64.56*_____ _____ (32 .8 1) _ _ _ _ _ _ _ _ _ _ _ _ _ _ _ _
Model(4) 0.238* No No 0.159 406.42 1061.90*_____ ____ (32.59) _ _ _ _ _ _ _ _ _ _ _ __ _ _ _ _
Between 1.272* *** *** 0.779 188.90 1162.20*Group (34.09)
GLS(1) 0.073* *** No 0.069 185.24 418.11*_ _ _ _ _ _ _ _ _ (20 .45 ) _ _ _ _ _ _ _ _ _ _ _ _ _ _ _ _ _ _ _ _ _ _ _ _ _ _
GLS(2) 0.073 * Yes 0.081 184.02 30.25*_____ ____ (20.32) _ _ _ _ _ _ _ _ _ _ _ _ _ _ _ _
Note: t-statistics are in parentheses; * significant at 1% level; S.E.R.-Standard Error of RegressionNeoclassical I uses Grabowski-Mueller (1972) measure of cost of capital; neoclassical II uses the real rateof interest as the cost of capital.
48

Table 16: BJichoff model I
p ,Y,/c,1l Pt1Yt.-Ic,, Firm Year R2 S.E.R. Feffects effects
Model(l) 0.008* -0.006* Yes Yes 0.867 167.15 98.42*(12.12) (-8.85)
Model(2) 0.008* -0.006* Yes No 0.863 168.92 100.63*(11.95) (-8.88)
Model(3) 0.017* 4.005* No Yes 0.586 285.56 440.88*(14.38) (-4.36)
Model(4) 0.017* -0.005* No No 0.579 287.43 3872.08*(14.65) (4.13)
Between 0.025* -0.013 *** *** 0.705 217.98 395.91*Group (0.98) (-0.49)
GLS(1) 0.011* -0.006* No 0.103 177.34 322.97*(15.49) (-8.20)
GLS(2) 0.011* -0.006* Yes 0.122 175.43 44.42*(15.75) (-8.21)
Table 17: Bischoff model II
Pm1Yt/ct 1 Pp-Y, J/c, Firm Year R2 S.E.R. Feffects effects
Model(1) 0.044* -0.005** Yes Yes 0.884 155.93 115.35*(14.74) (-1.64)
Model(2) 0.043* -0.003 Yes No 0.883 156.43 120.00*(14.61) (-1.04)
Model(3) 0.064* -0.002 No Yes 0.743 225.06 899.81*__________ (15.04) (-0.54) 1
Model(4) 0.062* -0.0004 No No 0.742 225.17 8079.11 *(14.79) (-0.08)
Between 0.226** -0.168 0.839 161.39 857.36*Group (2.23) (-1.62) _
GLS(1) 0.051 * 0.0003 *** No 0.343 159.28 1470.12*(17.14) (0.09) No 0.343 159.28 1470.12*
GLS(2) 0.053* -0.002 Yes 0.346 158.93 166.35*(17.42) (-0.47) _
Note: t-ttatisdcs are in parentheces; * Significant at 1 % level; ** significant at 5% level; S.E.R.-Stndard Error of RegreSaonBischoff I us Grabowaki-Mueller (1972) maeeure of cost of capital; Biwchoff n1 uses th re al rate of interest as the cost of capital.
49

Table 18: Cashfiow model
Cash flow Firm effects Year effects R2 S.E.R. F
Model(1) 0.380* Yes Yes 0.885 151.10 130.69*(33.86)
Model(2) 0.389* Yes No 0.883 151.87 136.16*(35.20)
Model(3) 0.708* No Yes 0.845 170.63 1797.64*(184.42)
Model(4) 0.707* No No 0.844 171.17 33884.43*(184.08)
Between 0.741* *** *** 0.975 63.86 12718.38*Group (112.78)
GLS(1) 0.649* *** No 0.653 185.24 418.11*(108.73) 1 1 _
GLS(2) 0.650* *** Yes 0.655 160.17 629.71*(108.63) ___ ___
Table 19: Q model
Q Firm effects Year effects R2 S.E.R. F
Model(1) 0.057* Yes Yes 0.517 0.52 18. 19*j! _____________ (11.41)
Model(2) 0.048* Yes No 0.502 0.52 18.17*(10.14)
Model(3) 0.(117* No Yes 0.097 0.69 35.48*(2 4 .2 6 ) _ _ _ _ _ _ _ _ _ _ _ _ _ _ _ _ _ _ _ _ _ _ _ _ _ _ _ _ _ _ _ _ _ _ _ _ _ _ _ _ _ _ _ _ _ _ _
Model(4) 0.109* No No 0.078 0.70 530.17*____________ (23.03)
Between 0.184* *** 0.198 0.46 82.58*Group (9.09)
GLS(I) 0.056* *** No 0.022 0.53 142.05*___________ (11.92)
GLS(2) 0.065* *** Yes 0.047 0.52 17.14*(13.26)
Model(5) *** Yes No 0.494 0.53 17.61*
Model(6) _ No Yes 0.012 0.72 4.34*
Note: t-statistics are in parentheses; * significant at 1 % level; S.E.R.-Standard Error of Regression
50

Table 20:Ranking of Investment models
Accelerator Neoclassical Bischoff Cashflow QTime-series 4 1 2 3 5(no lags) l
Time-series 4 1 3 2 5(with lags)
Cross- 4 3 2 1 5section
Fixed 4 3 2 1 5effects(withfirm andyear effects)
Between 4 3 2 1 5group l
Pooled 4 3 2 1 5regressions l_
GLS(with 5 3 2 1 4year effects) _
51


Policy Research Working Paper Series
ContactTitle Author Date for paper
WPS1638 Private Pension Funds in Hungary: Dimitri Vittas August 1996 P. InfanteEarly Performance and Regulatory 37642Issues
WPS1639 Income Insecurity and Franck Wiebe August 1996 J. IsraelUnderemployment in Indonesia's 85117Informal Sector
WPS1640 Labor Regulations and Industrial Alejandra Cox Edwards August 1996 M. McIntosh-AlbertsRelations in Indonesia 33750
WPS1641 Poverty and Inequality During M. Luisa Ferreira August 1996 H. TaddeseStructural Adjustment in Rural 31086Tanzania
WPS1642 Banking Reform in Transition Stiin Claessens August 1996 R. VelasquezCountries 39290
WPS1643 The Consequences of Doubling Martin Rama September 1996 S. Fallonthe Minimum Wage: The Case of 38009Indonesia
WPS1644 Pricing Industrial Pollution in China: Hua Wang September 1996 H. WangAn Econometric Analysis of the David Wheeler 33255Levy System
WPS1645 How Prices and Macroeconomic Nlandu Mamingi September 1996 A. WilliamsPolicies Affect Agricultural Supply 37176and the Environment
WPS1646 Budgetary Institutions and Ed Campos September 1996 C. BernardoExpenditure Outcomes: Binding Sanjay Pradhan 31148Governments to Fiscal Performance
WPS1647 The Baltics-Banking Crises Alex Fleming September 1996 S. CoffeyObserved Lily Chu 32635
Marie-Renee Bakker
WPS1648 The Lender of Last Resort Function Gerard Capno, Jr. September 1996 B. MooreUnder a Currency Board: The Case Michael Dooley 38526of Argentina Danny Leipziger
Carl Walsh
WPS1649 Economic Regulation of Water Michael Klein September 1996 S. VivasCompanies 82809
WPS1650 Bank-Led Restructuring in Poland: Cheryl W Gray September 1996 B. MooreAn Empirical Look at the Bank Arnold Holle 38526Conciliation Process

Policy Research Working Paper Series
ContactTitle Author Date for paper
WPS1651 Bank-Led Restructuring in Poland: Cheryl W. Gray September 1996 B. MooreBankruptcy and Its Alternatives Arnold Holle 38526
WPS1652 Intra-Industry Trade, Foreign Direct Bernard Hoekman September 1996 F. HatabInvestment, and the Reorientation Simeon Djankov 35853of Eastern European Exports
WPS1653 Grants and Debt Forgiveness in Leonardo HernandezAfrica: A Descriptive Analysis
WPS1654 Indonesia's Palm Oil Subsector Donald F. Larson September 1996 P. Kokila33716
WPS1655 Uncertainty and the Price for Crude Timothy J. Considine September 1996 P. KokilaOil Reserves Donald F. Larson 33716
WPS1656 The Investment Decision: A Cherian Samuel September 1996 C. SamuelRe-Examination of Competing Theories 30802Using Panel Data