Research Update - iRDirectcdn.irdirect.net/PIR/609/850/Taglich Brothers... · electrotherapeutic...
17
See disclosures on pages 15 - 17 790 New York Ave., Huntington, N.Y 11743 (800) 383-8464 • Fax (631) 757-1333 Research Update Investors should consider this report as only a single factor in making their investment decision. Zynex, Inc. Rating: Neutral Juan Noble ZYXI $0.43 (ZYXI: OTC) March 31, 2014 2012A $40.0 $0.05 2013A 2014E 2015E Total revenues (in millions) $21.7 $13.3 $15.1 Earnings (loss) per share ($0.23) ($0.10) ($0.07) 52 - Week range $0.60 – $ 0.20 Fiscal year ends: December Shares outstanding as of Mar. 26, 2014 31.2 million Revenue/share (ttm) $0.70 Approximate float 11.8 million Price/Sales (ttm) 0.6X Market Capitalization $13.4 million Price/Sales (2015)E 0.9X Tangible Book value as of Dec. 31, 2013 $0.15 Price/Earnings (ttm) NA Price/Book 2.9 X Price/Earnings (2015)E NA Zynex, Inc., based in Lone Tree, Colorado, manufactures a line of electrotherapy devices that relieve pain while reducing reliance on drugs, and speeds rehabilitation and recovery of i mobility. The company also produces diagnostic devices and distributes electrotherapy systems manufactured by others. A substantial portion of revenue is recurring – device rentals and the sale of electrodes and batteries sent to patients using rented or purchased units. Key Investment Considerations: Reiterating Neutral investment rating. Revenue gains have slowed, reflecting a drop in demand stemming from broad reductions in Medicare reimbursements for medical devices, Medicare’s curtailment of reimbursement for TENS use to alleviate chronic lower back pain, and physician uncertainty over the impact of the Patient Protection and Affordable Care Act (PPACA). ZYXI aims to drive its growth with newer products that are less affected by reduced reimbursement but restoring growth and profitability through changes in the sales mix and sharp cuts in costs and expenses could be a lengthy process. The outlook through 2015 should remain difficult due to slowing demand and more restrictive insurance reimbursement. But we project some recovery in demand which should reverse the decline in revenue and narrow losses by 2015. For 2014 we project a loss of ($0.10) per share on revenue of $13.3 million. Previously we projected a 2014 loss of ($0.09) per share loss on revenue of $15.6. We project a 2015 loss of ($0.07) per share on revenue of $15.1 million. In 4Q13 (results released March 27, 2014) Zynex lost ($0.14) per share, on revenue of $3.4 million. We projected a 4Q loss of ($0.03) per share on revenue of $4.8 million.
Transcript of Research Update - iRDirectcdn.irdirect.net/PIR/609/850/Taglich Brothers... · electrotherapeutic...

See disclosures on pages 15 - 17
790 New York Ave., Huntington, N.Y 11743
(800) 383-8464 • Fax (631) 757-1333
Research Update Investors should consider this report as only a single factor in making their investment decision.
Zynex, Inc. Rating: Neutral
Juan Noble
ZYXI $0.43 (ZYXI: OTC) March 31, 2014
2012A $40.0 $0.05
2013A 2014E 2015E Total revenues (in millions) $21.7 $13.3 $15.1 Earnings (loss) per share ($0.23) ($0.10) ($0.07) 52 - Week range $0.60 – $ 0.20 Fiscal year ends: December
Shares outstanding as of Mar. 26, 2014 31.2 million Revenue/share (ttm) $0.70
Approximate float 11.8 million Price/Sales (ttm) 0.6X
Market Capitalization $13.4 million Price/Sales (2015)E 0.9X
Tangible Book value as of Dec. 31, 2013 $0.15 Price/Earnings (ttm) NA
Price/Book 2.9 X Price/Earnings (2015)E NA
Zynex, Inc., based in Lone Tree, Colorado, manufactures a line of electrotherapy devices that relieve pain while reducing reliance on drugs, and speeds
rehabilitation and recovery of i mobility. The company also produces diagnostic devices and distributes electrotherapy systems manufactured by
others. A substantial portion of revenue is recurring – device rentals and the sale of electrodes and batteries sent to patients using rented or purchased
units.
Key Investment Considerations:
Reiterating Neutral investment rating. Revenue gains have slowed, reflecting a drop in demand stemming from broad reductions in Medicare
reimbursements for medical devices, Medicare’s curtailment of reimbursement for TENS use to alleviate chronic lower back pain, and physician uncertainty over the impact of the Patient Protection and Affordable
Care Act (PPACA). ZYXI aims to drive its growth with newer products that are less affected by reduced reimbursement but
restoring growth and profitability through changes in the sales mix and sharp cuts in costs and expenses could be a lengthy process.
The outlook through 2015 should remain difficult due to slowing demand and more restrictive insurance reimbursement. But we project some recovery in demand which should reverse the decline in revenue and
narrow losses by 2015.
For 2014 we project a loss of ($0.10) per share on revenue of $13.3 million. Previously we projected a 2014 loss of ($0.09) per share loss on revenue of $15.6. We project a 2015 loss of ($0.07) per share on revenue of $15.1 million. In 4Q13 (results released March 27, 2014) Zynex lost ($0.14) per share, on revenue of $3.4 million. We projected a
4Q loss of ($0.03) per share on revenue of $4.8 million.

Zynex, Inc.
Taglich Brothers, Inc. 2
0
10
20
30
40
Revenue ($ Mil)
2004 - 2015E
Source: Company reports and Taglich Brothers estimates
Investment Recommendation
Reiterating Neutral investment rating.
ZYXI is trading at 0.6X trailing revenue vs. 7.3X for medical device stocks with market valuations of less than $250 million. The deep discount from the sector multiple arguably stems from ZYXI’s stalled revenue growth, worrisome year-ahead prospects, and the stock’s small float and light trading volume. While the company reports that demand was beginning to recover at the end of 1Q14, year-ahead prospects for a substantive recovery of growth momentum are still uncertain. Overview
Zynex, Inc., headquartered in Lone Tree, Colorado, was founded in 1996 and became a publicly held company in 2004 through a reverse merger with a shell company. Zynex operated as a wholesaler of European-made electrotherapy devices until its first medical device was cleared by the Food and Drug Administration (FDA) in 1999. In 2003 Zynex’s full line of electrotherapy devices and a stroke rehabilitation device were cleared by the FDA. In 2008 some of its major products were cleared for marketing in Europe. Zynex manufactures a line of pain management neuromodulator devices that reduce reliance on drugs and promotes rehabilitation and increased mobility. Zynex’s non-invasive transcutaneous electrical nerve stimulation (TENS) and interferential current (IF) systems have been used to treat pain ranging from mild persistent problems such as sore muscles to acute postoperative pain. The company’s neuromuscular electrical stimulation (NMES) systems are used mainly by physical therapists to treat victims of trauma, stroke, or incidents that degrade muscle function, enabling stroke or spinal injury victims to regain lost mobility, functionality, speech, and memory. Revenue increased sharply, growing threefold in the three years through 2012 but plummeted in the wake of healthcare reform and tighter reimbursement restrictions in 2013. Revenue growth stalled abruptly on an outlook that has become murky due to Medicare reimbursement cutbacks for medical devices (durable medical equipment), curtailment of Medicare reimbursement for TENS in treating chronic lower back pain, and uncertainty over the impact of the Patient Protection and Affordable Care Act (PPACA). In 2013, hardware sales and rental revenue fell sharply. The company aims to regain growth momentum through the sale of diagnostic devices unaffected by significant reimbursement cuts and the launch of a line of topical and transdermal pain creams for the treatment of inflammation, peripheral neuropathy, headaches and other ailments. But in light of Zynex’s current sales mix, the recovery process could be a lengthy one. In addition to its own products, Zynex distributes private labeled electrical stimulation devices, electrodes and batteries produced by other US manufacturers. A substantial portion of revenue is recurring. Rentals and electrodes and batteries sold to patients using either rental or purchased units account for three-quarters of revenue.

Zynex, Inc.
Taglich Brothers, Inc. 3
Rentals
$ 5.3
Electrotherapy
&
private label
$ 6.6
Consumables
$ 9.8
Revenue Mix - 2013
($ Millions)
Zynex’s products are either purchased or rented on a monthly basis, mainly by patients, health care providers and distributors. Health insurers that cover patients generally determine, based on the anticipated time the device will be used, if devices will be rented or purchased. More than half of the company’s revenue consists of sales to patients covered by private health insurance plans. Patients also include Medicare and Medicaid beneficiaries. Returned rental units are refurbished and made available for future rentals. Rental margins and margins on consumables, typically around 80%, range significantly higher than the 50% margins on device sales. At present, practically all of the company’s revenue derives from electrotherapy systems but products that could potentially expand and diversify the company’s target patient populations are in development. Through its ZND unit, Zynex markets nerve conductivity neurological diagnosis devices for use in hospitals and clinics. The company’s ZMS unit is developing cardiac monitoring systems. In the US, which accounts for most of its sales, the company sells its medical devices through a sales force that inlcudes independent sales representatives. Overseas, Zynex has distributors in Canada, Australia, Southeast Asia, the United Arab Emirates, the Netherlands, and Germany. An international sales manager oversees distributors covering Asia and the Middle East.
Strategy The company plans to expand into new markets by developing new neurodiagnostic and cardiac monitoring products, and by making accretive acquisitions. At this time, however, most of the company’s revenue derives from the rental and sale of pain management devices and consumables. Zynex is reevaluating the strategy for Zynex Medical, its largest business. Previously growth plans aimed to increase market penetration by sales force expansion, mainly through the recruitment of in-house sales representatives. In the aftermath of a disappointing 2013, the company has to diversify away from its electrotherapy products, which are based largely on aging technology and tend to be priced as commodities. To attenuate the impact of a sharp decline in revenue, Zynex is reducing its staff, potentially cutting annual costs by $3 million. The company has also renegotiated its lease, freeing itself from rent expenses for 12 months. To respond more effectively to fluctuating volume, minimize capital expenditures, and spread the risk of quality deficiencies and supply interruptions, Zynex maximizes its use of contract manufacturers, of which there are a large number of qualified ones available in the US and overseas. Despite reliance mainly on contractors to process the bulk of the company’s manufacturing requirements, Zynex has expanded its in-house production capability for certain TENS units. Most of the company’s technology – TENS was developed 30 years ago – is not patent protected. To keep its product knowledge proprietary, Zynex internally develops software for all of its products. All products are tested in-house to ensure quality and patient safety, and reduce the cost of warranty expenses.

Zynex, Inc.
Taglich Brothers, Inc. 4
Outlook With the aging of the population, the prevalence of age-related disease – cancer, cardiovascular disorders, stroke, diabetes, and degenerative spinal disorders – is expected to rise significantly, increasing the demand for pharmaceutical- and device-based therapy. Technological advances in device design, as seen earlier in cardiac rhythm management, coronary revascularization devices, spinal implants, orthopedic prostheses, and neuromodulation systems, should also drive the growth in demand. Gains could potentially be offset in part by more stringent regulatory 510(k) review mandated by the Food and Drug Administration Reform Act of 2012, and pressure on pricing and industry profits as the PPACA goes into effect. Sections of the law that require all medical device manufacturers to pay 2.3% of the sales price of a device may be repealed or amended in budget negotiations. The more immediate threat to Zynex’s growth outlook stems from the curtailment of Medicare reimbursement. In March 2012 the Centers for Medicare and Medicaid (CMS) released a proposal that would eliminate existing coverage of TENS devices for chronic lower back pain after 90 days. A June 2013 decision memorandum from CMS determined that “TENS is not reasonable and necessary for the treatment of CLBP under section 1862(a)(1)(A) of the Social Security Act.” That decision directly affects TENS device manufacturers. High-end neuromodulation device manufacturers such as Medtronic and St. Jude Medical (see Competition) have not experienced as severe an impact as Zynex has. But the EMPI business of DJO Global, a large TENS manufacturer, has suffered more significant revenue declines that either Medtronic or St. Jude Medical. In April 2013 Medicare payments for services to physicians were reduced by 2% as part of the automatic spending cuts in Federal spending mandated by the Budget Control Act of 2011. In June 2013 CMS announced its proposal to reduce reimbursements for home healthcare by 3.5% annually from 2014 to 2017. Neromodulation Devices This $2.6 billion segment of the US medical device market encompasses a wide range of devices that intervene in neural pathways to reduce pain and disorders stemming from illness and trauma that have impaired the central nervous system in some fashion. The neuromodulation segment includes electrotherapeutic devices, which apply an electrical impulse to an affected part of the anatomy. TENS systems fall within this group (which also includes cardiac rhythm management devices and other devices). The US TENS market grew an average of 5.4% a year between 2000 and 2012. By IBISWorld’s estimates, the US market for TENS in 2012 (latest published) was $646 million. Broad reductions in Medicare coverage for durable medical equipment (which include medical devices) and new limitations on Medicare reimbursement for chronic lower back pain are likely to curtail usage of TENS devices, particularly in the home health market. Competition
Zynex’s competitors include large broad-line medical device manufacturers with substantial neurostimulation businesses, including Medtronic, which reported a 5% rise in nine-month (ending January 2014) neuromodulation revenue to $1.4 billion million. St. Jude Medical’s 2013 neuromodulation revenue was $426 million, essentially flat compared to 2012.
DJO Global’s Recovery Science business reported 2013 revenue of $313 million, down 6% from 2022. In 20012 the Recovery Science business’ revenue dropped 7.5% due in part to changes in reimbursement for certain products in DJO’s EMPI business. EMPI’s product line consists in large part of TENS devices.
Aside from the larger competitors in this industry segment, there are more than 40 US manufacturers of electrotherapy devices, most of which carry a wide variety of products sold to the physical therapy market. IBISWorld’s TENS market data imply an average annual revenue of around $15 million per TENS manufacturer, making Zynex among the largest in this niche.
Zynex, Inc.
Taglich Brothers, Inc. 5
Competition is based on price, which is important to patients, clinicians and insurers. As all TENS devices perform the same function, based on largely dated technology, and are produced by a large number of manufacturers, they increasingly trade as commodities. Differentiating technology can also be an advantage. Despite limited potential for innovation in TENS devices, manufacturers try to differentiate their products. TENS systems are commonly differentiated by being bundled with another pain management modality, just as Zynex combines TENS with NMS and IF. Product innovations may make systems easier for untrained patients to use at home, or be mainly cosmetic, but in a commoditized market, novel features can underlie a slight competitive edge even if they do not enhance functionality.
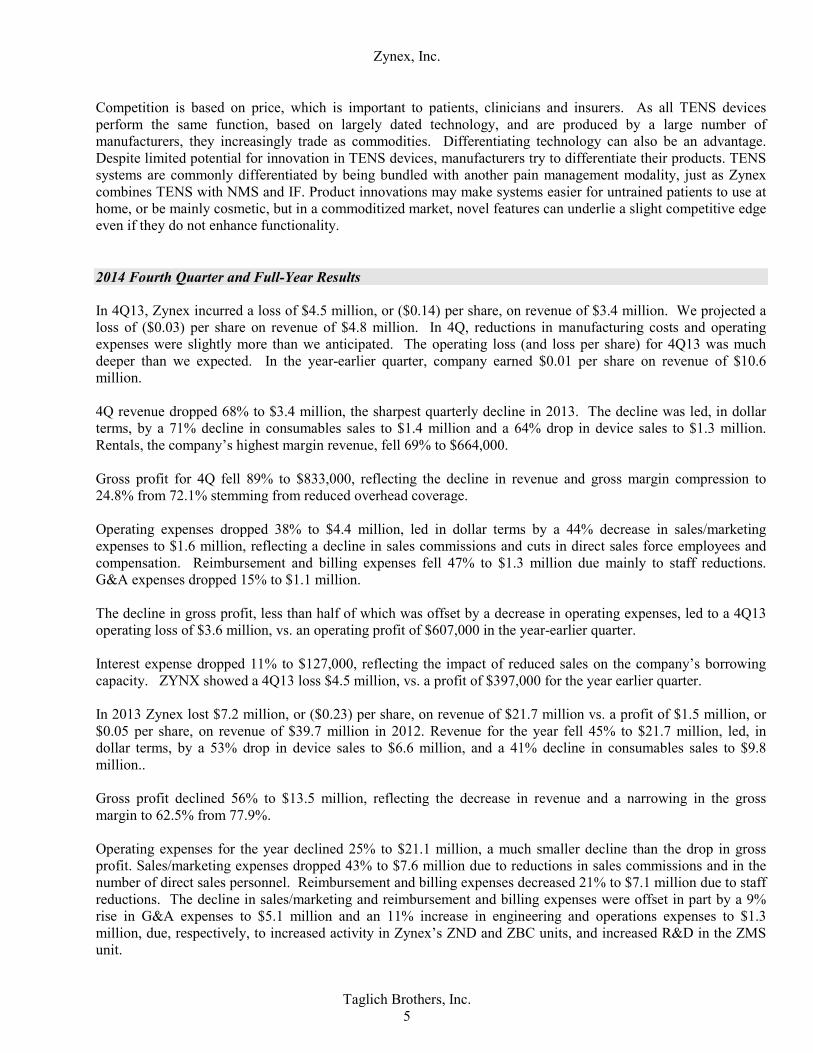
2014 Fourth Quarter and Full-Year Results In 4Q13, Zynex incurred a loss of $4.5 million, or ($0.14) per share, on revenue of $3.4 million. We projected a loss of ($0.03) per share on revenue of $4.8 million. In 4Q, reductions in manufacturing costs and operating expenses were slightly more than we anticipated. The operating loss (and loss per share) for 4Q13 was much deeper than we expected. In the year-earlier quarter, company earned $0.01 per share on revenue of $10.6 million. 4Q revenue dropped 68% to $3.4 million, the sharpest quarterly decline in 2013. The decline was led, in dollar terms, by a 71% decline in consumables sales to $1.4 million and a 64% drop in device sales to $1.3 million. Rentals, the company’s highest margin revenue, fell 69% to $664,000. Gross profit for 4Q fell 89% to $833,000, reflecting the decline in revenue and gross margin compression to 24.8% from 72.1% stemming from reduced overhead coverage. Operating expenses dropped 38% to $4.4 million, led in dollar terms by a 44% decrease in sales/marketing expenses to $1.6 million, reflecting a decline in sales commissions and cuts in direct sales force employees and compensation. Reimbursement and billing expenses fell 47% to $1.3 million due mainly to staff reductions. G&A expenses dropped 15% to $1.1 million. The decline in gross profit, less than half of which was offset by a decrease in operating expenses, led to a 4Q13 operating loss of $3.6 million, vs. an operating profit of $607,000 in the year-earlier quarter. Interest expense dropped 11% to $127,000, reflecting the impact of reduced sales on the company’s borrowing capacity. ZYNX showed a 4Q13 loss $4.5 million, vs. a profit of $397,000 for the year earlier quarter. In 2013 Zynex lost $7.2 million, or ($0.23) per share, on revenue of $21.7 million vs. a profit of $1.5 million, or $0.05 per share, on revenue of $39.7 million in 2012. Revenue for the year fell 45% to $21.7 million, led, in dollar terms, by a 53% drop in device sales to $6.6 million, and a 41% decline in consumables sales to $9.8 million.. Gross profit declined 56% to $13.5 million, reflecting the decrease in revenue and a narrowing in the gross margin to 62.5% from 77.9%. Operating expenses for the year declined 25% to $21.1 million, a much smaller decline than the drop in gross profit. Sales/marketing expenses dropped 43% to $7.6 million due to reductions in sales commissions and in the number of direct sales personnel. Reimbursement and billing expenses decreased 21% to $7.1 million due to staff reductions. The decline in sales/marketing and reimbursement and billing expenses were offset in part by a 9% rise in G&A expenses to $5.1 million and an 11% increase in engineering and operations expenses to $1.3 million, due, respectively, to increased activity in Zynex’s ZND and ZBC units, and increased R&D in the ZMS unit.

Zynex, Inc.
Taglich Brothers, Inc. 6
Quarter ending Dec 31: '13 vs. '12 Year ending Dec 31:
($ Thousands) 2013A 2013E 2012A %+/- 2013 2012 %+/-
Revenue
Rental 664 1,069 2,137 (69%) 5,270 8,917 (41%)
Sales: electrotherapy/private label 1,321 1,845 3,689 (64%) 6,624 14,152 (53%)
consumables 1,368 1,893 4,768 (71%) 9,790 16,597 (41%)#DIV/0!
Sales revenue 2,689 3,738 8,457 (68%) 16,414 30,749 (47%)
Total revenue 3,353 4,806 10,594 (68%) 21,684 39,666 (45%)
Cost of revenue
Rental 417 224 473 (12%) 1,373 1,283 7%
Sales 2,103 1,271 2,482 (15%) 6,767 7,487 (10%)
Total 2,520 1,495 2,955 (15%) 8,140 8,770 (7%)
Gross profit 833 3,311 7,639 (89%) 13,544 30,896 (56%)
Operating expenses
Sales/marketing 1,635 1,730 2,943 (44%) 7,580 13,340 (43%)
Reimbursement & billing 1,284 1,442 2,438 (47%) 7,068 8,944 (21%)
G&A 1,097 1,202 1,293 (15%) 5,139 4,702 9%
Engineering & operations 373 240 358 4% 1,301 1,173 11%
Pharmacy 55 55
Total SG&A 4,389 4,614 7,032 (38%) 21,088 28,159 (25%)
Operating income (3,556) (1,303) 607 (686%) (7,544) 2,737 (376%)
Interest income 3 3 NM
Interest expense (127) (94) (142) (11%) (607) (435) 40%
Other income (expense) 5 44 NM 77 31 NM
Pretax income (3,678) (1,398) 512 NM (8,074) 2,336 NM
Income tax (820) 559 (115) NM 790 (788) NM
Income before minority interest (4,498) (839) (7,284) 1,548
Minority interest in earnings 11 10 NM 39
Net income (4,487) (829) 397 (1230%) (7,245) 1,548 (568%)
Average shares outstanding 31,163 32,750 31,285 31,152 31,222
Earnings (loss) per share (0.14) (0.03) 0.01 NM (0.23) 0.05 NM
Margin Analysis
Gross margin - total 24.8% 68.9% 72.1% 62.5% 77.9%
Rental 37.2% 79.0% 77.9% 73.9% 85.6%
Sales 21.8% 66.0% 70.7% 58.8% 75.7%
SG&A 130.9% 96.0% 66.4% 97.3% 71.0%
Sales/marketing 48.8% 36.0% 27.8% 35.0% 33.6%
Reimbursement & billing 38.3% 30.0% 23.0% 32.6% 22.5%
G&A 32.7% 25.0% 12.2% 23.7% 11.9%
Engineering & operations 11.1% 5.0% 3.4% 6.0% 3.0%
Operating income ####### 5.7% 6.9%
Net income ####### 3.7% 3.9%
Tax rate 22.3% (40.0%) (22.5%) (9.8%) (33.7%)
Source: Company reports and Taglich Brothers estimates
Due to the decline in gross profit, which was offset to some extent by a reduction in operating expenses, Zynex showed an operating loss of $7.5 million vs. an operating profit of $2.7 million in the prior year. Interest expenses increased 40% to $607,000 due to increased borrowing. The company incurred a pretax loss of $8.1 million, down from pretax income of $2.3million for 2012. Finances In 4Q13 Zynex burned cash of $96,000 and reduced working capital by $1.8 million mainly by reductions in receivables. Capital expenditures and repayment on the revolving line of credit exceeded cash of $282,000 from operations and a reduction in rental equipment inventory, reducing cash for the quarter by $157,000 to $323,000. In 2013 the company burned cash of $1.7 million but decreased working capital by $1.3 million due mainly to a reduction in receivables, which was offset in part by increases in payables and accruals. Cash of $382,000 used in operations, capital expenditures, payments on the revolving line of credit and capital lease obligations reduced cash by $500,000 to $323,000 at the end of 2013. Credit Facility Under a December 2011 loan agreement with Doral Healthcare Finance, Zynex has an asset-backed revolving credit facility of up to $7 million at a variable interest rate equal to the LIBOR rate or 3% per annum + 3.75%, whichever is greater. The agreement matures on December 19, 2014. The company may terminate the agreement at any time prior to the maturity date upon 30 days’ notice and upon full payment of all outstanding obligations. If Zynex terminates the agreement before the maturity date, the

Zynex, Inc.
Taglich Brothers, Inc. 7
company must pay a specified early termination fee. As of December 31, 2013, $5.8 million was outstanding
under the agreement and $1.1 million was available for borrowing. As December 31, 2013, the effective interest rate under the agreement was 8% (7% interest rate and 1% fees). The agreement contains restrictive and financial covenants for asset-backed credit facilities. As of December 31, 2013, the company was not in compliance with two of the loan’s financial covenants, making the all amounts due callable by the lender. Zynex is in discussions with the lender and expects to be granted a waiver. If a waiver is not granted, could restrict or prevent borrowing while the company is in default. Projections Operations Revenue is well below ZYXI’s 2012 peak of almost $40 million; in 4Q13, the company’s run rate was approximately $13 million. In response to the sharp decline in revenue, the company slashed its annual personnel costs by $4.2 million in 2Q13 and 3Q13, and reduced 2013 rental expense by around $1 million. These reductions accounted for most of the $7 million reduction in 2013 expenses. A drop in sales commissions stemming from the decline in sales accounted for most of the rest. Our projections reflect expectations for some recovery of demand as revenue bottoms out in 1Q14. For 2014 we project a loss of $3.2 million, or ($0.10) per share, on revenue of $13.3 million. Previously, we projected a loss of $3 million, or ($0.09) per share, on revenue of $15.6 million. Revenue will drop an estimated 39% and the gross profit will fall to $9 million. The decline in sales should be offset in part as the gross margin widens to 67.9% from 62.5% reflecting some improvement in overhead coverage due to an increase in volume. Operating expenses should decrease 33% to $14 million due to further reductions in sales commissions and the full-year impact of a $4.1 million reduction in annual personnel expenses. The operating loss for the year should narrow to $5 million from $7.5 million. So long as collections do not deteriorate, average borrowings should drop, enabling Zynex to cut its interest expense 48% to $317,000. Narrower operating losses and a reduction in interest expense should reduce pretax losses by 34% to $5.4 million. For 2015 we project a loss of $2.5 million, or ($0.07) per share, on revenue of $15.1 million. A modest recover in demand should increase revenue by an estimated 14% but gross margins are likely to remain largely flat as tight pricing flexibility forces the company to restrain prices in order to regain volume growth momentum. Operating expenses should be largely flat, reflecting the limits of the ability to take more costs out of the business. The operating loss will narrow to an estimated $3.8 million from $5 million. As revenue recovers, the increase in working capital will have to be supported with heavier borrowing, increasing interest expense by 33% to $421,000. The narrower operating loss should reduce pretax losses by 22% to $4.2 million. Finances We project 2014 cash burn of $2.5 million, offset by a $4.4 reduction in working capital as receivables and inventory decrease significantly due to the drop in revenue. Cash of $1.8 million from operations will be largely offset by capital expenditures and repayments on the bank revolving line, reducing cash by $92,000 to $231,000 at the end of 2014. For 2015, we project cash burn of $1.9 million and a $700,000 increase in working capital stemming from increases in receivables and inventory as revenue increases. Cash of $2.6 million used in operations and capital expenditures will be covered by proceeds from bank borrowing. Cash should increase by $29,000 to $260,000 at the end of 2015.

Zynex, Inc.
Taglich Brothers, Inc. 8
Zynex’s Electrical Nerve Stimulation Technology and its Product Line Zynex’s principal products include pain management, rehabilitation and diagnostic technologies, some of them bundled in combination systems. In addition to the electrical nerve stimulation and diagnostic systems (table on page 9) that it manufactures, the company manufactures private label systems such as an electrical stimulator that manages female urinary incontinence and an electronic drug delivery device. Single-use supplies such as electrodes and batteries account for a sizable proportion of revenue. Electrotherapy devices are generally small, portable (hand-held in many cases), and relatively inexpensive. The TENS unit illustrated at right (not a Zynex product) is fairly typical. There are TENS systems that retail on the Internet for as little as $30. Pain Management Electrical stimulation systems, also known as neurostimulation devices, range from Medtronic’s PrimeAdvanced® and Restore™ implantables to the ubiquitous TENS (transcutaneous electrical nerve stimulation) system. TENS reduces pain by electrically stimulating nerve fibers that interfere with pain signals and by stimulating the production of pain-relieving endomorphins. Common pain relief applications for TENS include back and neck, RSD (complex regional pain syndrome), arthritis, shoulder pain, neuropathies, and other acute and chronic pain. TENS therapy is delivered through a small, external portable battery-powered generator from which electrical impulses are coursed through electrodes placed on the skin, either directly over the painful area or at certain points along the nerve pathway. The mechanism of action of TENS is explained by the gate-control theory (Melzack and Wall, 1965), illustrated at the right, as follows: in the absence of stimuli, both large and small nerve fibers are quiet and the inhibitory interneuron (I) blocks the signal in the projection neuron (P) that connects to the brain. The "gate is closed", so there is no pain sensed. With non-painful stimuli, mainly the large nerve fibers are activated. Activation of the large nerve fibers also activates the projection neuron (P), but it also activates the inhibitory interneuron (I) which then blocks the signal in the projection neuron (P) that connects to the brain. The gate remains closed so there is no pain sensed. With pain stimulation, small nerve fibers become active, activating the projection neurons (P) and blocking the inhibitory interneuron (I). Because activity of the inhibitory interneuron is blocked, it cannot block the output of the projection neuron that connects with the brain. So the gate is “open", and the brain senses pain. TENS aims to stimulate the large diameter nerve fibers, closing the gate and reducing pain. The sensation produced by the electrical stimulation appears to "override" the pain messages and may stimulate the body to produce its own natural morphine-like substance, which minimizes pain. Since it was developed more than 30 years ago TENS has been used to treat almost every type of pain, from mild persistent problems such as sore muscles to acute postoperative pain. Its most common use, however, has been in the treatment of chronic low-back pain, an application in which the American Academy of Neurology now says TENS is ineffective. Whether TENS suppresses or overrides pain signals, stimulates production of natural pain relieving chemicals, or is merely a placebo effect, it has provided pain relief in many cases. Its broad acceptance

Zynex, Inc.
Taglich Brothers, Inc. 9
PAIN MANAGEMENT/REHABILITATION
TENS TruWave
ValuTENS (private label)
MNES E-Wave
Combination:
IF and NMES IF 8000 and IF 8100
TENS, NMES and IF NexWave, TruWave Plus
TENS and NMES InWave
DIAGNOSTICS
Electromyography NM 900
NeuroSys/3 System
Photoelectric plethysmograph MEDAC Sys/3 System
Source: Zynex, Inc.
is based in part on its benign side effects profile. TENS is non-addictive, non-sedative, and can be used indefinitely without the problems associated with prolonged use of some pain medications. Zynex’s pain management technologies include interferential (IF) current, which manages pain by a mechanism similar to TENS. Low-frequency electrical impulses directed at affected tissues intersect below the skin and induce the secretion of endorphins. IF penetrates tissue more deeply than TENS, achieving greater patient comfort and increased circulation. IF is often used to treat spasms, ligament sprains and strained muscles. Rehabilitation Neuromuscular electrical stimulation (NMES) systems deliver electrical impulses to the surface over targeted muscles through electrodes. These electrical impulses cause muscles to contract as a form of exercise or physical therapy. NMES is used mainly by physical therapist to treat victims of trauma, stroke, or incidents that degrade muscle function. NEMS is also to diagnose the performance of nerves and muscles, and measure improvement after treatment.
NEMS is used in cases of chronic neuromuscular disorders such as cerebral palsy, spina bifida, club foot and some nonprogressive myopathies. It is also applied to healthy muscle to strengthen or maintain muscle mass during periods of enforced inactivity, increase range of motion, improve voluntary muscle control, and temporarily reduce spasticity. Diagnostics Electromyography (EMG) tests the electrical activity of muscles to assess their health and the nerves that control them. EMG is often performed in tandem with nerve conduction studies. Detecting abnormal electrical activity in the muscles or nerves can help clinicians diagnose injuries or other disorders, such as nerve compression or injury (as in carpal tunnel syndrome), nerve root injury, and others, including alcoholic neuropathy, cervical spondylosis, and femoral nerve dysfunction. A very thin needle electrode inserted through the skin into the muscle detects electrical activity, which is displayed on a monitor, and may be heard through a speaker. Photoelectric plethysmography (PPG) measures the intensity of light reflected from the skin surface and the red cells below to determine the blood volume of the target. That measurement enables a physician to determine erythrocyte volume and oxygen saturation. The diagnostic procedure utilizes a photosensitive cell to measure light reflected or passed through the tissue segment where a monitor is positioned. In a common application, the PPG sensor is placed over a fingertip. With each heartbeat, a surge of blood is forced through the vascular system, expanding the capillaries in the finger, changing the amount of electrical current that is translated into a signal. PPG can be used to assess the condition of patients suffering from hypertension, migraine headache or Raynaud's Disease.
In another application, PPG measures and records ear opacity through a tiny phototube and lamp clipped to the ear, measuring of the fullness of blood vessels. A PPG can be worn by aircraft pilots during high-altitude flights to signal oxygen insufficiency.
Risks In our view, these are the principal risks underlying the stock: Regulatory/Legal Zynex’s devices must be cleared for US marketing by the FDA, mostly through the 510(k) review process, a relatively low regulatory hurdle that requires the company to demonstrate that a product under

Zynex, Inc.
Taglich Brothers, Inc. 10
review is substantially equivalent to a similar device on the market (predicate device) before 1976. Devices sold in in the European Union (EU) must be CE (Conformite Europeenne) marked, showing that it meets EU health, safety, and environmental requirements. The Patient Protection and Affordable Care Act (PPACA) of 2010, which must be fully implemented by 2019, contains provisions that will increase pressure on pricing and require medical device manufacturers to pay fees on their sales. Adverse proposals by the Medicare system could cripple near-term growth. Intervening Technnology Zynex’s technology is protected by trademarks and trade secrets, rather than patents. While the company keeps it software proprietary by developing and maintaining it internally, competitors could potentially develop more effective devices.
Reimbursement Applications for reimbursement are subject to disputes which can result in carriers’ requests for refunds of previously paid claims. Refunds are frequently offset after review of the billings in question, and the sums refunded have been largely immaterial. Potential for refunds underlies some revenue uncertainty. Potential for refunds underlies some revenue uncertainty. Reimbursement requests filed electronically must meet the more detailed requirements of a new coding system and be submitted under a revised processing system. Difficulty in conforming to the new requirements could result in delays or failure to secure reimbursement for products sold to health insurance pan beneficiaries. Concentration of Receivables One private health insurance carrier accounted for 7% of net accounts receivable as of December 31, 2013. If this carrier proved to be especially problematical, reimbursements might be lost or delayed.
Competition The market for electrotherapy devices is fragmented and highly competitive. TENS and interferential current technologies have been on the market for more than 30 years and these devices increasingly tend to trade as commodities with limited pricing flexibility. Concentration of stock ownership Thomas Sandgaard owns 58.2% of ZYXI shares. This concentration of ownership gives him disproportionate influence over management actions, potentially leading to decisions that may not be in the best interest of the stockholders at large. Potential Dilution The sale of common shares to raise capital would dilute the ownership interests of current shareholders. Microcap Concerns Shares of ZYXI have risks common to the stocks of other microcap (which we define as market capitalizations of $250 million or less) companies. These risks often underlie stock price discounts from the valuations of larger-capitalization stocks. Liquidity risk, typically caused by small trading floats and very low trading volume, can lead to large spreads and high volatility in stock price. The company has approximately 12 million shares in the float. Average daily volume is 14,700 shares. Miscellaneous Risks The company's financial results and equity values are subject to other risks and uncertainties known and unknown, including but not limited to competition, operations, financial markets, regulatory risk, and/or other events. These risks may cause actual results to differ from expected results.

Zynex, Inc.
Taglich Brothers, Inc. 11
Balance Sheets
($ 000)
2011A –2015E
2011A 2012A 2013A 2014E 2015E
ASSETS
Current assets
Cash + equivalents 789 823 323 231 260
Accts receivable 10,984 12,224 7,033 4,051 4,629
Inventory 4,556 6,160 5,002 3,040 3,485
Prepaid expenses 293 243 346 70 80
Deferred tax asset 1,384 1,855 72 957 1,098
Other 42 57 928 1,000 1,000
Total 18,048 21,362 13,704 9,349 10,552
Fixed assets (net) 3,422 3,851 2,891 1,877 1,370
Deposits 170 171 400 400 400
Deferred financing fees 145 98 48 50 50
Intangibles 203 178 130 (1)
Goodwill 251
TOTAL ASSETS 21,785 25,936 17,221 11,806 12,371
LIABILITIES AND EQUITY
Current liabilities
Line of credit 3,289 5,906 5,820 4,500 7,750
Notes & other obligations - curr 131 144 92 140 140
Accts pay 2,189 2,057 2,743 1,537 1,829
Accruals 2,276 1,430 926 1,281 1,324
Income taxes payable 1,567 2,164 96 100 100
Deferred rent 296 371 7 325 325
Contingencies - curr 21
Total 9,748 12,093 9,684 7,883 11,468
Notes & other obligations (less curr) 258 114 150 150 150
Deferred rent 1,156 785 2,454 2,300 2,300
Deferred tax liability 483 786 72 100 100
Warranty liability 20 13 20 20
Contingencies - less curr 83
Shareholders' equity 10,140 12,055 4,848 1,351 (1,670)
TOTAL LIABILITIES AND EQUITY 21,785 25,936 17,221 11,807 12,370
Source: Company reports and Taglich Brothers estimates
Zynex, Inc.
Taglich Brothers, Inc. 12
Annual Income Statements
($ 000)
2011A –2015E
2011A 2012A 2013A 2014E 2015E
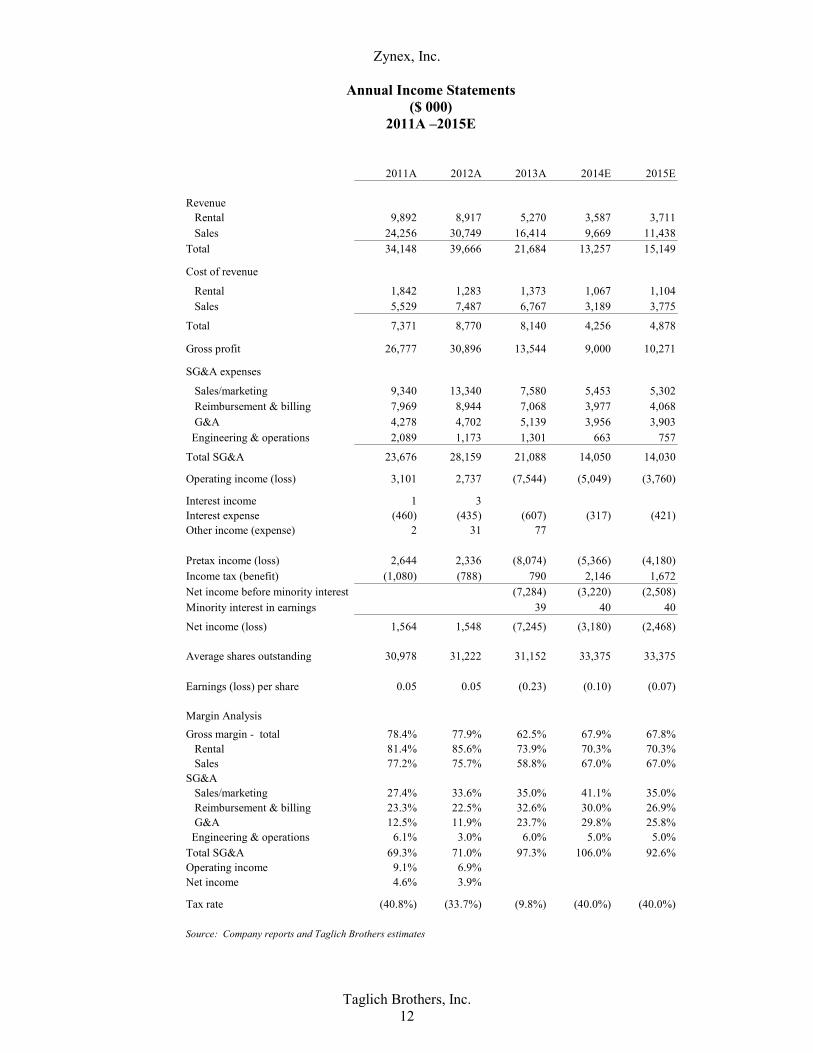
Revenue
Rental 9,892 8,917 5,270 3,587 3,711
Sales 24,256 30,749 16,414 9,669 11,438
Total 34,148 39,666 21,684 13,257 15,149
Cost of revenue
Rental 1,842 1,283 1,373 1,067 1,104
Sales 5,529 7,487 6,767 3,189 3,775
Total 7,371 8,770 8,140 4,256 4,878
Gross profit 26,777 30,896 13,544 9,000 10,271
SG&A expenses
Sales/marketing 9,340 13,340 7,580 5,453 5,302
Reimbursement & billing 7,969 8,944 7,068 3,977 4,068
G&A 4,278 4,702 5,139 3,956 3,903
Engineering & operations 2,089 1,173 1,301 663 757
Total SG&A 23,676 28,159 21,088 14,050 14,030
Operating income (loss) 3,101 2,737 (7,544) (5,049) (3,760)
Interest income 1 3 0 0
Interest expense (460) (435) (607) (317) (421)
Other income (expense) 2 31 77 0
Pretax income (loss) 2,644 2,336 (8,074) (5,366) (4,180)
Income tax (benefit) (1,080) (788) 790 2,146 1,672
Net income before minority interest (7,284) (3,220) (2,508)
Minority interest in earnings 39 40 40
Net income (loss) 1,564 1,548 (7,245) (3,180) (2,468)
Average shares outstanding 30,978 31,222 31,152 33,375 33,375
Earnings (loss) per share 0.05 0.05 (0.23) (0.10) (0.07)
Margin Analysis
Gross margin - total 78.4% 77.9% 62.5% 67.9% 67.8%
Rental 81.4% 85.6% 73.9% 70.3% 70.3%
Sales 77.2% 75.7% 58.8% 67.0% 67.0%
SG&A
Sales/marketing 27.4% 33.6% 35.0% 41.1% 35.0%
Reimbursement & billing 23.3% 22.5% 32.6% 30.0% 26.9%
G&A 12.5% 11.9% 23.7% 29.8% 25.8%
Engineering & operations 6.1% 3.0% 6.0% 5.0% 5.0%
Total SG&A 69.3% 71.0% 97.3% 106.0% 92.6%
Operating income 9.1% 6.9% (34.8%)
Net income 4.6% 3.9% (33.4%)
Tax rate (40.8%) (33.7%) (9.8%) (40.0%) (40.0%)
Source: Company reports and Taglich Brothers estimates

Zynex, Inc.
Taglich Brothers, Inc. 13
Qu
art
erl
y I
nco
me
Sta
tem
en
ts
($ T
ho
usan
ds)
20
13
A -
20
15
E
1Q
13
A2
Q1
3A
3Q
13
A4
Q1
3A
20
13
A1
Q1
4E
2Q
14
E3
Q14
E4Q
14
E2
014
E1
Q1
5E
2Q
15
E3
Q1
5E
4Q
15
E2
01
5E
Rev
enu
e
R
enta
l1
,67
91,6
43
1,2
84
66
45
,270
84
09
86
89
98
63
3,5
87
881
93
794
49
50
3,7
11
S
ales
: e
lect
roth
erap
y/p
riv
ate
lab
el p
dts
2,0
91
1,2
55
1,9
57
1,3
21
6,6
24
1,0
46
1,1
30
1,2
72
1,2
55
4,7
02
1,2
81
1,3
84
1,4
31
1,4
12
5,5
07
co
nsu
mab
les
3,8
98
2,5
74
1,9
50
1,3
68
9,7
90
1,1
31
1,2
69
1,2
68
1,3
00
4,9
67
1,4
05
1,5
08
1,4
58
1,5
60
5,9
31
T
ota
l sa
les
5,9
89
3,8
29
3,9
07
2,6
89
16
,414
2,1
77
2,3
99
2,5
40
2,5
55
9,6
69
2,6
86
2,8
92
2,8
89
2,9
71
11
,438
To
tal re
ven
ue
7,6
68
5,4
72
5,1
91
3,3
53
21
,684
3,0
16
3,3
84
3,4
38
3,4
18
13
,25
73
,568
3,8
28
3,8
32
3,9
21
15
,149
Co
st o
f re
ven
ue
R
enta
l3
01
39
82
57
41
71
,373
25
22
86
27
92
50
1,0
67
264
27
229
32
75
1,1
04
S
ales
1,8
90
1,4
85
1,2
89
2,1
03
6,7
67
71
88
16
81
38
43
3,1
89
886
98
392
49
81
3,7
75
To
tal
2,1
91
1,8
83
1,5
46
2,5
20
8,1
40
97
01
,101
1,0
91
1,0
93
4,2
56
1,1
51
1,2
55
1,2
17
1,2
56
4,8
78
Gro
ss p
rofi
t5
,47
73,5
89
3,6
45
83
31
3,5
44
2,0
46
2,2
83
2,3
47
2,3
24
9,0
00
2,4
17
2,5
73
2,6
15
2,6
65
10
,271
SG
&A
exp
ense
s
S
ales
/mar
ket
ing
1,9
06
2,2
74
1,7
65
1,6
35
7,5
80
1,3
57
1,3
54
1,3
75
1,3
67
5,4
53
1,2
49
1,3
40
1,3
41
1,3
72
5,3
02
R
eim
burs
emen
t &
bil
lin
g2
,23
12,0
37
1,5
16
1,2
84
7,0
68
90
51
,015
1,0
32
1,0
25
3,9
77
999
1,0
53
99
61
,01
94
,06
8
G
&A
1,3
56
1,5
08
1,1
78
1,0
97
5,1
39
1,0
56
1,0
15
94
69
40
3,9
56
892
99
599
61
,01
93
,90
3
E
ngi
nee
rin
g &
op
erat
ion
s3
40
33
42
54
37
31
,301
15
11
69
17
21
71
66
31
78
19
119
21
96
75
7
P
har
mac
y5
555
55
60
65
70
25
075
75
80
80
31
0
To
tal S
G&
A5
,83
36,1
53
4,7
13
4,3
89
21
,143
3,4
68
3,5
54
3,5
24
3,5
03
14
,05
03
,318
3,5
79
3,5
26
3,6
07
14
,030
Op
erat
ing
inco
me
(loss
)(3
56
)(2
,564
)(1
,06
8)
(3,5
56
)(7
,59
9)
(1,4
22
)(1
,27
1)
(1,1
77
)(1
,17
9)
(5,0
49
)(9
01
)(1
,00
6)
(91
0)
(94
2)
(3,7
60
)
Inte
rest
in
com
e
Inte
rest
exp
ense
(13
0)
(214
)(1
36
)(1
27
)(6
07
)(8
7)
(77
)(7
7)
(77
)(3
17
)(8
5)
(10
1)
(11
3)
(12
3)
(42
1)
Oth
er i
nco
me
(exp
ense
)(6
)7
85
77
Pre
tax
inco
me
(49
2)
(2,7
00
)(1
,20
4)
(3,6
78
)(8
,12
9)
(1,5
09
)(1
,34
7)
(1,2
54
)(1
,25
5)
(5,3
66
)(9
86
)(1
,10
7)
(1,0
23
)(1
,06
5)
(4,1
80
)
Inco
me
tax
(ben
efit
)1
82
97
34
55
(820
)7
90
60
45
39
50
25
02
2,1
46
394
44
340
94
26
1,6
72
Net
in
com
e b
efore
min
ori
ty i
nte
rest
(31
0)
(1,7
27
)(7
49)
(4,4
98
)(7
,33
9)
(906
)(8
08
)(7
52
)(7
53
)(3
,22
0)
(59
1)
(66
4)
(61
4)
(63
9)
(2,5
08
)
Min
ori
ty i
nte
rest
in
ear
nin
gs6
11
11
11
39
10
10
10
10
40
10
10
10
10
40
Net
in
com
e (l
oss
)(3
04
)(1
,716
)(7
38
)(4
,487
)(7
,30
0)
(896
)(7
98
)(7
42
)(7
43
)(3
,18
0)
(58
1)
(65
4)
(60
4)
(62
9)
(2,4
68
)
Av
erag
e sh
ares
ou
tsta
nd
ing
31
,14
83
1,1
48
31
,148
31,1
63
31
,152
33,0
00
33
,250
33
,50
03
3,7
50
33
,37
53
3,0
00
33
,25
03
3,5
00
33
,75
03
3,3
75
Ear
nin
gs (
loss
) p
er s
har
e(0
.01
)(0
.06
)(0
.02
)(0
.14
)(0
.23
)(0
.03
)(0
.02
)(0
.02
)(0
.02
)(0
.10
)(0
.02
)(0
.02
)(0
.02
)(0
.02
)(0
.07
)
Mar
gin
An
aly
sis
Gro
ss m
argi
n -
to
tal
71
.4%
65
.6%
70
.2%
24
.8%
62
.5%
67
.8%
67
.5%
68
.3%
68
.0%
67
.9%
67
.7%
67
.2%
68
.2%
68
.0%
67.8
%
R
enta
l82
.1%
75
.8%
80
.0%
37
.2%
73
.9%
70
.0%
71
.0%
69
.0%
71
.0%
70
.3%
70
.0%
71
.0%
69
.0%
71
.0%
70.3
%
S
ales
68
.4%
61
.2%
67
.0%
21
.8%
58
.8%
67
.0%
66
.0%
68
.0%
67
.0%
67
.0%
67
.0%
66
.0%
68
.0%
67
.0%
67.0
%
SG
&A
76
.1%
11
2.4
%90
.8%
13
0.9
%9
7.5
%1
15
.0%
10
5.0
%1
02
.5%
10
2.5
%1
06
.0%
93
.0%
93
.5%
92
.0%
92
.0%
92.6
%
S
ales
/mar
ket
ing
24
.9%
41
.6%
34
.0%
48
.8%
35
.0%
45
.0%
40
.0%
40
.0%
40
.0%
41
.1%
35
.0%
35
.0%
35
.0%
35
.0%
35.0
%
R
eim
burs
emen
t &
bil
lin
g29
.1%
37
.2%
29
.2%
38
.3%
32
.6%
30
.0%
30
.0%
30
.0%
30
.0%
30
.0%
28
.0%
27
.5%
26
.0%
26
.0%
26.9
%
G
&A
17
.7%
27
.6%
22
.7%
32
.7%
23
.7%
35
.0%
30
.0%
27
.5%
27
.5%
29
.8%
25
.0%
26
.0%
26
.0%
26
.0%
25.8
%
E
ngi
nee
rin
g &
op
erat
ion
s4
.4%
6.1
%4
.9%
11
.1%
6.0
%5
.0%
5.0
%5
.0%
5.0
%5
.0%
5.0
%5
.0%
5.0
%5
.0%
5.0
%
So
urc
e:
Co
mp
an
y r
epo
rts
an
d T
ag
lich
Bro
ther
s es
tim
ate
s

Zynex, Inc.
Taglich Brothers, Inc. 14
Annual Cash Flow Statements
($ 000)
2011A –2015E
2011A 2012A 4Q13A 2013A 2014E 2015E
Operating activities (quarter only)
Net Income 1,564 1,548 (4,554) (7,340) (3,180) (2,468)
Depreciation/ amortization 806 864 100 708 321 307
Accretion of contingency consideration (31) (24) (94)
Provision for losses - accts rec 1,190 485 27 469 320 320
Amortization of intangibles 48 92 131 48 48
Impairment of goodwill 212 251
Impairment of intangibles 60 160
Amortization - financing fees 91 50 12 50
Stock based compensation - employees 267 166 35 133 180 180
Stock based compensation for services 79 20
Provision for obsolete inventory 149 573 (196) 97
Write-off of field inventory 214 1,340
Deferred rent (221) (296) 1,392 1,299 (225) (300)
Net loss - disposal of equipment
Deferred tax benefit (295) (168) 1,069 1,069
Changes in working capital (3,992) (4,138) 1,843 1,345 4,373 (698)
Net cash from operations (362) (879) 282 (382) 1,838 (2,611)
Investing activities 0
Proceeds on lease termination
Cash paid for domain name (18)
Payment on contingency (3)
Capital expenditures (143) (644) (200) (200)
Cash paid for acquisition (245)
Change in rental equip/inventory (1,267) (1,321) 214 764 (270) (270)0 0
Net - investing activities (1,267) (1,584) 71 117 (470) (470)
Financing activities
Bank loan proceeds (repayments) - net 2,019 2,617 (471) (86) (1,320) 3,250
Deferred financing fees (147) (2)
Payments - capital lease obligations (104) (131) (39) (149) (140) (140)
Proceeds - issuance of stock 48 13 0
Net cash from financing 1,816 2,497 (510) (235) (1,460) 3,110
Net change in cash 187 34 (157) (500) (92) 29
Cash - beginning 602 789 480 823 323 231
Cash - ending 789 823 323 323 231 260
Source: Company reports and Taglich Brothers estimates
Price Chart

Zynex, Inc.
Taglich Brothers, Inc. 15
Taglich Brothers Current Ratings Distribution
Investment Banking Services for Companies Covered in the Past 12 Months
Rating # % Buy 2 7.7 Hold 1 12.5 Sell
Not Rated

Zynex, Inc.
Taglich Brothers, Inc. 16
Important Disclosures
At this writing, none of Taglich Brothers’ affiliates, officers, directors or stockholders, or any member of their families have a position in the stock of Zynex, Inc. Taglich Brothers, Inc. does not have an investment banking relationship with Zynex, Inc. and was not a manager or co-manger of any offering for the company within the last three years.
All research issued by Taglich Brothers, Inc. is based on public information. In September 2012 the company paid an initial monetary engagement fee of US$4,500 to Taglich Brothers, Inc. representing payment for the first three months of creation and dissemination of research reports, after which the company will pay Taglich Brothers, Inc. a monetary fee of US$1,500 per month for a minimum of three more months for such services.
General Disclosures
The information and statistical data contained herein have been obtained from sources, which we believe to be reliable but in no way are warranted by us as to accuracy or completeness. We do not undertake to advise you as to change in figures or our views. This is not a solicitation of any order to buy or sell. Taglich Brothers, Inc. is fully disclosed with its clearing firm, Pershing, LLC, is not a market maker and does not sell to or buy from customers on a principal basis. The above statement is the opinion of Taglich Brothers, Inc. and is not a guarantee that the target price for the stock will be met or that predicted business results for the company will occur. There may be instances when fundamental, technical and quantitative opinions contained in this report are not in concert. We, our affiliates, any officer, director or stockholder or any member of their families may from time to time purchase or sell any of the above-mentioned or related securities. Analysts and members of the Research Department are prohibited from buying or selling securities issued by the companies that Taglich Brothers, Inc. has a research relationship with, except if ownership of such securities was prior to the start of such relationship, then an analyst or member of the Research Department may sell such securities after obtaining expressed written permission from Compliance.
Analyst Certification
I, Juan Noble, the research analyst of this report, hereby certify that the views expressed in this report
accurately reflect my personal views about the subject securities and issuers; and that no part of my
compensation was, is, or will be directly or indirectly related to the specific recommendations or views
contained in this report.
Public companies mentioned in this report
ITT Corporation (NYSE: ITT) Qualmark (OTC: QMRK)
Koninklijke Philips Electronics NV (NYSE: PHG) Siemens AG (NYSE: SI)
Medtronic (NYSE: MDT) St. Jude Medical (NYSE: STJ)

Zynex, Inc.
Taglich Brothers, Inc. 17
Meaning of Ratings
Buy – The growth prospects, degree of investment risk, and valuation make the stock attractive relative to the general market or comparable stocks. Speculative Buy – Long term prospects of the company are promising but investment risk is significantly higher than it is in our BUY-rated stocks. Risk-reward considerations justify purchase mainly by high risk-tolerant accounts. In the short run, the stock may be subject to high volatility and could continue to trade at a discount to its market. Neutral – Based on our outlook the stock is adequately valued. If investment risks are within acceptable parameters, this equity could remain a holding if already owned. Sell – Based on our outlook the stock is significantly overvalued. A weak company or sector outlook and a high degree of investment risk make it likely that the stock will underperform relative to the general market. Dropping Coverage – Research coverage discontinued due to the acquisition of the company, termination of research services, non-payment for such services, diminished investor interest, or departure of the analyst.
Some notable Risks within the Microcap Market
Stocks in the Microcap segment of the market have many risks that are not as prevalent in Large-cap, Blue
Chips or even Small-cap stocks. Often it is these risks that cause Microcap stocks to trade at discounts to
their peers. The most common of these risks is liquidity risk, which is typically caused by small trading
floats and very low trading volume which can lead to large spreads and high volatility in stock price. In
addition, Microcaps tend to have significant company specific risks that contribute to lower valuations.
Investors need to be aware of the higher probability of financial default and higher degree of financial
distress inherent in the microcap segment of the market.
From time to time our analysts may choose to withhold or suspend a rating on a company. We continue to publish informational reports on such companies; however, they have no ratings or price targets. In general, we will not rate any company that has too much business or financial uncertainty for our analysts to form an investment conclusion, or that is currently in the process of being acquired.