
RESEARCH TO REALITY HONEYWELL DEPLOYS IN ITS OWN …
26
RESEARCH TO REALITY HONEYWELL DEPLOYS IN ITS OWN BUILDINGS An analysis of air quality elements to help create healthier spaces June 2021 TECHNICAL REFERENCE GUIDE
Transcript of RESEARCH TO REALITY HONEYWELL DEPLOYS IN ITS OWN …

RESEARCHTO REALITY HONEYWELLDEPLOYS IN ITS OWNBUILDINGSAn analysis of air quality elements to help create healthier spaces
June 2021
TECHNICAL REFERENCE GUIDE

TECHNICAL REFERENCE GUIDE | Anatomy of a Healthy Building | 2
TABLE OF CONTENTS
4 OVERVIEW
5 HONEYWELL HEALTHY BUILDINGS PROOF OF CONCEPT STRATEGY
6 SOLUTION DESIGN AND IMPLEMENTATION
6 Survey Process – Honeywell Audit Tool
7 Indoor Air Quality
8 Product Selection
9 Design and Installation
10 Results of Honeywell EAC + UV Deployment at Bangalore POC Office
17 Thermal Screening
19 Compliance technology: Mask Detection and Social Distancing
20 Occupancy Management
21 Touchless Access
21 Dashboards and Analytics
24 Operational Processes
25 CONCLUSION
26 REFERENCES

TECHNICAL REFERENCE GUIDE | Anatomy of a Healthy Building | 3
DISCLAIMERThis document is a draft and is provided for information purposes only. The information is provided “as is” without any representations or warranties, express or implied. This document is subject to change and nothing contained herein constitutes or is intended to constitute advice of any kind.
This document also contains information that is the proprietary and confidential property of Honeywell Inc. By acceptance hereof, each recipient agrees to use the information contained herein only for the purpose anticipated by Honeywell Inc., and not to disclose to others, copy or reproduce, any part hereof without the written consent of Honeywell Inc.
Copyright © 2021 by Honeywell Inc. All Rights Reserved.

TECHNICAL REFERENCE GUIDE | Anatomy of a Healthy Building | 4
Honeywell Healthy Buildings solutions integrate air quality, safety and security technologies along with advanced analytics. The solutions are designed to help building owners optimize building environments and support business continuity by monitoring both the building environment and compliance to new regulations. Honeywell’s Indoor Air Quality (IAQ) offerings monitor, manage and help control key parameters of air quality including temperature, relative humidity (RH), air filtration, ventilation, pressurization and surface cleaning. Honeywell’s Safety & Security offerings enable building owners to minimize risk by monitoring, detecting and responding to potential issues using integrated security tools such as thermal temperature detection, density and occupancy management, and people flow management as well as surface cleaning.
To help improve building environments and to keep operations moving, Honeywell deployed its Healthy Buildings solutions in several of its own building sites. A global company, Honeywell like many organizations, addressed the challenges of returning to a safe workplace and is making the transition to occupant health and comfort. Honeywell identified seven critical office locations for proof of concept deployments of the Healthy Buildings solutions. Seven sites were selected based on criteria such as headquarter offices, employee populations and technology centers of excellence:
• Bangalore: Research & Development centre; Home to Honeywell Technology Software lab
• Dubai: HQ for all our META businesses
• Bracknell, UK: Key regional office
• Shanghai: Key regional office
• Morris Plains: Ex Honeywell HQ, key regional office
• Altlanta: Current HQ for HBT (7) Phonenix: Large manufacturing facility
These implementations at Honeywell offices are proof of concept (POC) studies to challenge ourselves to the highest standards and to give ourselves an opportunity to be our own customer. This enabled continuous learning and adaptation of our Healthy Buildings offering to meet required optimizations, and importantly, improve the implementation of all end-to-end aspects of these critical solutions. These POCs also help us hone our internal processes around product design and delivery. We want to reassure our constituents – Honeywell employees and customers – that we have taken concrete steps to improve the building environments before they return to a site and then continue to work in a comfortable and productive environment.
Honeywell’s Healthy Buildings commitment to both its own employees and to customers is to make a building safer, show it’s safer, and keep it safer for Tomorrow or TODAY!
OVERVIEW
These deployments are designed to achieve two primary goals:
• Create a safer and healthier building environment for use by our employees, contractors, suppliers and guests.
• Gather insights on the integration design and overall installation approach of these projects to better support our customers.

TECHNICAL REFERENCE GUIDE | Anatomy of a Healthy Building | 5
For each of the Honeywell site deployments, we partnered with site leadership, Human Resources, and our Health and Safety Engineering teams to harness the synergy of technology and process control and learn what employees need to feel safer and improve their occupant experience. The POC site approach focused on near-term yet sustainable actions and technology that could be quickly implemented, and also continual improvement to the building environments.
We worked to reassure employees that a POC site took steps to be safer and healthier by implementing industry standards and guidance, creating best practices, displaying visible dashboards and communicating occupant health and wellness improvement strategies. In addition to following new guidelines such as requiring face coverings or masks, conducting temperature screenings and implementing social distancing protocols, we also looked at the building infrastructure to make measurable and lsting changes to the buildings’ environments.
The regulatory guidelines issued to date are broad in nature, primarily covering intent. We worked to implement solutions that help us to meet the regulatory guidance. In some cases, meeting the prescriptive recommendations such as pulling in 100% outside air, would require significant enhancement to a facility’s mechanical design and may also be challenging in certain climates. With the Honeywell POC sites, we focused on implementing changes that would have the most impact on improving air quality as well as to track and maintain compliance to changing regulations. The deployments were customized for each site’s needs with the opportunity to implement longer-term enhancements and continue to refine the solutions over time, and augment with additional capabilities as required.
HONEYWELL HEALTHY BUILDINGS PROOF OF CONCEPT STRATEGY
Organizations worldwide – from government agencies, non-government organizations (NGOs), industry organizations, professional organizations and individual experts – have issued information on mitigating the risk of pathogen transmission in a building environment, including:
• United States Centers for Disease Control and Prevention (CDC)
• World Health Organization (WHO)
• American Industrial Hygiene Association (AIHA)
• Building Owners & Managers Association International (BOMA)
• United States Environmental Protection Agency (EPA)
• American Society of Heating, Refrigerating, and Air-Conditioning Engineers (ASHRAE)
• Federation of European Heating, Ventilation and Air Conditioning Associations (REHVA)

TECHNICAL REFERENCE GUIDE | Anatomy of a Healthy Building | 6
A healthier building starts with a baseline of understanding – what is the current health of your building environment and where are opportunities for improvement? Conducting an audit of the building systems – from air quality, space management and integrated security – will identify potential upgrades and changes.
SURVEY PROCESS – HONEYWELL AUDIT TOOLWe conducted an audit using the Honeywell Audit Tool at every POC site to create a baseline of existing data. Then we worked to integrate a continuous flow of data into the systems to identify constant improvements and monitor conditions .
Although there are standard offerings and outcomes as part of the Honeywell Healthy Buildings solutions, every building – including our POC sites – is unique. It’s critical to understand the layouts, people flow, and HVAC architecture of a specific building in order to customize a suite of offerings that can help achieve target outcomes. These site surveys were key to understanding the diverse global platforms used at our sites. The diversity of the locations also helped us manage a variety of environmental conditions and standards such as data privacy and integrity in GDPR-compliant countries as well as cloud storage.
Based on our site learnings, we also optimized the Honeywell Audit Tool survey questions to more efficiently use the time on-site at our customers’ locations. We also integrated the knowledge in a simpler HB Score assessment tool to help guide our customers and partners through the options to improve the health of the building and its occupants.
SOLUTION DESIGN AND IMPLEMENTATION

TECHNICAL REFERENCE GUIDE | Anatomy of a Healthy Building | 7
INDOOR AIR QUALITYWe measured and quantified various parameters to monitor, quantify and improve Indoor Air Quality (IAQ) at the Honeywell POC buildings.
VENTILATION STRATEGIESASHARE Standard 62.1-2019 outlines minimum ventilation rates and other measures intended to provide IAQ that is acceptable to human occupants and to minimize adverse health effects. With our expertise and on-site teams, we implemented ventilation strategies to increase ventiallation rate where and when needed and programmed local controllers to provide dynamic ventilation to optimize between Air Quality (to minimize risk of infections & increase productivity) while ensuring when possible optimum energy preservation.
MEASUREMENT Following major AirQuality standards and recommendations, we used sensors to measure total volatile organic compounds (TVOCs), particulate matter (PM 2.5), carbon dioxide (CO2), temperature, microbial load and RH at each site.
IMPLEMENTATION Then we deployed solutions including Honeywell electronic air cleaners (with and without UV) and Signify Upper Air UV, surface cleaning UV products.
Each POC site featured:
• Sensing elements to continuously gather data
• Technical solution deployments to address specific parameters or issues
• Reporting tools to measure air quality performance, compliance analytics via dashboards through the Honeywell Forge enterprise performance management solution or other proprietary solutions

TECHNICAL REFERENCE GUIDE | Anatomy of a Healthy Building | 8
PRODUCT SELECTIONThe Healthy Buildings Air Quality package is an integrated solution that aligns enhanced sensing capabilities with improved air cleaning and an optimized building controls strategy. The outcomes are visible with the integrated dashboards, enabling easy trend analysis (providing alarms for any out-of-standard conditions) and overall views to help achieve and sustain optimal conditions.
SENSORS The provision of sensors for each parameter proved to be a challenge at the POC sites. A common gap was that all sites lacked the capability to measure TVOC and PM2.5. Rather than augment the facilities with additional single purpose sensors, we implemented an all-in-one multi-dimensional sensor in both wall-mounted and duct-mounted configurations. This all-in-one sensor measures temperature, humidity, CO2, PM2.5 and TVOC in a single unit and communicates over BACNET. The integrated sensor package provided a simpler design and allowed for a quicker implementation in site retrofits to add measurement capabilities. The minimum installation is one sensor per 10,000 sq ft. At the POC sites, a combination of the wall- and duct-mounted sensors were used. The duct-mounted sensors were installed in the return air ducts and the wall-mounted sensors were used in contained spaces such as conference rooms.
SITES C7335A WALL MOUNT MULTI-IAQ SENSOR
C7335B DUCT MOUNT MULTI-IAQ SENSOR
Bangalore 8 2
Bracknell 20 3
Morris Plains 29 13
Atlanta 72
Phoenix 4 14
Dubai 32 5
Shanghai 5 32
Even with the limited capabilities of mechanics to control variations to outside air intake and pressurization in high risk spaces such as restroom required to be negative to avoid spread of pathogens in adjacent rooms, we were able to independently verify the controls in place and they were found to be working effectively.
Sensing capability was also added to monitor both pressurization within restrooms and outside air flow to help manage the ventilation strategy.
The Honeywell Audit Tool survey results for filtration on the varying HVAC system capabilities at different sites showed that achieving the ASHRAE recommendation for MERV13 level filtration could not be done through simply implementing MERV13 media filters due to the large pressure drop. The Air Handling Units (AHUs) required a more significant upgrade to offset the pressure drop that would be caused by MERV13 media filters.

TECHNICAL REFERENCE GUIDE | Anatomy of a Healthy Building | 9
We installed Honeywell Electronic Air Cleaners (EACs) at select POC sites. Honeywell EACs are well suited as a retrofit solution as a minimal pressure drop occurs, unlike the potential for high pressure drop when installing HEPA filters in existing systems. Honeywell EACs can help save energy, while providing a better heat exchange, and can pay for itself with the savings.
F58 Series – Duct mount F58 Series – Duct mount
In addition to Honeywell EACs, the AHUs were also outfitted with ultraviolet lights. The UV lights were used independently to focus on coil cleaning, and were integrated with the Honeywell EAC. Honeywell EACs trap particles while UV lighting has been shown in laboratory testing to help reduce pathogens to improve indoor air quality. .
DESIGN AND INSTALLATIONThe IAQ sensor placement at the POC facilities involved a combination of both walls mounted and duct mounted placement. At select facilities, the sensors were placed inside the ducts and in highly used locations such as conference rooms to provide representative air quality sampling throughout the facility.
TECHNICAL REFERENCE GUIDE | Anatomy of a Healthy Building | 10
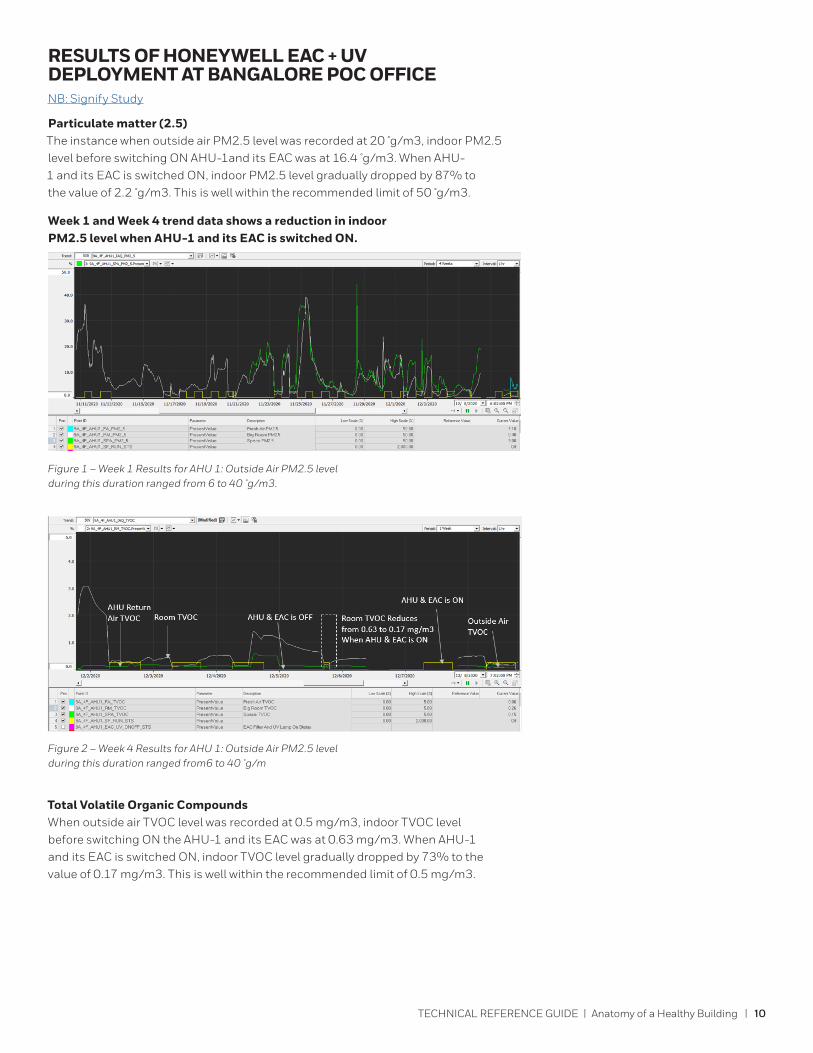
RESULTS OF HONEYWELL EAC + UV DEPLOYMENT AT BANGALORE POC OFFICE NB: Signify Study
Particulate matter (2.5)The instance when outside air PM2.5 level was recorded at 20 μg/m3, indoor PM2.5 level before switching ON AHU-1and its EAC was at 16.4 μg/m3. When AHU-1 and its EAC is switched ON, indoor PM2.5 level gradually dropped by 87% to the value of 2.2 μg/m3. This is well within the recommended limit of 50 μg/m3.
Week 1 and Week 4 trend data shows a reduction in indoor PM2.5 level when AHU-1 and its EAC is switched ON.
Figure 1 – Week 1 Results for AHU 1: Outside Air PM2.5 level during this duration ranged from 6 to 40 μg/m3.
Figure 2 – Week 4 Results for AHU 1: Outside Air PM2.5 level during this duration ranged from6 to 40 μg/m
Total Volatile Organic CompoundsWhen outside air TVOC level was recorded at 0.5 mg/m3, indoor TVOC level before switching ON the AHU-1 and its EAC was at 0.63 mg/m3. When AHU-1 and its EAC is switched ON, indoor TVOC level gradually dropped by 73% to the value of 0.17 mg/m3. This is well within the recommended limit of 0.5 mg/m3.

TECHNICAL REFERENCE GUIDE | Anatomy of a Healthy Building | 11
Figure 3 – Week 1 Outside Air TVOC level during this duration ranged from0.06 to 4 mg/m3.
Week 1 and Week trend data shows a reduction in indoor TVOC level when AHU-1 and its EAC is switched ON. There were maintenance activities conducted during 4th to 6th December, hence the TVOC level appears high at half cycle when AHU and EAC was still on.
Figure 4 – Week 4 Outside Air TVOC level during this duration ranged from 0.06 to 4 mg/m3
Carbon dioxide (CO2) Since occupancy within the building is currently significantly reduced, indoor CO2 level almost remains the same for longer durations. We can observe the indoor CO2 level is less than the outside air CO2 level by 20% whenever the AHU is ON.
Figure 5 – Week 1: Outside Air CO2 level during this duration ranged from 400 to 550 ppm.

TECHNICAL REFERENCE GUIDE | Anatomy of a Healthy Building | 12
Figure 6 – Week 4: Outside Air CO2 level during this duration ranged from 400 to 550 ppm.
Relative humidity
Figure 7 – Week 1: Outside Air Relative Humidity during this duration ranged from 58 to 78%.
Figure 8– Week 4: Outside Air Relative Humidity during this duration ranged from 58 to 78%.
Independent efficacy testing* also shows that adding the UV element to the Honeywell EAC with UV system is capable of:
• First pass germicidal efficacy ~95% 1- tested for S. Albus bacteria
• 50Pa2 drop @ 2000 cfm

TECHNICAL REFERENCE GUIDE | Anatomy of a Healthy Building | 13
Another outcome that we were able to capture at the Bangalore POC site was controlling the pressure drop across media filters. With the Honeywell EAC, the fan motors were operating with lower speed leading to a reduction in energy consumption. Further information to this is as follows:
1. Lower Pressure Drop compared to media filtersIn general, MERV 13 media filters introduce a pressure drop of 3.27” W.C for an AHU with supply air flow capacity of 20,000 to 22,000 CFM. In comparison to a Honeywell EAC (rated for MERV 13) offers less pressure drop of around 1.77” W.C.
Considering this, if existing media filters are removed and Honeywell EACs are installed with the goal of achieving a lesser pressure drop, the fan motor may consume less electrical power (approximately 44% less than the earlier electrical power consumption) to deliver the same amount of air flow. Variable frequency drives are used to run the AHU fans at a lower speed.
Pre-EAC Installation Electrical Data
S/N AHU/TFA TAG LOCATION
FILTER AIR FLOW AHU STATIC
SUPPLY FAN (BKW/HR)
PRE FILTER (MERV 7/G4)
FINE FILTER (MERV 13) IN CFM IN
ABSORBED ELECTRIC POWER
1 AHU-1 9A-4F Yes Yes 22,472 3.27 11.49
2 AHU-2 9A-4F Yes Yes 22,472 3.27 11.49
3 AHU-3 9A-4F Yes Yes 20,140 3.27 10.30
4 AHU-4 9A-4F Yes Yes 20,140 3.27 10.30
Total 43.58
Pre-EAC Installation Electrical Data
S/N AHU/TFA TAG LOCATION
FILTER AIR FLOW AIR FLOW AHU STATIC
SUPPLY FAN (BKW/HR)
HONEYWELL EAC IN CFM IN CFM INABSORBED ELECTRIC POWER
1 AHU-1 9A-4F HONEYWELL EAC 22,472 1.77 0.29 6.52
2 AHU-2 9A-4F HONEYWELL EAC 22,472 1.77 0.29 6.52
3 AHU-3 9A-4F HONEYWELL EAC 20,140 1.77 0.24 5.82
4 AHU-4 9A-4F HONEYWELL EAC 20,140 1.77 0.24 5.82
Total 85,224 24.68
2. Lower Maintenance and Replacement CostThe routine replacement cost of media filters in MERV 13 is approximately $0.06 per cubic feet per minute. CFM measures the volume of air in cubic feet for each minute it moves. For similar sized AHUs at the Bangalore site, the media filter replacement cost is approximately $1,300/year per AHU. With a Honeywell EAC, the yearly maintenance cost is negligible and the cleaning and washing costs are nearly identical to media filters.
3. Reduction in processing cost for additional fresh air intakeIf it is feasible to install a Honeywell EAC in the mixing air plenum of the AHUs, then it will be possible to filter out particulates coming from both of the fresh air intake and recirculation air path.

TECHNICAL REFERENCE GUIDE | Anatomy of a Healthy Building | 14
When using a Honeywell EAC, the need to customize an existing AHU design for maximum or 100% fresh air intake will be eliminated. Increased fresh air intake results in higher energy consumption for processing, heating and cooling of the additional fresh air, this can be avoided when using an EAC.
Cumulative Energy and Cost Avoidance AnalysisThe inclusion of our Electronic Air Cleaners in the ventilation systems also bring significant energy savings. It makes a great case for our customers to implement these systems by providing immense return on investment.
For the sake of theoretical calculations, please note the observations recorded in the table below. This proves that the return on investment on the Electronic Air Cleaners can be achieved in a span of as little as 1.5 years.
Difference between EAC & Media filter (A-B) 18.90 BkW/Hr
Operation Hours 3,600 Hrs
Power Cost 12 Rs/Kw
Saving in Per Year (C) 816,345 Rs/Year
Cost of Yearly Media Filter Replacement (D) 426,120 Rs/Year
Cost of EAC (E) 1,786,776 Rs
ROI E/(C+D) 1.44 Years
S/N PARTICULAR CAPEXOPEX
1ST YEAR 2ND YEAR 3RD YEAR 4TH YEAR 5TH YEAR 6TH YEAR 7TH YEAR 8TH YEAR 9TH YEAR 10TH YEAR
1 Media Replacement Cost (5 Rs/CFM)
0 426,120 426,120 426,120 426,120 426,120 426,120 426,120 426,120 426,120 426,120
2 Cost of Honeywell EAC
1,786,776 0 0 0 0 0 0 0 0 0 0
3 Energy Saving with EAC
816,345 816,345 816,345 816,345 816,345 816,345 816,345 816,345 816,345 816,345
4 Cumulative Saving
-1,786,776 -544,311 698,154 1,940,619 3,183,084 4,425,549 5, 668,014 6,910,479 8,152,944 9,395,409 10,637,874
Cumulative Saving
-544311
10,637,874
9,395,409
8,152,944
6,910,479
5,668,014
4,425,549
3,183,084
698,154
1,940,619

TECHNICAL REFERENCE GUIDE | Anatomy of a Healthy Building | 15
Surface cleaningHoneywell also explored surface and air cleaning with ultraviolet technology. Honeywell recently announced a strategic global alliance with Signify to deploy integrated, smart lighting solutions in commercial buildings including Signify’s Interact connected lighting system and software, and its UV-C lighting. Signify reports that in laboratory testing its UV-C light sources reduced SARS-CoV-2 virus on a surface to below detectable levels in as few as 9 seconds.3 At our Dubai POC site, we installed upper air UV from Signify and surface cleaning battens in the restrooms.
Signify Upper Air UVSignify’s upper air UV solutions works on the convection principle. It can be placed into circulation to disinfect4 the air with UV-C and can allow for cleansing of the air while business activity occurs, even with people present. It works on fluence rate and UV dosage delivery. UV-C Upper Air disinfection can be considered in the following situations:
• No or limited mechanical ventilation
• Congregate settings (i.e., environments where several people reside) and other high-risk areas
• Costs
UV-C Upper Air disinfection requires the following:
• Ceiling height to be at least 10 feet
• Low UV-reflectivity of walls and ceilings
• Ventilation should maximize air mixing
• Use of supplemental fans where ventilation is insufficient
The measurement of the UV dosage delivered by these units was done by Safester UV. Safester UV is a smartphone-based radiometer for hazard assessment of artificial UV radiation emitted by low pressure UV-C sources in workplaces, according to European community guideline 2006/25/EC.

TECHNICAL REFERENCE GUIDE | Anatomy of a Healthy Building | 16
The readings taken by Safester UVC are as follows:
The measurements show that the irradiance levels for the Signify UV-C upper air units are well within the safety range as suggested by the NIOSH standard organization and performed better than the Signify design calculations.
Surface disinfection battensIn addition to the upper air UV solution, we also installed Signify’s surface disinfection UV-C battens in a restroom. These units were put in after measurement in the Signify DIALUX tool.
• Irradiation: 17.59 mW/cm2
• Effective irradiation: 9.79 mW/cm2
• Next to the upper air unit
• Irradiation: 1.64 mW/cm2
• Effective irradiation: 0.82 mW/cm2
• 1 meter from upper air unit
• Irradiation: 0.73 mW/cm2
• Effective irradiation: 0.37 mW/cm2
• 2.5 meter from upper air unit

TECHNICAL REFERENCE GUIDE | Anatomy of a Healthy Building | 17
SAFETY AND SECURITY The Honeywell Healthy Buildings Safety and Security offerings combine our trusted access control, video equipment and analytics capabilities to deliver an integrated solution to help minimize potential risks.
Tools such as thermal imaging stations, contact tracing, mask detection, and crowd counting can help identify and isolate potential exposure. And Honeywell Healthy Buildings Safety & Security offerings use thermal screening along with video analytics to accomplish this.
Based on the POC site audits, two solutions are primarily used:
• Honeywell Pro-Watch
• Temaline access controllers.
These are supported and controlled by Honeywell’s suite of video management solutions including the Honeywell Enterprise Buildings Integrator (EBI), Honeywell Digital Video Management (DVM) and Honeywell MAXPRO, depending on the site.
THERMAL SCREENING We implemented thermal screening across our POC sites. We tested three different types of thermal cameras.
HVCT thermal cameras
Silent Sentinel ThermoRebellion
Despite the three different technologies, the common step in the process was to include an individually manned thermal screening station. We deployed different use cases to integrate the thermal screening into the POC sites’ video management systems (VMS), access control systems and Honeywell Healthy Buildings dashboard to identify ways to safely and efficiently automate the process.
USE CASE 1: INTEGRATE THERMAL CAMERA INTO EXISTING VMSThe initial implementation for all the POC sites integrated the thermal camera into each site’s existing VMS, and added an alarm notification to the Healthy Buildings dashboard.
Outcome: This approach enables the person conducting the screening to maintain a safer distance from the individual being screened; however, it still requires real-time monitoring of events to trigger engagement with an individual with a potentially elevated skin temperature in order to manage facility access.

TECHNICAL REFERENCE GUIDE | Anatomy of a Healthy Building | 18
USE CASE 2: INTEGRATED THERMAL CAMERAS INTO ACCESS CONTROL READERSFollowing the initial implementation, the second trial integrated the thermal cameras with each site’s access control systems providing an automated solution that would only require additional personnel to perform the secondary screening as an exception.
Outcome: This approach requires an understanding of the facility’s layout and people flow for a site to identify appropriate access control integration.
The Honeywell Morris Plains, New Jersey POC site features an ideal layout for access control integration with the thermal camera. Security at the site is stationed at the two main entry points (i.e., employee and visitor) and the interior access point is equipped with turnstiles with access control. We were able to automate the communication between the thermal camera and access control system to validate entry for people who have a temperature below the 100.4F threshold. This is automated as part of facility entry criteria in addition to valid credentials.
The second approach integrated the thermal camera with an access card reader. This is ideal for sites that lack a layout that can enable diverting people flow through interior access control devices with a logical screening point in the sequence.
Outcome: This approach requires employees and guests to “check-in” to an integrated thermal camera and access control reader. Upon validation of a normal temperature, their credentials would be authorized for use at access control readers at the site for a set period (~12 hrs) until such point their credentials would be deactivated and require an additional screening.
We are also testing autonomous thermal screening solutions at our POC sites with additional results to follow.

TECHNICAL REFERENCE GUIDE | Anatomy of a Healthy Building | 19
COMPLIANCE TECHNOLOGY: MASK DETECTION AND SOCIAL DISTANCINGHoneywell VMS feature video analytics are in-built functionalities and capabilities. To test compliance capabilities, we implemented Honeywell video analytics at six POC sites and used a third-party application provider, Ipsotek at the remaining site. This strategy allowed for the systems to both complement and compete with each other.
Honeywell Series 60 Cameras were deployed at the POC sites. Cameras used for mask detection were strategically placed in locations to enable monitoring of key perimeter entry points either to the facility or in key zones. Social distancing cameras were placed in locations where congregating was likely to occur, such as break areas and lobbies. Once the cameras were installed, the camera feeds were run into centralized servers for video management.
While the analytics can be overlaid on existing security camera feeds, we found that additional cameras were required to properly capture high-risk areas and behaviors.
The goals for thermal detection and compliance technology are to:
• Identify potential threat to occupants’ wellbeing
• Establish a safer return to normal routines
• Capture early demand to provide better customer service
• Avoid, minimize and pre-empt future scenarios

TECHNICAL REFERENCE GUIDE | Anatomy of a Healthy Building | 20
OCCUPANCY MANAGEMENTPeople flow management can provide visual warnings, support proactive property management, reduce staff exposure and improve productivity and compliance. The use of Honeywell access control systems at the POC sites in combination with video analytics enabled fundamental capabilities around contact tracing, people counting and people flow.
As occupancy increases at the sites and additional data is collected, an assessment will be made to determine if more robust capabilities are required. This could include further partitioning of the sites into smaller zones with access control or installation of video analytics consistent with mask detection and social distancing that can provide more detailed insights into the facilities.

TECHNICAL REFERENCE GUIDE | Anatomy of a Healthy Building | 21
TOUCHLESS ACCESSA key problem across the sites was the ability to maintain the required level of security with minimal or no disruption to human behavior at an access point to optimize convenience for users and provide hygienic, non-contact operations.
While it isn’t practical to automate every door at every POC site, the incorporation of facial recognition readers at the high traffic entry points helped to minimize contact with high touch surfaces and provide a state of the art security. Additionally, where applicable automated door opening buttons were replaced with contactless readers. The combination of the two technologies enables an approach to reduce contact with high traffic surfaces.
The POC site deployments indicated the following actions:
• Minimize potential exposure to occupants by removing high touch readers
• Use facial recognition to automate access control thus optimizing manual resources needed
• Minimize cost per door based on customer needs using either server-based or device-based analytics
• Perform real-time monitoring of thousands of CCTV cameras, differentiating between individuals who are potential exposure risks and automatically alerting security staff upon a match
DASHBOARDS AND ANALYTICSAny alarm events identified by the security analytics are transferred to the Honeywell Healthy Buildings dashboard for viewing and trend analysis. Our perspective is what gets measured, gets managed. The entire Honeywell Healthy Buildings portfolio rests on providing accurate information to occupants and facility managers.
The Honeywell Healthy Buildings on-premise dashboard provide a single screen to display the KPIs that have been enabled as well as details for any alarm configured for out-of-standard conditions.
The Honeywell Healthy Buildings dashboard is a powerful tool that provides three specific views for different personas.
Facility Manager’s Summary The on-premise dashboards implemented across the POC sites are based on EBI and MAXPRO VMS. These are targeted for the facility manager and are used to quickly assess status of the implemented point solutions.

TECHNICAL REFERENCE GUIDE | Anatomy of a Healthy Building | 22
Facility Manager’s Detailed View In addition to the summary KPI view, detailed views are also available in the Healthy Buildings dashboard. This can provide the next layer of analytics by zone as well as alarm conditions over time to help the facility manager identify key areas of focus.
Occupant Summary This view is designed to inform the occupants of protocols that have been put into place and to reassure them that building is working effectively. This view is displayed in central areas of our POC sites, entrance lobbies, to easily communicate the building’s health and safety.
To provide a platform for viewing of the on-premise dashboards from a single sign-on, the Honeywell EBI Elevate platform was used to integrate all of the POC on-premise dashboards into a common location to allow Honeywell global management (such as health, safety and environment and corporate real estate leadership) to view on-premise dashboards from sites across the globe.
TECHNICAL REFERENCE GUIDE | Anatomy of a Healthy Building | 23
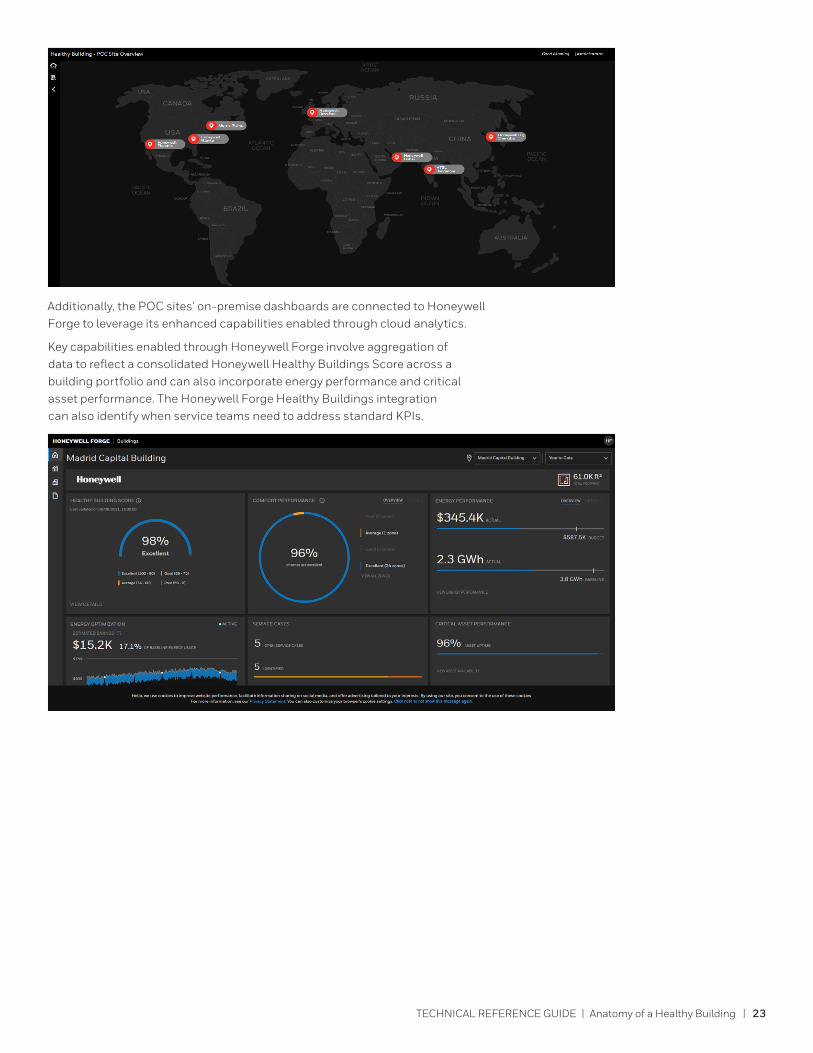
Additionally, the POC sites’ on-premise dashboards are connected to Honeywell Forge to leverage its enhanced capabilities enabled through cloud analytics.
Key capabilities enabled through Honeywell Forge involve aggregation of data to reflect a consolidated Honeywell Healthy Buildings Score across a building portfolio and can also incorporate energy performance and critical asset performance. The Honeywell Forge Healthy Buildings integration can also identify when service teams need to address standard KPIs.

TECHNICAL REFERENCE GUIDE | Anatomy of a Healthy Building | 24
OPERATIONAL PROCESSESA key aspect of implementing the Honeywell Healthy Buildings solutions at our POC sites is that it required us to act as both customer and vendor. Achieving a Healthier Building outcome takes two aspects: implementing technology that enables advanced controls and analytics as well as deploying operational processes to deliver insights that can be leveraged to sustain optimal outcomes.
Improving indoor air quality means maintaining the right balance of actions that can be implemented to influence the key performance indicators. Decisions to increase the fresh air intake and run AHUs for longer periods can have positive impacts to indoor air quality but can be detrimental to a facility’s operating costs. For the POC sites, a data-driven approach centered around the Healthy Buildings dashboard KPIs was taken in partnership between the Honeywell Building Technologies teams and site facility managers to make gradual variable adjustments to validate the influence of each adjustment on the expected outcome.
Operational process development is also a key aspect of the implementation of safety and security solutions. Any new technology being sold by Honeywell or deployed within a Honeywell site is required to comply with a Data Privacy Assessment to protect sensitive or personal data collected and align with regulatory requirements. A key part of this assessment is not only what sensitive or personal data is collected but also how it is stored, accessed and used. With data privacy, we work to maintain the highest standards of privacy, compliant with some of the standards stated below:
• European Union – General Data Privacy Regulations (GDPR)
• India - Data Protection Committee (DPC)
• Japan - Act on Protection of Personal Information (APPI)
• Australia - Office of the Australian Information Commissioner (OAIC)
• Canada - The Personal Information Protection and Electronic Documents Act (PIPEDA)
• United Kingdom - Data Protection Act (DPA)
Having the operational processes to define how the data is being used was critical to being able to complete the data privacy impact assessment. These operational processes were developed for each new technology and completed a cross-functional review and approval prior to implementation.

TECHNICAL REFERENCE GUIDE | Anatomy of a Healthy Building | 25
CONCLUSION
Improving overall building health and safety is a marathon, not a sprint. Our key takeaway from these Proof-of-Concept sites is that although many point solutions can be implemented, the key to providing optimal outcomes is advanced analytics and standard operating procedures to help minimize risks and sustain compliance with new regulations.
Our POC sites also re-emphasized the unique value proposition of Honeywell’s Healthy Building solutions in that they bring critical information from various systems together in one place to provide an overall picture of the overall health and safety of the building environment.
These practical implementations helped us to test our products and to quantify the outcomes they can drive. With on-site testing in real environments with practical operating conditions, we were able to test and refine products before customer deployments. This helped us to fine-tune specifications before we went to market. An example is the upper air UVC used in our Dubai office: after confirming that the dosage delivered by these units was adequate, we launched in the solution throughout the organization.
The POC methodology has made us believe that in-house deployment and testing let us address gaps before we offer our products or services to our customers. This is helping us build healthier and safer places for our customers as well as our own team.

Anatomy-of-HB-AnalysisOfAirQuality-WP | 06/21© 2021 Honeywell International Inc.
For more informationbuildings.honeywell.com
Honeywell Building Technologies 715 Peachtree St NE
Atlanta, Georgia 30308
www.honeywell.com
REFERENCES
1 Independent lab testing by CHEARI for GB21551.3 -2010 standard
2 Independent lab testing for ASHRAE52.1 standard
3 Nadia Storm et al, Rapid and complete inactivation of SARS-CoV-2 by
ultraviolet-C irradiation, 2020. Subject to peer review and available only as
a pre-print. The UV-C irradiance used in this study was 0.849 mW/cm2
4 Upper-Room Ultraviolet Germicidal Irradiation (UVGI) | CDC