RESEARCH REPORT€¦ · SWOT analysis for supply ... UNEP provides support to countries to develop...
94
RESEARCH REPORT Market Readiness Analysis on Sustainable Public Procurement in Mongolia Byambasuren Dorjnyambuu Yanjinpagma Nyamsuren Ulaanbaatar, 2015
Transcript of RESEARCH REPORT€¦ · SWOT analysis for supply ... UNEP provides support to countries to develop...
RESEARCH REPORT Market Readiness Analysis on Sustainable
Public Procurement in Mongolia
Byambasuren Dorjnyambuu
Yanjinpagma Nyamsuren
Ulaanbaatar, 2015

1
TABLE OF CONTENTS
ABBREVIATIONS ............................................................................................................... 5
INTRODUCTION ................................................................................................................. 6
Background and Objectives .................................................................................................... 6
Research methodology ........................................................................................................... 7
I. MARKET ANALYSIS FOR ............................................................................................... 9
A4 COPY PAPER ................................................................................................................ 9
1.1 SUB-CATEGORIES OF A4 COPY PAPER, PRELIMINARY COMPENDIUM OF
SUSTAINABILITY CRITERIA AND MEANS OF VERIFICATION .......................................... 10
1.1.1 Identification of Sub-Categories of Sustainable Products ......................................... 10
1.1.2 Preliminary Compendium of Sustainability Criteria and Means of Verification ........... 13
1.2 SUPPLY ANALYSIS OF A4 COPY PAPER .................................................................... 17
1.2.1 The Market Structure of A4 Copy Paper ................................................................... 17
1.2.2 Sustainable A4 Copy Paper Supply .......................................................................... 20
1.3 A4 COPY PAPER DEMAND ........................................................................................... 28
1.4 CONCLUSIONS AND RECOMMENDATIONS DRIVEN FROM THE MARKET ANALYSIS
ON A4 COPY PAPER ........................................................................................................... 34
II. MARKET ANALYSIS FOR TONER CARTRIDGE ......................................................... 38
2.1 SUB-CATEGORIES OF PRINTER INK CARTRIDGE, PRELIMINARY COMPENDIUM OF
SUSTAINABILITY CRITERIA AND MEANS OF VERIFICATION .......................................... 39
2.1.1 Identification of Sub-Categories of Sustainable Products ......................................... 39
2.1.2 Preliminary Compendium of Sustainability Criteria and Means of Verification ........... 42
2.2 SUPPLY ANALYSIS OF TONER CARTRIDGE .............................................................. 45
2.2.1 The Market Structure of Toner Cartridges ................................................................ 45
2.2.2 Sustainable Toner Cartridge Supply ......................................................................... 47
2.3 TONER CARTRIDGE DEMAND ..................................................................................... 54
2.4 CONCLUSIONS AND RECOMMENDATIONS DRIVEN FROM THE MARKET ANALYSIS
ON TONER CARTRIDGES ................................................................................................... 57
III. MARKET ANALYSIS ON LIGHTWEIGHT CONCRETE BLOCKS ................................ 62
3.1 SUB-CATEGORIES OF CONCRETE BLOCKS, PRELIMINARY COMPENDIUM OF
SUSTAINABILITY CRITERIA AND MEANS OF VERIFICATION .......................................... 63
3.1.1 Identification of Sub-Categories of Sustainable Products ......................................... 63
3.1.2. Preliminary Compendium of Sustainability Criteria and Means of Verification .......... 66
3.1.3 Product life cycle and life cycle assessment ............................................................. 67
3.2 SUPPLY ANALYSIS OF LIGHTWEIGHT CONCRETE BLOCKS .................................... 71
3.2.1 The Market Structure ............................................................................................ 71
3.2.2 Determination of lightweight concrete blocks and market prospects ...................... 72
2
3.2.3 The level of availability and market share of selected products ............................. 73
3.2.4 Main Players in the market and their market share ................................................ 74
3.2.5 Main obstacles limiting the supply of selected products ............................................ 76
3.3 DEMAND ANALYSIS OF LIGHTWEIGHT CONCRETE BLOCKS .................................. 78
3.3.1 Public organizations’ consumption of selected products ........................................... 78
3.3.2 Public organizations’ procurement demand of selected products .......................... 80
3.3.3 Main obstacles and opportunities for the purchase of selected products ............... 81
3.4 VALIDATION OF SUSTAINABILITY CRITERIA FOR SUB-CATEGORIES OF
SELECTED PRODUCTS ...................................................................................................... 82
3.5 CONCLUSIONS AND RECOMMENDATIONS DRIVEN FROM THE MARKET
ANALYSIS ON LIGHTWEIGHT CONCRETE BLOCKS ....................................................... 84
CONCLUSIONS AND POLICY RECOMMENDATIONS FOR OVERALL RESEARCH ...... 85
REFERENCES .................................................................................................................. 87
ANNEXES ......................................................................................................................... 88
Annex 1. Ecolabels for A4 copy paper, toner cartridges and concrete blocks ....................... 88
Annex 2. Mongolian standards for concrete block ................................................................. 93
3
TABLES
Table 1 Sub-categories of sustainable A4 copy paper ............................................................ 12
Table 2 Paper waste and recycled paper................................................................................ 13
Table 3 Sustainability criteria and verification for A4 paper, international level ....................... 14
Table 4 Sustainability criteria and verification for A4 copy papers imported in Mongolian market
................................................................................................................................................. 15
Table 5 A4 paper standards in Mongolia ................................................................................ 17
Table 6 Market Structure ........................................................................................................ 18
Table 7 Market structure of А4 copy paper (2015.10) ............................................................ 20
Table 8 Descriptive statistics of monthly supply of A4 copy paper for 2011-2015, by kilograms
................................................................................................................................................. 22
Table 9 Environmental, social and economic benefits of key suppliers ................................... 25
Table 10 A4 copy paper price of key importers (2015.10) ....................................................... 25
Table 11 Planned monthly consumption expenditure of A4 paper in 2015 ............................... 30
Table 12 Planned monthly consumption expenditure of A4 paper in 2015, by types of POs in
the first level ............................................................................................................................. 31
Table 13 Monthly average consumption of A4 office paper per public officer ........................... 31
Table 14 Approximate estimation of A4 office paper consumption in total public organizations
................................................................................................................................................. 31
Table 15. A4 office paper procurement of public organizations in Ulaanbaatar, 2014-2015.Q1 32
Table 16. Sustainability criteria and their verification for SPP of A4 copy paper........................ 35
Table 17 Sub-categories of sustainable toner cartridge .......................................................... 41
Table 18 Sustainability criteria and verification for toner cartridge, international level ............. 42
Table 19 Sustainability criteria and verification for the categorizations of toner cartridge sold in
Mongolian market ..................................................................................................................... 44
Table 20 Summary of cartridge market structure ..................................................................... 47
Table 21 Descriptive statistics of monthly import of cartridge for 2011-2015, by units ............. 48
Table 22 Corporate environmental, social and economic benefits of the main suppliers.......... 51
Table 21 Price range of cartridge and price of most common used cartridge in Mongolia ........ 51
Table 24 Comparison between average retail price in domestic market and international market
for common used cartridges in Mongolia .................................................................................. 52
Table 25 Planned monthly consumption expenditure of toner cartridge in 2015 ...................... 54
Table 26 Planned monthly consumption expenditure for toner cartridge in 2015, by types of
POs in the first level ................................................................................................................. 55
Table 27. Approximate estimation of cartridge consumption in total public organizations in UB 56
Table 26 Cartridge procurement of public organizations in Ulaanbaatar, 2014-2015.I ............. 56
Table 29. Sustainability criteria and their verification for SPP implementation of toner cartridge
................................................................................................................................................. 58
Table 30. International sustainability criteria for light concrete blocks ....................................... 64
Table 31. Mongolian standards for materials and lightweight concrete block ............................ 65
Table 32. Specification for lightweight concrete block ............................................................... 66
Table 33. Categories and main verifications ............................................................................. 66
Table 34. Market structure of lightweight concrete block .......................................................... 71
Table 35. Market structure of fly ash based lightweight concrete blocks ................................... 71
Table 36. Materials and components of lightweight concrete block .......................................... 72
Table 37. Number of lightweight concrete block suppliers in the industry ................................. 73
Table 38. Role players in lightweight concrete block industry ................................................... 73
Table 39. Fly ash suppliers /Thermal power plants-TPP/ .......................................................... 74
Table 40. Sub-criteria for the corporate social responsibility, by companies ............................. 76

4
Table 41. Lightweight concrete block price (MNT thousand) .................................................... 76
Table 42. Product cost.............................................................................................................. 77
Table 43. Finished building construction and repair work, annual (MNT million) ....................... 79
Table 44. Capacity of finished building construction in last 2 years .......................................... 79
Table 45. Planning to finish building construction and type of building construction, (by state
budget) ..................................................................................................................................... 80
Table 46. Means of verification for the sustainability criteria ..................................................... 82
Table 47. The sustainability criteria and means of verification .................................................. 83
FIGURES
Figure 1. Research process mapping of market research on three products .............................. 7
Figure 2 The historical supply of A4 copy paper, 2003-2015.10, by kilograms .......................... 20
Figure 3 Quarterly supply of A4 copy paper, 2013.Q1-2015.Q3, by kilograms .......................... 21
Figure 4 Monthly supply of A4 copy paper, Jan 2013-Oct 2015, by kilograms .......................... 22
Figure 5 Yearly supplies of A4 copy paper and its projection for Nov 2015-June 2016, by
kilograms .................................................................................................................................. 23
Figure 6 Market share of main A4 copy papers for 2013-2015.10 ............................................ 23
Figure 7 Importing countries, 2013-2015.10 ............................................................................ 24
Figure 8 Main players and their market share for A4 copy paper, 2013-2015.10 ................... 24
Figure 9 Dynamics of monthly price of A4 copy paper in the border, 2013-2015.10 ............... 26
Figure 10 Comparison between retail price and border price of sustainable A4 paper and retail
price of conventional A4 paper, 2015.10 (by MNT) ................................................................... 27
Figure 11 SWOT analysis for supply of sustainable A4 copy paper ........................................ 28
Figure 12 Yearly supplies of A4 copy paper, by kilograms ........................................................ 29
Figure 13 Distribution of average monthly A4 paper consumption in 2015, by the level of public
organizations ............................................................................................................................ 30
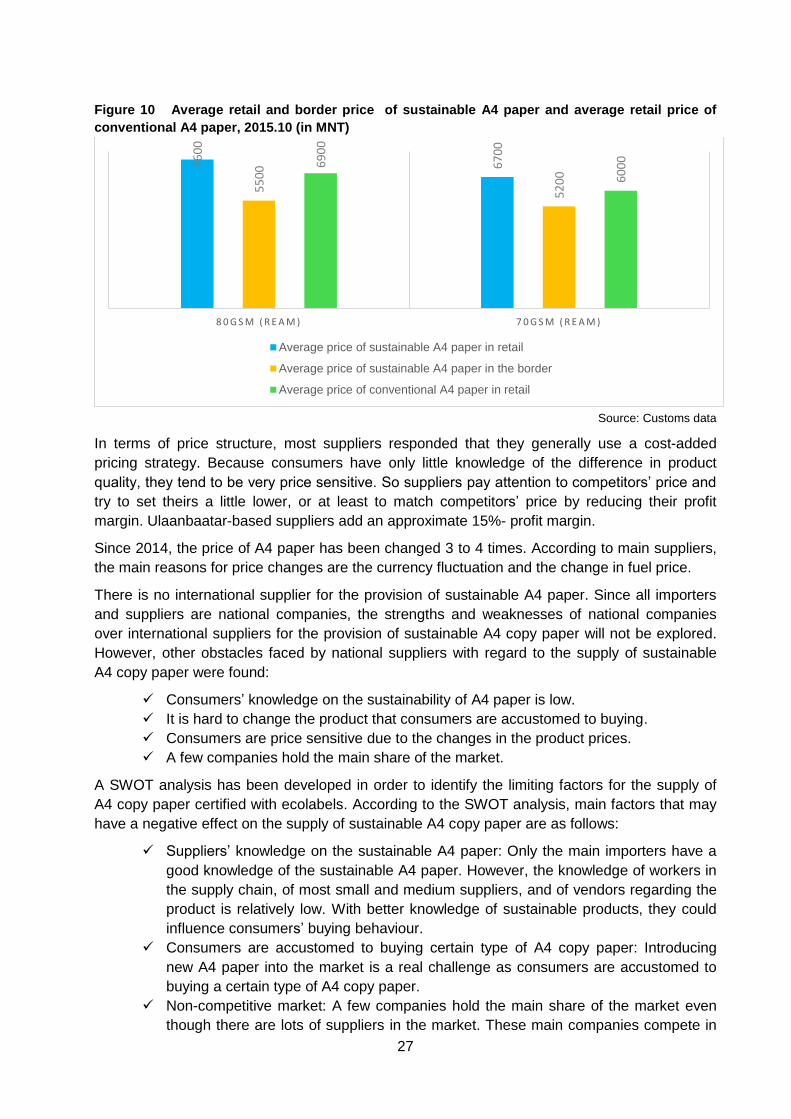
Figure 14. Dynamics of monthly average price of А4 copy paper, 2014-2015.04...................... 33
Figure 15. Dynamics of monthly procurement of А4 copy paper, 2014-2015.04 ....................... 33
Figure 16. The historical import of toner cartridge, 2003-2015.10, by units ............................... 47
Figure 17. Quarterly supply of toner cartridge, 2013.Q1-2015.Q3, by units .............................. 48
Figure 18. Monthly import of cartridge, Jan 2013-Oct 2015, by units ........................................ 48
Figure 19 Monthly sales of the domestic cartridge manufacturer, Apr 2014-March 2015, by units
................................................................................................................................................. 49
Figure 20. Monthly supply of cartridge in the market, by units .................................................. 49
Figure 21. Importing countries, 2014-2015.10 .......................................................................... 50
Figure 22. Main players’ import share of cartridge for 2014-2015.10 ........................................ 50
Figure 23. SWOT analysis for supply of sustainable cartridge .................................................. 53
Figure 24. Life cycle of lightweight concrete block .................................................................... 68
Figure 25. Life cycle of fly ash based lightweight concrete block . Error! Bookmark not defined.
Figure 26. Life cycle assessment of lightweight concrete block ................................................ 69
Figure 27. Life cycle assessment of fly ash based lightweight concrete block .. Error! Bookmark
not defined.
Figure 28. Role suppliers of lightweight concrete block (percent) ............................................. 74
Figure 29. Main suppliers of fly ash based lightweight concrete block (percent) ....................... 75
Figure 30. Annual import volume of lightweight concrete block ................................................. 75
Figure 31. Monthly import volume of lightweight concrete block ............................................... 76
Figure 32. Product/lightweight concrete block/ pricing (percent) ............................................... 77
Figure 33. Capacity of finished building construction, annual.................................................... 79

5
Figure 34. Construction cost estimates ..................................................................................... 80
ACKNOWLEDGEMENTS
The research team has successfully implemented the market readiness analysis on Sustainable
Public Procurement supported by UNEP.
Our research team would like to express our gratitude to Ms. Altantsetseg Sodnomtseren
(National coordinator of the Partnership for Action on Green Economy), Ms. Amgalan
Luvsandamba (Senior officer at Legal and Procurement Policy Department in Ministry of
Finance), Ms. Sugarmaa Bayasgalan (Consultant in SPP), Mr. Farid Yaker (Program officer
SPP at UNEP) and Sophie Loueyraud (Consultant, SPP at UNEP) for their valuable advice and
guidance for the market analysis.
In addition, our research team would like to express our gratitude to all suppliers for participating
in the survey and providing valuable and valid information.
The market analysis was carried out by a task team comprised of Byambasuren Dorjnyambuu
(Consultant) and Yanjinpagma Nyamsuren (Consultant). Byambasuren was responsible for
writing the sections of market analysis on A4 copy paper and toner cartridge. Yanjinpagma was
responsible for writing the section of market analysis on lightweight concrete blocks.
ABBREVIATIONS
MoF Ministry of Finance
SSP Sustainable Public Procurement
GDP Gross Domestic Product
ECF Elemental chlorine free
PCF Process chlorine free
TCF Totally chlorine free
OBAs Optical brightening agents
FSC Forest Stewardship Council
PEFC Program for the Endorsement of Forest Certification
HHI Herfindahl-Hirshman Index
ETIRA European Toner and Inkjet Remanufacturer Association
OEMs Original equipment manufacturers
ILO International labor organization
SMEs Small and medium enterprises

6
INTRODUCTION
Background and Objectives
National government procurement has significant impact on the marketplace for goods and
services. In 2014, the Mongolian government spending approximately represented 32% of
GDP, while the public procurement of products and services accounted for about 12% of GDP.
This amount of public procurement can provide significant opportunities to encourage
sustainable production and consumption patterns in the Mongolian market. By introducing
sustainable procurement, the government will reduce environmental impact, deliver financial
benefits, and build up markets for sustainable products through its procurement.
UNEP provides support to countries to develop and implement Sustainable Public Procurement (SPP) policies by increasing awareness and building the capacities of policy makers and procurement managers.
The methodology applied at the country level is the “UNEP SPP Approach”, which is conceived
as a series of steps followed by governments to first design and then implement an SPP action
plan. One of the key steps of the UNEP SPP Approach is to undertake a market analysis; this
report demonstrates the process and findings of the market analysis conducted in the
Mongolian context.
The Market analysis is developed based on related information and findings within the Legal
Review and the Prioritization Exercise, both of which are presented in separate reports. The
purpose of the Market Analysis is to provide initial identification of priority product or commodity
areas for SPP and recommendations related to specific sustainability standards or criteria for
the priority products.
As a result of the Prioritization exercise, A4 copy paper, printer ink cartridges and lightweight
concrete blocks were selected as priority product categories to be procured via pilot tenders. As
such, this market analysis focuses on the three priority products, with the objective of:
Identifying specific sub-categories of sustainable A4 copy paper, toner cartridges and
light weight concrete blocks that will be purchased during the pilot tenders;
Assessing the supply of sustainable A4 copy paper, toner cartridges and light weight
concrete blocks;
Identifying public procurement demand for A4 copy paper, toner cartridges and light
weight concrete blocks;
Defining sustainability criteria for each sub-category of the 3 products, and identifying
relevant certification instrument and tools; and
Identifying potential threats/opportunities for successful Sustainable Public Procurement;
Assist in planning activities for the introduction of Sustainable Public Procurement.
In order to achieve the main objectives of the study, the research report consists of four sections
and is broken down into the following parts:
A. Research methodologies and a brief overview of the data used in the study are
presented first.
B. Then a series of three sections present the market analyses of A4 copy paper, toner
cartridges and concrete blocks, with a focus on the current state and potential for
development of the markets for sustainable alternatives within these categories. These

7
three sections illustrate the market structure, the supply analysis, the demand analysis
and validation of sustainability criteria for sustainable products.
C. Finally, conclusions and recommendations for the subsequent development of SPP are
presented. The results of this Market Analysis will inform the development of an SPP
Policy and Action Plan for Mongolia.
Research methodology
The market analysis study on sustainable public procurement consists of two steps: collecting
research data and developing the market analysis. Research data and information have been
collected from primary and secondary sources. Figure 1 shows an overview of the research
methodology.
Figure 1. Research process mapping of the market research for the three selected products
The sources of data and information. The sources of primary data and information are based
on in-depth interviews conducted with main suppliers, and secondary data and information have
been collected from the monthly, quarterly and annual reports of the National Statistics
Committee, the General Department of Customs, Bank of Mongolia, and Mongolian State Civil
Service Commission. In addition, public procurement data is driven from the, “Demand and
Supply Analysis of Four Product Markets: A4 copy paper, Printer ink cartridge, Computer and
Fuel” research.
Literature. In the middle of 2015, MIRIM Consultant LLC conducted a research on “Demand
and Supply Analysis of Four Product Markets: A4 copy paper, Printer ink cartridge, Computer
and Fuel”, funded by EBRD. Within the framework of the research, 164 public organizations and
Market analysis on SPP
Data collection Market analysis
Primary data Secondary data
In-depth interview
and meetings
with suppliers
Market structure
Identifying categories of
the sustainable products
Supply analysis Demand analysis
Validation of
sustainability criteria

8
35 suppliers were surveyed in terms of demand and supply of A4 copy paper and toner
cartridges.
In the case of concrete blocks, the Caritas Czech, an international organization, carried out a
research named “Public survey on Ash based building materials” in 2015. About 140 suppliers,
including manufacturers, construction companies and sellers, and 350 final consumers were
surveyed in this research.
In addition, a number of large supplier companies conducted their own research for the supply
of the above-mentioned products.
Research hypothesis and limitations. The main limitation of the study is the lack of data
related to the public procurement of these three products. At MoF level, there is not detailed
procurement data for A4 copy paper, toner cartridges and concrete blocks. Therefore, the
research team used the procurement data of public organizations collected within the framework
of another study named “Demand and Supply Analysis of Four Product Markets: A4 copy paper,
Printer ink cartridge, Computer and Fuel” produced by EBRD.
9
Reduce. Re-use. Recycle.
I. Market analysis for
A4 copy paper
10
1.1 SUB-CATEGORIES OF A4 COPY PAPER, PRELIMINARY COMPENDIUM OF
SUSTAINABILITY CRITERIA AND MEANS OF VERIFICATION
This section of the report aims to identify the specific sub-categories of sustainable A4 copy
paper, to summarize the sustainability criteria of A4 copy paper and to determine means of
verification for the sustainability criteria at international and national levels.
1.1.1 Identification of Sub-Categories of Sustainable Products
International sub-categories of A4 copy paper
Sustainable products are those products that provide environmental, social and economic
benefits while protecting public health and environment over their whole life cycle, from the
extraction of raw materials until final disposal. Therefore, the study aims to define categories of
sustainable paper with respect to the combination of environmental, social and economic
sustainability considerations.
Environmental sustainability: Environmentally sustainable paper can be defined as any effort
undertaken to reduce deforestation for paper production, as well as consuming lower amounts
of energy and water, producing fewer emissions and avoiding certain substances in paper
production and bleaching. Currently, paper is made in many environmentally responsible forms.
Paper can be manufactured from partly to fully recycled materials using pre- and post-consumer
waste. It can also be derived from sustainable forests, where trees are farmed specifically for
paper production. Paper can be produced without chlorine bleaching. Finally, paper can be
produced from plant fibers other than timber such as cotton, hemp, bamboo or sugar cane. A4
paper is sub-categorized in terms of environmental sustainability as follows:
Paper produced from sustainable fiber sources: Virgin fiber paper is most commonly
used and comes directly from native forests. Virgin fiber paper contains the strongest
fiber but has the most immediate impact on the forests. However, that impact is
diminished if paper is produced from virgin fiber stemming from legally harvested woods
and from sustainably managed forests.
Recycled Paper: Generally, it is applied to any sort of environmentally-friendly paper. It
can be made from paper used by the consumer (post-consumer recycling) or from
scraps from the paper mills that were not used in making finished paper (called post-
production or pre-consumer recycling).
Consuming lower amounts of energy and water: Water and energy consumption levels
can vary depending on the different paper production. Many studies show that the
production of recycled paper requires less energy and water than those for paper based
on virgin fiber.
Chlorine free: Chlorine or chlorine substances and other chemicals (such as ozone or
hydrogen peroxide) can be used in the bleaching process in order to obtain a final
product with a high whiteness level. The usage of chlorine in the paper making process
is extremely harmful to the environment. There are three types of sustainable bleaching:
process chlorine free (PCF), elemental chlorine free (ECF), and totally chlorine free
(TCF).
Avoiding other chemical substances: Some of the synthetic polymers, colorants, dyes
and other chemical that can be used in pulp and paper production have adverse impacts
on the environment. Thus, avoidance of certain substances in paper production is
important for environmental sustainability.
Optical brightening agents (OBAs):

11
Whiteness -measurement of light reflectance across all wavelengths of light comprising
the full visible spectrum and therefore it is the one that best correlates with human visual
perception of the paper. The normal maximum whiteness level would be 100, but higher
values can be obtained if papers have added OBAs. The function of an OBA is to reflect
ultraviolet light from the light source as visible light in the blue spectral region giving
measurements in excess of 100.
Brightness -measurement of light reflectance of the specific wavelength of blue light.
Simply, brightness represents a narrower measurement of light reflectance than
whiteness. The beginning brightness range for a base paper pulp is from 0-100
calculated normally. During the papermaking process, OBAs are frequently added to
increase a paper’s whiteness as well as brightness.
Shade -measurement of the color of paper. It is an important characteristic within the
definition of a paper’s whiteness and it is measured with the most universally accepted
system of color measurement. It is commonly accepted that there are four groups of
white shades: true white, cream white, blue white and red white.
Lower brightness/whiteness levels might also represent a lower need for strong
bleaching of pulp and paper surface treatment, reducing related environmental impacts
in the paper production process. OBAs have impacts on human health and the
environment, especially aquatic systems. They may cause allergic reactions to people
and are toxic to aquatic life as they are not biodegradable.
Environmentally-friendly packaging: The packaging for the paper will not contain PVC or
other chlorinated plastics.
Corporate environmental policy: Supplier of paper can produce a sustainability report or
environmental policy that is consistent with international standards.
Social sustainability: It is important that public money is used in a way that achieves as much
public benefit as possible. This means money should not simply be focused on paying for a
product, but should attempt where possible to achieve sustainable and wider benefits. In this
respect, paper in terms of social sustainability can be defined as any effort that creates social
value in national and local communities. A4 paper is sub-categorized in terms of social
sustainability as follows:
Production of paper according to international labor standards and human rights laws:
Fair employment practices in paper supply chain – fair wages, workforce equality,
diversity, avoidance of bonded labor, promoting workforce welfare etc. – generate social
benefits.
Local sustainability: Paper supply chains can contribute to local sustainability by building
and maintaining healthy, strong communities, supporting social inclusion and enhancing
the well-being of local residents by generating local employment.
Technical quality: Paper must be fit for use with standard copy machinery.
Economic sustainability: Paper in terms of economic sustainability can be defined as a
contribution to local economic outcomes including cost savings. A4 paper is sub-categorized in
terms of economic sustainability as follows:
Multipurpose copy paper suitable for copy machines, laser printers, fax-machines, ink-jet
printers and 2-sided copying can save costs.
Economic contribution of paper supply chain to national GDP.
Job creation of paper supply chain in a country and opportunities for SMEs.
Re-investing in operations of paper supply chain.

12
The table below summarizes the main sub-categories of sustainable paper as described above
in terms of environmental, social and economic sustainability.
Table 1 Sub-categories of sustainable A4 copy paper
Environmental sustainability
Sub-categories Sub categories for SPP
approach(a)
Sustainable fiber sources
Paper produced from virgin fiber stemming from legally harvested woods and from sustainably managed forests
- Recycled paper - Paper from legally and
sustainably harvested wood
- Paper produced through processes characterized by low energy consumption and emissions
- Elemental chlorine free - Brightness - Recyclability (post-
consumer) - Environmental
management system
Recycled paper
Impact on climate change
Consuming little energy and water
Chlorine free
Avoiding other chemical substances
Optical brightening agents
Environmentally-friendly packaging
Recyclability (post-consumer)
Impact on manufacturer /supplier
Corporate environmental policy
Environmental management system
Social sustainability
Impact on local communities
Production and supply chain of paper according to international labor standards and human rights laws
- Production of product
according to international labor standards
- Technical quality
Local sustainability
Technical quality
Economic sustainability
Impact on local economies
Economic contribution of paper sector to national GDP
Cost-saving paper that is more efficient to operate
Job creation in paper sector of the country and opportunities for SMEs
Multipurpose paper
Re-investing in operations of paper sector
Source: Sustainable Procurement Guidelines, UNEP, 2010 and Green Public Procurement, European Commission
Local sub-categories of A4 paper
In Mongolia, there is no local production of copy paper. All grades of A4 paper in Mongolian
paper market are imported from abroad. There are over 10 brands of A4 paper and non-brand
A4 papers made in China that have been sold on the market which weigh 70-85 gsm. However,
according to Custom Statistics for the first 10 months of 2015, “Double A”, “Yes Silver”, “Miilk”,
“IDEA Work” and “CAMPAP” brands represent about 94% of total imported A4 papers.
In Mongolia, recycled papers are not imported, while papers made from sustainably harvested
virgin fibers are mainly imported from Thailand, Finland, Russia, South Korea, China and
Malaysia. The majority of A4 paper brands that are available in Mongolian paper market are
elemental chlorine free and recyclable. However, the rate of post-consumer recycling is very low
in Mongolia. According to the statistics provided by Ministry of Environment and Green
Development of Mongolia, out of the 91,340 tons of paper waste, only 20 tons was collected in
2014 for cardboard, toilet paper, trug, etc.

13
Table 2 Paper waste and recycled paper
Year Waste of paper and paper product, by ton Recycled paper, by ton
2014 91340 21
2013 168849 22
2012 9432 717
2011 32429 31
2010 43282 40
2009 20598 9
Source: Database for Environment, Ministry of Environment and Green Development of Mongolia
Some brands of A4 paper in the market use renewable energy and water that is drawn from its
rain water reservoir in pulp and paper production. Main local official distributers of copy paper in
Mongolia have created a number of jobs, and support SMEs and individuals through their
supply chains. Moreover, some of them spearhead funding programs to give assistance for the
education of Mongolian children.
1.1.2 Preliminary Compendium of Sustainability Criteria and Means of Verification
In order to allow for the procurement of sustainable A4 paper, a better knowledge of the labels
and certifications for sustainable paper is required.
Ecolabelling and Certification for A4 paper: There is a number of ecolabels for copy paper,
such as the European Ecolabel, Nordic Ecolabel, Blue Angel, Austrian Umweltzeichen, Forest
Stewardship Council (FSC), Program for the Endorsement of Forest Certification (PEFC), Eco
Mark Japan, Thai Green Label, Chlorine-Free Products Association label, Green Seal ecolabel,
Ecologo, ISO14000 family and others. The short descriptions of these Ecolabelling are attached
in Annex 1.
Because the production of recycled paper and paper based on virgin fiber is different, the
criteria of various ecolabels are not the same. The production of paper based on virgin fiber use
a high amount of water and energy, and generate emissions to air and water. The European
Ecolabel and Nordic Swan Ecolabel criteria focus on these issues as well as on the use of
chemicals. On the other hand, the Blue Angel criteria for copy paper based on recycled paper
concentrate on the use of chemicals in paper production and on technical performance.
Copy paper can also be marked with the logos of FSC or PEFC sustainable forest management
systems. They can certify that paper contains a minimum percentage of certified sustainable
wood fibers.
Moreover, copy paper can be labeled with Chlorine-Free Products Association labels, such as
Totally Chlorine Free (TCF), Processed Chlorine Free (PCF) and Elemental Chlorine Free
(ECF). TCF and ECF certify virgin-fiber paper, while PCF certifies recycled fiber.
According to Sustainable Procurement Guidelines of UNEP, two sets of sustainability criteria
are presented in Sustainable Procurement. One is the basic sustainability criteria that address
the most important environmental and social impacts. Another one is advanced sustainability
criteria that is intended for use by procurers seeking to purchase the best environmental and
socially responsible products available on the market. In this study, we will focus on basic
sustainability criteria and their verifications for copy paper.
The table below summarizes the sustainability and verification criteria for copy paper used in
United Nations and European Commission.

14
Table 3 Sustainability criteria and verification for A4 paper, international level
# Sustainability criteria Means of Verification
1 Recycled paper: Paper must be made from
100% recovered paper fibers.
Paper carrying any type I ecolabel, such as Blue
Angel, or Recycled label can serve as means of
proof if it is specified that the paper is made from
100% recovered fibers. Any other appropriate
means of proof, such as a technical dossier of
the manufacturer or a test report from a
recognized body1 will also be accepted.
2
Paper produced from virgin fiber: In case of
impossibility to purchase paper made from
100% recovered fibers due to higher cost and/or
insufficient market supply, paper produced from
virgin fiber stemming from legally harvested
woods and from sustainably managed forests
can be purchased. All virgin wood fibers for pulp
production will come from forests that are
managed so as to implement the principles and
measures aimed at ensuring sustainable forest
management.
Paper carrying the FSC or PEFC label, European
label, Nordic Swan label will be deemed to
comply. Any other appropriate means of proof,
such as a technical dossier of the manufacturer
or a test report from a recognized body will also
be accepted.
3 Elemental chlorine free (EFC): The paper
must be at least ECF.
All products carrying the European ecolabel, Blue
Angel, Nordic Swan, Eco Mark Japan, Chlorine-
Free Products Association (CFPA) will be
deemed to comply. Any other appropriate means
of proof, such as a technical dossier of the
manufacturer or a test report from a recognized
body will also be accepted.
4
Brightness: The brightness level must be <90
according to ISO 2470:1999 or equivalent.
Above 90 the paper would need to be treated
with optical brightening agents. Levels as low as
60 are of a good enough quality for everyday
office use.
Bidders must provide written proof that they meet
this criterion.
5
Technical quality: Paper must be fit for use
with standard office machinery in accordance
with relevant national or regional standards.
Paper certified that compatible with machinery
accordance with DIN 190309, AFNOR Q11-013,
or equivalent.
Otherwise, a sample of the paper must be
provided to the procurer in order to test the
quality of paper.
6
Compliance with environmental legislation:
Bidders shall not be permitted to take part in a
contract if they:
Have been found guilty of grave professional
misconduct, including non-compliance with
environmental legislation, or have not fulfilled
obligations relating to the payment of social
security obligations.
Bidders must provide a declaration that they
meet this criterion.
7 Production of the product according to
international labor standards: The bidder
The bidder is required to submit appropriate
proof that these requirements have been met.
1 Recognized bodies are test and calibration laboratories and certification and inspection bodies that comply with
applicable regional, national and/or international standards.
15
shall provide proof from an independent third-
party certification body that the manufacturer of
the product complies with international working
standards (ILO Core Convention) throughout
the whole supply chain.
8
Written corporate environmental policy: The
bidders will provide their own written corporate
environmental policy.
The bidder is required to present the written
corporate environmental policy, consistent with
ISO 14001, or equivalent. Any other appropriate
evidence will be accepted.
9
Operational, third party, environmental
management system: The bidder will provide
certificates of environmental management
system for all companies in the supply chain.
The bidder is required to provide certificates of
environmental management system for all
companies in the supply chain that is certified by
third-parties. For example, ISO 14001, European
EMAS etc.
Source: Sustainable Procurement Guidelines, UNEP, 2010 and Green Public Procurement, European Commission
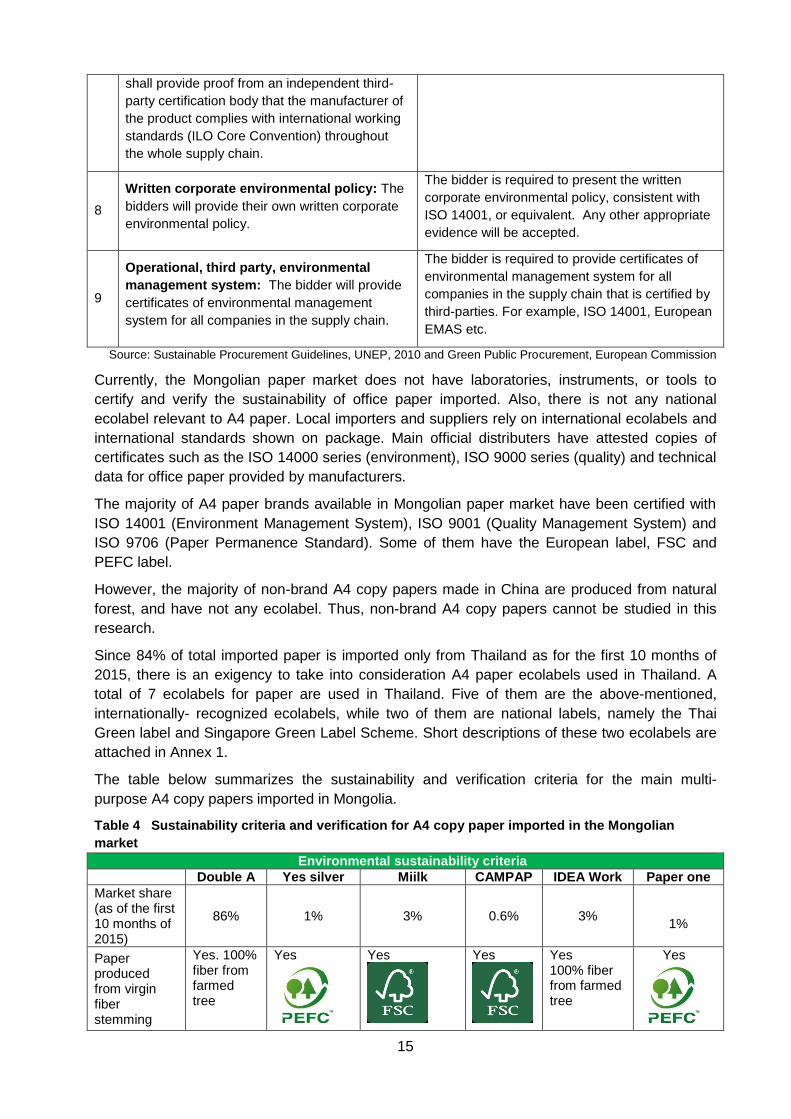
Currently, the Mongolian paper market does not have laboratories, instruments, or tools to
certify and verify the sustainability of office paper imported. Also, there is not any national
ecolabel relevant to A4 paper. Local importers and suppliers rely on international ecolabels and
international standards shown on package. Main official distributers have attested copies of
certificates such as the ISO 14000 series (environment), ISO 9000 series (quality) and technical
data for office paper provided by manufacturers.
The majority of A4 paper brands available in Mongolian paper market have been certified with
ISO 14001 (Environment Management System), ISO 9001 (Quality Management System) and
ISO 9706 (Paper Permanence Standard). Some of them have the European label, FSC and
PEFC label.
However, the majority of non-brand A4 copy papers made in China are produced from natural
forest, and have not any ecolabel. Thus, non-brand A4 copy papers cannot be studied in this
research.
Since 84% of total imported paper is imported only from Thailand as for the first 10 months of
2015, there is an exigency to take into consideration A4 paper ecolabels used in Thailand. A
total of 7 ecolabels for paper are used in Thailand. Five of them are the above-mentioned,
internationally- recognized ecolabels, while two of them are national labels, namely the Thai
Green label and Singapore Green Label Scheme. Short descriptions of these two ecolabels are
attached in Annex 1.
The table below summarizes the sustainability and verification criteria for the main multi-
purpose A4 copy papers imported in Mongolia.
Table 4 Sustainability criteria and verification for A4 copy paper imported in the Mongolian
market
Environmental sustainability criteria
Double A Yes silver Miilk CAMPAP IDEA Work Paper one
Market share (as of the first 10 months of 2015)
86% 1% 3% 0.6% 3%
1%
Paper produced from virgin fiber stemming
Yes. 100% fiber from farmed tree
Yes
Yes
Yes
Yes 100% fiber from farmed tree
Yes

16
from legally- harvested woods and from sustainably harvested wood
Elemental chlorine free
Yes
Yes
Yes
Yes
Yes
Yes
Consuming low levels of energy and water in the production process
Yes. Renewable energy and rain water reservoir
Yes
Yes. Recycled waste water is used
Yes
Yes
Yes
Brightness, % 99-102 94 108-111 - 94.5 99
Technical quality
Yes
Yes Yes
Yes
Yes
Environmental management system
ISO14001 ISO14001 ISO14001 - ISO14001
ISO14001
Quality management system
ISO 9001 ISO 9001 ISO 9001 ISO 9001 ISO14001 ISO 9001
Long life ISO 9706 ISO 9706 No - No ISO 9706
Recyclability (post-consumer)
Yes
Yes Yes Yes
Yes
Social sustainability of key suppliers in Mongolia
Social responsibility
Yes Yes Yes Yes - -
Supply chain according to labor standards and human right laws
Yes Yes Yes Yes Yes
Yes
Economic sustainability of key suppliers in Mongolia
Job creation in local economy
Yes Yes Yes Yes Yes
Yes
Cooperation with SMEs and individuals through paper supply chain
It works with about 300 SMEs and individuals across the country
It works with about 95 SMEs and individuals across the country
It works with about 65 SMEs and individuals across the country
Yes
Yes
Yes
17
Source: www.doubleapaper.com, www.yes-paper.com, www.ideaonpaper.com, www.miilkpaper.co.kr,
www.paperone.com and the findings of interview with key importers.
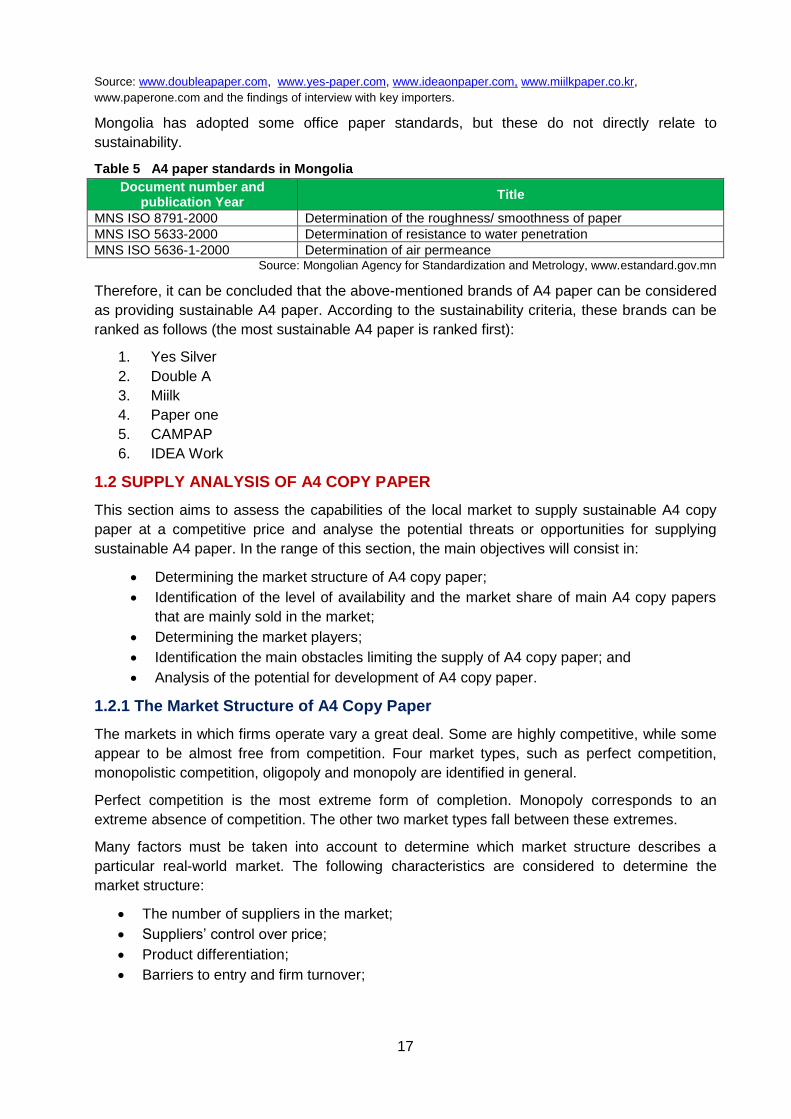
Mongolia has adopted some office paper standards, but these do not directly relate to
sustainability.
Table 5 A4 paper standards in Mongolia
Document number and publication Year
Title
MNS ISO 8791-2000 Determination of the roughness/ smoothness of paper
MNS ISO 5633-2000 Determination of resistance to water penetration
MNS ISO 5636-1-2000 Determination of air permeance Source: Mongolian Agency for Standardization and Metrology, www.estandard.gov.mn
Therefore, it can be concluded that the above-mentioned brands of A4 paper can be considered
as providing sustainable A4 paper. According to the sustainability criteria, these brands can be
ranked as follows (the most sustainable A4 paper is ranked first):
1. Yes Silver
2. Double A
3. Miilk
4. Paper one
5. CAMPAP
6. IDEA Work
1.2 SUPPLY ANALYSIS OF A4 COPY PAPER
This section aims to assess the capabilities of the local market to supply sustainable A4 copy
paper at a competitive price and analyse the potential threats or opportunities for supplying
sustainable A4 paper. In the range of this section, the main objectives will consist in:
Determining the market structure of A4 copy paper;
Identification of the level of availability and the market share of main A4 copy papers
that are mainly sold in the market;
Determining the market players;
Identification the main obstacles limiting the supply of A4 copy paper; and
Analysis of the potential for development of A4 copy paper.
1.2.1 The Market Structure of A4 Copy Paper
The markets in which firms operate vary a great deal. Some are highly competitive, while some
appear to be almost free from competition. Four market types, such as perfect competition,
monopolistic competition, oligopoly and monopoly are identified in general.
Perfect competition is the most extreme form of completion. Monopoly corresponds to an
extreme absence of competition. The other two market types fall between these extremes.
Many factors must be taken into account to determine which market structure describes a
particular real-world market. The following characteristics are considered to determine the
market structure:
The number of suppliers in the market;
Suppliers’ control over price;
Product differentiation;
Barriers to entry and firm turnover;

18
Four-firm concentration ratio2; and
Herfindahl-Hirshman Index (HHI)3.
The table below summarizes the influencing factors, along with the measure of concentration
that determine which market structure describes a particular real-world market.
Table 6 Types of market Structures and their characteristics
Characteristics Perfect
competition Monopolistic competition
Oligopoly Monopoly
Number of firms in the industry
Many Many Few One
Product differentiation
Identical Differentiated
Either identical or differentiated
No close substitutes
Firm’s control over price
None Some Considerable Considerable or regulated
Barriers to entry None None Moderate High
4 firms’ concentration ratio
0 Low High 100
HHI Less than 100 101-999 More than 1000
10,000
Source: [Parkin, 2012]
The main purpose of this section is to determine the A4 copy paper market structure. In order to
characterize the market structure for A4 copy paper, each determinant of the market structure
will firstly be qualified, secondly the market structure for A4 copy paper will be identified based
on these results.
The number of suppliers for A4 copy paper. According to the Customs Data for the last three
years, five companies such as Tavan Bogd Management LLC, Finpak LLC, CTSN LLC, Circle
LLC, and Tenger-Altai Trade LLC- have been continuously importing and supplying A4 copy
paper. As of the first 10 months of 2015, three companies – Tavan Bogd Management LLC,
CTSN LLC, and Az Khur LLC – imported 90% of the total import of A4 copy paper. Including
these main importing companies, it can be concluded, based on Customs Data, that there is a
total of 20 supplier companies actively operating in the market.
Looking at the supply chain of main A4 copy papers in the local market, “Double A”, the paper
most sold in the market, has one official distributer and about 50 dealers in Mongolia. The
official distributer, Tavan bogd Management LLC, sells “Double A” through over 300 sales units
across the country. The official distributer of “Miilk” brand, Az khur LLC, sells it through 65 sales
units across the country. The official distributer of “Yes Silver” brand, Finpack LLC, sells it
through 95 sales units across the country.
By comparing the custom data with supply chain information, and eliminating the duplicated
number of suppliers, it is concluded that there are about one large supplier, 4-5 medium
2 Four-firm concentration ratio is the percentage of the value of sales accounted for by the four largest
firms in an industry. The range of concentration ratio is from almost zero for perfect competition to 100
percent for monopoly.
3 Herfindahl-Hirshman Index (HHI) is the square of the percentage market share of each firm summed
over the largest 50 firms in a market (or summed over all the firms if there are fewer than 50). The HHI became a popular measure for the degree of competition. A market in which the HHI is less than 1,000 is regarded as being competitive. A market in which the HHI lies between 1,000 and 1,800 is regarded as being moderately competitive. But a market in which the HHI index exceeds 1,800 is regarded as being uncompetitive.
19
suppliers and about 45 small suppliers that operate actively on the A4 copy paper
market. A few companies hold the main share of the market, even though there are lots of
suppliers in the market.
Product differentiation. Product differentiation gives the firm an element of market power. In
the case of A4 copy paper, the main differentiable characteristics in the Mongolian paper market
are brand, and weight of A4 paper. The main importers also answered that in the market A4
papers are differentiated by their brand name and they have certain differences between each
other.
Suppliers' control over price. The one indicator measuring competitiveness in the market is
checking whether the supplier itself sets the price of products, or whether the supplier is selling
in accordance with the market price. In non-competitive markets suppliers have the ability to
control the price of their product, whereas suppliers in competitive markets are price takers. The
main risk of competition is therefore that firms cannot affect the market price and are not in a
position to raise prices. By doing so, a firm would be unable to sell its output as consumers
would buy goods from others.
According to the interview conducted with suppliers, most key suppliers use a "Cost-added
pricing" strategy, while medium and small suppliers use a “Market pricing” strategy.
It therefore can be concluded that the main suppliers in the market can control the price of A4
paper, while the followers sell A4 paper in accordance with the price set by the main suppliers.
Control over price by a few dominants implies that the A4 paper market may be a non-
competitive market.
Barriers to entry. When a firm enters the market, the more obstacles there are, the more
competitiveness is limited. In order to determine the barriers to entry in the market, the survey
has solicited supplying companies to relate their experience when entering the market. Many of
them responded that there was minimum challenge when entering the market, while few of them
responded that there was moderate challenge. Based on the results above, there is a relatively
low barrier when entering the market for the supply of A4 paper.
Four-firm Concentration Ratio. Four-firm concentration ratio is calculated by the import
quantity of the four largest suppliers of A4 paper, which are Tavan Bogd Management LLC,
Tenger Altai, Az Khur LLC and CTSN LLC. The concentration ratio is 92% for the first 10
months of 2015 and A4 paper market has a high concentration and is characterized by an
oligopoly market structure in which a market is run by a small number of firms that, together,
control the majority of the market share. Tavan Bogd Management LLC has supplied about 70%
of total imports in the last 3 years. The other 3 main suppliers have supplied the other 20%, and
the remaining 10% is supplied by other small suppliers.
Herfindahl-Hirshman Index. The HHI was determined by the market shares of 16 companies
supplying A4 copy paper. The HHI index is 7,000 and the competition in A4 paper market is
relatively low.
Four-firm Concentration Ratio and HHI results have shown that the A4 copy paper market has a
high concentration, and that a few companies hold the main share of the market, however
according to some indicators the results provided still lead to a monopolistic market structure.
For instance, there is a large number of suppliers in the market, but their market share is very
low.
According to the above-mentioned results, the A4 copy paper market has been identified as a
non-competitive market. Namely, it has characteristics of an oligopolistic market with few
dominant firms and many follower firms. Oligopoly, in which a market is run by a small number

20
of firms which together control the majority of the market share. Oligopoly companies can
choose to produce the same products, or they can produce different products. The main
suppliers in the A4 market have been competing by supplying different brands of paper.
The following table shows the summary of determinants for the A4 paper market’s structure.
Table 7 Market structure for А4 copy paper (2015.10)
Charactristics Results
Number of firms in the industry Few dominant firms and many follower firms
Product differentiation Slightly differentiated
Firms’ control over price Moderate
Barriers to entry Low
4 firms’ concentration ratio 92
HHI 7100
Source: Researcher’s findings
1.2.2 Sustainable A4 Copy Paper Supply
The level of availability for A4 copy paper
According to Customs data for the 2011-2014 period, 3.2-3.8 million kilograms of A4 copy paper
were imported yearly. As for the first 10 months of 2015, 2.5 million kilograms of A4 copy paper
were imported. The historical supply of A4 copy paper between 2003 and the first 10 months of
2015 is illustrated in Figure 2. From the figure below, one can see that A4 copy paper supply
was relatively low in 2003-2005, and that the yearly average supply was 287,591 kg in those
years, which is lower than the current monthly average supply of A4 copy paper. The supply of
A4 copy paper increased continuously between 2005 and 2008, and A4 copy paper supply rose
sharply in 2008 due to the election of parliament and local governments. After the election year,
the supply of A4 copy paper decreased dramatically between 2009 and 2010. The yearly
average supply of A4 copy paper in 2006-2010 (except 2008) is 1.2 million kilograms of A4 copy
paper, which is 4 times higher from the average supply in the 2003-2005 period.
In 2011, the supply of A4 copy paper increased by 2 million kilograms compared to the previous
year. In 2011-2014, the fluctuation of supply of A4 copy paper was relatively stable and the
yearly average supply of A4 paper was 3.6 million kilograms in these years. This high level of
supply of A4 copy paper may be caused by economic expansion in recent years.
Figure 2 The historical supply of A4 copy paper, 2003-2015.10, in kilograms
Source: Customs data
0
500000
1000000
1500000
2000000
2500000
3000000
3500000
4000000
4500000
Election effect
Related to economic expansion

21
When comparing the quarterly supply of A4 copy paper for the last 5 years, there is no clear
tendency of seasonal effect in the supply of A4 copy paper. In general, A4 copy paper supply in
the 1st quarter tends to be lower than for other quarters. As for 2011-2012, the trend for
quarterly supply was similar. More precisely, A4 copy paper supply increased gradually in
second quarters compared to first quarters, increased sharply in third quarters, and decreased
in fourth quarters of 2011-2012. Quarterly supply of A4 copy paper was the highest in 2nd and
4th quarters in 2013 and 2014 respectively. The figure below shows quarterly supply of A4 copy
paper for 2011-2015.
Figure 3 Quarterly supply of A4 copy paper, 2013.Q1-2015.Q3, in kilograms
Source: Customs data
Note: AQS-average quarterly supply of A4 copy paper
An average 830,000-960,000 kg of A4 copy paper is supplied in the local market per quarter
according to customs data.
Comparing the monthly supply of A4 copy paper for the last 3 years, monthly supply is almost
similar throughout all months regardless of some extreme cases. However, the monthly average
supply of A4 copy paper in the range of 2013-2015 shows that A4 paper supply tends to rise in
April, August and December.
The figure below illustrates the monthly supply of A4 copy paper for 2013-2015.
0
200000
400000
600000
800000
1000000
1200000
1400000
1600000
2011 2012 2013 2014 2015
Q1
Q2
Q3
Q4
AQS: 811,904
AQS:952,638
AQS:876,355
AQS:966,688 kg
AQS: 831,068 kg

22
Figure 4 Monthly supply of A4 copy paper, Jan 2013-Oct 2015, in kilograms
Source: Customs data
Table 8 Descriptive statistics of monthly supply of A4 copy paper for 2011-201presents the
descriptive statistics for the monthly supply of A4 copy paper for 2011-2015. The average
monthly supply of A4 copy paper was 322,229 kg and 255,832 kg in 2014 and the first 10
months of 2015 respectively.
Table 8 Descriptive statistics of monthly supply of A4 copy paper for 2011-2015, by kilograms
2011 2012 2013 2014 2015
Mean 270,635 317,546 292,118 322,229 255,832
Median 259,591 363,713 302,124 296,161 285,280
Standard deviation 137,857 170,804 146,911 167,912 90,059
Min 61,018 3,350 8,880 38,270 65,114
Max 584,838 558,590 629,461 656,947 343,861 Source: Customs data
Based on the historical data for A4 paper supply, the import planning of main suppliers and the
socio-economic situation, projection for A4 copy paper supply was deducted for the last 2
months of 2015 and the first 6 months of 2016. A4 copy paper supply is expected to increase in
the second quarter of 2016 due to the election of parliament compared to the same period in the
previous year. There is also an expectation that the supply of A4 paper will decrease in the
second half of 2016 due to economic recession.
0
100000
200000
300000
400000
500000
600000
0
100000
200000
300000
400000
500000
600000
700000
Jan Feb Mar Apr May Jun Jul Aug Sep Oct Nov Dec
2013 2014 2015 Monthly average supply of A4 copy paper

23
Figure 5 Yearly supplies of A4 copy paper and projection for Nov 2015-June 2016, in kilograms
Source: Customs data and Researcher’s calculation
The forecast for A4 copy paper supply is estimated at 500,500 kg for the last two months of
2015 and 1,098,289 kilograms for the first six months of 2016.
Market share of main sustainable A4 copy papers
Currently there are 4 different types of A4 copy paper sold in the market in terms of thickness:
70gsm, 75gsm, 80gsm and 85gsm. About 90% of total imported A4 copy paper is 80gsm paper.
As mentioned in the previous chapter, there are over 10 brands of A4 paper, and non-brand A4
paper made in China that have been sold on the market.
According to Customs Statistics, “Double A”, “Yes Silver”, “Miilk”, “IDEA Work” and “CAMPAP”
brands were the main brands imported in the first 10 months of 2015. The figure below shows
the market share for main types of A4 copy paper sold in 2013-2015.10.
Figure 6 Market share of main A4 copy papers for 2013-2015.10
Source: Customs data
From the above figure, one can see that Double A, Yes-silver and Standard paper have been
continuously supplied in the market for the last 2-3 years. IDEA work and Miilk papers entered
0
500000
1000000
1500000
2000000
2500000
3000000
3500000
4000000
4500000
74%
7%3% 2%
14%
69%
7%3%
20%
86%
1% 4% 3% 3% 4%
0%
10%
20%
30%
40%
50%
60%
70%
80%
90%
Double A Yes-silver Gold HP everyday
Standardpaper
IDEA work Miilk Other
2013 2014 2015.10

24
the market. As for the first 10 months of 2015, 86% of the total supply of A4 was provided by
Double A, 3% was Miilk, 2.5% was IDEA work, 1.3% was CAMPAP and 1% was Yes-Silver.
A4 copy paper is mainly imported from Thailand, China, Korea, Malaysia, Indonesia, Hong
Kong, Russia and Finland. The following chart illustrates the percentage of paper imported from
each country for 2013-2015.10.
Figure 7 Country of origin for imported A4 copy paper, 2013-2015.10
Source: Customs data
Main players of A4 copy paper and their market share
Currently, in the A4 paper market, Tavan Bogd Management LLC, Finpack LLC, CTSN LLC, Az
khur LLC, Tenger Altai LLC and Fratres Imperium LLC are important players. The chart below
shows the 6 main suppliers’ market shares in 3 consecutive years.
Figure 8 Main players and their market share for A4 copy paper, 2013-2015.10
Source: Customs data
Importers tend to officially distribute 1 to 2 brands of A4 paper.
When determining of the distribution of the market, it can be deducted that there are about one
key supplier, 3 medium suppliers and 2 lower medium suppliers and 45 small suppliers who
operate actively on the A4 copy paper market.
74%
6%2%
10%1%
7%
70%
6%1%
12%6% 4% 1%
87%
1% 1%6% 5%
0%0%
10%
20%
30%
40%
50%
60%
70%
80%
90%
100%
Thailand Finland Malaysia China Korea Indonesia Others
2013 2014 2015.10
70%
4%8%
2% 2%
71%
5% 4%10%
2%
80%
5% 4% 1% 3% 3,70%
0%
10%
20%
30%
40%
50%
60%
70%
80%
90%
Tavan bogdmanagement LLC
Az khur LLC CTSN LLC Finpack LLC Fratres Imperium Tenger Altai LLC
2013 2014 2015.10

25
All main suppliers import sustainable A4 copy paper which meets the main sustainability criteria
introduced in Section 2.1. Key importers have already taken steps to supply A4 copy paper that
satisfies sustainability criteria. Therefore, it is expected that sustainable A4 copy paper will be
supplied in the future. However, recycled A4 copy paper will not be supplied in the short and
medium term due to consumer buying behaviour.
Among local main suppliers of A4 copy paper, only Finpack LLC, a company introducing
environmentally-friendly and green technology, has its own corporate environment policy. The
table below summarizes the environmental, social and economic benefits offered by main local
suppliers.
Table 9 Environmental, social and economic benefits of key suppliers
Criteria
Main suppliers T
avan
bo
gd
man
ag
em
en
t
LL
C
Fin
pack L
LC
Ten
ger
Alt
ai
LL
C
CT
SN
LL
C
Az k
hu
r L
LC
Fra
tre
s
Imp
eri
um
LL
C
Corporate environmental policy
No Yes No No No No
Social responsibility
Support education and health of Mongolian children
Support education of Mongolian children
Support education sector
No Support education sector
No
Job creation in national paper industry and opportunities for SMEs
Yes Yes Yes Yes Yes Yes
Source: Interview survey with key importers
Identifying the main obstacles
This part of the study aims to identify the main obstacles limiting the supply of the sub-
categories of A4 copy paper. First, we will consider the average price of A4 copy paper in
Ulaanbaatar and how these prices compare with the international prices and with the
conventional items. The price structure and profit margin will also be considered. Secondly, the
strengths/weaknesses for the provision of sustainable A4 copy paper will be examined. Finally,
we will discuss other major obstacles.
In Ulaanbaatar city, a variety of point of sales sell A4 paper in official stores, branches,
stationery shops, shops providing copying services, supermarkets, markets, wholesale stores to
postal shops. Among them, stationery shops and supermarkets made the most sales. In
general, A4 copy paper reaches the final consumer through 2-3 supply chains of importers. All
main importers sell A4 copy paper in their own official stores and branches. On the other hand,
retail shop owners mostly buy A4 paper directly from markets, wholesale stores and importers.
Depending on units of supply chain, the price of A4 copy paper is different. As of October of
2015, the average retail price of 80gsm paper was MNT 7600 per ream and the average retail
price of 70gsm paper is MNT 6700 in the case of importers. The table below shows the retail
and wholesale price of A4 copy paper offered by the main importers.
Table 10 A4 copy paper price of key importers (2015.10)
Name of A4 copy paper Retail price (MNT) Wholesale price (MNT)
Name of importers

26
Double A (80gsm) 7900 7650 Tavan bogd management LLC
Miilk (85gsm) 7500 7200 Az khur LLC
Yes-Silver (80gsm) 7700 7400 Finpack LLC
Campap (80gsm) 7100 7100 Circle LLC
IDEA Work (80gsm) 7700 7500 Fratres Imperium LLC
Yes-Silver (70gsm) 6800 6600 Finpack LLC
Quality Blue (70gsm) 6600 6400 Tavanbogd Management LLC
Source: Interview survey with key importers
The average price of A4 copy paper sold in retail shops tends to be MNT 100-600 higher than
the retail price of importers. Difference in price of A4 copy paper sold in retail shops mainly
depends on the location of retail shops.
An average price of sustainable A4 copy paper in the border has been relatively stable for the
whole decade. For ten consecutive years, the average price of A4 copy paper per kilogram was
$1, $1.8 at most and $0.6 at least.
Figure 9 Dynamics of monthly price of A4 copy paper in the border, 2013-2015.10
Source: Customs data
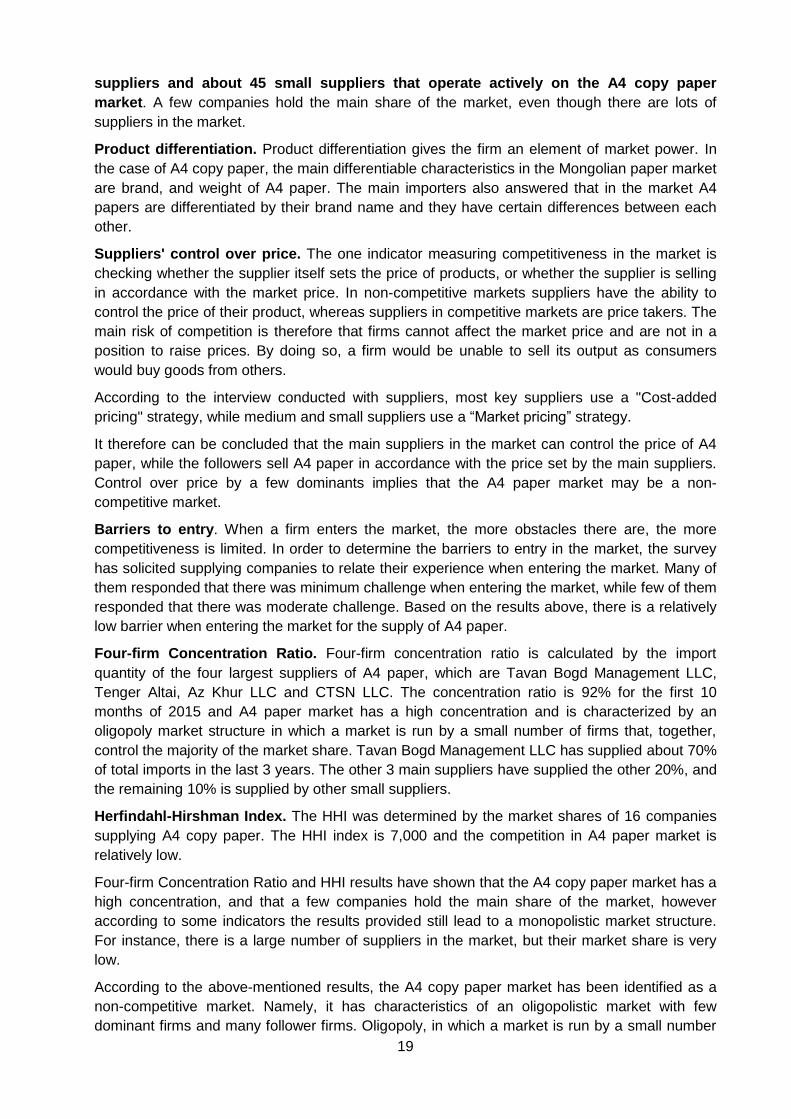
The figure below compares the average retail price of sustainable A4 copy paper with its
average price in the border and average retail price of conventional A4 copy paper. The
average price of sustainable A4 paper copy papers is MNT 500-2000 higher than the average
price of conventional (non-brand) A4 paper mainly imported from China. Thus, sustainable A4
papers have a price premium of about 15%. What is more, the average price of sustainable A4
paper is about MNT 2000-3000 higher than its average price in the border.
-80%
-60%
-40%
-20%
0%
20%
40%
60%
80%
100%
120%
140%
0,0000
0,5000
1,0000
1,5000
2,0000
2,5000
1 6 10 3 7 11 3 7 11 3 7 11 3 7 11 3 7 11 3 7 11 10 2 6 10 2 6 10 2 6 10 2 6 10 2 6 10
2003 2004 2005 2006 2007 2008 2009 2010 2011 2012 2013 2014 2015
Price in the board Change rate of price in the board, %
27
Figure 10 Average retail and border price of sustainable A4 paper and average retail price of
conventional A4 paper, 2015.10 (in MNT)
Source: Customs data
In terms of price structure, most suppliers responded that they generally use a cost-added
pricing strategy. Because consumers have only little knowledge of the difference in product
quality, they tend to be very price sensitive. So suppliers pay attention to competitors’ price and
try to set theirs a little lower, or at least to match competitors’ price by reducing their profit
margin. Ulaanbaatar-based suppliers add an approximate 15%- profit margin.
Since 2014, the price of A4 paper has been changed 3 to 4 times. According to main suppliers,
the main reasons for price changes are the currency fluctuation and the change in fuel price.
There is no international supplier for the provision of sustainable A4 paper. Since all importers
and suppliers are national companies, the strengths and weaknesses of national companies
over international suppliers for the provision of sustainable A4 copy paper will not be explored.
However, other obstacles faced by national suppliers with regard to the supply of sustainable
A4 copy paper were found:
Consumers’ knowledge on the sustainability of A4 paper is low.
It is hard to change the product that consumers are accustomed to buying.
Consumers are price sensitive due to the changes in the product prices.
A few companies hold the main share of the market.
A SWOT analysis has been developed in order to identify the limiting factors for the supply of
A4 copy paper certified with ecolabels. According to the SWOT analysis, main factors that may
have a negative effect on the supply of sustainable A4 copy paper are as follows:
Suppliers’ knowledge on the sustainable A4 paper: Only the main importers have a
good knowledge of the sustainable A4 paper. However, the knowledge of workers in
the supply chain, of most small and medium suppliers, and of vendors regarding the
product is relatively low. With better knowledge of sustainable products, they could
influence consumers’ buying behaviour.
Consumers are accustomed to buying certain type of A4 copy paper: Introducing
new A4 paper into the market is a real challenge as consumers are accustomed to
buying a certain type of A4 copy paper.
Non-competitive market: A few companies hold the main share of the market even
though there are lots of suppliers in the market. These main companies compete in
76
00
67
00
55
00
52
00
69
00
60
00
8 0 G S M ( R E A M ) 7 0 G S M ( R E A M )
Average price of sustainable A4 paper in retail
Average price of sustainable A4 paper in the border
Average price of conventional A4 paper in retail

28
the market with different brands of A4 paper that are all considered as providing
sustainable products.
Types of sustainable A4 copy paper are limited in the market.
A lot of conventional A4 papers having lower price may be illegally imported and sold
in the market4.
Figure 11 SWOT analysis for supply of sustainable A4 copy paper
1.3 A4 COPY PAPER DEMAND
The evolution of national demand for the sustainable A4 copy cannot be determined due to a
lack of data. Thus, the evaluation of yearly supplies of A4 copy paper is provided instead of
national demand in the following figure.
4In reality, retailers carry conventional A4 copy paper with lower quality from China into the Mongolian market without registering in the Customs. However, there is any official data to confirm this information.

29
Figure 12 Yearly supplies of A4 copy paper, in kilograms
Source: Customs data
Since the national demand for A4 copy paper cannot be determined, this study focuses on
public organizations’ procurement demand for A4 copy paper. Under the framework of demand
analysis, the potential consumption and procurement of A4 copy paper for public organizations
in Ulaanbaatar city has been determined.
As for the demand analysis in this study, public procurement data collected within the
framework of the research, “Demand and Supply Analysis of Four Product Markets: A4 copy
paper, Printer ink cartridge, Computer and Fuel”, conducted by MIRIM Consultant LLC and
financed by EBRD in 2015, will be used. Public procurement information was collected from 68
public organizations in Ulaanbaatar city. 29 of them are at first level, 9 are at second level, 10
are at third level, 17 are public services, and 3 of them are state-owned or state-shared holding
companies and industries. First-level categories include government agencies with rights of
enacting laws and implementing policy (ministries and agencies) as well as judiciary
organizations. Second level involves municipality and related affiliated agencies. Third-level
organizations are basically district governments and related administrations. Public services are
institutions providing education, culture, science and health services to the public.
Public organizations’ А4 copy paper consumption
A4 paper consumption of public organizations is estimated by comparing the monthly planned
budgets of public organizations for A4 copy paper at each institutional level including variables
of location and number of staff. Differences of A4 paper consumption between the institutional
levels were identified and, furthermore, consumption rates were determined for each
government officer distributed by institutional level and location. This estimate serves as a basis
for summarizing A4 paper consumption in the public sector.
А4 office paper consumption and institutional categories. Public organizations involved in
the survey had planned MNT 641 million for procuring A4 paper in 2015, which equals to 11%
of total state budget for stationery. These organizations are consuming 84,527 reams of A4
paper a year. Monthly planned consumption of A4 paper for public organizations in Ulaanbaatar
city are indicated in the table below.
0
500000
1000000
1500000
2000000
2500000
3000000
3500000
4000000
4500000

30
Table 11 Planned monthly consumption expenditure of A4 paper in 2015
Level No.PO
Monthly consumption expenditure (mln.MNT)
Monthly consumption
(ream)
Monthly maximum
consumption expenditure (mln.MNT)
Monthly minimum
consumption expenditure (thous.MNT)
Monthly average
consumption expenditure (thous.MNT)
Monthly median
consumption expenditure (thous.MNT)
Level-I 29 37.8 4941 14 24.2 1304 712
Level-II
9 5.6 735 18 37.5 625 249.6
Level-III
10 2.8 371 1.3 17.5 283.4 107.7
PSO 17 2.9 385 0.85 13.2 173.6 31.8
SOE 3 4.2 205 3.7 44.3 1399.1 403.2
Source: (EBRD , 2015)
Note: PSO-Public Service Organizations SOE-State Ownership Enterprise PO-Public Organizations
The data in the above table shows that the average consumption of A4 paper decreases as the
institutional level becomes lower. In other words, first-level organizations have the highest
consumption of A4 paper, while public services have the lowest amount of consumption
amongst others. Average monthly consumption of first-level organizations is 65 percent higher
than consumption amount of second-level organizations’ consumption, 85 percent higher than
third-level organizations and 95 percent higher than that of public services.
The distribution of average monthly A4 paper consumption at each level is illustrated in the
figure below. Half of public organizations in the first level and the second level respectively use
up to MNT 712,000 and MNT 250,000 of A4 office paper per month. Moreover, half of public
organizations in the third level consume up to MNT 108,000 per month in A4 paper, while half
of public services use up to MNT 318,000 per month of A4 paper..
Figure 13 Distribution of average monthly A4 paper consumption in 2015, by the level of public
organizations

31
Source: (EBRD , 2015)
The table below presents the consumption of A4 copy paper only for 1st-level organizations. In
the case of ministries, average and median A4 paper consumption are 127 reams and 104
reams; 353 at most and 60 at least for all ministries.
Table 12 Planned monthly consumption expenditure of A4 paper in 2015, by types of POs in the
first level
Classification of
organizations
No.POs
Monthly consumpt
ion expenditu
re (mln. MNT)
Monthly consumpt
ion (ream)
Monthly maximum expenditu
res (thous. MNT)
Monthly minimum expenditu
res (thous. MNT)
Monthly average
expenditures
(thous. MNT)
Monthly median
expenditures
(thous.MNT)
Ministries 15 14.6 1906 2700.0 456.0 971.9 792.8
Governmental agencies 10 20.4 2661 14000.0 24.1 2036.8 430.0
Organizations of legislative authority 4 2.8 374 1100.0 266.6 714.6 716.0
Source: (EBRD , 2015)
Consumption of A4 office paper per public officer. Cost and quantity of A4 office paper
consumption for each public officer are estimated based on the number of workers in public
organizations involved in the survey. An average of two reams of A4 paper per month is
allocated for each officer in state central agencies. One ream of paper per month is allocated for
each officer of municipality and its affiliated organizations. An average 0.4 ream of paper is
consumed by each officer of local administrative organizations and 0.3 reams per month are
used by each officer at public service organizations.
Table 13 Monthly average consumption of A4 office paper per public officer
Classification of organizations No.
organizations No of
workers
Monthly consumption
expenditure per worker (MNT)
Monthly consumption
per worker (ream)
State central administration organizations and their affiliated organizations (Level-I) 29 3065 12335 1.6
Municipal administration organizations and their affiliated organizations (Level-II) 9 933 6028 0.8
Local administration organizations and their affiliated organizations (Level III) 10 827 3432 0.4
Public service organizations 17 1170 2523 0.3
State-owned enterprises 3 1818 2309 0.3 Source: (EBRD , 2015)
Approximate estimation of А4 paper consumption. Based on the above-mentioned monthly
consumption per officer, A4 paper consumption of all public officers in Ulaanbaatar can be
assumed as follows. The total number of government officials in Ulaanbaatar was 89,430 in the
beginning of 2015.
Table 14 Approximate estimation of A4 office paper consumption in total public organizations
Classification of public organizations
Classifications of civil service
Number of workers
Monthly consumption
per worker (ream)
Projection of monthly
consumption (ream)

32
State central administrations, the related agencies and other organizations*
Political position 436 1.6 698
Public administration
4466 1.6 7146
Civil special service
29171 0.8 23337
Public service 25777 0.8 20622
Municipal administration organizations and affiliated organizations
Political position 203 1.6 325
Public administration
3648 1.6 5837
Civil special service
1602 0.8 1282
Public service 24127 0.3 7238
Total 89430 66485
Source: Statistics of Composition and Movement of Public Officers in Mongolia, 2014
The potential monthly A4 paper consumption of all public organizations in Ulaanbaatar is 66,485
reams or 166,213 kg of paper. If the average price of a ream is MNT 7600, those organizations
are expected to spend MNT 505 million for procuring A4 paper monthly.
Public organizations’ A4 office paper procurement
Since it is not possible to determine the total A4 paper procurement quantity of all public
organizations due to the lack of data, we use data collected by MIRIM Consultant LLC. A4
paper procurement data in 2014 was collected from 45 organizations out of 68 involved in the
survey conducted by MIRIM Consultant LLC. As of the first three months of 2015, not all
organizations had the information as some of them had not yet procured A4 paper. Therefore,
estimates are mainly based on 2014 data.
In 2014, those 45 organizations procured 40,157 reams of paper with more than MNT 266
million. The table below shows quantity, average price and total cost of A4 paper procured by
those 45 organizations in 2014 and in the first three months of 2015. 62% of A4 paper procured
in 2014 is allocated to state central administrations and the affiliated agencies, 18% is procured
by municipality and related organizations, 3% is procured by local administration and affiliated
organizations, 8% is related to public services while 13% is procured by state-owned
enterprises and industries.
Table 15. A4 office paper procurement of public organizations in Ulaanbaatar, 2014-2015.Q1
Classification of public organizations
Number of organization
s
2014 First Quarter of 2015
Procured
quantity (ream)
Average price (MNT)
Total expenditur
e (mln. MNT)
Procured
quantity (ream)
Average price (MNT)
Total expenditur
e (mln. MNT)
State central administration organizations and their affiliated organizations 25 24802 7136 164.4 310 7650 0.383
Municipal administration organizations and their affiliated organizations 6 6804 6942 47.8 1895 7489 14.3
Local administration organizations and their affiliated organizations 6 1315 7171 9.2 750 7581 5.6
Public service organizations 6 680 7100 4.7 358 7473 2.7
State owned enterprises 2 6556 6709 40.2 1477 6427 9.7
Total 45 40157 35058 266.3 4790 36620 33
Source: (EBRD , 2015)
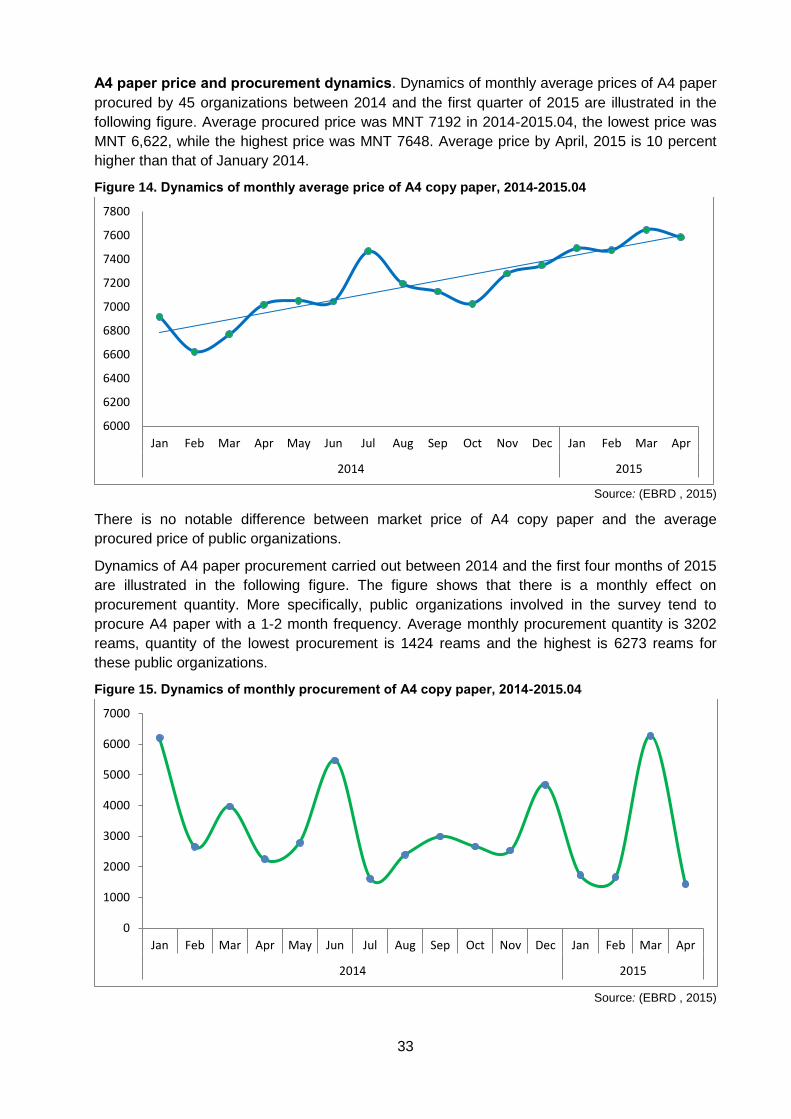
33
А4 paper price and procurement dynamics. Dynamics of monthly average prices of A4 paper
procured by 45 organizations between 2014 and the first quarter of 2015 are illustrated in the
following figure. Average procured price was MNT 7192 in 2014-2015.04, the lowest price was
MNT 6,622, while the highest price was MNT 7648. Average price by April, 2015 is 10 percent
higher than that of January 2014.
Figure 14. Dynamics of monthly average price of А4 copy paper, 2014-2015.04
Source: (EBRD , 2015)
There is no notable difference between market price of A4 copy paper and the average
procured price of public organizations.
Dynamics of A4 paper procurement carried out between 2014 and the first four months of 2015
are illustrated in the following figure. The figure shows that there is a monthly effect on
procurement quantity. More specifically, public organizations involved in the survey tend to
procure A4 paper with a 1-2 month frequency. Average monthly procurement quantity is 3202
reams, quantity of the lowest procurement is 1424 reams and the highest is 6273 reams for
these public organizations.
Figure 15. Dynamics of monthly procurement of А4 copy paper, 2014-2015.04
Source: (EBRD , 2015)
6000
6200
6400
6600
6800
7000
7200
7400
7600
7800
Jan Feb Mar Apr May Jun Jul Aug Sep Oct Nov Dec Jan Feb Mar Apr
2014 2015
0
1000
2000
3000
4000
5000
6000
7000
Jan Feb Mar Apr May Jun Jul Aug Sep Oct Nov Dec Jan Feb Mar Apr
2014 2015

34
Identifying the main obstacles and opportunities for the purchase of sustainable A4 copy
paper
According to the data used in “Demand and Supply Analysis of Four Product Markets: A4 copy
paper, Printer ink cartridge, Computer and Fuel”, by EBRD in 2015, 45 public organizations all
consume the brands of A4 copy papers (Double A, Yes Silver and Miilk) that are in compliance
with the sustainability criteria (See Table 3). However, employees procuring A4 copy paper in
public organizations have very weak awareness of sustainable products. Therefore, main
obstacles for the purchase of sustainable A4 copy paper may be the poor knowledge of
procurement practitioners. In addition, delivery service and flexibility in payment term are
important for the purchase of A4 paper of public organizations.
As introducing sustainable criteria in the public procurement, the government will make
significant contribution in the sustainable development through government spending. Its value
is huge. Not only reduce impact in environment but also protect public worker’s health and
adopt responsible business and ethical business practice.
The price of sustainable paper is higher than that of the conventional paper in the market.
However, most public organizations in Ulaanbaatar are accustomed to using A4 paper that is in
compliance with the sustainability criteria regardless of the price difference. Therefore, price
difference between sustainable and conventional papers may not be a problem for public
organizations in Ulaanbaatar city. Based on this reasoning, it can be concluded that there is no
notable problem for public organizations to re-structure the procurement process with regard to
sustainably criteria.
1.4 CONCLUSIONS AND RECOMMENDATIONS DRIVEN FROM THE MARKET
ANALYSIS ON A4 COPY PAPER
In Mongolia, there is no local production of A4 copy paper. All grades of A4 paper in the
Mongolian paper market are imported from abroad. Recycled paper is not imported in the
Mongolian market, whereas paper made from both sustainably harvested virgin fibers and
natural forest5 are imported from Thailand, Finland, Russia, South Korea, China and Malaysia.
In this research, non-brand A4 copy papers produced from natural forests were not studied
because of the inconsistency of sustainability criteria.
The Mongolian paper market does not have laboratories, instruments, or tools to certify
and verify the sustainability of the office paper imported. There is also no national ecolabel
relevant to A4 paper. Therefore, international ecolabels and standards are applied for
verifications.
Some brands of A4 paper available in the Mongolian paper market use renewable energy and
water that is drawn from rain water reservoirs for pulp and paper production. The majority of the
brands have been certified with ISO 14001, ISO 9001 and ISO 9706. Some of them bear the
European Ecolabel, FSC and PEFC labels.
Main local official distributers of copy paper in Mongolia have created a number of jobs and
support SMEs and individuals through their supply chains. Moreover, some of them spearhead
5 Virgin fiber paper is most commonly used and comes directly from native forests. Virgin fiber paper
contains the strongest fiber but has the most immediate impact on the forests. However, that impact is
diminished if paper is produced from virgin fiber stemming from legally harvested woods and from
sustainably managed forests.
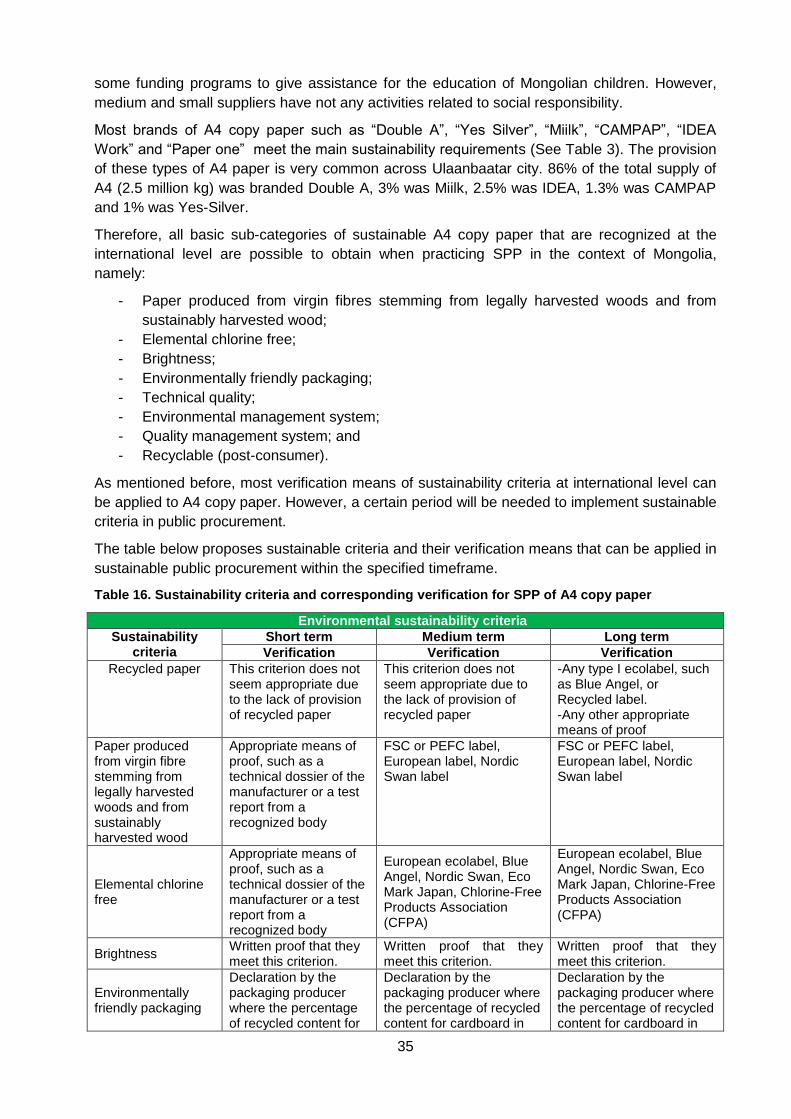
35
some funding programs to give assistance for the education of Mongolian children. However,
medium and small suppliers have not any activities related to social responsibility.
Most brands of A4 copy paper such as “Double A”, “Yes Silver”, “Miilk”, “CAMPAP”, “IDEA
Work” and “Paper one” meet the main sustainability requirements (See Table 3). The provision
of these types of A4 paper is very common across Ulaanbaatar city. 86% of the total supply of
A4 (2.5 million kg) was branded Double A, 3% was Miilk, 2.5% was IDEA, 1.3% was CAMPAP
and 1% was Yes-Silver.
Therefore, all basic sub-categories of sustainable A4 copy paper that are recognized at the
international level are possible to obtain when practicing SPP in the context of Mongolia,
namely:
- Paper produced from virgin fibres stemming from legally harvested woods and from
sustainably harvested wood;
- Elemental chlorine free;
- Brightness;
- Environmentally friendly packaging;
- Technical quality;
- Environmental management system;
- Quality management system; and
- Recyclable (post-consumer).
As mentioned before, most verification means of sustainability criteria at international level can
be applied to A4 copy paper. However, a certain period will be needed to implement sustainable
criteria in public procurement.
The table below proposes sustainable criteria and their verification means that can be applied in
sustainable public procurement within the specified timeframe.
Table 16. Sustainability criteria and corresponding verification for SPP of A4 copy paper
Environmental sustainability criteria
Sustainability criteria
Short term Medium term Long term
Verification Verification Verification
Recycled paper This criterion does not seem appropriate due to the lack of provision of recycled paper
This criterion does not seem appropriate due to the lack of provision of recycled paper
-Any type I ecolabel, such as Blue Angel, or Recycled label. -Any other appropriate means of proof
Paper produced from virgin fibre stemming from legally harvested woods and from sustainably harvested wood
Appropriate means of proof, such as a technical dossier of the manufacturer or a test report from a recognized body
FSC or PEFC label, European label, Nordic Swan label
FSC or PEFC label, European label, Nordic Swan label
Elemental chlorine free
Appropriate means of proof, such as a technical dossier of the manufacturer or a test report from a recognized body
European ecolabel, Blue Angel, Nordic Swan, Eco Mark Japan, Chlorine-Free Products Association (CFPA)
European ecolabel, Blue Angel, Nordic Swan, Eco Mark Japan, Chlorine-Free Products Association (CFPA)
Brightness Written proof that they meet this criterion.
Written proof that they meet this criterion.
Written proof that they meet this criterion.
Environmentally friendly packaging
Declaration by the packaging producer where the percentage of recycled content for
Declaration by the packaging producer where the percentage of recycled content for cardboard in
Declaration by the packaging producer where the percentage of recycled content for cardboard in

36
cardboard in their packaging is specified
their packaging is specified
their packaging is specified
Technical quality
A sample of the paper must be provided to the procurer in order to test the quality of paper.
A sample of the paper must be provided to the procurer in order to test the quality of paper.
Paper certified that
compatible with machinery
in accordance with DIN
190309, AFNOR Q11-013,
or equivalent.
Environmental management system
-Written corporate environmental policy, consistent with ISO 14001, or equivalent. --Any other appropriate evidence
ISO 14001
ISO 14001
Quality management system
- ISO 9001 ISO 9001
Long life - ISO 9706 ISO 9706
Recyclable (post-consumer)
Appropriate means of proof, such as a technical dossier of the manufacturer or a test report from a recognized body
Recyclable labels Recyclable labels
Social sustainability of suppliers
Social responsibility - Appropriate proof that the requirement has been met.
Appropriate proof that the requirement has been met.
Supply chain according to labour standards and human right laws
-
Appropriate proof that the requirement has been met.
Appropriate proof that the requirement has been met.
Economic sustainability of suppliers
Job creation in local economy
Appropriate proof that the requirement has been met.
Appropriate proof that the requirement has been met.
Appropriate proof that the requirement has been met.
Cooperation with SMEs and individuals through paper supply chain
Appropriate proof that the requirement has been met.
Appropriate proof that the requirement has been met.
Appropriate proof that the requirement has been met.
Compared to the price of conventional A4 copy paper, the higher price of sustainable A4 copy
paper is not a main obstacle to the introduction of sustainable criteria in public procurement
because most public organizations are accustomed to using the brands of A4 copy paper in
Ulaanbaatar. However, the price difference between sustainable and conventional A4 copy
papers may be an obstacle to introducing SPP in the countryside.
Based on the lessons learned from research, the following is recommended to launch SPP for
A4 copy paper:
Build knowledge and capacity regarding SPP amongst procurement specialists in
public organizations.
SPP criteria need to be launched in stages. Namely, basic criteria on environmental
sustainability need to be applied to public procurement in the short term. Criteria
related to social and economic sustainability should be introduced in public
procurement in the medium term. The main reason is that only few companies that hold
the main share of the market will immediately meet all requirements in SPP. By
introducing sustainability criteria in public procurement stage-by-stage, small and
medium-scaled suppliers will be able to compete in this environment.
37
SPP should be first introduced in bigger public organizations in the central regions of
the country that have high consumption of A4 paper. Following this, it should be rolled
out more widely.
Build knowledge and capacity regarding SPP amongst small- and medium-sized
suppliers. Currently, only the main importers in the market have a good knowledge of
sustainable A4 paper. However, their workers in the supply chain, as well as most
small- and medium-sized suppliers and vendors have little knowledge about the
product. By increasing knowledge of sustainable alternatives, the provision and types
of these products should become greater in size, and it should make them more
competitive on the market.

38
II. Market Analysis for Toner
Cartridge
Reduce. Re-use. Recycle.

39
2.1 SUB-CATEGORIES OF PRINTER INK CARTRIDGE, PRELIMINARY
COMPENDIUM OF SUSTAINABILITY CRITERIA AND MEANS OF VERIFICATION
This section of the report aims to identify the specific sub-categories of sustainable toner
cartridge, to summarize the sustainability criteria of toner cartridge, and to determine the means
of verification for the sustainability criteria at international and national levels.
2.1.1 Identification of Sub-Categories of Sustainable Products
International sub-categories of toner cartridge
As mentioned before, the study aims to define categories of sustainable products by taking into
account the combination of environmental, social and economic sustainability aspects.
Categories related to social and economic sustainability are almost the same as copy paper.
Therefore, this part mainly concentrates on the environmental sustainability for toner cartridge.
Environmental sustainability: Environmentally sustainable toner cartridges can be defined as
any effort undertaken to reduce the environmental impact of toner cartridges. The main issues
for toner cartridges are toxic chemicals and heavy metals used in the production, consuming
significant amount of energy, generating a considerable amount of waste arising from empty
toner cartridges and contaminating the natural environment due to their hazardous content.
Ecolabels focus on the following environmental impacts:
Chemicals contained in the toner powder: Chemicals can be harmful to both human
health and the environment. Toner powder may irritate the human respiratory system
and cause disease due to dangerous chemical components and the heavy metals used.
Improperly discarding empty toner cartridges pollute the natural environment due to their
hazardous pollutants.
Use of recycled materials, reuse and take-back systems: The biggest environmental
concern with cartridges is resource consumption. Original equipment manufacturers
(OEMs) burn a significant amount of energy for the production of toner cartridges. On
average, they consume about 3 litres of oil to produce a typical cartridge. Moreover,
other national resources such as plastic, metal, rubber, foam and paper are used in the
production of toner cartridges.
The next environmental issue arising from the use of cartridges is the waste stream
which would normally go to landfill. According to the European Toner and Inkjet
Remanufacturer Association (ETIRA), more than 500 million of printer cartridges end up
dumped in landfills around the world.
Therefore, the reuse and recycling of cartridges could be significant in reducing
environmental impacts. Reusing and recycling of cartridges not only avoid draining the
planet natural resources, but also substantially reduce the number of cartridges going to
landfill. There are two common approaches to reuse cartridges: remanufacture and take-
back service. Remanufactured toners are used toner cartridges refilled with toner as well
as replaced with expendable parts. Cartridges can easily be remanufactured up to 2-3
times. Take-back service is that many OEMs offer their customers to return used
cartridges. All returned cartridges are recycled into useful materials, which then go on to
become new products again. Any parts that cannot be recycled are treated and disposed
of in a way that causes minimal environmental impact.
Case parts: Chlorinated plastics such as PVC used in the cartridge parts or packaging,
together with use of brominated flame retardants in the casing.

40
Environmentally-friendly packaging: The packaging for toner cartridges will not contain
PVC or other chlorinated plastics.
Release of volatile organic compounds (VOC) during the use: VOCs are organic
chemicals that have a high vapor pressure at ordinary room temperature. Some VOCs
are dangerous to human health or cause harm to the environment. Harmful VOCs
typically are not acutely toxic, but have compounding long-term health effects.
Corporate environmental policy: Suppliers of toner cartridges can produce a
sustainability report or environmental policy that is consistent with international
standards.
Social sustainability: As defined in the A4 paper section, toner cartridges in terms of social
sustainability can be defined as any effort that creates social value in national and local
communities. In case of social sustainability, toner cartridges’ sub-categorizations include
corporate social responsibility, the ILO conventions as well as quality and technical issues.
Social responsibility and the ILO core conventions are the same in the A4 paper section.
Quality and technical issues: The majority of remanufactured cartridges now offer
equivalent quality, performance and yield as original cartridges. Some companies still
continue with bad practices today, but most have made a legitimate effort at selling a
quality product. That is why it is advised to purchase remanufactured toner cartridges
that have been tested by the supplier and meet one of the national or international
quality standards for toner cartridges, such as ASTM F18566, ASTM F20367, DIN 155,
DIN 338708 and DIN 33871-1, or ISO/IEC 197529, ISO/IEC 197982410.
Some printing machines may not accept the usage of remanufactured cartridges due to
the inclusion of a specific technology. Purchasers should check the printing machine
before using such cartridges to ensure that the printer will accept the remanufactured
cartridge.
In addition, OEMs tend to threaten that the warranty for printer will be invalid unless
original cartridges are used in the printer. Therefore, it is important to purchase
remanufactured cartridges from a company that guarantees to repair any damages due
to its cartridge.
Economic sustainability: Cartridge can be defined in terms of economic sustainability as a
contribution to local economic outcomes, including cost savings. Cartridges’ sub-categorizations
of economic sustainability are the same as in the A4 paper section.
6 ASTM F1856-Standard Practice for Determining Toner Usage for Printer Cartridges
7 ASTM F2036- Standard Test Method for Evaluation of Larger Area Density and Background on Electro photographic Printers 8 DIN is short for Deutsche Industrie Norm, the worldwide renowned German institute for standardization. DIN has elaborated several standards for remanufactured toner and inkjet cartridges. DIN standards 33870, 33871 and can be obtained from DIN. DIN 33870 Information technology; Office machines – Requirements and tests for the preparation of refilled toner modules for electro photographical printers, copiers and facsimile machines DIN 33871-1 Information technology; Office machines – Requirements and tests for the preparation of refilled toner modules for electro photographical printers, copiers and facsimile machines
9 Information technology - Method for the determination of toner cartridge yield for monochromatic
electrophotographic printers and multi-function devices that contain printer components.
10 Conformity assessment - General requirements for bodies operating certification of persons.

41
The table below summarizes the main sub-categories of sustainable toner cartridge as
described above in terms of environmental, social and economic sustainability aspects
Table 17 Sub-categories of sustainable toner cartridge
Environmental sustainability
Sub-categories Sub categories for SPP
approach(a)
Chemicals contained in the toner powder
Heavy metals in toner
-Heavy metals in toner -Azo-colorants in toner -Remanufacture (requirements for case parts) -Re-use/recycling -Take-back scheme -Environmental management system
Azo-colorants in toner
Harmful and hazardous substances in toner
Impact on climate change
Remanufacture (requirements for case parts)
Re-use/recycling
Take-back scheme
Environmentally-friendly packaging
Impact on manufacturer /supplier
Corporate environmental policy
Environmental management system
Social sustainability
Impact on local communities
Production and supply chain according to international labor standards and human rights laws
- Production of product
according to international labor standards
- Technical quality
Local sustainability
Technical quality
Economic sustainability
Impact on local economies
Economic contribution of cartridge sector to national GDP
Cartridges that are compatible with major printers
Job creation of cartridge sector in a country and opportunities for SMEs
Cartridges that are compatible with major printers
Re-investing in operations of cartridge sector
Local sub-categories of toner cartridge
80% of the total printer cartridges supplied to the market are imported from foreign markets.
Toner cartridges supplied in the Mongolian market can be categorized as follows:
Original equipment manufacturers’ toner cartridges;
Remanufactured toner cartridges (cartridges that have been refilled with toner as well as
replaced with expendable parts);
Toner cartridges produced by local and domestic companies with imported components
assembled in Mongolia;
Re-charged cartridge (only toner has been replaced in original and remanufactured
cartridge); and
Imitated cartridge imported from China (Produced according to the original printer
cartridge characteristics with cheap materials and components).
All kinds of original toner cartridges of large manufacturers are available in Mongolia. Most of
them are imported from China and Hong-Kong. In this research, imitated cartridges illegally
imported and re-charged cartridges will be not studied due to inconsistency with sustainability
criteria.

42
Most imported original toner cartridges contain the allowed amount of chemicals. Moreover,
imported original and remanufactured toners are mainly modules that are easily separable and
have separable joints. However, there is not any take-back service for original cartridges even
though the official distributers of most original equipment manufacturers are located in
Mongolia. It means that all empty original and remanufactured cartridges go to landfills. Refilling
of toner cartridges is common in the Mongolian market. Cartridges are typically refilled up to 2
times before disposal.
In the case of domestic manufacturers, there are about 5 manufacturers of printer cartridges
operating in Mongolia. Depending on the printer cartridge type, 13 to 21 components are
required for assembling printer cartridges. Manufacturers import printer cartridge components
from Japan, Korea and China. One of them tries to produce cartridges that are consistent with
environmentally sustainable criteria. The company use case and components imported from
original manufacturers for the production of cartridges besides applying environmentally friendly
packaging. This company also offers take-back service, and collected empty cartridges are
remanufactured.
Main local official distributers of toner cartridges in Mongolia have created a number of jobs and
support SMEs and individuals through their supply chains. Moreover, their efforts in providing
social services in local communities have contributed to socio-cultural and education
advancement.
2.1.2 Preliminary Compendium of Sustainability Criteria and Means of Verification
In order to ensure the sustainability of toner cartridges, we need to identify the labels and
certifications for sustainable toner cartridge.
Ecolabelling and Certification for toner cartridge: There is a number of ecolabels for toner
cartridge, such as the Nordic Swan, Blue Angel, Austrian Umweltzeichen, Eco Mark Japan, Thai
Green Label, Ecologo, ISO14000 family, standards of ASTM International and DIN and others.
Short descriptions for these ecolabels are attached in Annex 1.
According to the Sustainable Procurement Guidelines of UNEP, basic and advanced
sustainability criteria may be used in Sustainable Procurement. In this study, we will focus on
basic sustainability criteria and their means of verification for toner cartridges.
The table below summarizes the sustainability and verification criteria for toner cartridges used
by the United Nations and the European Commission.
Table 18 Sustainability criteria and verification for toner cartridge, international level
# Sustainability criteria Means of Verification
1
Heavy metals in toner: Toners must not be manufactured with a combined total of more than 100 ppm (parts per million) of heavy metals such as lead, mercury, cadmium, or chromium.
Cartridge carrying the Blue Angel, the
Umweltzeichen (Austrian ecolabel), the Eco Mark
Japan, Ecologo, Thai Green Label or the Nordic
Swan can serve as means of proof.
Any other appropriate means of proof, such as a
technical dossier of the manufacturer or a test
report from a recognized body will also be
accepted.

43
2
Azo-colorants in toner: The content of the toner powder of primary unsulphonated aromatic amines soluble in 1M hydrochloric acid and expressed as aniline does not exceed 500 mg/kg, and there is no more than 10 mg/kg Benzidine, ß-Naphthylamine and 4-Aminobiphenyl
Cartridge carrying the Blue Angel, the
Umweltzeichen (Austrian ecolabel), the Eco Mark
Japan, Ecologo, Thai Green Label or the Nordic
Swan can serve as means of proof.
Any other appropriate means of proof, such as a
technical dossier of the manufacturer or a test
report from a recognized body will also be
accepted.
3
Requirements for case parts (for remanufactured toner cartridges): Plastic Parts shall
Contain a maximum of 0.1% Polybrominated biphenyls (PBBs) and polybrominated diphenyl ethers (PBDEs); and
Not contain any chlorinated plastics.
All products carrying the Blue Angel, the
Umweltzeichen (Austrian ecolabel), the Eco Mark
Japan, Ecologo, Thai Green Label or the Nordic
Swan can serve as means of proof.
Any other appropriate means of proof, such as a
technical dossier of the manufacturer or a test
report from a recognized body will also be
accepted.
Bidders shall demonstrate compliance with the
criterion of “quality and guarantee” in writing
4
Ease of re-use/recycling: Original cartridges shall
Have modules that are easily separable by hand or with standard tools;
Not have non-separable joints, such as glued or welded joints between different materials (for case parts and chassis);
Not have integrated circuit chips or other devices or designs installed or implemented to prevent disassembly or re-use; and
Suppliers or manufacturers do not place or attempt to place physical, contractual, or legal restrictions upon the use of remanufactured cartridges by third parties.
Bidders must provide a written declaration of compliance with this criterion. Upon request, they may be asked to provide samples of the product and/or documentation from manufacturers of cartridges or their components.
5
Take-back scheme: Bidders shall ensure that empty and used toner cartridges are taken back for the purpose of reusing and recycling the toner cartridge.
Information on the terms of the take-back scheme as well as the return station shall be included on the product packaging. Information/instructions on appropriate handling of the toner cartridges, for example, for opening and closing, shall also be provided on the product itself.
Bidders must provide appropriate documentation of the existence of a toner cartridge take-back scheme. Bidders must demonstrate the existence of appropriate information/instructions on handling cartridges.
6
Compliance with environmental legislation:
Bidders shall not be permitted to take part in a
contract if they:
Have been found guilty of grave professional
misconduct, including non-compliance with
environmental legislation, or have not fulfilled
Bidders must provide a declaration that they
meet this criterion.

44
obligations relating to the payment of social
security obligations.
7
Production of the product according to
international labor standards: The bidder
shall provide proof from an independent third
party certification body that the manufacturer of
the product complies with international working
standards (ILO Core Convention) throughout
the whole supply chain.
The bidder is required to submit appropriate
proof that these requirements have been met.
8
Written corporate environmental policy: The
bidder will provide own written corporate
environmental policy.
The bidder is required to present the written
corporate environmental policy, consistent with
ISO 14001, or equivalent. Any other appropriate
evidence will be accepted.
Source: Sustainable Procurement Guidelines, UNEP, 2010 and Green Public Procurement, European Commission
Currently, the Mongolian toner cartridge market does not have laboratories, instruments, or
tools to certify and verify the sustainability of toner cartridges imported and locally produced.
There is also not any national ecolabel relevant to toner cartridges. Local importers and
suppliers rely on the international ecolabels and international standards on the package. Main
official distributers have attested copies of certificates such as ISO 14000 series (environment),
ISO 9000 series (quality) and technical data of cartridges provided by the manufacturer.
The majority of toner cartridges available in the Mongolian cartridge market has been certified
with ISO 14001, ISO 9001, DIN and ISO/EIC family. Since Mongolia has not adopted any
standards for toner cartridges, it is complicated to verify cartridges produced in Mongolia.
The table below summarizes the sustainability and verification criteria for the categorization of
toner cartridges in Mongolia.
Table 19 Sustainability criteria and verification for the categorization of toner cartridges sold in
the Mongolian market
Environmental sustainability criteria
Original toner cartridge
Remanufactured toner cartridge
Toner cartridges produced by domestic companies
Heavy metals and azo-colorants
-Some have ecolabels serve as a proof -Some distributers have technical data from OEMs
-Some suppliers have technical data from remanufacturers of cartridges -Some small and medium scaled suppliers have documentation for verification
No documentation for verification due to lack of laboratories and national standards
Requirements for case parts and other components (for remanufactured toner cartridges)
-Some suppliers have technical data from remanufacturers of cartridge -Some small and medium scaled suppliers have any documentation for verification
-One domestic manufacturer has a proof -Others do not have documentation for verification due to the lack of laboratories and national standards
Ease of re-use/recycling:
Yes Yes
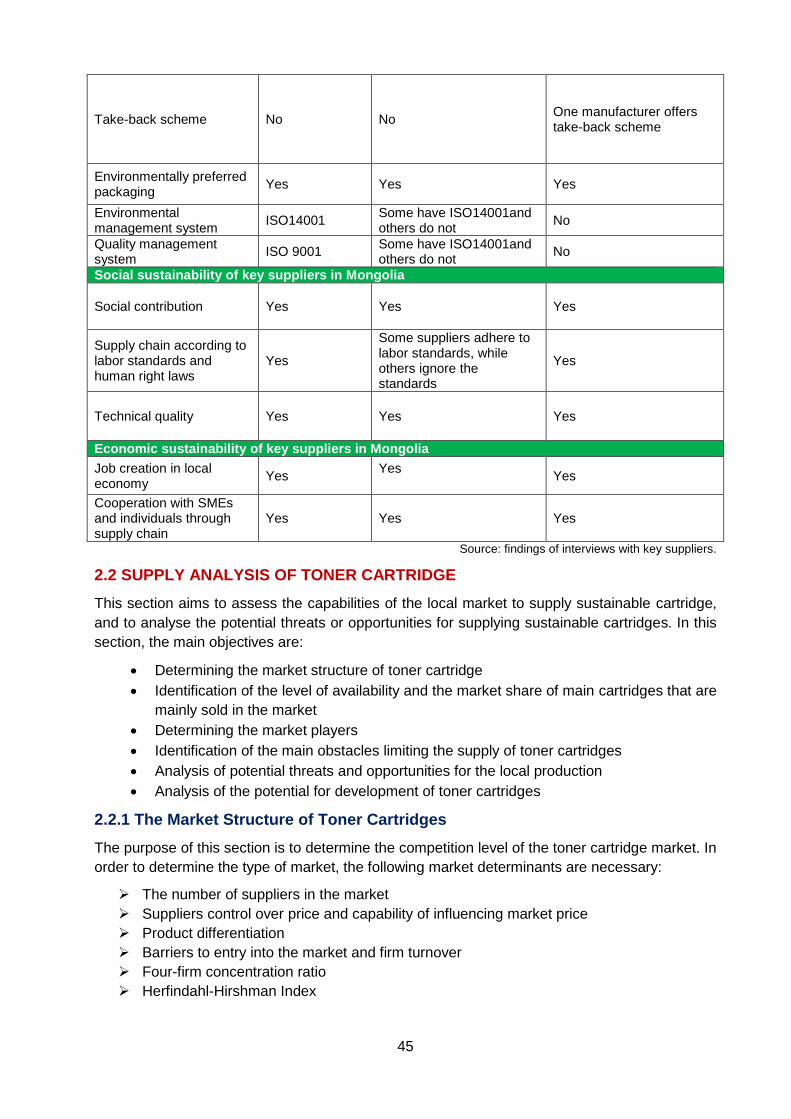
45
Take-back scheme No No One manufacturer offers take-back scheme
Environmentally preferred packaging
Yes Yes Yes
Environmental management system
ISO14001 Some have ISO14001and others do not
No
Quality management system
ISO 9001 Some have ISO14001and others do not
No
Social sustainability of key suppliers in Mongolia
Social contribution Yes
Yes Yes
Supply chain according to labor standards and human right laws
Yes
Some suppliers adhere to labor standards, while others ignore the standards
Yes
Technical quality Yes Yes Yes
Economic sustainability of key suppliers in Mongolia
Job creation in local economy
Yes Yes
Yes
Cooperation with SMEs and individuals through supply chain
Yes Yes Yes
Source: findings of interviews with key suppliers.
2.2 SUPPLY ANALYSIS OF TONER CARTRIDGE
This section aims to assess the capabilities of the local market to supply sustainable cartridge,
and to analyse the potential threats or opportunities for supplying sustainable cartridges. In this
section, the main objectives are:
Determining the market structure of toner cartridge
Identification of the level of availability and the market share of main cartridges that are
mainly sold in the market
Determining the market players
Identification of the main obstacles limiting the supply of toner cartridges
Analysis of potential threats and opportunities for the local production
Analysis of the potential for development of toner cartridges
2.2.1 The Market Structure of Toner Cartridges
The purpose of this section is to determine the competition level of the toner cartridge market. In
order to determine the type of market, the following market determinants are necessary:
The number of suppliers in the market
Suppliers control over price and capability of influencing market price
Product differentiation
Barriers to entry into the market and firm turnover
Four-firm concentration ratio
Herfindahl-Hirshman Index
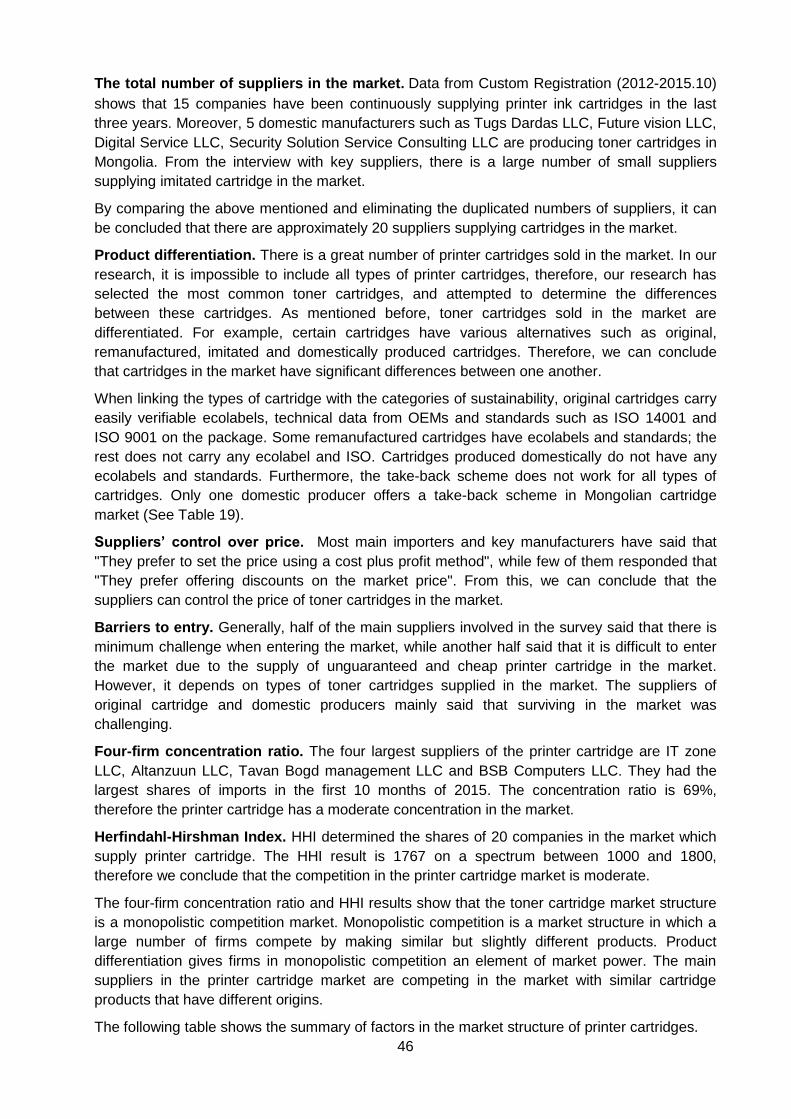
46
The total number of suppliers in the market. Data from Custom Registration (2012-2015.10)
shows that 15 companies have been continuously supplying printer ink cartridges in the last
three years. Moreover, 5 domestic manufacturers such as Tugs Dardas LLC, Future vision LLC,
Digital Service LLC, Security Solution Service Consulting LLC are producing toner cartridges in
Mongolia. From the interview with key suppliers, there is a large number of small suppliers
supplying imitated cartridge in the market.
By comparing the above mentioned and eliminating the duplicated numbers of suppliers, it can
be concluded that there are approximately 20 suppliers supplying cartridges in the market.
Product differentiation. There is a great number of printer cartridges sold in the market. In our
research, it is impossible to include all types of printer cartridges, therefore, our research has
selected the most common toner cartridges, and attempted to determine the differences
between these cartridges. As mentioned before, toner cartridges sold in the market are
differentiated. For example, certain cartridges have various alternatives such as original,
remanufactured, imitated and domestically produced cartridges. Therefore, we can conclude
that cartridges in the market have significant differences between one another.
When linking the types of cartridge with the categories of sustainability, original cartridges carry
easily verifiable ecolabels, technical data from OEMs and standards such as ISO 14001 and
ISO 9001 on the package. Some remanufactured cartridges have ecolabels and standards; the
rest does not carry any ecolabel and ISO. Cartridges produced domestically do not have any
ecolabels and standards. Furthermore, the take-back scheme does not work for all types of
cartridges. Only one domestic producer offers a take-back scheme in Mongolian cartridge
market (See Table 19).
Suppliers’ control over price. Most main importers and key manufacturers have said that
"They prefer to set the price using a cost plus profit method", while few of them responded that
"They prefer offering discounts on the market price". From this, we can conclude that the
suppliers can control the price of toner cartridges in the market.
Barriers to entry. Generally, half of the main suppliers involved in the survey said that there is
minimum challenge when entering the market, while another half said that it is difficult to enter
the market due to the supply of unguaranteed and cheap printer cartridge in the market.
However, it depends on types of toner cartridges supplied in the market. The suppliers of
original cartridge and domestic producers mainly said that surviving in the market was
challenging.
Four-firm concentration ratio. The four largest suppliers of the printer cartridge are IT zone
LLC, Altanzuun LLC, Tavan Bogd management LLC and BSB Computers LLC. They had the
largest shares of imports in the first 10 months of 2015. The concentration ratio is 69%,
therefore the printer cartridge has a moderate concentration in the market.
Herfindahl-Hirshman Index. HHI determined the shares of 20 companies in the market which
supply printer cartridge. The HHI result is 1767 on a spectrum between 1000 and 1800,
therefore we conclude that the competition in the printer cartridge market is moderate.
The four-firm concentration ratio and HHI results show that the toner cartridge market structure
is a monopolistic competition market. Monopolistic competition is a market structure in which a
large number of firms compete by making similar but slightly different products. Product
differentiation gives firms in monopolistic competition an element of market power. The main
suppliers in the printer cartridge market are competing in the market with similar cartridge
products that have different origins.
The following table shows the summary of factors in the market structure of printer cartridges.

47
Table 20 Summary of cartridge market structure Characteristics Results
Number of firms in the industry Many
Product differentiation Differentiated
Firm’s control over price Some
Barriers to entry Moderate
4 firms’ concentration ratio 69
HHI 1767
Source: Researcher’s findings
2.2.2 Sustainable Toner Cartridge Supply
The level of availability of toner cartridges
The level of availability of sustainable toner cartridges is determined by the addition of original
and remanufactured cartridges imported from abroad and cartridges produced in Mongolia.
Imported sustainable cartridges
According to Customs data of 2011-2014, 51.5-73 thousand units of toner cartridges were
imported in a year. As for the first 10 months of 2015, 61.6 thousand of toner cartridges were
imported. The historical import of toner cartridges between 2003 and the first 10 months of 2015
are illustrated in the following figure. Toner cartridges’ import was relatively low in 2003-2007,
and the yearly average import was 19,900 units in those years. The import of cartridges sharply
increased in 2008 compared to a year before, which might find its root in the election of
parliament and local governments. After the election year, the import of cartridge decreased
dramatically in 2009 and 2010 due to the economic recession. The yearly import of cartridge in
2010 decreased by 52% compared to 2008.
In 2011, the import of cartridges was 3 times higher than the previous year. In 2011-2014, the
trend for the import of cartridges was relatively stable and the yearly average import of
cartridges was 63,692 units in these years. This high level of import of cartridges may be have
been caused by the economic expansion in recent years.
Interestingly, the fluctuations in historical import of cartridges are very similar with the
fluctuations in A4 paper import.
Figure 16. The historical import of toner cartridge, 2003-2015.10, in units
Source: Customs data
When comparing the quarterly import of cartridges in the last 5 years, there is no clear tendency
of a seasonal effect in the import of cartridge. Generally, cartridge import in the first quarter
0
10000
20000
30000
40000
50000
60000
70000
80000
2002 2004 2006 2008 2010 2012 2014 2016

48
tends to be higher than in the other quarters. On average, 12872-19488 units of cartridges are
imported into the local market per quarter according to customs data. The figure below shows
quarterly import of cartridge for 2011-2015.
Figure 17. Quarterly supply of toner cartridge, 2013.Q1-2015.Q3, in units
Source: Customs data
Note: AQI-average quarterly import of toner cartridge
When comparing the monthly import of cartridge for the last 3 years, the monthly import is
almost similar throughout all the months regardless of some extreme cases. However, the
monthly average import of toner cartridges in 2013-2015 shows that the import of cartridges
tends to rise in March, June and November. The figure below illustrates the monthly import of
cartridges for 2013-2015.
Figure 18. Monthly import of cartridges, Jan 2013-Oct 2015, in units
Source: Customs data
The table below presents the descriptive statistics for the monthly import of toner cartridges for 2011-2015. The average monthly import of cartridge was 6084 and 6168 in 2014 and the first 10 months of 2015 respectively.
Table 21 Descriptive statistics of monthly import of cartridge for 2011-2015, in units
Descriptive stats 2011 2012 2013 2014 2015
Mean 5307 4291 5548 6084 6168
Median 5367 3020 4558 5006 6494
Min 1797 1762 2403 2465 2432
Max 11265 10931 10619 15483 10563
0
5000
10000
15000
20000
25000
2011 2012 2013 2014 2015
Q1
Q2
Q3
Q4
AQI: AQI:12872 AQI: AQI: 18253 AQI: 19488
0
2000
4000
6000
8000
10000
12000
14000
16000
18000
Jan Feb Mar Apr May Jun Jul Aug Sep Oct Nov Dec
2013 2014 2015 Monthly average supply

49
Total 63689 51487 66581 73012 61681 Source: Customs data
Sustainable cartridges produced in Mongolia
As mentioned before, currently, 5 manufacturers of toner cartridges are operating in Mongolia.
One of them is trying to produce sustainable cartridges. Therefore, the supply of this
manufacturer was considered within the framework of the research. The manufacturer’s
capacity of production ranges from 1000 to 3000 units per month. Depending on the purchase
orders, they have the opportunity to increase their production twice or three times by increasing
workers’ shifts. Generally, this domestic manufacturer is fully capable of producing all types of
cartridges. Average supply of this manufacturer is 2800-3000 units per month. The figure below
illustrates monthly cartridge sales of the domestic manufacturer from April 2014 to March 2015.
Figure 19 Monthly sales of the domestic cartridge manufacturer, Apr 2014-March 2015, in units
Source: Interview with domestic manufacturer
Total supply of sustainable toner cartridges in Mongolia
By integrating the import of cartridges and domestic manufacturing of cartridges, it can be
concluded that about 9000 units of sustainable toner cartridges are supplied in the market
monthly.
Figure 20. Monthly supply of cartridge in the market, in units
4 460
716
3 753
2 475 2 554
3 196 3 250
2 673
3947
3108
1649
2171
0
500
1 000
1 500
2 000
2 500
3 000
3 500
4 000
4 500
5 000
Apr May Jun Jul Aug Sep Oct Nov Dec Jan Feb Mar
2014 2015
Imported cartridge: about 6000 units per
month
Manufacured cartridge in
Mongolia: about 3000 units per
month
Total supply of cartridge per month: about
9000 units
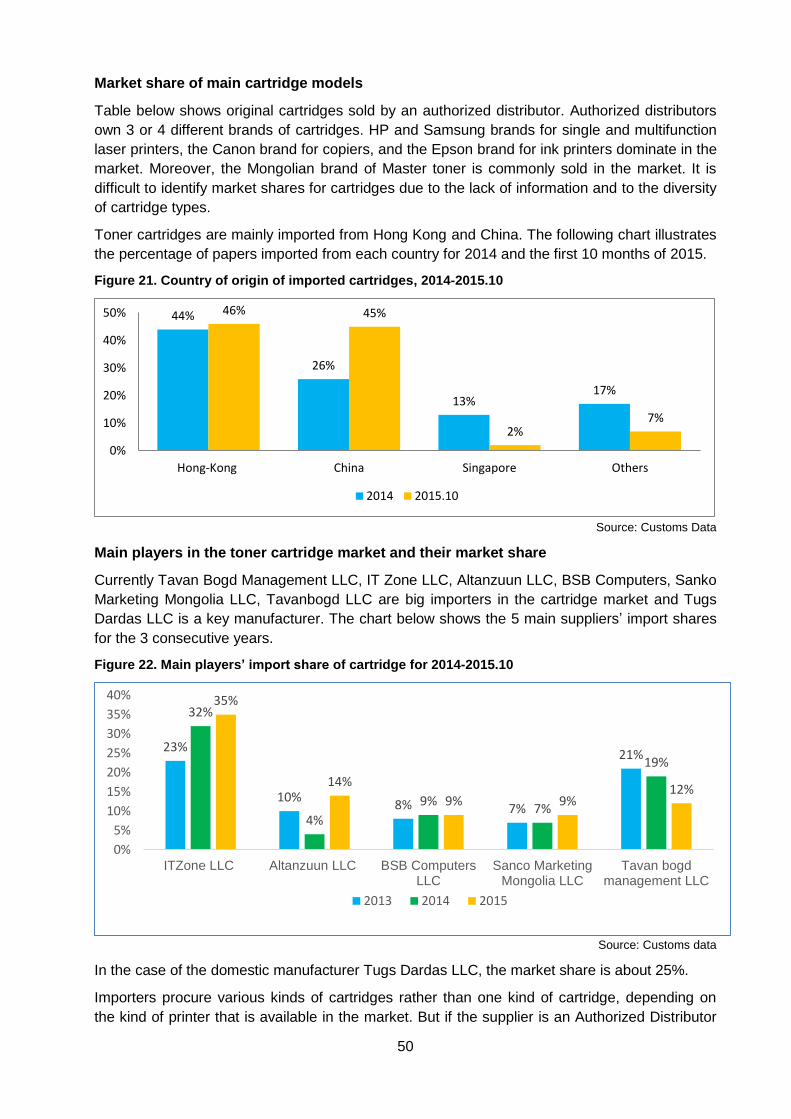
50
Market share of main cartridge models
Table below shows original cartridges sold by an authorized distributor. Authorized distributors
own 3 or 4 different brands of cartridges. HP and Samsung brands for single and multifunction
laser printers, the Canon brand for copiers, and the Epson brand for ink printers dominate in the
market. Moreover, the Mongolian brand of Master toner is commonly sold in the market. It is
difficult to identify market shares for cartridges due to the lack of information and to the diversity
of cartridge types.
Toner cartridges are mainly imported from Hong Kong and China. The following chart illustrates
the percentage of papers imported from each country for 2014 and the first 10 months of 2015.
Figure 21. Country of origin of imported cartridges, 2014-2015.10
Source: Customs Data
Main players in the toner cartridge market and their market share
Currently Tavan Bogd Management LLC, IT Zone LLC, Altanzuun LLC, BSB Computers, Sanko
Marketing Mongolia LLC, Tavanbogd LLC are big importers in the cartridge market and Tugs
Dardas LLC is a key manufacturer. The chart below shows the 5 main suppliers’ import shares
for the 3 consecutive years.
Figure 22. Main players’ import share of cartridge for 2014-2015.10
Source: Customs data
In the case of the domestic manufacturer Tugs Dardas LLC, the market share is about 25%.
Importers procure various kinds of cartridges rather than one kind of cartridge, depending on
the kind of printer that is available in the market. But if the supplier is an Authorized Distributor
44%
26%
13%17%
46% 45%
2%7%
0%
10%
20%
30%
40%
50%
Hong-Kong China Singapore Others
2014 2015.10
23%
10%8% 7%
21%
32%
4%
9%7%
19%
35%
14%
9% 9%12%
0%
5%
10%
15%
20%
25%
30%
35%
40%
ITZone LLC Altanzuun LLC BSB ComputersLLC
Sanco MarketingMongolia LLC
Tavan bogdmanagement LLC
2013 2014 2015

51
of a particular brand, they mainly sell that brand’s products. IT Zone LLC sells mostly “Canon”
and “HP” brands’ products; Summit Computer Technology LLC sells mostly “Epson” brand’s
products; and Tavan Bogd LLC sells mainly “Xerox” products in the market.
As for determining the distribution of market shares, there can be a total of 20 suppliers
supplying sustainable cartridge in the market.
Most suppliers mainly focus on the quality of cartridges instead of sustainability. Only one
manufacturer offers a take-back scheme for empty cartridges. It is expected that cartridges
which meet main criteria of sustainability such as re-used/remanufactured cartridge, recycled
content and environmentally friendly packaging will be continuously supplied in the future.
However, take-back scheme will not tend to be introduced in the near future.
Currently, no companies have their own corporate environmental policy. However, a few of
them are going to build up their own corporate environmental policy. The table below
summarizes environmental, social and economic benefits of local main suppliers.
Table 22 Corporate environmental, social and economic benefits of the main suppliers
Criteria
Main suppliers
Tavan b
ogd
mana
ge
ment
LLC
ITZ
one L
LC
Altanzuu
n
LLC
BS
B
Com
pute
rs
LLC
Sanco
Mark
eting
Mong
olia
Tugs D
ard
as
LLC
Nom
in
Tra
din
g L
LC
Corporate environmental policy
No No No No No No No
Social responsibility Yes Yes Yes Yes Yes Yes Yes
Job creation of paper sector in a country and opportunities for SMEs
Yes Yes Yes Yes Yes Yes Yes
Source: Interview survey with key importers
Identifying the main obstacles
This part of the study aims to identify the main obstacles limiting the supply of the sub-
categories of toner cartridges. First we will consider the average price range of cartridges in
Ulaanbaatar and how these prices compare with international prices and with the price for
conventional items. The price structure and profit margin will also be considered. Secondly, the
strengths/weaknesses for the provision of the sustainable A4 copy papers will be examined.
Finally, we will discuss other major obstacles.
In Ulaanbaatar city, all main importers sell cartridges through their own official stores and
branches. Moreover, small suppliers mainly sell cartridges in their commercial spaces in
computer markets. Depending on the origin and types of cartridge, the price of cartridge is very
different. The table below illustrates price difference of the cartridge.
Table 23 Price range of cartridge and price of most common used cartridge in Mongolia
Types of cartridge Original cartridge Remanufactured
cartridge Cartridge made in
Mongolia
Price range, MNT 50,000-270,000 45,000-75,000 26,000-84,000
Sample price (MNT)
HP 78A 169,900 45,000 44,000
HP 12 A 154,900 45,000 27,500

52
HP 85A 149,900 45,000 44,000
Samsung 101S 129,900 55,000 62,700
Samsung 105S 129,900 75,000 66,000
Canon NPG-28 51,000 30,000 33,000
Canon NPG-32 80,000 55,000 41,600
Canon NPG-51 86,000 35,000 55,000 Source: Interview with key suppliers, www.itzone.mn, www.bsb.mn,www.pcmall.mn
According to the above table, price of original cartridge is 2.5 times higher than remanufactured
cartridges and 2.7 times higher than domestic cartridges in average.
The table below compares the average price of sustainable remanufactured and original
cartridges with average international prices. The gap between the retail price in the domestic
market and the international retail price for remanufactured cartridges is relatively small.
Table 24 Comparison between average retail price in domestic market and international market
for commonly used cartridges in Mongolia11
Types of cartridge
Original cartridge
Remanufactured cartridge
Retail price in domestic
market (MNT)
Retail price in international
market (MNT)
Retail price in domestic market (MNT)
Retail price in international
market (MNT)
HP 78A 169,900 120,000 45,000 40,000
HP 12 A 154,900 104,000 45,000 40,000
HP 85A 149,900 140,000 45,000 44,000
Samsung 101S 129,900 110,000 55,000 50,000
Samsung 105S 129,900 110,000 75,000 68,000
Canon NPG-28 51,000 30,000 25,000
Canon NPG-32 80,000 55,000 50,000
Canon NPG-51 86,000 35,000 31,000 Source: www.aliexpress.com, www.samsung.com, www.canon.com, www.hp.com, www.amazon.com
The average price of sustainable remanufactured cartridges tends to be higher by MNT 10,000-
15,000 from the average price of conventional remanufactured cartridges. Key suppliers
responded that they generally use a cost-added pricing strategy, and that they add about 15 per
cent profit margin.
Since 2014, the price of A4 paper has been changed 3 times on average. According to main
suppliers, the exchange rate is the main factor influencing the price.
There is no single international supplier for the provision of sustainable toner cartridges. Since
all importers and suppliers are national companies, the strengths and weaknesses of national
companies over international suppliers for the provision of sustainable cartridge has not been
explored. However, there are other obstacles faced by national suppliers to supply sustainable
cartridges:
Consumers do not pay attention to the sustainability of cartridges. Many of them have never thought about the sustainability of cartridges.
Illegally imitated cartridges at a low price are imported in the Mongolian cartridge market12.
11 As most cartridges are imported from China and Hong Kong, the price in China is regarded as the price in the international market 12 However, there is no official information about market share of imitated cartridges. Three key suppliers involved in the interview said that about 20% of total cartridges that are sold in the market are imitated cartridges, sold at a cheap price. As for the public demand of imitated cartridges, it is also impossible to define the share due to the lack of information.

53
Poor consumer awareness of the difference between remanufactured and imitated cartridges.
Consumers lose their trust in remanufactured cartridges due to the lack of information about remanufactured cartridges, pre-existing prejudices about the quality of the products or because of a previous bad experience.
There is no standard for evaluating and testing cartridges made in Mongolia and cartridge refilling services.
In addition, not only small and medium suppliers but also main importers’ perception of
sustainable cartridge is very low. They mainly focus on the quality and technical aspects.
The SWOT analysis below was developed in order to identify the limiting factors for the supply
of sustainable cartridges.
Figure 23. SWOT analysis for supply of sustainable cartridges
Potential threats and opportunities for the local production
Currently, national manufacturers provide about 15% of state procurement of cartridges
according to interviews conducted with suppliers. The main threat faced by national
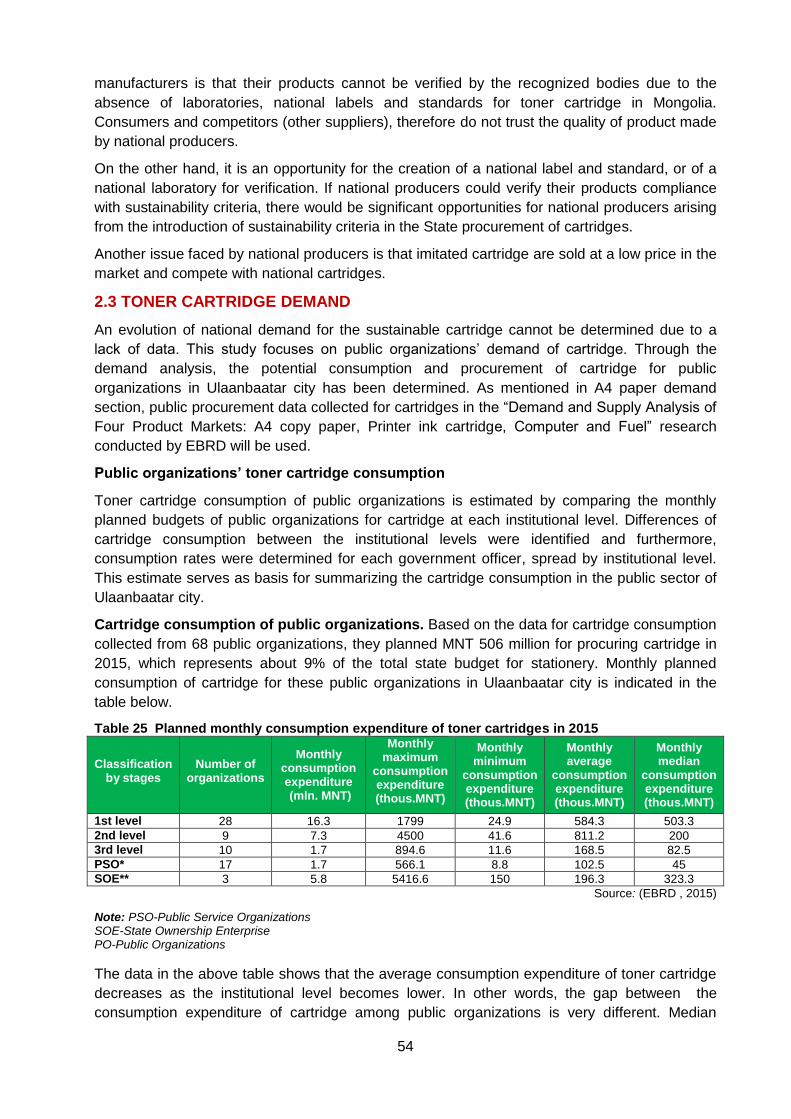
54
manufacturers is that their products cannot be verified by the recognized bodies due to the
absence of laboratories, national labels and standards for toner cartridge in Mongolia.
Consumers and competitors (other suppliers), therefore do not trust the quality of product made
by national producers.
On the other hand, it is an opportunity for the creation of a national label and standard, or of a
national laboratory for verification. If national producers could verify their products compliance
with sustainability criteria, there would be significant opportunities for national producers arising
from the introduction of sustainability criteria in the State procurement of cartridges.
Another issue faced by national producers is that imitated cartridge are sold at a low price in the
market and compete with national cartridges.
2.3 TONER CARTRIDGE DEMAND
An evolution of national demand for the sustainable cartridge cannot be determined due to a
lack of data. This study focuses on public organizations’ demand of cartridge. Through the
demand analysis, the potential consumption and procurement of cartridge for public
organizations in Ulaanbaatar city has been determined. As mentioned in A4 paper demand
section, public procurement data collected for cartridges in the “Demand and Supply Analysis of
Four Product Markets: A4 copy paper, Printer ink cartridge, Computer and Fuel” research
conducted by EBRD will be used.
Public organizations’ toner cartridge consumption
Toner cartridge consumption of public organizations is estimated by comparing the monthly
planned budgets of public organizations for cartridge at each institutional level. Differences of
cartridge consumption between the institutional levels were identified and furthermore,
consumption rates were determined for each government officer, spread by institutional level.
This estimate serves as basis for summarizing the cartridge consumption in the public sector of
Ulaanbaatar city.
Cartridge consumption of public organizations. Based on the data for cartridge consumption
collected from 68 public organizations, they planned MNT 506 million for procuring cartridge in
2015, which represents about 9% of the total state budget for stationery. Monthly planned
consumption of cartridge for these public organizations in Ulaanbaatar city is indicated in the
table below.
Table 25 Planned monthly consumption expenditure of toner cartridges in 2015
Classification by stages
Number of organizations
Monthly consumption expenditure (mln. MNT)
Monthly maximum
consumption expenditure (thous.MNT)
Monthly minimum
consumption expenditure (thous.MNT)
Monthly average
consumption expenditure (thous.MNT)
Monthly median
consumption expenditure (thous.MNT)
1st level 28 16.3 1799 24.9 584.3 503.3
2nd level 9 7.3 4500 41.6 811.2 200
3rd level 10 1.7 894.6 11.6 168.5 82.5
PSO* 17 1.7 566.1 8.8 102.5 45
SOE** 3 5.8 5416.6 150 196.3 323.3
Source: (EBRD , 2015)
Note: PSO-Public Service Organizations SOE-State Ownership Enterprise PO-Public Organizations
The data in the above table shows that the average consumption expenditure of toner cartridge
decreases as the institutional level becomes lower. In other words, the gap between the
consumption expenditure of cartridge among public organizations is very different. Median

55
monthly consumption of first-level organizations is 61% higher than the consumption amount of
second-level organizations’ consumption, 84% higher than third-level organizations and 91%
higher than that of public services.
The distribution of the monthly average consumption expenditure for toner cartridges at each
level is illustrated in the figure below. Half of public organizations in the first level and the
second level respectively planned to spend up to MNT 503,300 and MNT 200,000 for toner
cartridges per month. Moreover, half of public organizations in the third level planned to spend
up to MNT 82,500 for cartridge per month, while half of public services planned to spend up to
MNT 45,000 for cartridge per month.
Planned monthly consumption expenditure for toner cartridges was identified in organizations in
the first level. Planned monthly average consumption expenditure for toner cartridge is MNT
672,000 for ministries, while planned monthly average consumption expenditure for cartridge is
MNT 483,600 for governmental agencies.
Table 26 Planned monthly consumption expenditure for toner cartridges in 2015, by types of POs
in the first level
Classification of organizations
No.POs
Monthly consumpti
on expenditur
e (mln. MNT)
Monthly maximum expenditures (thous.
MNT)
Monthly minimum
expenditures (thous.
MNT)
Monthly average
expenditures (thous.
MNT)
Monthly median
expenditures
(thous.MNT)
Ministries 15 10 1799 304 672 586.6
Governmental agencies 13 5.8 1333 24.9 483.6 394.6
Source: (EBRD , 2015)
Consumption expenditure of toner cartridge per public officer. Cartridge consumption cost
per officer is calculated with the ratio of monthly consumption cost of the organization and
number of total workers in the organization. According to EBRD, 2015, on average, an officer of
state central administration agency consumes MNT 8,266 worth of cartridges in a month, while
each officer of municipalities is allocated MNT 7,825 worth of cartridges per month. Each officer
of local administrations uses MNT 2038 worth of cartridges per month, while each officer in
public services consumes MNT 1120 worth of cartridges a month in average.
Approximate estimation of toner cartridge consumption. Based on the above mentioned
monthly consumption need per officer, cartridge consumption of all public officers in
Ulaanbaatar can be assumed. The total number of government officials in Ulaanbaatar was
89,430 by the beginning of 2015.

56
Table 27. Approximate estimation of cartridge consumption in total public organizations in UB
Classification of public organizations
Classifications of civil service
Number of workers
Monthly consumption expenditure per worker
(MNT)
Projection of monthly
consumption expenditure (mln. MNT)
State central administrations, related agencies and other organizations*
Political position
436 8266 3.6
Public administration
4466 8266 36.9
Civil special service
29171 7825 228.3
Public service 25777 7825 201.7
Municipal administration organizations and affiliated organizations
Political position
203 8266 1.7
Public administration
3648 8266 30.1
Civil special service
1602 2038 3.3
Public service 24127 1120 27
Total 89430 532.6
Source: Statistics of Composition and Movement of Public Officers in Mongolia, 2014 and (EBRD , 2015)
Note: *- Universities, science and research institutes, sport and cultural organizations, and museums
Potential monthly consumption expenditure for cartridge is MNT 383 million for all public
organizations in Ulaanbaatar, which represents 11% of total import of toner cartridges.
Public organizations’ toner cartridge procurement
Cartridge procurement of public organizations is considered for each institutional category in
this section. Since it is also not possible to determine the total procurement quantity of toner
cartridges for all public organizations in Ulaanbaatar due to lack of data, we also use data of
EBRD, 2015. Cartridge procurement data in 2014 and first quarter of 2015 was collected from
57 organizations including all ministries and 15 governmental agencies. However, in the case of
the first quarter of 2015, not all these organizations have the information as some of them have
not procured cartridges yet. Therefore, required estimates are based mainly on 2014 data.
In 2014, these 57 organizations procured 6569 cartridges for a total cost of MNT 410 million.
The table below shows quantity, average price and total cost of cartridge procured by those 57
organizations in 2014 and in first quarter of 2015.
Table 28 Cartridge procurement of public organizations in Ulaanbaatar, 2014-2015.I
Classification of public
organizations
Number of organizations
2014 First Quarter of 2015
Procured quantity
(unit)
Average price (MNT)
Total expenditure (mln. MNT)
Procured quantity
(unit)
Average price (MNT)
Total expenditure (mln. MNT)
State central administration organizations and their affiliated organizations
25 3958 67707 254.5 779 62844 42
Municipal administration organizations and their affiliated organizations
6 1960 64502 120.6 390 53718 20.7
Local administration organizations and their affiliated organizations
6 324 52570 17.3 82 51181 4.1
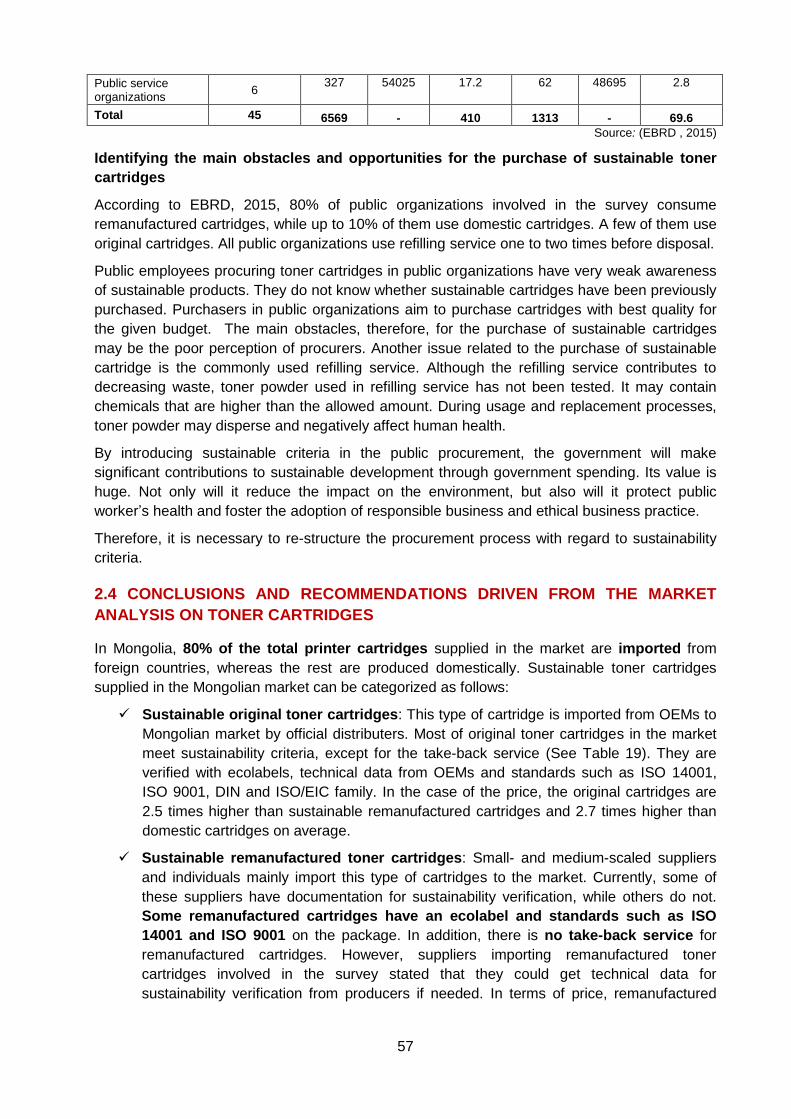
57
Public service organizations
6 327 54025 17.2 62 48695 2.8
Total 45 6569 - 410 1313 - 69.6
Source: (EBRD , 2015)
Identifying the main obstacles and opportunities for the purchase of sustainable toner
cartridges
According to EBRD, 2015, 80% of public organizations involved in the survey consume
remanufactured cartridges, while up to 10% of them use domestic cartridges. A few of them use
original cartridges. All public organizations use refilling service one to two times before disposal.
Public employees procuring toner cartridges in public organizations have very weak awareness
of sustainable products. They do not know whether sustainable cartridges have been previously
purchased. Purchasers in public organizations aim to purchase cartridges with best quality for
the given budget. The main obstacles, therefore, for the purchase of sustainable cartridges
may be the poor perception of procurers. Another issue related to the purchase of sustainable
cartridge is the commonly used refilling service. Although the refilling service contributes to
decreasing waste, toner powder used in refilling service has not been tested. It may contain
chemicals that are higher than the allowed amount. During usage and replacement processes,
toner powder may disperse and negatively affect human health.
By introducing sustainable criteria in the public procurement, the government will make
significant contributions to sustainable development through government spending. Its value is
huge. Not only will it reduce the impact on the environment, but also will it protect public
worker’s health and foster the adoption of responsible business and ethical business practice.
Therefore, it is necessary to re-structure the procurement process with regard to sustainability
criteria.
2.4 CONCLUSIONS AND RECOMMENDATIONS DRIVEN FROM THE MARKET
ANALYSIS ON TONER CARTRIDGES
In Mongolia, 80% of the total printer cartridges supplied in the market are imported from
foreign countries, whereas the rest are produced domestically. Sustainable toner cartridges
supplied in the Mongolian market can be categorized as follows:
Sustainable original toner cartridges: This type of cartridge is imported from OEMs to
Mongolian market by official distributers. Most of original toner cartridges in the market
meet sustainability criteria, except for the take-back service (See Table 19). They are
verified with ecolabels, technical data from OEMs and standards such as ISO 14001,
ISO 9001, DIN and ISO/EIC family. In the case of the price, the original cartridges are
2.5 times higher than sustainable remanufactured cartridges and 2.7 times higher than
domestic cartridges on average.
Sustainable remanufactured toner cartridges: Small- and medium-scaled suppliers
and individuals mainly import this type of cartridges to the market. Currently, some of
these suppliers have documentation for sustainability verification, while others do not.
Some remanufactured cartridges have an ecolabel and standards such as ISO
14001 and ISO 9001 on the package. In addition, there is no take-back service for
remanufactured cartridges. However, suppliers importing remanufactured toner
cartridges involved in the survey stated that they could get technical data for
sustainability verification from producers if needed. In terms of price, remanufactured
58
cartridges are relatively cheap compared to original cartridges. Remanufactured
cartridges are commonly consumed in Mongolia due to their cheaper price.
Toner cartridges produced by local and domestic companies with imported
components assembled in Mongolia: About 5 domestic manufacturers of printer
cartridges are operating in the Mongolian market. One of them tries to produce
cartridges that are consistent with environmentally sustainable criteria. The
company uses case and components imported from original manufacturers for the
production of cartridges, and employs environmentally friendly packaging practices. This
company also offers take-back service for remanufacturing. Generally, the price of toner
cartridges produced domestically is slightly cheaper than the price of remanufactured
cartridges.
Main local official distributers of toner cartridges in Mongolia have created a number of jobs and
support SMEs and individuals through their supply chains. Moreover, their efforts to provide
social services in local communities have contributed to socio-cultural and education
advancement. However, medium and small suppliers do not have any activities related to social
responsibility.
In Mongolia, some basic sub-categories of sustainable toner cartridges that are recognized
at an international level are possible to apply when practicing sustainable public procurement in
the context of Mongolia at present, namely:
- Heavy metals and azo-colorants;
- Environmentally preferred packaging;
- Quality management system (for original cartridge);
- Ease of re-use/recycling;
- Environmental management system (for original cartridge); and
- Technical quality.
Most original and some remanufactured toner cartridges imported to Mongolia already meet
some sustainability requirements (See Table 19 Sustainability criteria and verification for the
categorization of toner cartridges sold in the Mongolian market). As mentioned before, most validation
of sustainability criteria at international level can be applied to toner cartridges. However, a
certain period will be needed to append a few sustainable criteria in public procurement.
The table below proposes sustainable criteria and their verification means that can be applied in
sustainable public procurement within a certain period of time.
Table 29. Sustainability criteria and their means of verification for SPP implementation of toner
cartridges
Environmental sustainability criteria
Sustainability criteria
Verification
Original toner cartridge Remanufactured toner cartridge
Toner cartridges produced by domestic companies
Heavy metals and azo-colorants
Short term: Appropriate means of proof, such as a technical dossier of the manufacturer or a test report from a recognized body will be accepted.
Medium term: Cartridge
carrying type I ecolabel
Medium term: Appropriate means of proof, such as a technical dossier of the manufacturer or a test report from a recognized body will be accepted.
Long term: Appropriate means of proof, such as a technical dossier of the manufacturer or a test report from a recognized body will be accepted.

59
such as the Blue Angel,
the Umweltzeichen
(Austrian ecolabel), the
Eco Mark Japan, Ecologo,
Thai Green Label, and the
Nordic Swan can also
serve as means of proof.
Requirements for case parts and other components (for remanufactured toner cartridges)
Medium term: Appropriate means of proof, such as a technical dossier of the manufacturer or a test report from a recognized body will be accepted. Long term:
All products carrying the
Blue Angel, the
Umweltzeichen (Austrian
ecolabel), the Eco Mark
Japan, Ecologo, Thai
Green Label or the Nordic
Swan can also serve as
means of proof.
Medium term:
Any other appropriate
means of proof, such as a
technical dossier of the
manufacturer or a test
report from a recognized
body will be accepted.
Bidders shall demonstrate compliance with the criterion of “quality and guarantee” in writing
Ease of re-use/recycling:
Medium term: Bidders must provide a written declaration of compliance with this criterion. Upon request, they may be asked to provide samples of the product and/or documentation from manufacturers of cartridges or their components.
Medium term: Bidders must provide a written declaration of compliance with this criterion. Upon request, they may be asked to provide samples of the product and/or documentation from manufacturers of cartridges or their components.
Take-back scheme
Medium term: Bidders must provide appropriate documentation of the existence of a toner cartridge take-back scheme. Bidders must demonstrate the existence of appropriate information/instructions on handling cartridges.
Medium term: Bidders must provide appropriate documentation of the existence of a toner cartridge take-back scheme. Bidders must demonstrate the existence of appropriate information/instructions on handling cartridges.
Medium term: Bidders must provide appropriate documentation of the existence of a toner cartridge take-back scheme. Bidders must demonstrate the existence of appropriate information/instructions on handling cartridges.
Environmentally preferred packaging
Short term: Bidders must provide appropriate documentation
Short term: Bidders must provide appropriate documentation
Short term: Bidders must provide appropriate documentation
Environmental management system
Short term: ISO14001
Medium term: ISO14001
Medium term: Written corporate environmental policy, consistent with ISO 14001, or equivalent. Any other appropriate evidence
Quality management system
Short term: ISO9001
Medium term: ISO9001
-

60
Social sustainability of key suppliers in Mongolia
Social contribution13
Short term: Appropriate proof that the requirement has been met.
Long term: Appropriate proof that the requirement has been met.
Long term: Appropriate proof that the requirement has been met.
Supply chain according to labor standards and human right laws
Short term: Appropriate proof that the requirement has been met.
Long term: Appropriate proof that the requirement has been met.
Long term: Appropriate proof that the requirement has been met.
Technical quality
Short term: A sample of toner must be provided to the procurer in order to test quality
Short term: A sample of toner must be provided to the procurer in order to test quality
Short term: A sample of toner must be provided to the procurer in order to test quality
Economic sustainability of key suppliers in Mongolia
Job creation in the local economy
Short term: Appropriate proof that the requirement has been met.
Medium term: Appropriate proof that the requirement has been met.
Medium term: Appropriate proof that the requirement has been met.
Cooperation with SMEs and individuals through the supply chain
Short term: Appropriate proof that the requirement has been met.
Medium term: Appropriate proof that the requirement has been met.
Medium term: Appropriate proof that the requirement has been met.
Note: Short term – criteria can be employed in public procurement in the short term; medium term – the
criteria can be employed in public procurement in the medium term; and long term – the criteria can be
employed in public procurement in the long term.
Based on lessons learned from research, the following actions are recommended to launch
SPP for toner cartridges:
Build knowledge and capacity regarding SPP amongst procurement specialists in
public organizations.
Currently, original toner cartridges meet almost all sustainability criteria. However, the
high price of the original toner cartridges is the main obstacle to the introduction of
sustainable criteria in public procurement. Therefore, sustainability criteria applying to
toner cartridges need to be introduced in public procurement in stages, with basic
criteria on environmental sustainability being applied in public procurement in the short
term, and more advanced criteria being applied in due course.
Criteria related to social and economic sustainability should be introduced in public
procurement in the medium term. The main reason for this is that only few companies,
which hold the majority of the market share, currently meet all requirements of SPP. By
introducing sustainability criteria into public procurement stage-by-stage, small- and
medium-scaled suppliers will be able to compete in this environment.
SPP should first be introduced in larger public organizations that have high
consumption of toner cartridges in the central regions of the country. Following this, it
should be rolled out more widely.
Build knowledge and capacity regarding SPP amongst small- and medium-sized
suppliers of remanufactured cartridges, in order to increase the competiveness of such
suppliers.
13 It can include all activities related to the local sustainability such as building and maintaining healthy, strong communities, supporting social inclusion and enhancing the well-being of local residents by generating local employment. Currently, the main local suppliers in Mongolia have created a number of jobs, and support SMEs and individuals through their supply chains. Moreover, some of them spearhead funding programs to give assistance for the education of Mongolian children.

61
Build domestic laboratories and standards for toner cartridges in order to encourage
the development of national manufacturers and their ability to compete on a
sustainability basis.

62
III. Market Analysis on
Lightweight Concrete
Blocks
Reduce. Re-use. Recycle.

63
3.1 SUB-CATEGORIES OF CONCRETE BLOCKS, PRELIMINARY COMPENDIUM
OF SUSTAINABILITY CRITERIA AND MEANS OF VERIFICATION
This section of the report covers the identification of international and national ecolabelling
schemes relevant to sub-categories of concrete blocks.
3.1.1 Identification of Sub-Categories of Sustainable Products
International sub-categories of Concrete blocks
Evaluation criteria for sustainable construction materials are verified by independent
ecolabelling and standard organizations based on third-party monitoring systems, driven by
pure business relations independently from the interests of enterprises and professional
associations. Hence, in this part, we will take into account internationally recognized
ecolabelling schemes.
Environmental sustainability: The production of construction materials seriously takes into
account environmental sustainability. As such, the priorities for environmental sustainability are:
- appropriate natural resource use,
- waste management,
- and energy and water saving issues.
Forest protection technology: Lightweight concrete blocks replace wooden materials,
and last longer, which helps to preserve this natural resource.
Greenhouse gas reduction: Fly ash based lightweight concrete blocks reduce air
and soil pollution, and save the use of non-renewable natural resources such as
sand by 50-100%, and water by 15-25%. Moreover, buildings constructed with
lightweight concrete blocks have a good thermal insulation that additionally allows to
save energy during the operational use of the building, which in turn helps to reduce the
greenhouse gas emission.
Water consumption: The production of sand-based lightweight concrete blocks requires
high water consumption, while the production of fly ash based lightweight concrete
blocks saves 25% of water, as fly ash from thermal power plants already contains 40%
of water. It is also required to use grey-water or recycled water during the production of
fly-ash lightweight concrete blocks.
Efficient energy use: The production of fly-ash-based lightweight concrete blocks uses a
small amount of energy, and saves the cost required for sand milling and, compared
to wooden materials, reduces of up to one half the energy consumption during the
operational use of the building.
Air and soil pollution reduction: The re-use of fly ash in the production of lightweight
concrete block eliminates the threat of air and soil pollution that might result from
fly ash. It also allows reusing fly ash from thermal power plants.
Waste management: Lightweight concrete block production and building may use a
zero-waste technology.
Allowed level of poisonous chemical substances: Radiation is an important issue in the
production of fly-ash based lightweight concrete blocks at international level. For
Mongolia, the allowed level for all construction materials is ≤370 Bq/kg.
Material durability:

64
o Long lasting: Lifecycle of buildings constructed by using lightweight concrete
blocks is long, thus the environmental impact is lower.
o Good thermal insulation: The thermal insulation of lightweight concrete blocks
is good, which is very cost effective for operational energy use.
o Noise insulation: By international standards, the average allowed noise level is
measured in terms of duration. Lightweight concrete blocks are also considered
as a good noise insulation material.
Environment protection policy: Producers of lightweight concrete blocks are required to
develop and implement environmental policies.
Social sustainability: Social sustainability in the construction material production is rather
considered at the operational usage stage. For example, it takes into account the impact on
consumers’ health, and the support of local development, such as:
Local sustainable development support: It is important that the producer collects raw
materials from local areas and implements social responsibility policies benefiting the
local population.
Safety of workers: It is required to reduce the workplace-related diseases and to follow
Safety and Health Standards.
Support the improvement of consumer living standards: Fire and earthquake
resistance: Considers the potential damage a material may have on the human body
during the material’s intended use.
Economic sustainability: The economic sustainability includes solutions, initiatives and
benefits to reduce the construction material costs at the production, building and usage stages.
Consider solutions to decrease costs at all levels of construction: Savings on building
lifecycle, design, building repair and maintenance related costs are considered for
lightweight concrete blocks.
Benefits for the local economy: The benefits for the local economy may include the
increase in the number of workplaces, tax payments and the support of local SMEs.
Currently, no single enterprise producing lightweight concrete blocks in Mongolia has
received an internationally recognized ecolabel. Information on ecolabels and standards for
sustainable building and sustainable construction materials can be found in Appendix 1. The
following table shows international ecolabel criteria (The European Ecolabel, The Nordic Swan,
Scandinavia, The Blue Angel, Umweltzeichen BREEAM – Building research establishment’s
environmental assessment method LEED and LBC label) that can be used for the sustainable
procurement in Mongolia.
Table 30. International sustainability criteria for light concrete blocks
International categories Public procurement
categories
Environmental sustainability
Water saving Water consumption saving - Reduction of water
consumption - Energy savings - Recycling of material - Use of recycled material - Use of quickly renewable
natural resources - Material with low
greenhouse gas emission
Creation of a water-saving environment
Energy saving Optimal energy consumption
Usage of renewable energy
Material and resource
Recycling of materials
Construction waste management
Use of recycled materials
Use of quickly renewable natural resources

65
Material quality
Material with low greenhouse gas emission
- Monitoring of internal chemical and pollution sources Monitoring of internal chemical and
pollution sources
Social sustainability
Support of local sustainable development
Implementation of social responsibility policies
- Presence of social
responsibility policy - Presence of Safety and
Health Standards policy - Support to improve
consumer life quality
Implementation of policy to reduce workplace-related disease and to follow Safety and Health Standards.
Support to improve consumer life quality
Economic sustainability
Benefits to local economy
Increase in the number of opportunities in the workplace
- Increase in the number of
opportunities in the workplace
- Taxes to be paid in order to support the local economy
- Support of local SMEs - Considerations for
solutions to decrease the costs of construction materials
Taxes to be paid in order to support the local economy
Support of local SMEs
Consider solutions to decrease the costs of construction materials
Long durability of material
Labor facilitating solutions in material design
Post-construction maintenance
Source: Promoting sustainable construction in the EU, Green labels, Certification Systems and Green Procurement, Dr. Ogenis Brilhante and Julia M.Skinner MSc, 2015
Local sub-categories of Concrete blocks
Currently, there are no criteria to determine the sustainability of products in Mongolia. Instead,
there are labels, standards and laws to ensure the safety and quality of raw materials for
construction.
The Mongolian National Chamber of Commerce and Industry, within its activity to support green
economy and business, distributes the “Organic Product” label to environmentally friendly
products and services.
This label is distributed to various food products as well as to products originating from
environmentally friendly agriculture, and which have been processed with technology that is
harmless to human health and livelihoods, vegetation and animals. Hence, it is inappropriate to
consider this label as a sustainable product criterion. Currently there are no other labels and
certifications which may help to verify production criteria, and most producers are only
following national standards in their activity.
Standards for lightweight concrete blocks cover allowed levels for each raw material, nature of
the product, nomenclature, marking, reception, and storage descriptions; however, there are no
relevant articles in related Mongolian standards that can meet criteria for the international
ecolabelling of sustainable products. The main standard in Mongolia for the lightweight
concrete block production industry is “Thin concrete. Composition and durability–Technical
requirements – MNS 0831:2001”.
Table 31. Mongolian standards for materials and lightweight concrete blocks
# Materials MNS standards
Material standards
1 Lime powder MNS 347:2002,
2 Cement MNS 3091:2008
3 Gypsum -
4 Aluminum powder -

66
5 Water MNS 3821:85
6 Sand MNS 392:98
7 Substitution materials: Fly ash and slag (Either fly ash and slag are
substituted, or a percentage of the cement or sand) MNS 3925: 2015
Standards of lightweight concrete block specification
1 Characteristics of the design and product: Cellular concrete. Test
methods MNS 1527:86
2 Standards for labelling and marking of product MNS222.2
3 Standards for acceptance testing and criteria for ready, mixed concrete MNS 2228.2
4 Cellular concrete. Design and product- Specification МNS 0831:2001 Source: www.e-standart.mn
Compared to regular insulation materials, lightweight concrete blocks show higher energy
savings are non-flammable, durable, non-toxic, easy to build and maintain, and have better
thermal and noise insulating qualities. They also can be used for any layout. The quality criteria
for lightweight concrete blocks are described in MNS 0831:2001 standard as follows.
Table 32. Specification for lightweight concrete blocks
# Criteria Measurement Value
1 Compressive strength MPa ≥1,5
2 Density Kg/м3 300-1000
3 Fire resistance rating Class А
4 Radionuclide concentration Ас [Bq/kg] ≤370 Source: МNS 0831:2001 Cellular concrete. Design and product- Specification
Although Mongolia has no official description and criteria for sustainable products, the initial
stage has already started with recently approved sustainable and green development
programs already underway, and which includes the following statements:
By 2011, basic conditions for green economy in Mongolia will be created (Article 2.1),
Third objective of the strategy – to gradually reduce greenhouse gas emission and to
create a basis to shift to low carbon economy (Article 3.3).
The policy emphasizes the urgent need to conduct trainings to improve the knowledge of
participants, to conduct promotional activities, to introduce energy-saving technologies in all
domestic production and to define industrial waste management.
3.1.2. Preliminary Compendium of Sustainability Criteria and Means of
Verification
There are many ecolabels and standards related to sustainable construction materials.
Sustainable construction material eco labels are extensively used in the EU and in the USA.
For, example, the leading labels for sustainable construction materials in the EU are the
European Ecolabel, the Nordic Swan, Scandinavia, the Blue Angel and Umweltzeichen. In
addition, the main labels for sustainable construction are the BREEAM, LEED, LBC, and
National Green Building (See Annex 1).
These labels usually reflect water saving, energy saving, sustainable use of natural resources,
waste management and reduction of greenhouse gas emission. For example, the main criteria
of a leading sustainable construction label – LEED, are sustainable field, water saving, energy
and air impact, material and resources, internal environment quality, planning renewal and
regional advantages.
Table 33. Categories and main verifications
№ Categories Main verifications
1 Energy saving: - Optimal energy
Verifications are granted based on consumed energy measurement and energy source. It also has to comply with
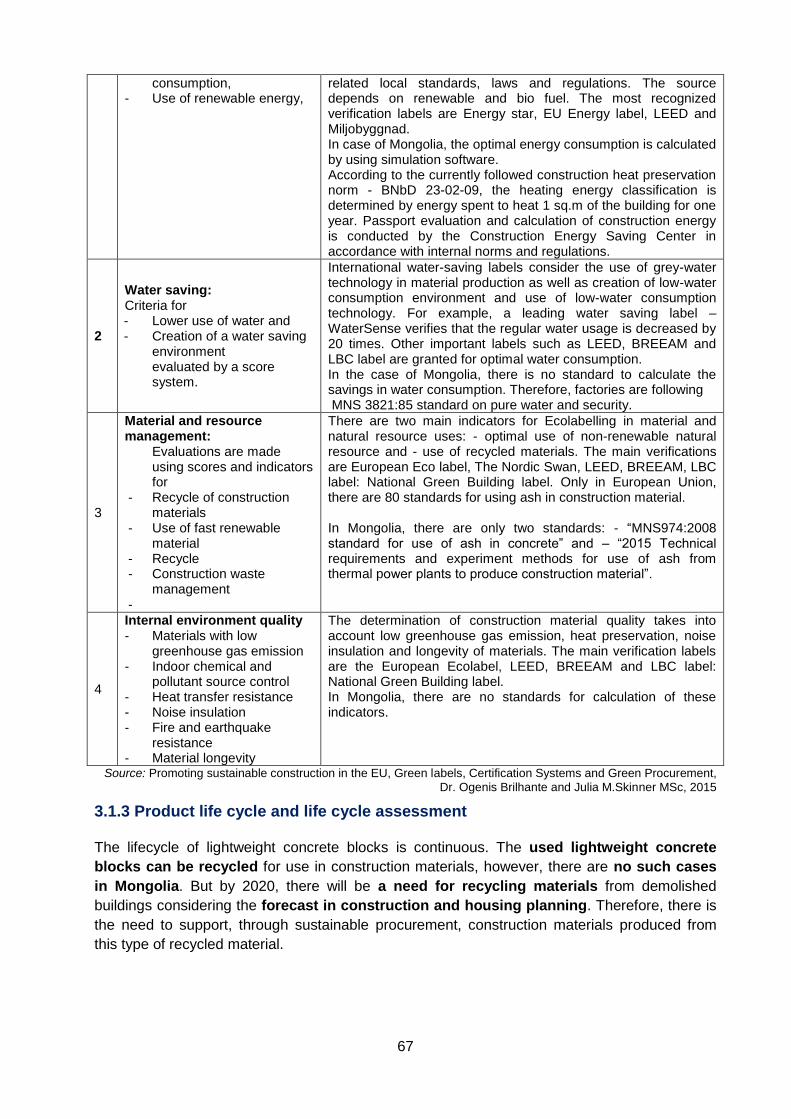
67
consumption, - Use of renewable energy,
related local standards, laws and regulations. The source depends on renewable and bio fuel. The most recognized verification labels are Energy star, EU Energy label, LEED and Miljobyggnad. In case of Mongolia, the optimal energy consumption is calculated by using simulation software. According to the currently followed construction heat preservation norm - BNbD 23-02-09, the heating energy classification is determined by energy spent to heat 1 sq.m of the building for one year. Passport evaluation and calculation of construction energy is conducted by the Construction Energy Saving Center in accordance with internal norms and regulations.
2
Water saving: Criteria for - Lower use of water and - Creation of a water saving
environment evaluated by a score system.
International water-saving labels consider the use of grey-water technology in material production as well as creation of low-water consumption environment and use of low-water consumption technology. For example, a leading water saving label – WaterSense verifies that the regular water usage is decreased by 20 times. Other important labels such as LEED, BREEAM and LBC label are granted for optimal water consumption. In the case of Mongolia, there is no standard to calculate the savings in water consumption. Therefore, factories are following MNS 3821:85 standard on pure water and security.
3
Material and resource management:
Evaluations are made using scores and indicators for
- Recycle of construction materials
- Use of fast renewable material
- Recycle - Construction waste
management -
There are two main indicators for Ecolabelling in material and natural resource uses: - optimal use of non-renewable natural resource and - use of recycled materials. The main verifications are European Eco label, The Nordic Swan, LEED, BREEAM, LBC label: National Green Building label. Only in European Union, there are 80 standards for using ash in construction material. In Mongolia, there are only two standards: - “MNS974:2008 standard for use of ash in concrete” and – “2015 Technical requirements and experiment methods for use of ash from thermal power plants to produce construction material”.
4
Internal environment quality - Materials with low
greenhouse gas emission - Indoor chemical and
pollutant source control - Heat transfer resistance - Noise insulation - Fire and earthquake
resistance - Material longevity
The determination of construction material quality takes into account low greenhouse gas emission, heat preservation, noise insulation and longevity of materials. The main verification labels are the European Ecolabel, LEED, BREEAM and LBC label: National Green Building label. In Mongolia, there are no standards for calculation of these indicators.
Source: Promoting sustainable construction in the EU, Green labels, Certification Systems and Green Procurement,
Dr. Ogenis Brilhante and Julia M.Skinner MSc, 2015
3.1.3 Product life cycle and life cycle assessment
The lifecycle of lightweight concrete blocks is continuous. The used lightweight concrete
blocks can be recycled for use in construction materials, however, there are no such cases
in Mongolia. But by 2020, there will be a need for recycling materials from demolished
buildings considering the forecast in construction and housing planning. Therefore, there is
the need to support, through sustainable procurement, construction materials produced from
this type of recycled material.

68
Figure 24. Life cycle of a lightweight concrete block
The use of ash in the production of lightweight construction blocks allows for the replacement
of depletable natural resources such as sand and water by up to 100% and 40% respectively.
This will not only decrease the environmental impact on the climate, water and soil
pollution caused by ash waste from thermal power plants, but will also create advantages such
as improvements in heat preservation and an easier use of this material in construction.
The use of ash in lightweight construction blocks will help to meet previously-mentioned
criteria for “energy and water saving, presence of material and resources management and
meeting internal environment quality”.
In order to demonstrate sustainable product quality, a comparison of lifecycles of lightweight
concrete blocks with and without fly ash is developed in the table below. It demonstrates
potential environmental and economic impacts for each life cycle stage of concrete blocks.

Table 34. Environmental and economic impacts: Lightweight concrete blocks vs fly-ash-based lightweight concrete blocks
LIGHTWEIGHT CONCRETE BLOCK FLY-ASH-BASED LIGHTWEIGHT CONCRETE BLOCKS
Life cycle stages Impacts Life cycle stages Impacts
Raw materials acquisition
Sand
Environmental impact:
It absorbs polluting elements in the long run
Fly ash: Fly ash from thermal power plants are used and it replaces sand by 100%
Environmental impact:
Reduction of
environmental impact
caused by waste ash
from thermal power
plants.
Cement: 70% of supply is from domestic market and the rest is imported.
Cement: Cement can be replaced by ash by up to 40%.
Lime powder: It is completely supplied from domestic market.
Lime powder: 100% supplied by domestic suppliers.
Gypsum and aluminium powder: It is completely supplied by imports
Gypsum and aluminum powder:
100% imported
Water: Use well water and river water Water: Use well water.
Manufacturing (recycle)
Pre-production processes are “transporting and storing”.
Environmental impact:
Use natural
resources such as
sand or gravel.
Economic impact: The high energy
required to grind sand.
Pre-production stage includes raw
material transportation and storage
process.
Economic benefits:
Replacement of sand
and cement will reduce
the raw material cost.
Saves energy costs
associated with sand
milling and processing,
thus the production
cost reduction.
Basic steps in manufacturing processes are “dosing, mixing and pouring into mold”.
Production goes through 3 stages such as “mixing, battering and molding”
Use/Maintenance
Lightweight concrete blocks used for both internal and external construction especially, suitable for void filling.
Economic impact: Concrete blocks
without fly ash are comparatively heavy. Thus, it is required to spend more
Can be used for any type of construction and building and is usually used for shelling
Economic benefits:
Easier to use in
production.
Improved heat
preservation, lower

70
resources. energy cost.
Recycle/Waste management
Recycling: Recycling and re-using as a building material
Re-use: With the end of the building lifecycle, the material can be used again in production mixture
Social benefits:
Improved waste
management
Opportunity to support
sustainable procurement.

3.2 SUPPLY ANALYSIS OF LIGHTWEIGHT CONCRETE BLOCKS
3.2.1 The Market Structure
The market for lightweight concrete blocks is characterized as highly competitive, with many
similarly priced identical products and a wide variety of replaceable products. The replaceable
products include polysterol concrete, aerated concrete, etc.
The lightweight concrete block production market is close to a perfect competition. About 60%
of domestic use (600000 m3) used to be supplied from China. The launch of production
factories by MAC LLC and Dornyn Tsas LLC in 2015, created an opportunity to completely meet
the demand of the domestic market. The lightweight concrete block market is 100% dependent
on the construction sector’s growth and decline.
Table 35. Market structure of lightweight concrete blocks
Characteristics Results Market structure
Number of firms in the industry Many
Competitive market
Product differentiation Identical
Firms’ control over price Moderate
Barriers to entry Few
4 firms’ concentration ratio 47%
HHI 844
Domestic producers of lightweight concrete blocks produce their products using European
technology on Chinese equipment.
Currently, most enterprises producing lightweight concrete blocks are SMEs. However, the
sales and competitiveness of SMEs are expected to decrease in the near future as larger
enterprises are entering the market. The Mongolian government has invested this industry in
order to establish national manufacturers that produce concrete blocks and cement.
As for fly-ash-based lightweight concrete block producers, there is a limited supply to the
market, and lower market recognition that results in weaker competition. According to the
results of 2015 “Market research for ash based building material” conducted by MIRIM
Consultant LLC, producers were avoiding to inform consumers that their products contain fly
ash. This was due to lower consumer knowledge on fly-ash-based products and eco products in
general.
Table 36. Market structure of fly-ash-based lightweight concrete blocks
Characteristics Results Market structure
Number of firms in the industry Few (0-30)
Oligopoly market with few
competitors in the industry and
highly concentrated.
Product differentiation Identical
Firm’s control over price Moderate
Barriers to entry Few
4 firms’ concentration ratio 13%
Due to the lack of statistical data on the producers of fly ash lightweight concrete blocks, the
market competition was determined by using a test model.
In order to determine the market share and competition, investment as well as technical and
workforce costs were required to build a new lightweight concrete block factory and were used
as a basis.
Investment: In order to build a factory with an annual output of 400000 m3 of lightweight
concrete blocks, about MNT 650 million will be required for the equipment and about MNT 1.3
billion will be required for the factory building. An additional MNT 150-200 million of financing is
required to prepare main raw material. The total required investment is about MNT 1.95 billion.

72
Technology: The above-mentioned investment is necessary since the autoclave lightweight
block production requires digesting technology. In the case of fly ash use, special trucks to
transport dry ash and storage silos are additionally required.
Workforce: For a factory with an annual output of 400000 m3 of lightweight concrete blocks,
25-30 persons are required as workforce. Of these persons, 10 workers such as general
technologists, production technologists, and electricity engineers, and electricians, mechanical
engineers for equipment, technicians and assistants are needed to undergo special vocational
training.
The competitive nature of the lightweight concrete block market is comparably open, and the
start-up amount of MNT 2 billion is one of the proofs.
3.2.2 Determination of lightweight concrete blocks and market prospects
The Sustainable Development Report by the World Business Board says that concrete is the
second-most used substance in the world after water. The world produces an average 2.35
billion tons of concrete a year. By 2030, this number may increase to 5 billion tons due to a wide
use of this type of material in China and India14. Mongolia annually consumes about 1358 000
m3 of lightweight concrete blocks, and the launch of production factories by MAC LLC and
Dornyn Tsas LLC created an opportunity to completely supply the domestic market with national
production.
As for the production of cement – the main raw material for lightweight concrete blocks – Khutul
“Tsement-Shokhoi” state-owned company increased its annual capacity by 1 million ton and
Monpolimet LLC and MAC LLC have launched their cement production factories in 2015 each
with an annual production output of 1 million tons. This will not only allow to meet the domestic
demand but will also give an opportunity for export. Currently, 30% of the cement used in
the production of lightweight concrete blocks is imported. If, in 2014, the domestic consumption
of cement was 1.2 million tons, the full scale operation of the above-mentioned factories will
allow to produce 1.7 million tons of cement domestically by 2017. The 100% domestic supply of
raw materials used for lightweight concrete blocks will allow to fully control the product quality.
Table 37. Materials and components of lightweight concrete blocks
# Materials Measurement
Component Material manufacturer
1 m3 concrete block (kg)
1 m3 concrete (percent)
Domestic Import
1 Lime powder kg 6201) 19.85 100 % -
2 Cement kg 100 20 70 % 30 %
3 Aluminum powder
kg 1.2 0.15 - 100 %
4 Water liter 2) - 100 % -
5 Sand kg 100 60 100 % -
6 Substitution materials: Fly ash, slag
kg 13093)
Fly ash and slag can be
substituted, or a percentage of the cement
and sand
100 % -
Source: Green Building/Construction Practices, Training handbook
The lightweight concrete blocks contain 60% sand, 20% cement, 15% lime and 5% of other
additives (lime, aluminum, water etc.). The use of fly ash will allow eliminating the usage of sand
by 50-100% and of cement by 25-30%.
14 http://www.inhabitat.com/

73
3.2.3 The level of availability and market share of selected products
First produced in Mongolia in 1967, lightweight concrete blocks are now produced by 33
autoclave factories, out of which 30 are located in Ulaanbaatar and three are located in the
countryside. The combined production output of these factories is 1358 000 m3 which is enough
to completely cover the demand of capital Ulaanbaatar city and aimags in the central region.
Table 38. Number of lightweight concrete block suppliers in the industry
# Year Number of building companies Number of manufacturers of lightweight concrete blocks
1 2012 5430 28
2 2013 6529 30
3 2014 8940 30
4 2015 10111 32 Source: www.1212.mn
Five enterprises such as MAC LLC, Dornyn Tsas LLC, Arga baril LLC, Khaan almaz LLC and
Cottage LLC can currently supply about half of the annual domestic needs. The average annual
production output of other enterprises reaches 40000 -50000 m3.
Table 39. Role players in lightweight concrete block industry
# Company name Price (m3)
Capacity (annual)
1 MAC LLC 145000 270000 m3
2 Dorniin tsas LLC 130000 200000 m3
3 Arga baril LLC 100000 125000 m3
4 Mongol tashuur construction LLC 110000 40000 m3
5 Manufacurer of lightweight concrete block in Uliastai LLC
110000 40000 m3
6 Erdes concrete LLC 110000 40000 m3
7 Sutain ach LLC 110000 40000 m3
8 Silicat LLC 120000 50000 m3
9 Chilagu LLC 120000 45000 m3
10 General etalon LLC 110000 50000 m3
11 Undram gan LLC 135000 40000 m3
12 Jawkhlant LLC 115000 52000 m3
13 Dulguun bars LLC 115000 40000 m3
14 Altai gatsuurt LLC 110000 40000 m3
15 Cottage building LLC 100000 60000 m3
16 Khaan almaz LLC 100000 72000 m3
Total 1204000
Source: Building Material Manufacturing’s Association
Despite a high interest in using fly ash in the production of lightweight concrete blocks, the
supply of fly ash from thermal power plants is insufficient. Although the amount of total dry ash
produced by thermal power plant reaches about 289.9 thousand tons per year, only 30,000
tons out of the total fly ash produced (about 10% of the total ash) can be used in the production
of lightweight concrete blocks . The remained fly ash is currently not used as fly ash from
thermal power plants cannot satisfy technical requirements in cold season.
In 2015, 5% of thermal power plant ash was used. Lightweight concrete block production used
only 3% of fly ash, which equals to 50000m3 of the totally produced 1358000m3 of lightweight
concrete blocks. In 2015, Thermal power plant-4 had sales contracts with 15 enterprises: 10
cement factories and 5 lightweight concrete block factories.

74
Table 40. Fly ash suppliers /Thermal power plants-TPP/
№ Name Location Capacity
MW
Annual consumption
of coal, /thous.ton/
Annual production of fly ash, and types (annual)
Dry fly ash /thous.ton/
Wet or dry slag
/thous.ton/
А. Thermal power plants /In operation/
1 TPP-2 Ulaanbaatar 36 191,5 - 19,1
2 TPP -3 Ulaanbaatar 198 1067,5 - 106,7
3 TPP -4 Ulaanbaatar 580 2899,7 289,9 116,0
4 TPP in Darkhan Darkhan 48 351,9 - 35,1
5 TPP in Erdenet Erdenet 36 222,4 - 22,4
6 TPP in Dornod Choibalsan 18 39,4 - 3,9
7 TPP in Ukhaa khudag
Umnogovi Tsogttsetsii
18 35 4,8
8 TPP in Umnugovi Dalanzadgad 9 270,6 - 27
9 TPP in Amgalan Ulaanbaatar 300 218,2 30
Total 289,9 365,0
B. Thermal power plants, /plans to build/
1 TPP-5 Ulaanbaatar 820 3620,0 353 145
2 TPP in Shiwee ovoo
Govisumber Choir
750 4000,0 390 160,0
3 TPP in Chandgan tal
Khentii Chingis 650 3450,0 336 138
Total 1079 283
Grand total 1369 648 Source: Building Material Manufacturing’s Association
In 2015, fly-ash-based lightweight concrete blocks represented 3.6% of the domestic market for
concrete blocks. By 2020, this number may reach 10% if the ash supply originating from thermal
power plants is intensified, and if the current growth trend is preserved. If this product is
supported through SPP, there will be no barriers for producers to shift to this production
technology.
3.2.4 Main Players in the market and their market share
The lightweight concrete block industry is an SME-type industry, thus detailed statistical data on
products and production is unavailable. Therefore, the main players for 2015 are determined
based on their production capacities. Main players hold 53.4% of the market share and these
players are branches of larger enterprises. For example, MAC euro block factory belongs to
Mongolyn Alt Corporation, Arga Baril LLC belongs to Nuudelchin Group, Khaan Almaz LLC
belongs to Shine Mongolyn Khaad Group, Dornyn Tsas LLC belongs to joint Mongolian-
Chinese GS Dornyn Hogjil LLC. According to forecast, these entities are to continue with their
leading positions for a long time.
Figure 25. Role suppliers of lightweight concrete blocks (percent)
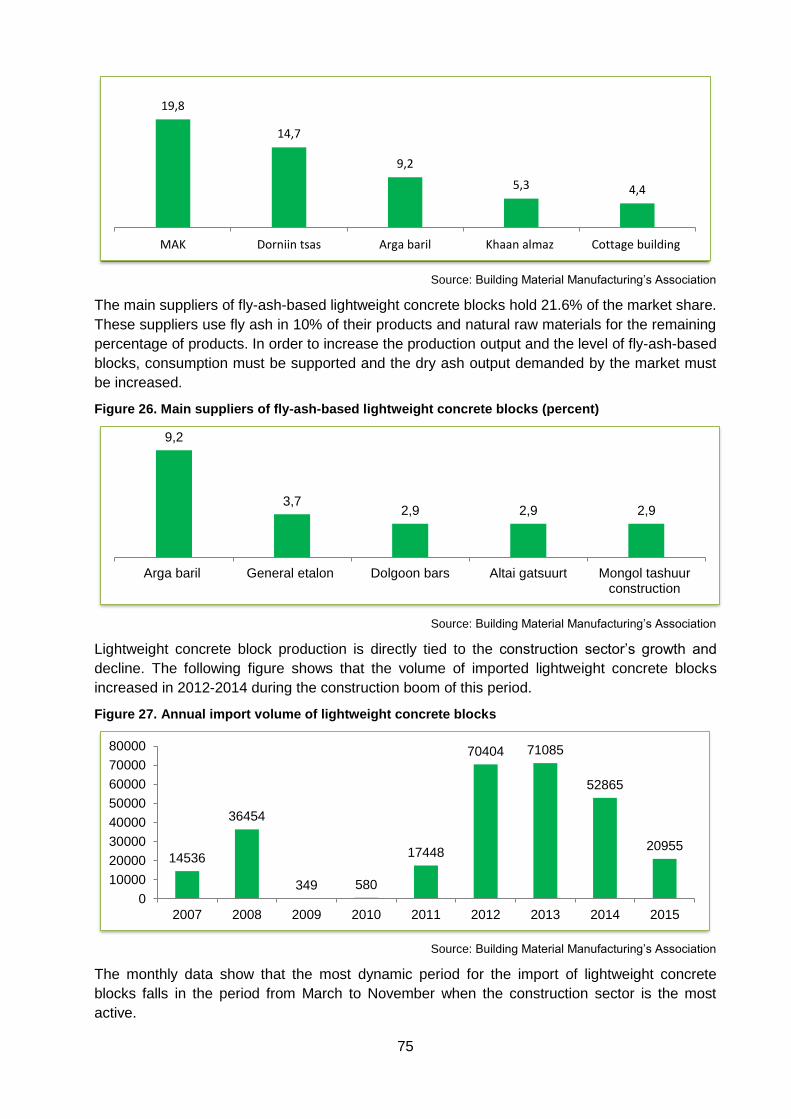
75
Source: Building Material Manufacturing’s Association
The main suppliers of fly-ash-based lightweight concrete blocks hold 21.6% of the market share.
These suppliers use fly ash in 10% of their products and natural raw materials for the remaining
percentage of products. In order to increase the production output and the level of fly-ash-based
blocks, consumption must be supported and the dry ash output demanded by the market must
be increased.
Figure 26. Main suppliers of fly-ash-based lightweight concrete blocks (percent)
Source: Building Material Manufacturing’s Association
Lightweight concrete block production is directly tied to the construction sector’s growth and
decline. The following figure shows that the volume of imported lightweight concrete blocks
increased in 2012-2014 during the construction boom of this period.
Figure 27. Annual import volume of lightweight concrete blocks
Source: Building Material Manufacturing’s Association
The monthly data show that the most dynamic period for the import of lightweight concrete
blocks falls in the period from March to November when the construction sector is the most
active.
19,8
14,7
9,2
5,3 4,4
MAK Dorniin tsas Arga baril Khaan almaz Cottage building
9,2
3,72,9 2,9 2,9
Arga baril General etalon Dolgoon bars Altai gatsuurt Mongol tashuurconstruction
14536
36454
349 580
17448
70404 71085
52865
20955
0
10000
20000
30000
40000
50000
60000
70000
80000
2007 2008 2009 2010 2011 2012 2013 2014 2015
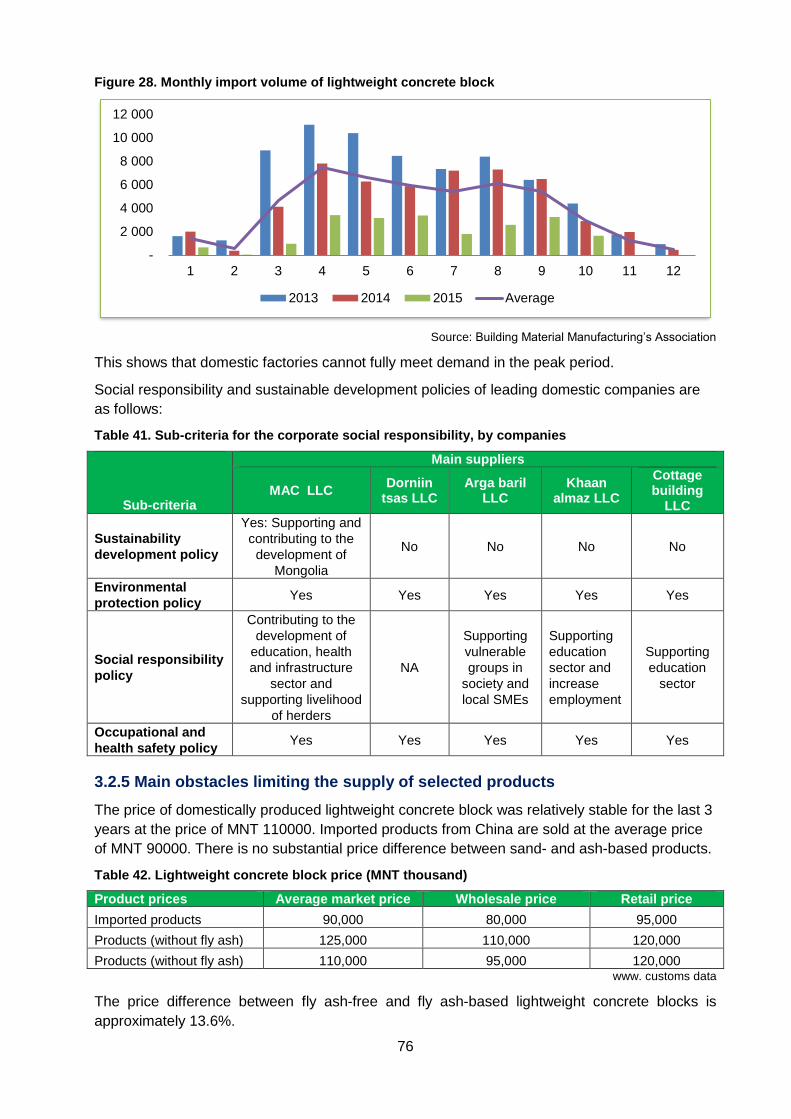
76
Figure 28. Monthly import volume of lightweight concrete block
Source: Building Material Manufacturing’s Association
This shows that domestic factories cannot fully meet demand in the peak period.
Social responsibility and sustainable development policies of leading domestic companies are
as follows:
Table 41. Sub-criteria for the corporate social responsibility, by companies
Sub-criteria
Main suppliers
MAC LLC Dorniin
tsas LLC Arga baril
LLC Khaan
almaz LLC
Cottage building
LLC
Sustainability
development policy
Yes: Supporting and
contributing to the
development of
Mongolia
No No No No
Environmental
protection policy Yes Yes Yes Yes Yes
Social responsibility
policy
Contributing to the
development of
education, health
and infrastructure
sector and
supporting livelihood
of herders
NA
Supporting
vulnerable
groups in
society and
local SMEs
Supporting
education
sector and
increase
employment
Supporting
education
sector
Occupational and
health safety policy Yes Yes Yes Yes Yes
3.2.5 Main obstacles limiting the supply of selected products
The price of domestically produced lightweight concrete block was relatively stable for the last 3
years at the price of MNT 110000. Imported products from China are sold at the average price
of MNT 90000. There is no substantial price difference between sand- and ash-based products.
Table 42. Lightweight concrete block price (MNT thousand)
Product prices Average market price Wholesale price Retail price
Imported products 90,000 80,000 95,000
Products (without fly ash) 125,000 110,000 120,000
Products (without fly ash) 110,000 95,000 120,000 www. customs data
The price difference between fly ash-free and fly ash-based lightweight concrete blocks is
approximately 13.6%.
-
2 000
4 000
6 000
8 000
10 000
12 000
1 2 3 4 5 6 7 8 9 10 11 12
2013 2014 2015 Average
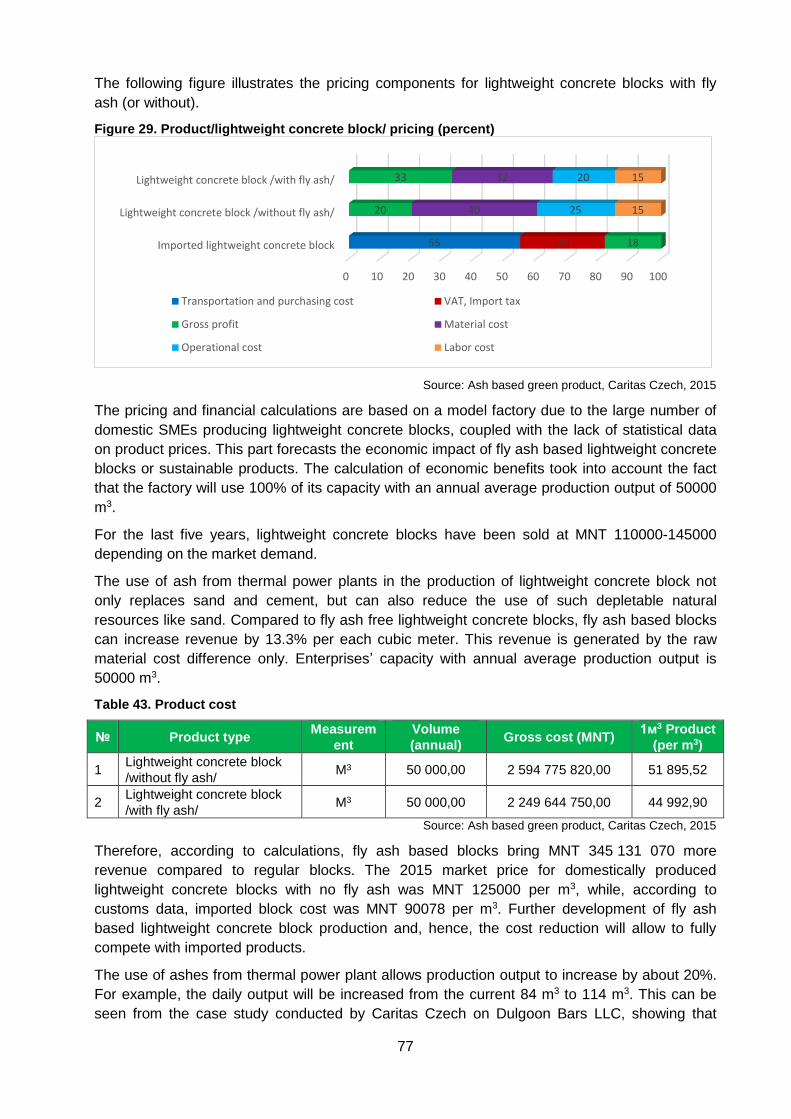
77
The following figure illustrates the pricing components for lightweight concrete blocks with fly
ash (or without).
Figure 29. Product/lightweight concrete block/ pricing (percent)
Source: Ash based green product, Caritas Czech, 2015
The pricing and financial calculations are based on a model factory due to the large number of
domestic SMEs producing lightweight concrete blocks, coupled with the lack of statistical data
on product prices. This part forecasts the economic impact of fly ash based lightweight concrete
blocks or sustainable products. The calculation of economic benefits took into account the fact
that the factory will use 100% of its capacity with an annual average production output of 50000
m3.
For the last five years, lightweight concrete blocks have been sold at MNT 110000-145000
depending on the market demand.
The use of ash from thermal power plants in the production of lightweight concrete block not
only replaces sand and cement, but can also reduce the use of such depletable natural
resources like sand. Compared to fly ash free lightweight concrete blocks, fly ash based blocks
can increase revenue by 13.3% per each cubic meter. This revenue is generated by the raw
material cost difference only. Enterprises’ capacity with annual average production output is
50000 m3.
Table 43. Product cost
№ Product type Measurem
ent
Volume
(annual) Gross cost (MNT)
1м3 Product
(per m3)
1 Lightweight concrete block
/without fly ash/ M3 50 000,00 2 594 775 820,00 51 895,52
2 Lightweight concrete block
/with fly ash/ M3 50 000,00 2 249 644 750,00 44 992,90
Source: Ash based green product, Caritas Czech, 2015
Therefore, according to calculations, fly ash based blocks bring MNT 345 131 070 more
revenue compared to regular blocks. The 2015 market price for domestically produced
lightweight concrete blocks with no fly ash was MNT 125000 per m3, while, according to
customs data, imported block cost was MNT 90078 per m3. Further development of fly ash
based lightweight concrete block production and, hence, the cost reduction will allow to fully
compete with imported products.
The use of ashes from thermal power plant allows production output to increase by about 20%.
For example, the daily output will be increased from the current 84 m3 to 114 m3. This can be
seen from the case study conducted by Caritas Czech on Dulgoon Bars LLC, showing that
0 10 20 30 40 50 60 70 80 90 100
Imported lightweight concrete block
Lightweight concrete block /without fly ash/
Lightweight concrete block /with fly ash/
55 27 18
20
33
40
32
25
20
15
15
Transportation and purchasing cost VAT, Import tax
Gross profit Material cost
Operational cost Labor cost

78
production output can be increased by replacing sand with ash, which allows to reduce costs
associated with sand milling, to save water consumption and to reduce production time.
SWOT analysis of lightweight concrete blocks
3.3 DEMAND ANALYSIS OF LIGHTWEIGHT CONCRETE BLOCKS
3.3.1 Public organizations’ consumption of selected products
The average annual consumption of lightweight concrete blocks in Mongolia reaches 1,358,000
m3 and, until 2014, almost half of this consumption or 650,000 m3 of lightweight concrete blocks
were imported from China. The launch of large production factories by MAC LLC and Dornyn
Tsas LLC created an opportunity to fully meet demand with domestic products. As of 2015, the
average domestically produced lightweight concrete block cost MNT 125000 per m3, while the
declared customs cost of imported products was at MNT 90078 per m3. The total spending on
lightweight concrete block consumption was MNT 58550.7 million for imported blocks and MNT
88500.0 million for domestically produced blocks.
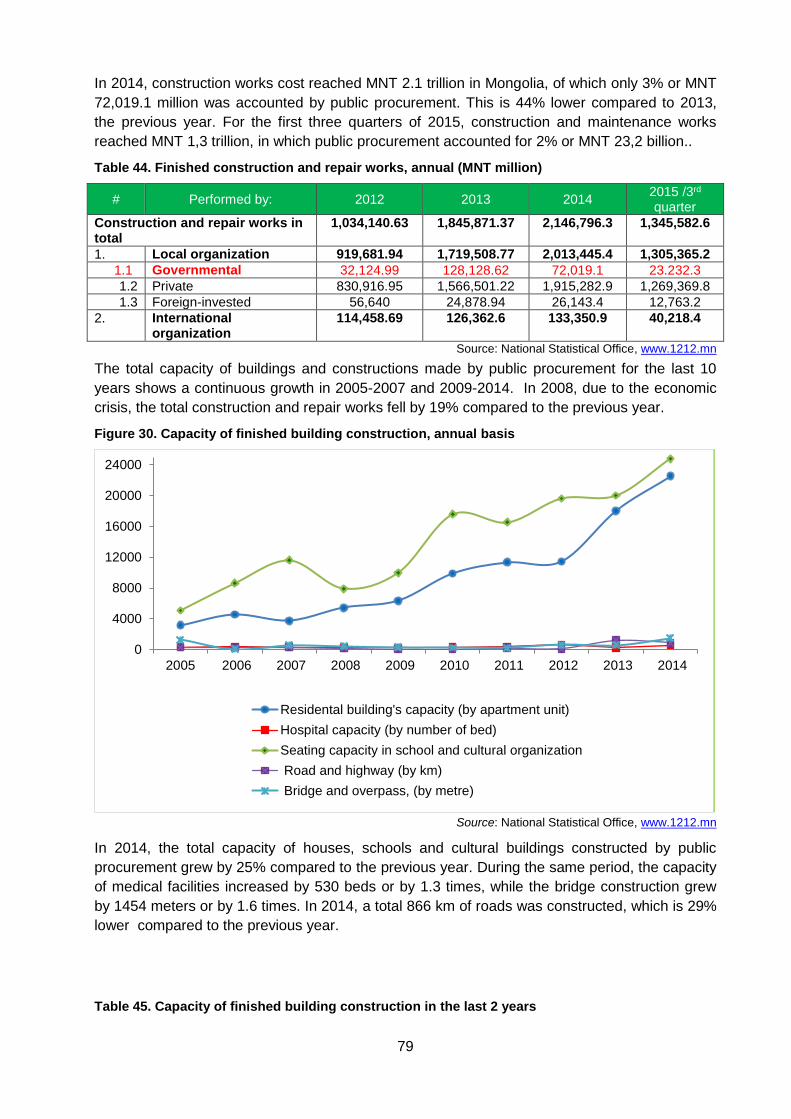
79
In 2014, construction works cost reached MNT 2.1 trillion in Mongolia, of which only 3% or MNT
72,019.1 million was accounted by public procurement. This is 44% lower compared to 2013,
the previous year. For the first three quarters of 2015, construction and maintenance works
reached MNT 1,3 trillion, in which public procurement accounted for 2% or MNT 23,2 billion..
Table 44. Finished construction and repair works, annual (MNT million)
# Performed by: 2012 2013 2014 2015 /3rd quarter
Construction and repair works in total
1,034,140.63 1,845,871.37 2,146,796.3 1,345,582.6
1. Local organization 919,681.94 1,719,508.77 2,013,445.4 1,305,365.2
1.1 Governmental 32,124.99 128,128.62 72,019.1 23.232.3
1.2 Private 830,916.95 1,566,501.22 1,915,282.9 1,269,369.8
1.3 Foreign-invested 56,640 24,878.94 26,143.4 12,763.2
2. International organization
114,458.69 126,362.6 133,350.9 40,218.4
Source: National Statistical Office, www.1212.mn
The total capacity of buildings and constructions made by public procurement for the last 10
years shows a continuous growth in 2005-2007 and 2009-2014. In 2008, due to the economic
crisis, the total construction and repair works fell by 19% compared to the previous year.
Figure 30. Capacity of finished building construction, annual basis
Source: National Statistical Office, www.1212.mn
In 2014, the total capacity of houses, schools and cultural buildings constructed by public
procurement grew by 25% compared to the previous year. During the same period, the capacity
of medical facilities increased by 530 beds or by 1.3 times, while the bridge construction grew
by 1454 meters or by 1.6 times. In 2014, a total 866 km of roads was constructed, which is 29%
lower compared to the previous year.
Table 45. Capacity of finished building construction in the last 2 years
0
4000
8000
12000
16000
20000
24000
2005 2006 2007 2008 2009 2010 2011 2012 2013 2014
Residental building's capacity (by apartment unit)
Hospital capacity (by number of bed)
Seating capacity in school and cultural organization
Road and highway (by km)
Bridge and overpass, (by metre)

80
№ Type of building 2013 2014
1 Residental building capacity (by apartment unit) 18012 22546
2 Hospital capacity (by number of bed) 228 530
3 Seating capacity in schools and cultural organizations 20012 24806
4 Road and highway (by km) 1213 866
5 Bridge and overpass, (by metre) 552 1454 Source: National Statistical Office, www.1212.mn
3.3.2 Public organizations’ procurement demand of selected products
Demand for sustainable product procurement
Fly ash based lightweight concrete blocks account for only 3.6% of the total market because of
low demand and, thus, inducing a low production volume. The low production volume of fly ash
based lightweight concrete blocks or sustainable products results in insufficient use experience.
Therefore, since it is difficult to determine the public procurement demand for sustainable
lightweight concrete blocks based on previous consumption data, the calculations were made
based only on procurement plans.
As previously mentioned, the public procurement accounted for only 2-3% of the total
construction and maintenance works for 2014-2015. 2016 budget plan shows an increase for
the public procurement of construction and maintenance works up to MNT 290811,1 million,
which is by 2-3 times higher compared to the spending in the last 3 years. 40% of this
procurement will be spent on school and kindergarten constructions. Only 1% of these
procurements will be spent on housing construction, which might be related to low demand for
houses.
Table 46. Planning to finish building construction and type of building construction, (by state budget)
№ Type of building State budget, 2016
(MNT million)
1 Office building /capacity/ 42,997.4
2 Apartment building /capacity/ 2,863.8
3 Cultural building /capacity/ 22,086.8
4 Hospital, /number of bed// 34,235.9
5 School and kindergarten, /number of seat/ 116,543.4
6 Road and highway, km 56,513.8
7 Bridge and overpass, metre 15,570
Total 290,811.1 Source: The State Budget of Mongolia, 2016
In order to determine the costs for construction materials in the total budgeted cost for
construction, we will use the volume of construction materials cost.
60% of the total construction cost goes to main cost items, such as construction materials and
labour. The construction materials account for approximately 42% of the total budgeted cost.
Based on planned public procurement for 2016, it is possible to say that MNT 122140.6 million
will be spent for construction materials.
Figure 31. Construction cost estimates

81
Source: Supply and demand research for construction industry, Ulaanbaatar
In order to have detailed information on demand for lightweight concrete blocks, we need to
determine the percentage of lightweight concrete blocks in construction material. However, due
to construction purposes, the number of floors, the types and other factors, the usage volume of
lightweight concrete blocks vary. Therefore, in accordance with the discussion and decision
made by the study team, detailed calculations for demand were made based on the information
from real life cases where the team had several meetings with some construction companies.
Companies such as Ulzii concrete LLC and Golomt construction LLC, which do not only
produce lightweight concrete blocks, but also conduct construction works, participated in the
case studies (See Appendix 3 for detailed information about case studies). According to the
internal studies of these companies, 15-20% of construction materials use concrete, of which 4-
5% is used for shelling.
Lightweight concrete blocks can be used for all types of shelling works. If demand for
lightweight concrete blocks required for shelling is at 5% in average, then MNT 6,107.1 million
out of MNT 122140.6 million worth construction materials can be spent on lightweight concrete
blocks. Moreover, there can be created demand of MNT 6.1 billion for fly ash based lightweight
concrete blocks through SPP.
3.3.3 Main obstacles and opportunities for the purchase of selected products
With regard to the supply of raw material:
Although total ash resource is sufficient for the current production volume, the absence of
economically efficient technology for the use of wet ash limits the useable ash. In order to
continuously develop fly ash based material production, the need for technology to process wet
ash must be introduced, and the need for necessary equipment to transport and store the ash in
large amounts must be met by companies.
With regard to product manufacturing:
Although these factories are highly interested in using fly ash in lightweight concrete blocks, this
type of block accounts for only a 3.6%-share of the total market due to low demand. The
absence of standards, regulations and rules for the use of ashes at different levels, for different
purposes as well as for controlled use, creates difficulties in production. Therefore, supporting
actions by the government are needed to create a standard for ash use and to constantly
maintain ash resources. If the government supports the fly ash based product consumption
through SPP, producers will see no problem in using fly ash in lightweight concrete blocks.
With regard to consumption:
Land 10%
Financing cost 20%
Tax 8%
Transportation cost 5%
Other 4%
Labor cost 11%
Building materials 42%
40% 60%
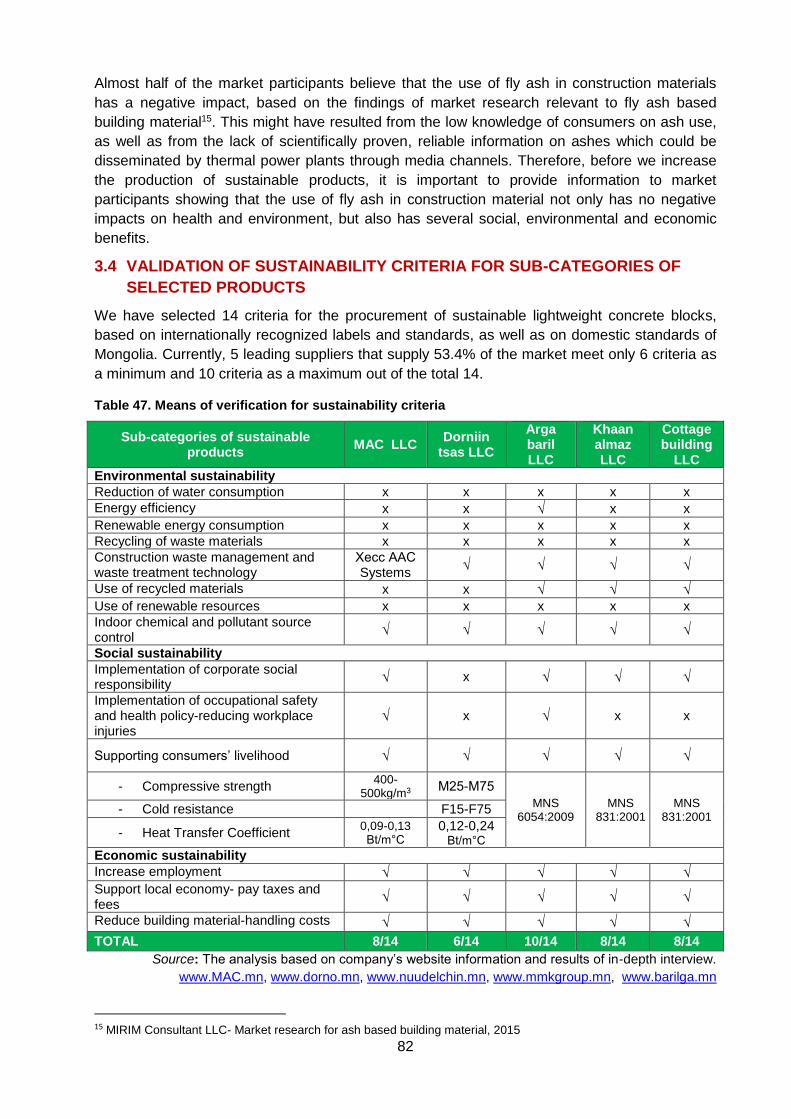
82
Almost half of the market participants believe that the use of fly ash in construction materials
has a negative impact, based on the findings of market research relevant to fly ash based
building material15. This might have resulted from the low knowledge of consumers on ash use,
as well as from the lack of scientifically proven, reliable information on ashes which could be
disseminated by thermal power plants through media channels. Therefore, before we increase
the production of sustainable products, it is important to provide information to market
participants showing that the use of fly ash in construction material not only has no negative
impacts on health and environment, but also has several social, environmental and economic
benefits.
3.4 VALIDATION OF SUSTAINABILITY CRITERIA FOR SUB-CATEGORIES OF
SELECTED PRODUCTS
We have selected 14 criteria for the procurement of sustainable lightweight concrete blocks,
based on internationally recognized labels and standards, as well as on domestic standards of
Mongolia. Currently, 5 leading suppliers that supply 53.4% of the market meet only 6 criteria as
a minimum and 10 criteria as a maximum out of the total 14.
Table 47. Means of verification for sustainability criteria
Sub-categories of sustainable products
MAC LLC Dorniin
tsas LLC
Arga baril LLC
Khaan almaz LLC
Cottage building
LLC
Environmental sustainability
Reduction of water consumption x x x x x
Energy efficiency x x √ x x
Renewable energy consumption x x x x x
Recycling of waste materials x x x x x
Construction waste management and waste treatment technology
Хесс ААС Systems
√ √ √ √
Use of recycled materials x x √ √ √
Use of renewable resources x x x x x
Indoor chemical and pollutant source control
√ √ √ √ √
Social sustainability
Implementation of corporate social responsibility
√ x √ √ √
Implementation of occupational safety and health policy-reducing workplace injuries
√ x √ x x
Supporting consumers’ livelihood √ √ √ √ √
- Compressive strength 400-
500kg/m3 М25-М75
MNS 6054:2009
MNS 831:2001
MNS 831:2001
- Cold resistance F15-F75
- Heat Transfer Coefficient 0,09-0,13 Вt/m°С
0,12-0,24 Вt/m°С
Economic sustainability
Increase employment √ √ √ √ √
Support local economy- pay taxes and fees
√ √ √ √ √
Reduce building material-handling costs √ √ √ √ √
TOTAL 8/14 6/14 10/14 8/14 8/14
Source: The analysis based on company’s website information and results of in-depth interview.
www.MAC.mn, www.dorno.mn, www.nuudelchin.mn, www.mmkgroup.mn, www.barilga.mn
15 MIRIM Consultant LLC- Market research for ash based building material, 2015

83
Main suppliers are losing their points mostly on criteria related to natural, environmental
sustainability, as according to the producers’ description an eco-product is a product ‘made from
100% natural raw materials’.
Table 48. The sustainability criteria and means of verification
Environmental attributes
Sustainability criteria 2016 2017 2018 2019 2020
Environmental sustainability
Reduction of water consumption
Implement a grey-water system
Use of water-efficient building material (Wet fly ash or slag...)
Efficient energy use
Use of energy-efficient technologies
Use of renewable energy
Recycling of waste materials
Recycling and reuse of building materials
Construction waste management and waste treatment technology
Implementation of waste treatment technology
Use of recycled materials
Utilization of fly ash from thermal power plants
Use of renewable natural resources
If natural resources such as gravel and sand are used, rehabilitation must be completed in the area or other equivalent field
Indoor chemical and pollutant source control
Radionuclide concentration ≤370 Bq/kg
Social sustainability
Implementation of corporate social responsibility
The number of corporate social responsibility initiatives in last 2 years
Implementation of occupational safety and health policy reducing work-related illness and injuries
The number of workplace injuries
Supporting consumers’ livelihood
Implement ISO 9001
Economic sustainability
Increase employment Raw materials based on local source
Support local economy - pay taxes and fees
Paid all taxes and fees
Reduce building material-handling costs
Use of job simplification technique
Note:
Blue arrow shows the criteria that can be currently used in SPP;
Red arrow shows the criteria that require a certain time to use in SPP.
Evaluation criteria for the 14 categories selected for public procurement are shown in the above
table. In other words, in order to be described as a sustainable product supplier, compliance
with related laws, regulations and standards of Mongolia as well as with 15 criteria mentioned
√ - Currently implementing
X – Not yet implemented

84
above is required. It is believed that these 15 criteria can be fully met by enterprise within a 5-
year term. For some of these criteria, 1-2 years are needed for enterprises. The most time
demanding four criteria are the introduction of grey-water technology, the use of renewable
energy, the recycling of old building materials and the restoration of fields used for their natural
resources.
3.5 CONCLUSIONS AND RECOMMENDATIONS DRIVEN FROM THE MARKET
ANALYSIS ON LIGHTWEIGHT CONCRETE BLOCKS
The average annual consumption of lightweight concrete blocks is 1,358,000 cubic meter tons,
53.6% of which are supplied by MAK LLC, Dornyn Tsas LLC, Arga Baril LLC, Khaan Almaz LLC
and Cottage LLC, most of whom have an annual average production output of 40,000-50,000
cubic meter tons each. Out of the six raw material components for lightweight concrete blocks,
only aluminum powder is 100% imported, while the other five components are supplied by the
domestic market. The forecasted demand for lightweight concrete blocks is worth MNT 1.6
billion based on the government procurement plan for 2016.
Awareness regarding the use of fly ash in the production of concrete blocks is very low among
block producers. Also, the producers and building material consumers may have a wrong
understanding of the characteristics and impacts of fly ash based concrete blocks, and may
assume that fly ash based concrete blocks include a considerable amount of radionuclides. In
reality, fly ash based concrete blocks include twice less radionuclides than the approved
amount. Therefore, due to a wrong understanding and lack of information, fly ash based
concrete blocks are not perceived as well as non-fly ash based ones
Based on this reasoning, suppliers tend to lure consumers, by selling fly ash based concrete
block at the same price as non-fly ash concrete blocks. Therefore, the prices for fly ash based
and non-fly ash lightweight concrete blocks are almost the same in the market even though fly
ash based concrete blocks are produced at a lower cost compared to non-fly ash concrete
blocks. Moreover, demand for fly ash based concrete blocks is relatively low due to the wrong
understanding among public and similar price to that of non-fly ash concrete blocks. Currently,
demand for fly ash based products account for only 3.6% of the market (annual average –
50,000 cubic meters). The share of fly ash based blocks is forecasted to increase up to 10% by
2020 if the current market trend is preserved.
Based on the lessons learned from research, the following is recommended to launch SPP for
lightweight concrete blocks:
1. Education and capacity building on fly ash based concrete blocks is vital in the current
situation. Therefore, it would be advisable to provide information about the advantages
of fly ash based concrete blocks to the relevant stakeholders such as producers,
traders, and consumers.
2. Also, the following points should be included in public procurement procedures with
respect to lightweight concrete blocks:
In tendering, it should be considered an asset if entities’ operations or products
are certified with ecolabels or standards, (i.e. preference should be given to
entities certified by ecolabels when such vendors participate in public tenders);
Points should be given during the procurement process to entities focusing on
sustainable development concepts in their products and production processes
3. Evaluation criteria for public procurement must be gradually introduced in the
procurement process year after year. as shown in Table 48 (please see Section 3.4.).
Procurement must be aimed at supporting domestic producers since they do have a

85
capacity to fully meet domestic market needs, as well as at supporting SMEs in order
to prevent the creation of a monopolized market. The technology to process wet
ash must be adopted, and the need for necessary equipment to transport and store
the ash in large amounts must be met by companies. Supporting actions by the
government, such as subsidies, incentives etc., are needed to create a standard for
ash use, and to constantly maintain ash resources. If the government supports the fly
ash based product consumption through SPP, producers will see no problem in using
fly ash in lightweight concrete blocks.
CONCLUSIONS AND POLICY RECOMMENDATIONS FOR OVERALL RESEARCH
The key objectives of this research were to assess: (i) the existing productive capacities for
sustainable A4 paper, toner cartridge and lightweight concrete blocks; and (ii) the
responsiveness of the market to potential SPP tenders.
Generally, it has been demonstrated that the A4 paper market in Mongolia has the full capability
to respond effectively to SPP tenders because most A4 paper imported into the market
already meet the basic requirements to be considered sustainable A4 paper.
86
The markets of toner cartridge and lightweight concrete blocks also have the potential to
respond to SPP tenders; however, taking into account the findings of this study, it is clear that
these two markets currently have a limited ability to provide sustainable options.
The market for sustainable alternatives is shaped by a number of factors, including: legal
requirements (e.g., laws mandating green purchasing); business entities’ ethics and
environmentally responsible behavior; consumer demand, created through awareness of the
benefits of sustainable goods.
Since government spending was estimated at between 20-30% of Mongolian GDP in recent
years, the government has a great buying power. It can therefore be a driving force in creating
sustainable markets. Through the public procurement of goods that meet sustainable
requirements, the government will make significant contributions to sustainable development.
The value of sustainable purchasing is huge, not only in reducing impact on the environment but
also in protecting public worker’s health and adopting responsible business and ethical business
practice.
Recommendations
Based on the findings of the study, the following is recommended to launch SPP:
1. Develop a specific policy for sustainable public procurement. It is needed to clarify that sustainable public procurement does not limit competition nor violate the country’s international trade obligations. Moreover, it identifies the sustainable product criteria that will concern environmental, social and economic sustainability.
2. Develop evaluation methods for sustainable product criteria. In the Mongolian case, currently, using ecolabels and narrow product criteria in public procurement will not work due to the limited availability of products carrying eco-labels. If a public tender were to require any specific label, it could be perceived as discriminatory or as “limiting competition.” Therefore, an SPP policy needs to set standards that stipulate analogous criteria to common ecolabels.
- A4 copy paper: All basic sub-categories of sustainable A4 copy paper that are recognized at an international level are possible to apply when practicing SPP in the Mongolian context, and many products meeting basic requirements are already present in the Mongolian market. Although most sustainability labels used in an international context can be applied to A4 copy paper in Mongolia, a certain period is needed to officially mandate their introduction in public procurement (see Table 16, section 1.4. for more information). In the case of A4 copy paper, the cost of shifting to sustainable products is low.
- Toner cartridge: Some basic sub-categories of sustainable toner cartridges that are recognized in an international context are possible to apply in Mongolian sustainable public procurement at present, namely, the avoidance of heavy metals and azo-colorants, environmentally preferred packaging, quality management system (for original cartridges), ease of re-use/recycling, and technical quality. Most original and some remanufactured toner cartridges imported to Mongolia already meet some sustainability requirements. Evaluation methods recognized at an international level can be applied to toner cartridges in Mongolia; however, a certain adaptation period is needed to add sustainable criteria in public procurement (see Table 29, section 2.4., for more information).
- Lightweight concrete blocks: Some basic sub-categories of sustainable concrete blocks are possible to apply in Mongolian sustainable public procurement at present, namely, reduction of water consumption, use of recycled materials, construction waste

87
management or waste treatment technology, indoor chemical and pollutant source control. The products that meet these sustainable criteria have already begun to be produced in Mongolia. However, the methods of verifying such sustainability criteria are still under development (see Table 48, section 3.4, for more information).
3. Develop a database of sustainable products. The maintenance of a database of all sustainable goods and their suppliers that are available in Mongolian market will greatly assist in developing SPP practice in Mongolia. The database should be updated regularly.
4. Provide education and capacity building for all procurement officers to familiarize them with the sustainable product criteria and evaluation process.
REFERENCES
EBRD . (2015). Demand and supply analysis of four product markets: A4 paper, printer ink cartridge,
computer and fuel. Ulaanbaatar.
Kinsella, S. (2012). Comparing Recycled to Virgin Paper.
Parkin, M. (2012). Economics. London: Prentice Hall.

88
UNEP. (2010). Sustainable Procurenment Guidelines .
ANNEXES
Annex 1. Ecolabels for A4 copy paper, toner cartridges and concrete blocks
Ecolabels for A4 office paper and toner cartridges
Label Logo Short description
The EU Ecolabel is part of a broader EU Action Plan on Sustainable Consumption and Production and Sustainable Industrial Policy adopted by the European Commission on 16 July 2008, which

89
European Ecolabel
also links the EU Ecolabel to other EU policies such as green public procurement (GPP) and Eco-design of energy-using products.
Nordic Ecolabel
The Nordic Ecolabel is a voluntary ecolabelling scheme that evaluates a product's impact on the environment throughout the whole life cycle.
Blue Angel
Nordic Ecolabelling has set environmental requirements concerning the origin of the raw wood material, the emissions to air and water, the use of energy as well as the chemicals used in the production of the pulp and paper.
Austrian
Umweltzeichen
This label provides the general public with information on the environmental impact of consumer goods that arises from their production, usage and disposal and attracts the attention of consumers to alternative environmentally friendly products.
Forest
Stewardship
Council (FSC)
The Forest Stewardship Council (FSC) is an international not for-profit, multi-stakeholder organization established in 1993 to promote responsible management of the world’s forests. Its main tools for achieving this are standard setting, certification and labelling of forest products.
Program for the Endorsement of
Forest Certification
(PEFC)
The Program for the Endorsement of Forest Certification (PEFC) is an international, non-profit, non-governmental organization which promotes sustainable forest management through independent third-party certification. It is considered the certification system of choice for small forest owners.
Eco Mark Japan
It is the mark that is attached on a product which is available in our daily lives as well as certified as contributing to environmental preservation in terms of less environmental burden. It is also aimed for the consumers to make an environmental - friendly product choice, and also to consider the relation of life and environment.
Thai Green Label
The Green Label is an environmental certification awarded to specific products that are shown to have minimum detrimental impact on the environment, in comparison with other products serving the same function. The Thai Green Label Scheme applies to products and services, not including foods, drinks, and pharmaceuticals.
Singapore Green Label Scheme
The Singapore Green Labeling Scheme (SGLS) aims to help the public identify environment-friendly products that meet certain eco-standards specified by the scheme and seeks to encourage the level of eco-consumerism in Singapore as well as to identify the growing demand for greener products in the market. The scheme hopes to encourage manufacturers to design and manufacture with the environment in mind. It was launched in May 1992 by the Ministry of the Environment. It was handed over to the Singapore Environment Council (SEC) on 5 June 1999 and is currently under the authority of the SEC.

90
Chlorine-Free Products
Association label
Processed Chlorine Free (PCF) audits require a chain of custody for all raw materials, measures the impact of a manufacturing process on the environment: water and energy use, chemistry, carbon gas releases, reviews environmental policy and permit compliance, reviews ethical management practices and compliance, financial performance, product stewardship, public information, funding of research and development, and employee recognition.
Green Seal ecolabel
Green Seal utilizes a life-cycle approach to ensure tangible reductions in the whole environmental footprint. They are ANSI-accredited and meet ISO and GEN requirements. Products only earn Green Seal certification after a rigorous evaluation, including an on-site audit.
Ecologo
Ecologo has been recognized or referenced in more than 350 specifications and standards, and UL Environment has public affairs and outreach teams dedicated to continuing to enhance market adoption.
ISO14001
ISO 14001 is an internationally accepted standard that outlines how to put an effective environmental management system in place.
ISO9001
The ISO 9001 standard provides a framework of globally recognised principles of quality management, including: customer focus, leadership, involvement of people, process approach to management, continual improvement, factual approach to decision making and mutually beneficial supplier relationships.
SCG Papers’ Green Process refers to all operations that result in paper as the outcome. Each process must be environmentally and socially responsible, and use natural resources as wisely as possible to ensure low levels of consumption, high levels of recycling, and optimum management of by-products and production waste.
International eco label for sustainable building
Eco labels Main criteria
LEED- Leadership energy and environmental design-
USA
LEED consists of credits which earn points in 7 categories: 1. Site selection 2. Water efficiency 3. Energy and Atmosphere 4. Materials and Resources 5. Indoor environmental quality 6. Regional priority 7. Innovation and design
One hundred points are available across these categories with mandatory prerequisites such as minimum energy and water-use reduction, recycling collection, and tobacco smoke control.
BREEAM is the world’s foremost environmental assessment method and rating system for buildings. It has served as the basis for many of the green building certification systems and since its establishment
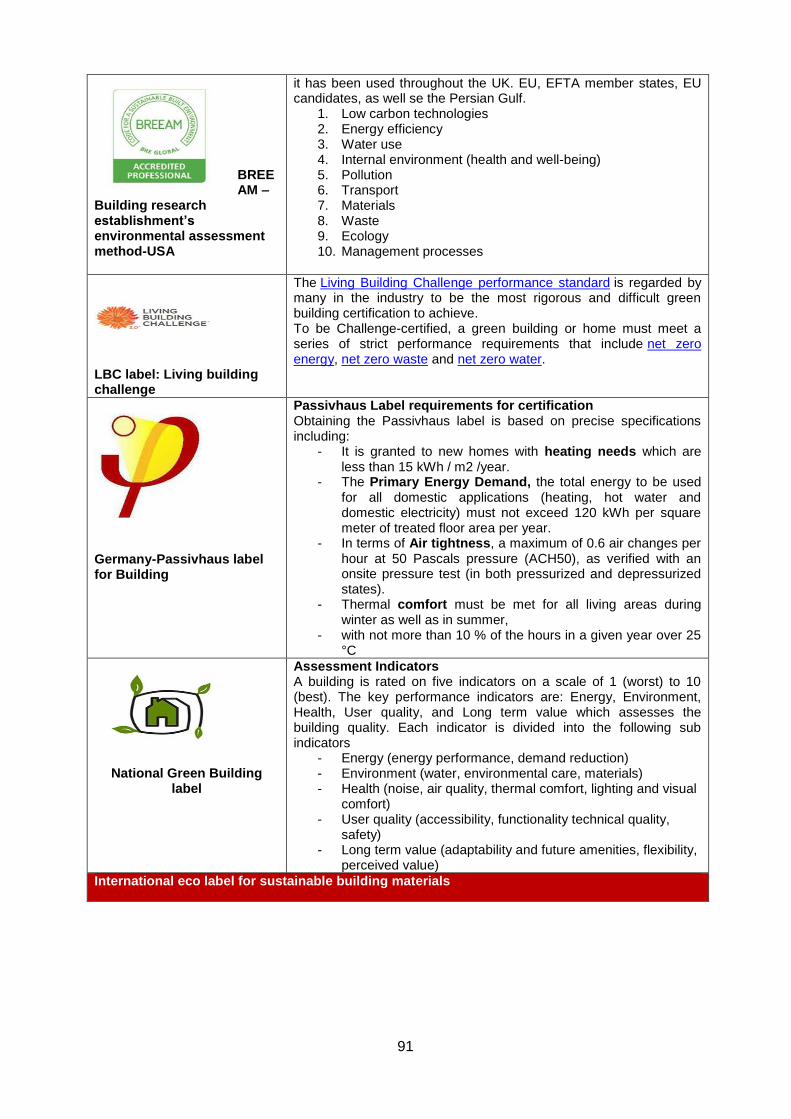
91
BREEAM –
Building research establishment’s environmental assessment method-USA
it has been used throughout the UK. EU, EFTA member states, EU candidates, as well se the Persian Gulf.
1. Low carbon technologies 2. Energy efficiency 3. Water use 4. Internal environment (health and well-being) 5. Pollution 6. Transport 7. Materials 8. Waste 9. Ecology 10. Management processes
LBC label: Living building challenge
The Living Building Challenge performance standard is regarded by many in the industry to be the most rigorous and difficult green building certification to achieve. To be Challenge-certified, a green building or home must meet a series of strict performance requirements that include net zero energy, net zero waste and net zero water.
Germany-Passivhaus label for Building
Passivhaus Label requirements for certification Obtaining the Passivhaus label is based on precise specifications including:
- It is granted to new homes with heating needs which are less than 15 kWh / m2 /year.
- The Primary Energy Demand, the total energy to be used for all domestic applications (heating, hot water and domestic electricity) must not exceed 120 kWh per square meter of treated floor area per year.
- In terms of Air tightness, a maximum of 0.6 air changes per hour at 50 Pascals pressure (ACH50), as verified with an onsite pressure test (in both pressurized and depressurized states).
- Thermal comfort must be met for all living areas during winter as well as in summer,
- with not more than 10 % of the hours in a given year over 25 °C
National Green Building label
Assessment Indicators A building is rated on five indicators on a scale of 1 (worst) to 10 (best). The key performance indicators are: Energy, Environment, Health, User quality, and Long term value which assesses the building quality. Each indicator is divided into the following sub indicators
- Energy (energy performance, demand reduction) - Environment (water, environmental care, materials) - Health (noise, air quality, thermal comfort, lighting and visual
comfort) - User quality (accessibility, functionality technical quality,
safety) - Long term value (adaptability and future amenities, flexibility,
perceived value)
International eco label for sustainable building materials
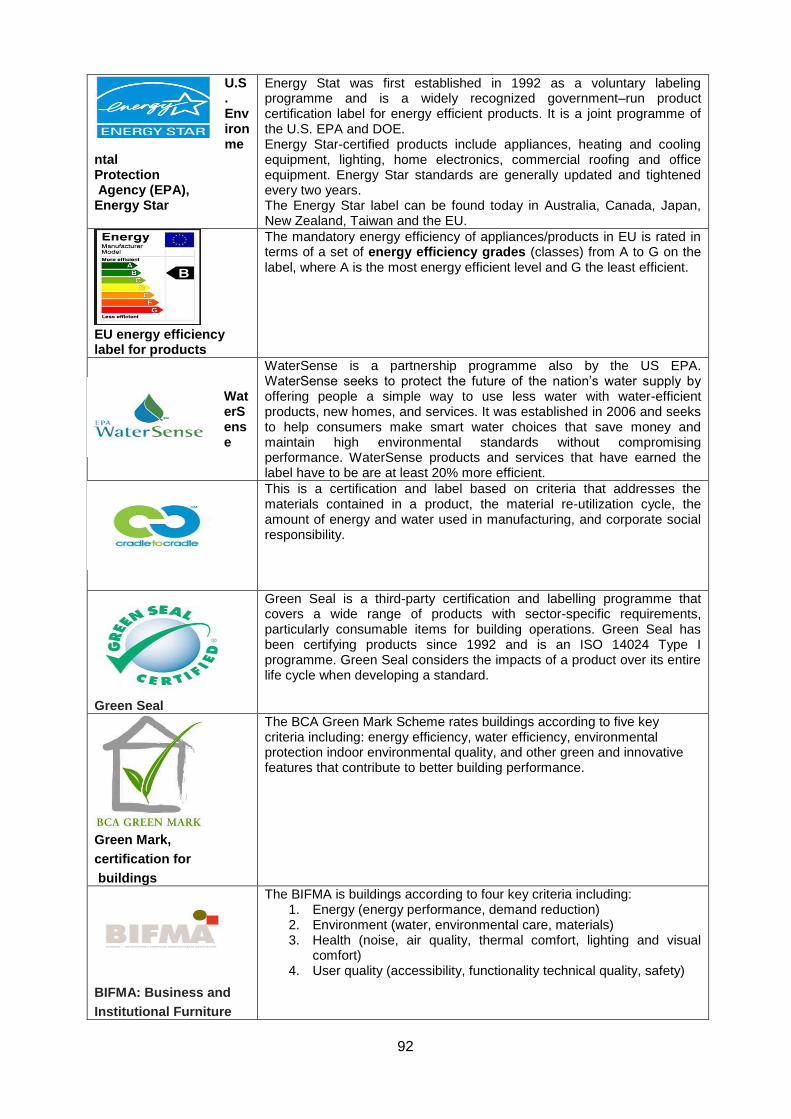
92
U.S. Environme
ntal Protection Agency (EPA), Energy Star
Energy Stat was first established in 1992 as a voluntary labeling programme and is a widely recognized government–run product certification label for energy efficient products. It is a joint programme of the U.S. EPA and DOE. Energy Star-certified products include appliances, heating and cooling equipment, lighting, home electronics, commercial roofing and office equipment. Energy Star standards are generally updated and tightened every two years. The Energy Star label can be found today in Australia, Canada, Japan, New Zealand, Taiwan and the EU.
EU energy efficiency label for products
The mandatory energy efficiency of appliances/products in EU is rated in terms of a set of energy efficiency grades (classes) from A to G on the label, where A is the most energy efficient level and G the least efficient.
WaterSense
WaterSense is a partnership programme also by the US EPA. WaterSense seeks to protect the future of the nation’s water supply by offering people a simple way to use less water with water-efficient products, new homes, and services. It was established in 2006 and seeks to help consumers make smart water choices that save money and maintain high environmental standards without compromising performance. WaterSense products and services that have earned the label have to be are at least 20% more efficient.
This is a certification and label based on criteria that addresses the materials contained in a product, the material re-utilization cycle, the amount of energy and water used in manufacturing, and corporate social responsibility.
Green Seal
Green Seal is a third-party certification and labelling programme that covers a wide range of products with sector-specific requirements, particularly consumable items for building operations. Green Seal has been certifying products since 1992 and is an ISO 14024 Type I programme. Green Seal considers the impacts of a product over its entire life cycle when developing a standard.
Green Mark,
certification for
buildings
The BCA Green Mark Scheme rates buildings according to five key criteria including: energy efficiency, water efficiency, environmental protection indoor environmental quality, and other green and innovative features that contribute to better building performance.
BIFMA: Business and
Institutional Furniture
The BIFMA is buildings according to four key criteria including: 1. Energy (energy performance, demand reduction) 2. Environment (water, environmental care, materials) 3. Health (noise, air quality, thermal comfort, lighting and visual
comfort) 4. User quality (accessibility, functionality technical quality, safety)

93
Manufacturer’s
Association
GREENGUARD Label
The GREENGUARD Label is administered by a third-party company (UL Environment, a business unit of Underwriters Laboratories) and is focused specifically on emissions, toxicity and indoor air quality, tested in accordance to CA 01350. GREENGUARD certification is a standard that helps architects and contractors find products like paints, flooring, materials and even furniture that have low VOC (Volatile Organic Compound) emissions and are safe for indoor air quality. These GREENGUARD-certified paints are a good example of where you might see this label in practice and how it might be useful to you.
Annex 2. Mongolian standards for concrete block
№ Main suppliers Standards
1 МАК LLC MNS 831:2001
2 Dorniin tsas LLC MNS 831:2001
3 Mongol tashuur construction LLC MNS 6424:2013, MNS 5526:2005
4 Uliastai khungun concrete block LLC МNS 831:2001
5 Erdes concrete LLC МNS 831:2001
6 Sutain ach LLC MNS 5771-2007
7 Silikat LC
8 Chilagu LLC MNS 831:2001
9 General etolan LLC MNS 831-2001, Chalk MNS 347-2002 , Concrete MNS 3091-2008, Sand MNS 0392-1998, Water MNS 3821-85
10 Arga baril LLC /MNS 6054:2009//
11 Undram gan LLC MNS 5771- 2007
12 Eco panel LLC MNS 831:2001
13 Javkhlant LLC MNS 831:2001
14 Dulguun bars LLC MNS 831:2001
15 Altain gatsuurt LLC MNS 831:2001
18 Khaan diamond LLC MNS 831:2001