Research, Strategy and Targeting Preparing the Strategic ... 3_Research, Strategy... · ......
45
Campaign Skills Handbook Module 3 Research, Strategy and Targeng Preparing the Strategic Foundaon for Your Campaign
-
Upload
nguyendang -
Category
Documents
-
view
222 -
download
0
Transcript of Research, Strategy and Targeting Preparing the Strategic ... 3_Research, Strategy... · ......

Campaign SkillsHandbook
Module 3Research, Strategy and Targeting
Preparing the Strategic Foundation for Your Campaign

Module 3: Research, Strategy and Targeting
Introduction
Election campaigns are exciting opportunities for candidates and political parties to evaluate what it is they are truly offering the people of their country, and to strengthen their relationships with voters. The better a campaign team or political party plans and prepares for an election, the more it will gain and the stronger it will become.
This module focuses on the tools needed to answer the core questions of any campaign: how many votes will it take to win, and exactly where will the campaign find this support? Answers to these questions can be determined through certain types of research and strategic analysis. Candidates, campaign managers, and political parties must conduct research and analysis in advance of an election in order to manage resources effectively and maximize voter support.
The content of this module includes techniques to calculate the number of votes that a candidate or party will need in order to win on election day, as well as systems to determine where to go to find those votes. This workbook also covers how to research and understand voting trends, and how to assess the percentage of eligible voters who will actually vote on Election Day.
All of this information is used to inform and shape a campaign’s strategy, which is a statement that defines how it will win the election.
The following topics are covered:
1. What is Strategy?2. Research and Preparation: Systems of Election3. Research and Analysis: Voting Trends and Electoral Environment4. Setting a Vote Goal5. Voter Targeting: Geographic and Demographic6. Voter Analysis7. Defining Your Strategy
1
Module 3: Research, Strategy and Targeting
What is Strategy?
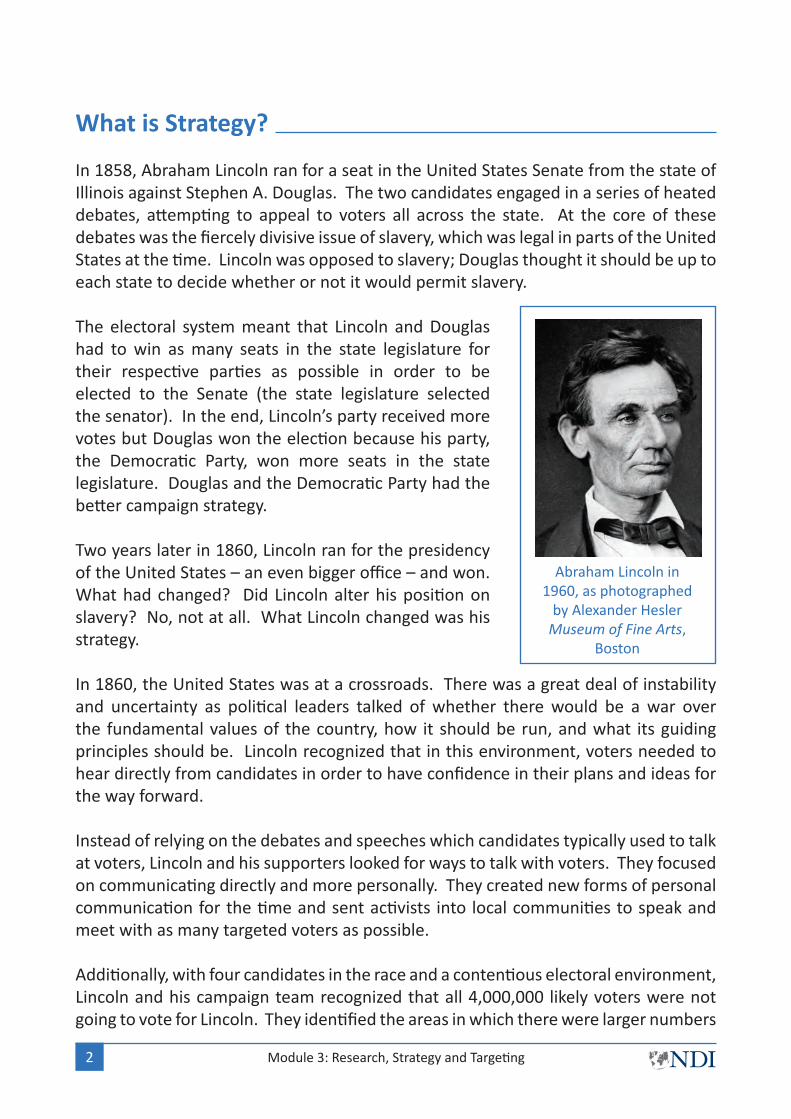
In 1858, Abraham Lincoln ran for a seat in the United States Senate from the state of Illinois against Stephen A. Douglas. The two candidates engaged in a series of heated debates, attempting to appeal to voters all across the state. At the core of these debates was the fiercely divisive issue of slavery, which was legal in parts of the United States at the time. Lincoln was opposed to slavery; Douglas thought it should be up to each state to decide whether or not it would permit slavery.
The electoral system meant that Lincoln and Douglas had to win as many seats in the state legislature for their respective parties as possible in order to be elected to the Senate (the state legislature selected the senator). In the end, Lincoln’s party received more votes but Douglas won the election because his party, the Democratic Party, won more seats in the state legislature. Douglas and the Democratic Party had the better campaign strategy.
Two years later in 1860, Lincoln ran for the presidency of the United States – an even bigger office – and won. What had changed? Did Lincoln alter his position on slavery? No, not at all. What Lincoln changed was his strategy.
In 1860, the United States was at a crossroads. There was a great deal of instability and uncertainty as political leaders talked of whether there would be a war over the fundamental values of the country, how it should be run, and what its guiding principles should be. Lincoln recognized that in this environment, voters needed to hear directly from candidates in order to have confidence in their plans and ideas for the way forward.
Instead of relying on the debates and speeches which candidates typically used to talk at voters, Lincoln and his supporters looked for ways to talk with voters. They focused on communicating directly and more personally. They created new forms of personal communication for the time and sent activists into local communities to speak and meet with as many targeted voters as possible.
Additionally, with four candidates in the race and a contentious electoral environment, Lincoln and his campaign team recognized that all 4,000,000 likely voters were not going to vote for Lincoln. They identified the areas in which there were larger numbers
2
Abraham Lincoln in 1960, as photographed
by Alexander Hesler Museum of Fine Arts,
Boston
Module 3: Research, Strategy and Targeting
of voters who were either going to vote for Lincoln or who would be likely to vote for Lincoln if they knew more about him, figured out how many votes they could gain if they concentrated their efforts almost entirely in these areas, and shifted resources to winning the support of anti-slavery voters who had not yet picked a candidate.
Lincoln’s strategy paid off. On November 6, 1860, he was elected the 16th president of the United States, defeating three other candidates, including his former rival Stephen Douglas.
A strategy is the formula for how a campaign will win an election. It explains how many votes you are going to get, from which voters you will get these votes, the activities you will use to engage these voters, the messages you will deliver to connect with these voters, and how you will distinguish yourself from your strongest opponents. Above all, a strategy outlines how a campaign will gain and sustain an advantage over opponents.
Activity 1: Strategy Assessment
Thinking about your next election, what would you say your strategy is? How many votes are you going to get? From which voters? What activities will you use to engage voters? What will your message be? What makes you different from other political parties and candidates?*_________________________________________________________________________________________________________________________________________________________________________________________________________________________________________________________________________________________________________________________________________________________
* The purpose of this exercise is to reflect on how you would describe your strategy. At this stage, your answers do not have to be precise. We will return to these questions again at the end of the module.
Many factors affect how a political party or campaign should approach an election campaign, including its available resources, how voters get their information, the electoral system, the number of voters who are likely to vote, the key issues that are important to voters, and so on. Most of these factors change from one election to another. As such, there is no single “best” campaign strategy.
However, a strong strategy starts with research: asking the right questions to help identify your existing advantages, as well as ones your campaign team can create. This module and Module 4, Voter Contact, will help you ask those questions and identify the best strategic options for your campaign.
3
Research and Preparation: Systems of Election
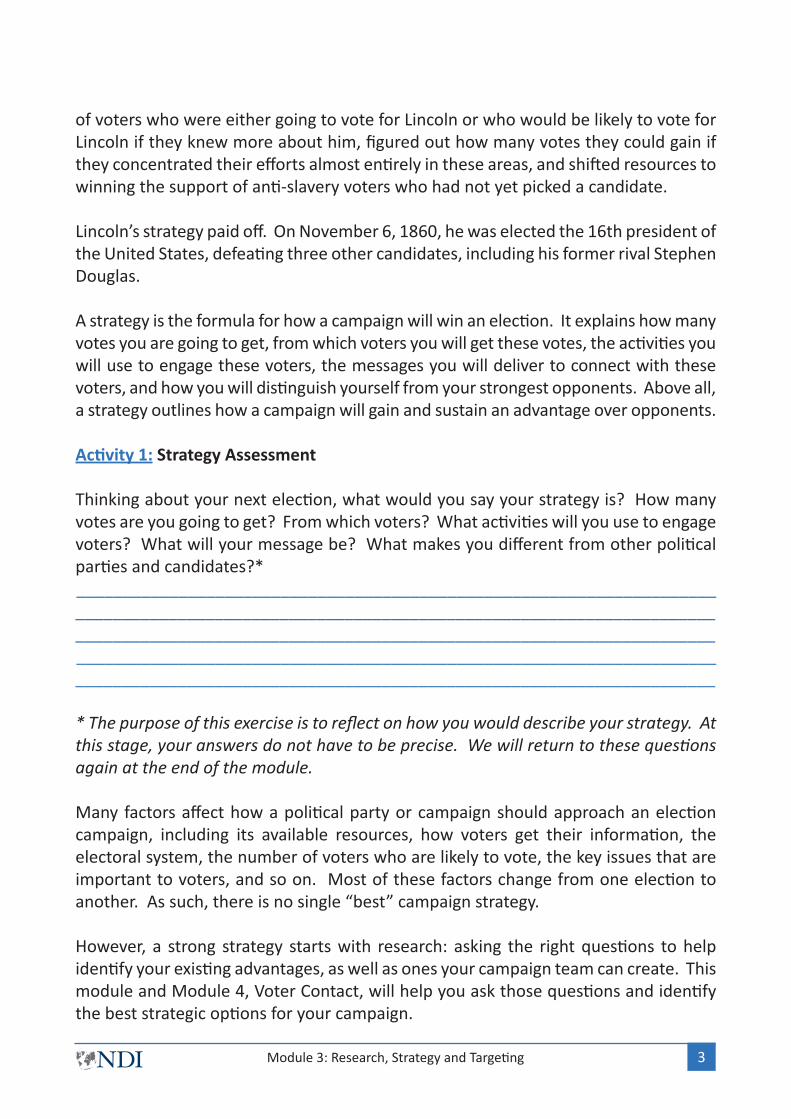
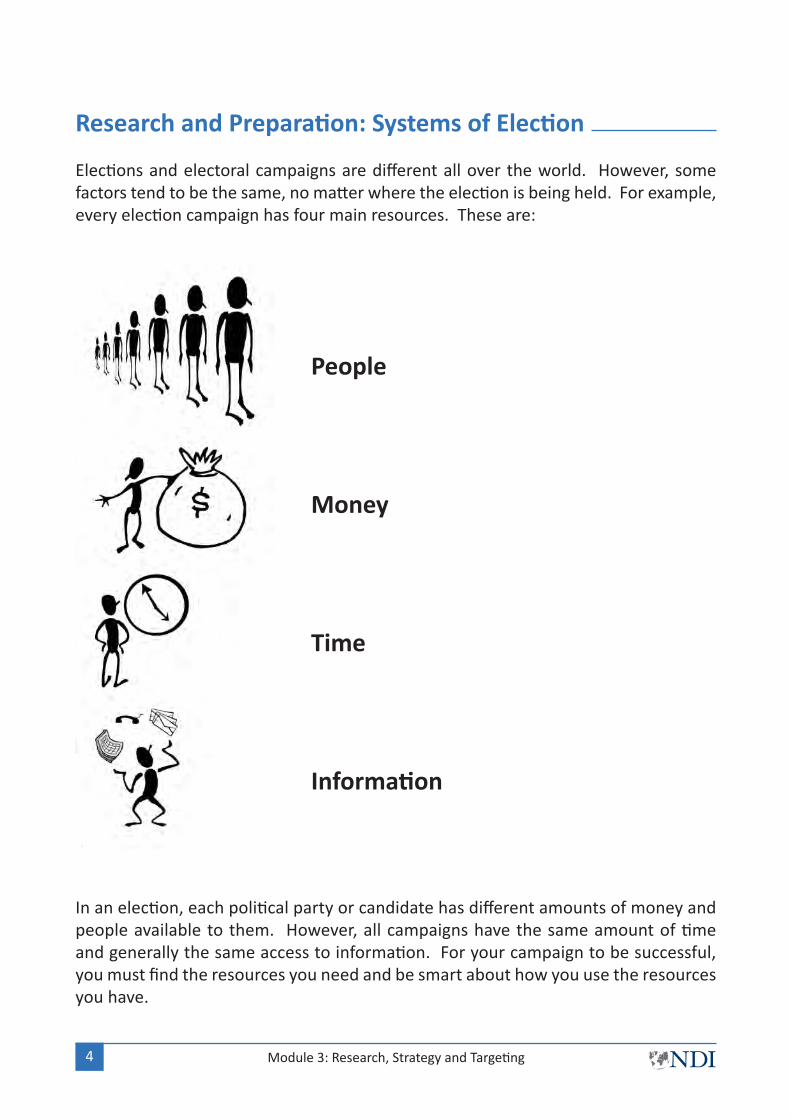
Elections and electoral campaigns are different all over the world. However, some factors tend to be the same, no matter where the election is being held. For example, every election campaign has four main resources. These are:
In an election, each political party or candidate has different amounts of money and people available to them. However, all campaigns have the same amount of time and generally the same access to information. For your campaign to be successful, you must find the resources you need and be smart about how you use the resources you have.
Module 3: Research, Strategy and Targeting4
People
Money
Time
Information

Module 3: Research, Strategy and Targeting 5
The Rule of Effective Resource Management states that an electoral campaign must target its limited resources only to those voters who are mostly likely to
support it.
Some of a campaign’s most important and challenging strategic decisions involve which voters and areas to concentrate on, and which ones to ignore.
No campaign has unlimited resources. And while there may be a temptation to try to communicate with every eligible voter, a smart and successful campaign will maximize the impact and effectiveness of its efforts by focusing its time, money, people and information only on the voters who are likely to support it on election day. Some of a campaign’s most important and challenging strategic decisions involve which voters and areas to concentrate on, and which ones to ignore.
This module and the ones that follow will walk you through the steps of maximizing each of these resource areas. The place to start is with an assessment of where you are now. This is the foundation upon which you can build your base of information.The first step is to look at the systems and structures for the election in which you are competing, as these will directly affect the type of campaign you will be able to organize. The activity below will help you begin to conduct your analysis.
Please note that the version of Activity 2 below focuses on a limited set of questions that a political party, candidate or electoral campaign must be able to answer when preparing for an election. Appendix 1 of this module contains a more comprehensive list of the issues a campaign is likely to face in an election. Parties, candidates and campaigns are encouraged to discuss the questions contained in this appendix to ensure they are fully prepared.
Activity 2: Electoral System and Legal Requirements
Answer the questions below to begin the research and analysis phase of preparing for an election.
What is the type of election or level of office that is being voted on? Is it local, district, regional or national?
_______________________________________________________________________________________________________________________________________________________________________________________________________________
1.
What is the system of voting? How are votes calculated?_______________________________________________________________________________________________________________________________________________________________________________________________________________
What are the rules for political parties and candidates? What do you have to do to be eligible to stand in this election? What are the legal requirements and deadlines?
_______________________________________________________________________________________________________________________________________________________________________________________________________________
What are the rules for voter registration? Will these have an impact on your supporters?
_______________________________________________________________________________________________________________________________________________________________________________________________________________
What are the restrictions on campaigning? When can you communicate with voters and when can you not? Are any forms of voter contact restricted or prohibited? Are there restrictions on what language, colors or images your campaign can use?
_______________________________________________________________________________________________________________________________________________________________________________________________________________
What are the rules about fundraising? Are there restrictions on the amount of money you can raise or spend? Can you raise money from abroad or from non-citizens?
_______________________________________________________________________________________________________________________________________________________________________________________________________________
Every system of elections creates advantages for some parties and disadvantages for others. What advantages does the current system create for your party? What disadvantages or challenges does it create?
_______________________________________________________________________________________________________________________________________________________________________________________________________________
Module 3: Research, Strategy and Targeting6
2.
3.
4.
5.
6.
7.
Research and Analysis: Voting Trends and Electoral Environment
One of the key strategic questions for every campaign is who will be voting in this election. Who is actually eligible to vote under the rules or regulations governing the election? Among those who are eligible, who is registered and therefore able to cast a ballot on Election Day? Among those who are registered, who is actually coming out and voting on Election Day? As a campaign begins to look at the answers to these questions, the population with whom it is trying to communicate can become increasingly smaller and more precise, which makes a very real difference in how a campaign is run.
It is important to think through what is happening among the voters, how they feel about voting, about the election and about politics in general, all of which will have a direct impact on how you conduct your campaign. This is done by looking for trends among voters and examining the electoral environment.
Voting Trends
Over time, even over a short period of elections, trends can begin to emerge among the electorate. Voting trends provide indications about voters’ behavior, and particularly what types of voters are more likely to vote, and what types of voters are less likely to vote.
There is an important difference between the number of people who are eligible to vote in an election, and the number of people who will actually go out and vote, i.e., the rate of voter turnout. It is critical that political parties and candidates calculate what these figures are, what types of people are more likely to vote, and how the electoral environment will affect both voter turnout and support for your party.
Module 3: Research, Strategy and Targeting 7
To identify voter trends:
Examine the results from past elections.
It is best to use turnout figures for similar elections. For example, look at the figures for parliamentary elections to estimate turnout for a parliamentary election, local for local elections, etc.
Turnout figures are typically maintained by the country’s official election regulatory body or government department tasked with overseeing elections and should be publically available. If the election body is unreliable, unable or unwilling to share data, this information may be available from domestic or international election monitoring groups or may have been tracked by national or international media covering the election.
Track overall voter turnout
Ideally, it is best to have several examples of the same types of elections, e.g., several parliamentary, presidential, local or regional elections from different years. However, if there have not been very many elections or if there has been a significant change in the political environment or system of elections, then use whatever information is available.
Module 3: Research, Strategy and Targeting8
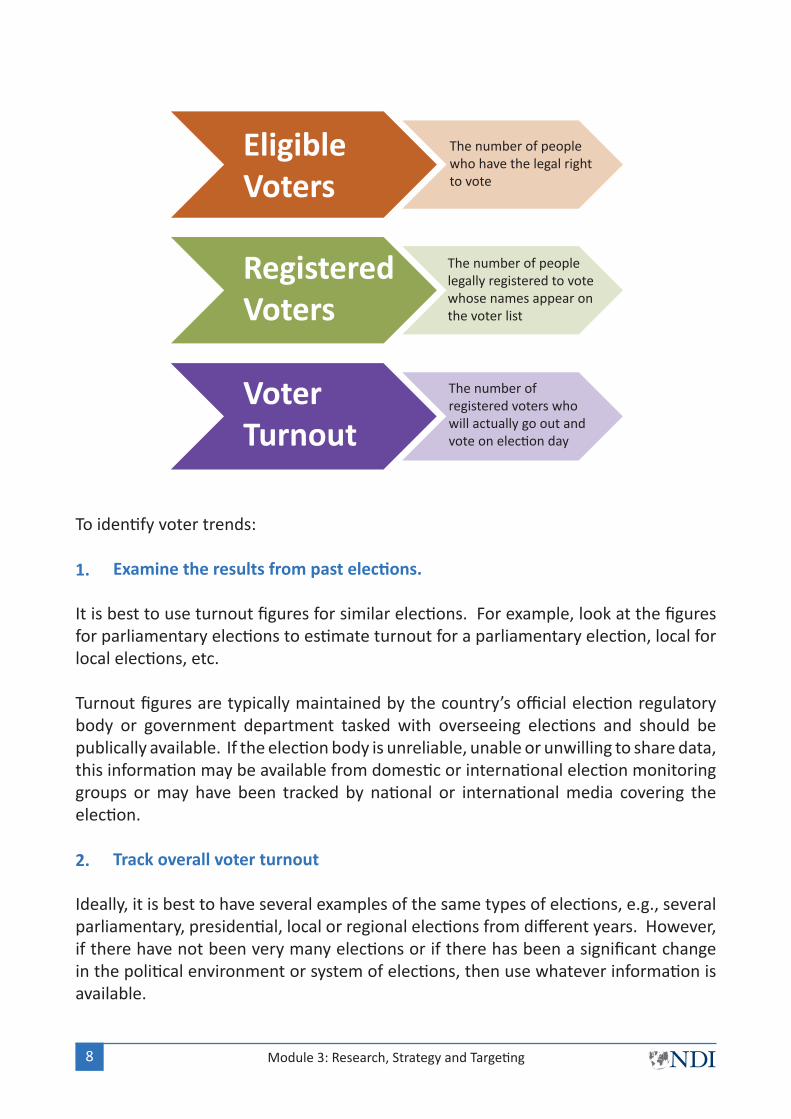
EligibleVoters
RegisteredVoters
VoterTurnout
The number of people who have the legal right to vote
The number of people legally registered to vote whose names appear on the voter list
The number of registered voters who will actually go out and vote on election day
1.
2.

If there is no information on turnout or if the information you have access to is unreliable, skip to the next section on Electoral Environment.
If you have several years of elections to work with, track trends in voter turnout for the most recent years. For example:
Year Type of Election Turnout
1998 Parliamentary 89%
2003 Parliamentary 73%
2005 Parliamentary 62%
2010 Parliamentary 58%
The average turnout from the last four parliamentary elections is 70.5%. However, what is more interesting is the trend in voter turnout. In this example, is turnout going up, down, or staying the same? Over the past four elections, it has gone down significantly. The trend is for a decline in the level of voter turnout. What does this mean for all political parties competing for elections in this environment?
Assess turnout among key groups
Demographics are the statistical characteristics of a population. In other words, if you were to paint a picture of a society, what would it look like? Would the faces in the painting be more of older people, younger, or a mix? If people were at work in the painting, what would they be doing? Would many be holding the tools of a farmer, doing the work of a vendor, or carrying the books of a professor? Would there be more female faces or more male faces?
Every society can be broken down into different groups based on similar characteristics, such as age, gender, religion, education, profession, background, etc. These are called demographic groups. When it comes to politics, people from similar groups sometimes behave in a similar way, or make similar choices.
Populations can also be examined based on where they live or where they come from. These are called geographic groups. Again, people from similar areas can sometimes make similar choices.
Campaigns look at demographic and geographic information to explore what is happening among specific groups in society, and what the trends in their voting behavior might be (i.e., are they going to vote and who are they likely to vote for?). Some groups will carry more strategic importance for your campaign than others.
Module 3: Research, Strategy and Targeting 9
3.
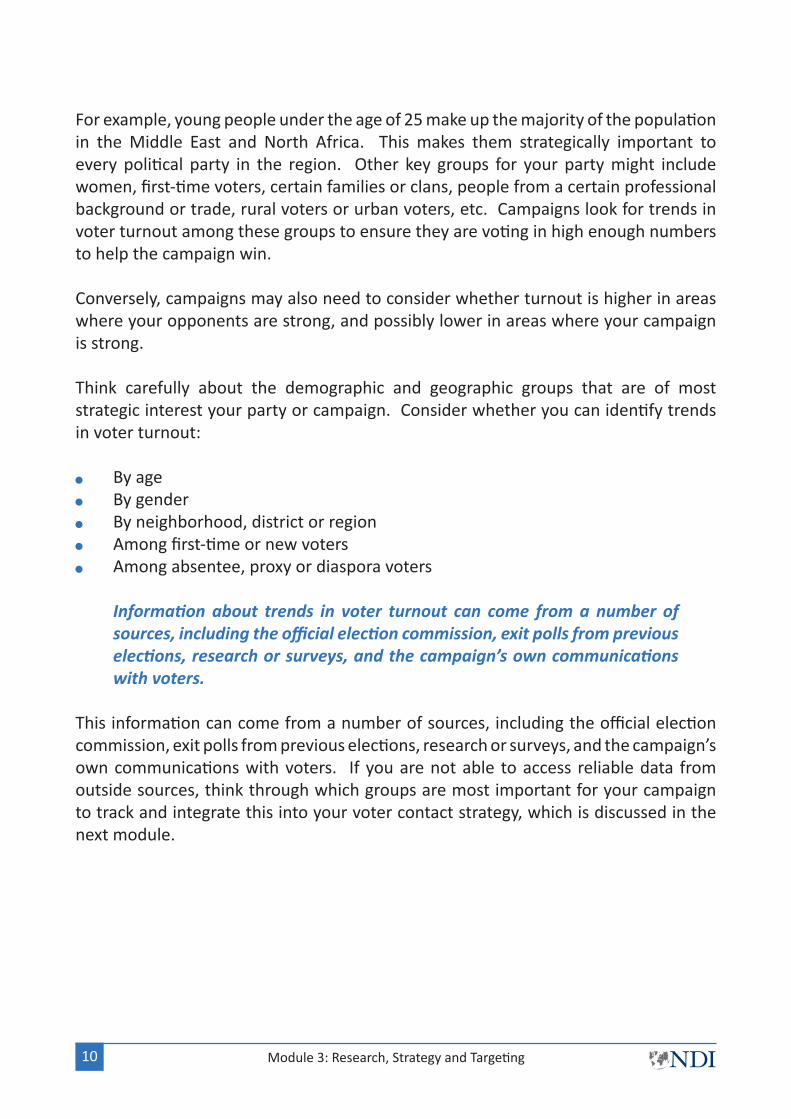
For example, young people under the age of 25 make up the majority of the population in the Middle East and North Africa. This makes them strategically important to every political party in the region. Other key groups for your party might include women, first-time voters, certain families or clans, people from a certain professional background or trade, rural voters or urban voters, etc. Campaigns look for trends in voter turnout among these groups to ensure they are voting in high enough numbers to help the campaign win.
Conversely, campaigns may also need to consider whether turnout is higher in areas where your opponents are strong, and possibly lower in areas where your campaign is strong.
Think carefully about the demographic and geographic groups that are of most strategic interest your party or campaign. Consider whether you can identify trends in voter turnout:
By ageBy genderBy neighborhood, district or regionAmong first-time or new votersAmong absentee, proxy or diaspora voters
Information about trends in voter turnout can come from a number of sources, including the official election commission, exit polls from previous elections, research or surveys, and the campaign’s own communications with voters.
This information can come from a number of sources, including the official election commission, exit polls from previous elections, research or surveys, and the campaign’s own communications with voters. If you are not able to access reliable data from outside sources, think through which groups are most important for your campaign to track and integrate this into your voter contact strategy, which is discussed in the next module.
Module 3: Research, Strategy and Targeting10
Activity 3: Estimating Trends in Voter Turnout
Take the returns from past elections and examine the figures on voter turnout. Use the systems outlined in Step 2 above to track overall turnout. What trends can you identify, if any?
____________________________________________________________________________________________________________________________________________________________________________________________________________________________________________________________________________________
How are these figures likely to affect your campaign?____________________________________________________________________________________________________________________________________________________________________________________________________________________________________________________________________________________
Think through what demographic and/or geographic groups are most strategically important to your campaign. List them below.
____________________________________________________________________________________________________________________________________________________________________________________________________________________________________________________________________________________
If you can access information on turnout among certain groups or in certain areas, consider the questions below. Do the results have any impact on the list of strategically important groups you made in Question 3?
What has happened in past elections? What groups are voting in higher numbers and what groups are voting in lower numbers?
____________________________________________________________________________________________________________________________________________________________________________________________________________________________________________________________________________________
What do you think are the main factors influencing why turnout is higher among some groups and lower among others?
____________________________________________________________________________________________________________________________________________________________________________________________________________________________________________________________________________________
Module 3: Research, Strategy and Targeting 11
1.
2.
3.
4.
a.
b.
Are any groups of voters being left behind, i.e., are there larger populations, such as older people, women, first-time voters, etc., who are voting in significantly lower numbers? Could any of these voters represent an opportunity for your party to try to pick up new supporters during the election campaign?
____________________________________________________________________________________________________________________________________________________________________________________________________________________________________________________________________________________
Electoral Environment
The electoral environment can influence voter turnout and is different for almost every election. The electoral environment is the general mood or atmosphere surrounding an election.
The electoral environment is the general mood or atmosphere surrounding an election.
Are voters excited or motivated by the current election? Are voters experiencing a high level of disappointment or disillusion? Are voters angry or frustrated? Are there security concerns? These feelings can influence how voters feel about the parties competing in an election and their desire to actually cast a ballot.
The general mood of the electorate is similar to the pendulum on a clock. Depending on what is going well or going badly in their own lives, in their communities or in the country, the electoral environment will tend to favor either maintaining the status quo (returning the governing parties to power) or making a change (supporting parties in the opposition). These trends impact the level of motivation that voters experience to actually go out and vote on Election Day.
Before an election, gauge where the overall mood of the electorate sits on the pendulum. Are voters angry or frustrated? Are they calling for change? Are some voters more mobilized to vote for change than others?
Conversely, are voters jubilant, enthusiastic or simply content? Are they happy with the way things are, or afraid of what the alternative might bring? Will they be more likely to come out and vote in their excitement, or will their sense of contentment keep them at home on Election Day?
Module 3: Research, Strategy and Targeting12
c.
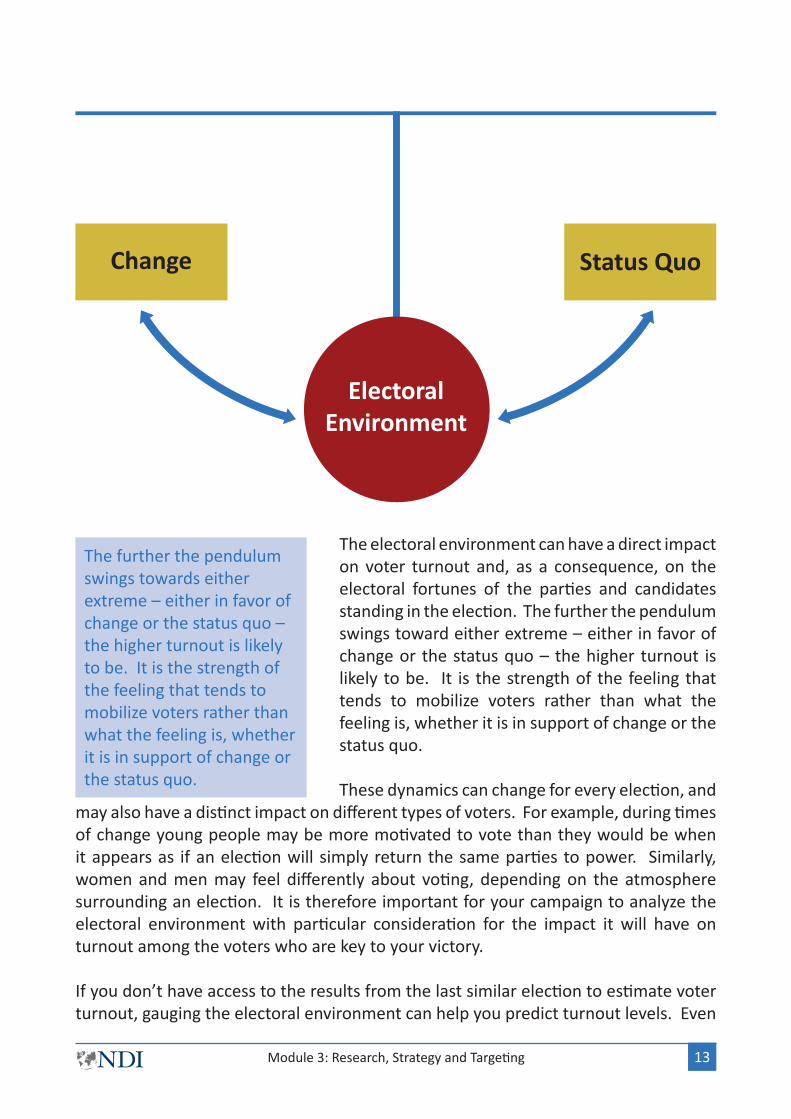
The electoral environment can have a direct impact on voter turnout and, as a consequence, on the electoral fortunes of the parties and candidates standing in the election. The further the pendulum swings toward either extreme – either in favor of change or the status quo – the higher turnout is likely to be. It is the strength of the feeling that tends to mobilize voters rather than what the feeling is, whether it is in support of change or the status quo.
These dynamics can change for every election, and may also have a distinct impact on different types of voters. For example, during times of change young people may be more motivated to vote than they would be when it appears as if an election will simply return the same parties to power. Similarly, women and men may feel differently about voting, depending on the atmosphere surrounding an election. It is therefore important for your campaign to analyze the electoral environment with particular consideration for the impact it will have on turnout among the voters who are key to your victory.
If you don’t have access to the results from the last similar election to estimate voter turnout, gauging the electoral environment can help you predict turnout levels. Even
Module 3: Research, Strategy and Targeting 13
ElectoralEnvironment
Change Status Quo
The further the pendulum swings towards either extreme – either in favor of change or the status quo – the higher turnout is likely to be. It is the strength of the feeling that tends to mobilize voters rather than what the feeling is, whether it is in support of change or the status quo.
if you have years of election figures to work with, it is still important to consider the current mood of the electorate and how this will affect your campaign.
To measure the electoral environment, look for indications of the general mood of the electorate in a number of areas, such as:
What are reliable polls or surveys saying? Are they showing a high number of undecided or disappointed voters? Or are they indicating there is excitement about the election?
If voters need to register themselves for the election, is the level of registration higher, lower or about the same for this election? (Registration cannot be used as an indicator if voters are automatically registered.)
Is there any reliable information about the trend among first-time or new voters? Are they interested or engaged in the election? First-time and younger voters are among the hardest to mobilize and their level of engagement in an election can be an indicator for whether the overall electorate is feeling energized, disenfranchised or frustrated.
What has been happening at public events around the election? Are they well-attended or poorly attended? What are voters saying and doing at these events?
Have there been street rallies, protests or demonstrations? What types of voters are participating in these? Or, is the situation relatively calm?
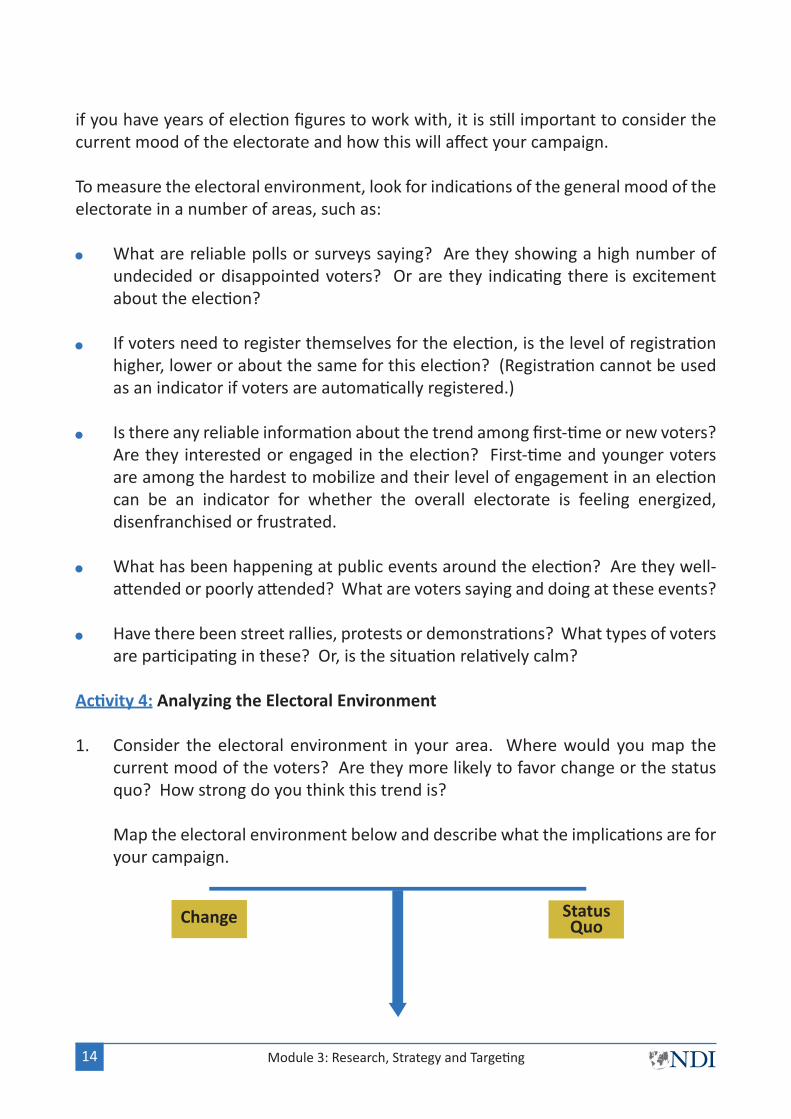
Activity 4: Analyzing the Electoral Environment
Consider the electoral environment in your area. Where would you map the current mood of the voters? Are they more likely to favor change or the status quo? How strong do you think this trend is?
Map the electoral environment below and describe what the implications are for your campaign.
Module 3: Research, Strategy and Targeting14
1.
Change Status Quo

____________________________________________________________________________________________________________________________________________________________________________________________________________________________________________________________________________________
Assessing Opportunities and Identifying Weaknesses
There are a number of other factors which affect both voter turnout and the way voters feel about your candidate, campaign or political party. Consider the following:
What base of support do you start with? What are the past elections results in the area for your party? (If you or your party has never stood in this area or in this type of election before, look at the results for similar parties or candidates in past elections.)
What are the results for other parties which are competing? Who is/are your strongest opponent(s)? Opponents are parties or candidates that are competing for the same voters you are trying to persuade and mobilize. If a party can prevent you from picking up the seats you are seeking to win, even if they’re not strong enough to win the seats themselves but can undermine your efforts by splitting your vote or pulling away your supporters, then they are an opponent.
Are there any emerging social, political or economic developments that offer opportunities or challenges for you?
What is your track record on policy, legal and financial issues? Compare what you have said you would do to what you have actually done.
What do the voters like about you? What issues have you delivered on that are important to voters?
What is your opponent’s track record on policy, legal and financial issues? Compare what they have said they would do to what they have actually done.
What do the voters like about your opponent(s)? What issues have they delivered on that are important to voters?
Consider the electoral area in which you will be competing. What does it look like? What are the geographic size and characteristics? How many voters live there? What is the best way to communicate with voters in this area?
Module 3: Research, Strategy and Targeting 15
What have past, similar campaigns cost? Do you have the resources in place or can you raise the resources you will need to meet the financial challenge?
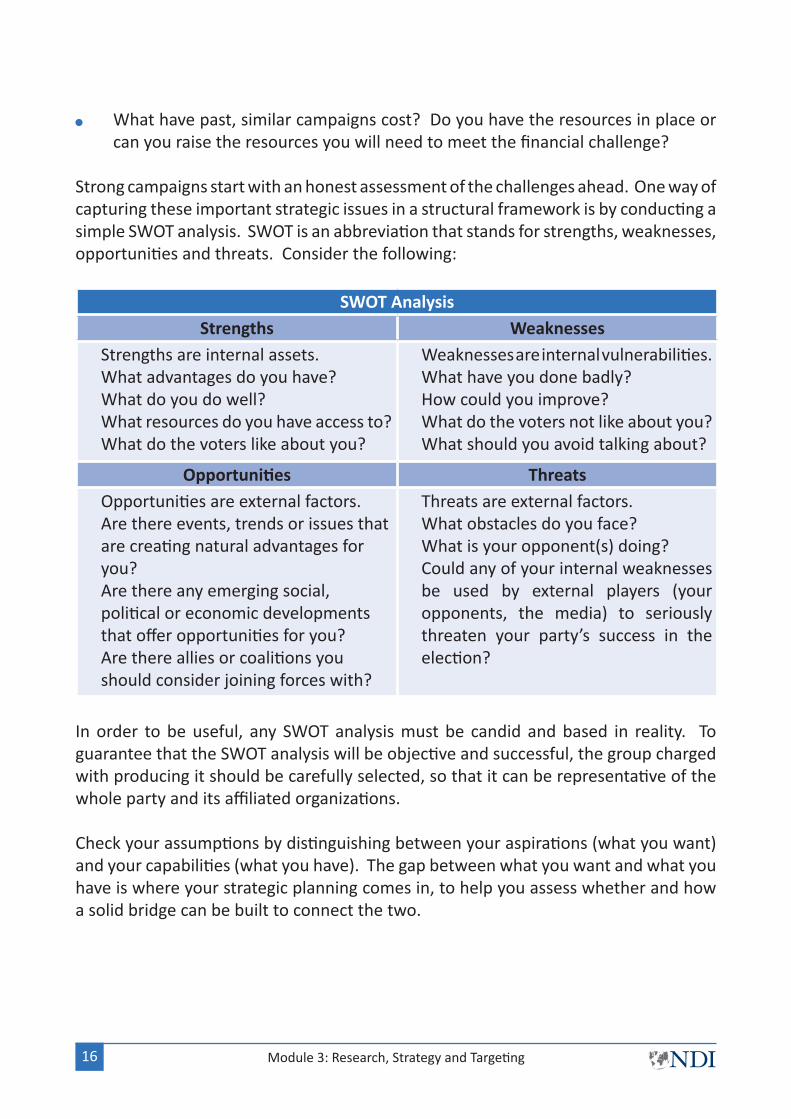
Strong campaigns start with an honest assessment of the challenges ahead. One way of capturing these important strategic issues in a structural framework is by conducting a simple SWOT analysis. SWOT is an abbreviation that stands for strengths, weaknesses, opportunities and threats. Consider the following:
SWOT AnalysisStrengths Weaknesses
Strengths are internal assets.What advantages do you have?What do you do well?What resources do you have access to?What do the voters like about you?
Weaknesses are internal vulnerabilities.What have you done badly?How could you improve?What do the voters not like about you?What should you avoid talking about?
Opportunities ThreatsOpportunities are external factors.Are there events, trends or issues that are creating natural advantages for you?Are there any emerging social, political or economic developments that offer opportunities for you?Are there allies or coalitions you should consider joining forces with?
Threats are external factors.What obstacles do you face?What is your opponent(s) doing?Could any of your internal weaknesses be used by external players (your opponents, the media) to seriously threaten your party’s success in the election?
In order to be useful, any SWOT analysis must be candid and based in reality. To guarantee that the SWOT analysis will be objective and successful, the group charged with producing it should be carefully selected, so that it can be representative of the whole party and its affiliated organizations.
Check your assumptions by distinguishing between your aspirations (what you want) and your capabilities (what you have). The gap between what you want and what you have is where your strategic planning comes in, to help you assess whether and how a solid bridge can be built to connect the two.
Module 3: Research, Strategy and Targeting16
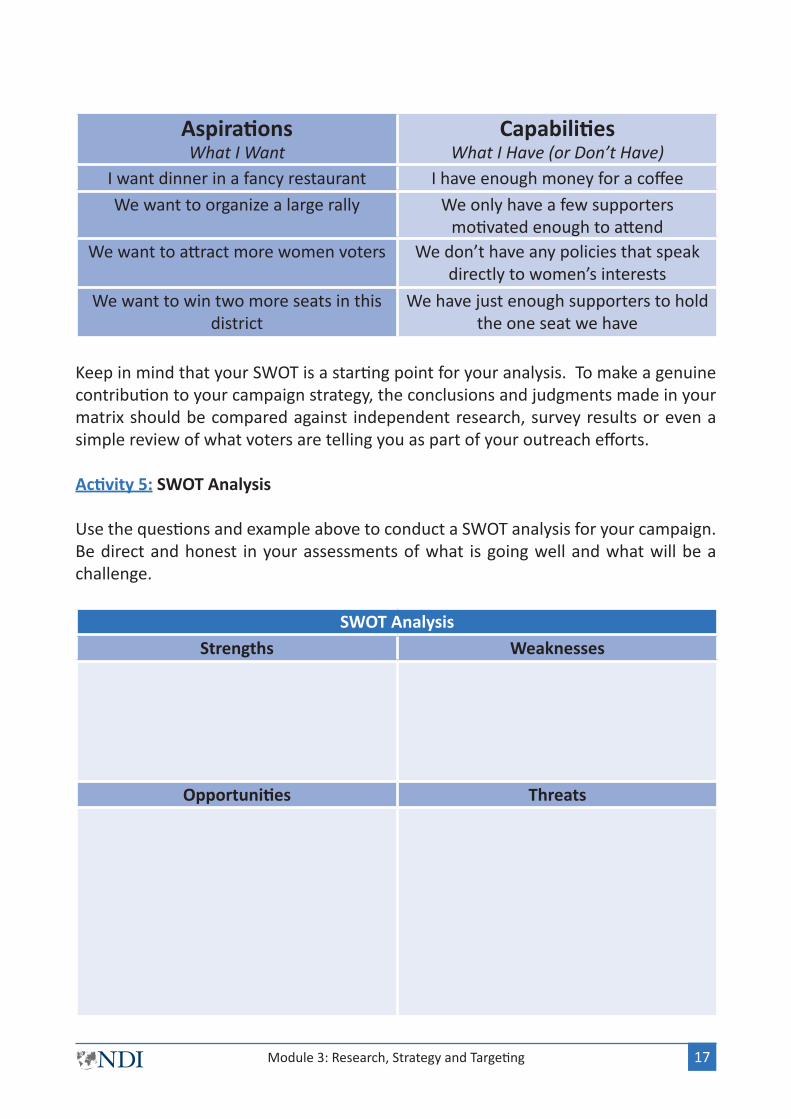
AspirationsWhat I Want
CapabilitiesWhat I Have (or Don’t Have)
I want dinner in a fancy restaurant I have enough money for a coffeeWe want to organize a large rally We only have a few supporters
motivated enough to attendWe want to attract more women voters We don’t have any policies that speak
directly to women’s interests
We want to win two more seats in this district
We have just enough supporters to hold the one seat we have
Keep in mind that your SWOT is a starting point for your analysis. To make a genuine contribution to your campaign strategy, the conclusions and judgments made in your matrix should be compared against independent research, survey results or even a simple review of what voters are telling you as part of your outreach efforts. Activity 5: SWOT Analysis
Use the questions and example above to conduct a SWOT analysis for your campaign. Be direct and honest in your assessments of what is going well and what will be a challenge.
SWOT AnalysisStrengths Weaknesses
Opportunities Threats
Module 3: Research, Strategy and Targeting 17
Setting a Vote Goal
A campaign’s vote goal is the number of votes it will need to win an election. This information is vital for campaign planning, as well as managing resources and strategy.
Vote goals must be determined for each electoral area separately. So, if your party is competing in legislative elections in which the country is divided into constituencies or districts, then a vote goal must be set for each constituency or district. If this is a national election with a single ballot, then the vote goal must be set nationally. Parties or campaigns that have collected sufficient data may even be able to set vote goals by polling station or neighborhood.
The way in which a vote goal is calculated depends on the electoral system. For example, a vote goal is set differently for a proportional representation (PR) system with closed party lists than it is for a first-past-the-post system, or even a PR system with open lists. In general, however, the steps are the following:
Identify the Number of Seats in the electoral area. Is it a single-member constituency, multi-member shared constituency, or national PR system? How many seats is the party competing for?
Determine the number of eligible Registered Voters in the electoral area. Look at the voter list or register to get this figure. Sometimes you can discover who the registered voters are by looking at lists for distribution of food aid or social benefits. If this information is not readily available, look at levels of voter turnout in previous elections for the area.
Estimate what Voter Turnout is likely to be for the area. Voter Turnout is the percentage of eligible, registered voters who turn up to vote on Election Day. Base your estimate on an assessment of recent similar elections in terms of level of office (look at results from local elections to assess turnout for local elections, regional elections to assess turnout for regional elections, parliamentary elections to assess turnout for parliamentary elections, etc.). You can also base your estimate on reliable, objective and recent polls, conducted by professional non-partisan polling agencies. Consider the current electoral environment
Voter turnout tends to be different for every level of office, so you cannot make assumptions about one type of election based on another type. For example, in some areas, voters are much more interested in local elections; in other areas, voters are more likely to turnout if it’s a national election.
Module 3: Research, Strategy and Targeting18
1.
2.
3.
Also, consider the degree of competitiveness for the election: e.g., number of candidates or parties standing, number of incumbents standing for reelection, level of public interest in the election, etc. These factors will affect voter interest and turnout.
Finally, think about the overall electoral environment, whether it trends towards change or the status quo, how strong voter sentiment is, and how you think this will affect turnout.
Based on estimated voter turnout, calculate how many votes it will take to Win One Seat. This will be different depending on the electoral system.
In First Past the Post (FPP) or plurality systems, the safest way to calculate a winnable seat is to divide the number of estimated voters (projected turnout) by 2 and then add 1 (50% +1). Although there may be more than two candidates in the race, 50% +1 is the only figure that guarantees a win. If, for example, voter turnout is likely to be 100,000 voters, the seat will be won with 50,001 votes (100,000/50,000 + 1 = 50,001).
In PR systems with closed party lists, divide the number of seats in the district by the projected number of voters. This gives you the threshold for one seat. If, for example, there are likely to be 100,000 valid votes cast and there are 5 seats in the district, then you will need 20,000 votes to win one seat. In calculating a vote goal for PR systems, it is best to estimate these raw figures first before considering any possible remainders.
Block voting systems are calculated in a manner similar to FPP. If a majority of votes must be won in order to carry the district (i.e., if there is a run-off system in place), the only safe vote goal is 50% of the likely votes cast + 1. If it is a plurality system, the winning party will not have to reach this threshold. In this case, the vote goal could be calculated based on the number of likely voters, the number of party tickets in the election, and an assessment of what you will have to do to beat the vote of all the other parties.
In Single Transferable Vote systems, look at how many votes it will likely take to make quota. Quota is typically calculated by dividing the number of votes cast by the number of seats, then adding 1. If it is unlikely your candidate will make quota, consider which candidates will be disqualified first and whether their votes will transfer to your party.
Module 3: Research, Strategy and Targeting 19
4.
a.
b.
c.
d.
In PR systems with open lists, calculating a vote goal is directly tied to how votes will be calculated. Projecting a vote goal for this type of system requires a fair amount of research and analysis, looking at past voting trends for your party and the level of popularity and name recognition of individual candidates.
The number of votes a campaign will need to capture the number of seats they want to win is the Vote Goal.
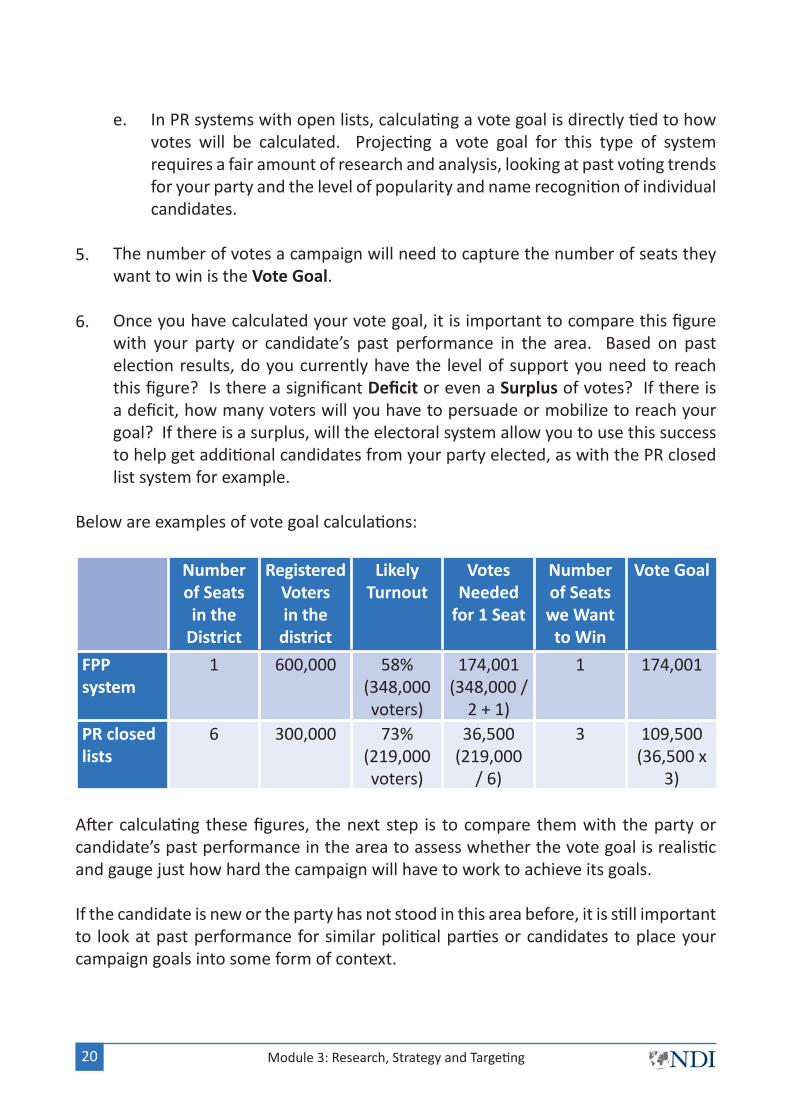
Once you have calculated your vote goal, it is important to compare this figure with your party or candidate’s past performance in the area. Based on past election results, do you currently have the level of support you need to reach this figure? Is there a significant Deficit or even a Surplus of votes? If there is a deficit, how many voters will you have to persuade or mobilize to reach your goal? If there is a surplus, will the electoral system allow you to use this success to help get additional candidates from your party elected, as with the PR closed list system for example.
Below are examples of vote goal calculations:
Number of Seats in the
District
Registered Voters in the
district
Likely Turnout
Votes Needed
for 1 Seat
Number of Seats we Want
to Win
Vote Goal
FPP system
1 600,000 58% (348,000 voters)
174,001 (348,000 /
2 + 1)
1 174,001
PR closed lists
6 300,000 73% (219,000 voters)
36,500 (219,000
/ 6)
3 109,500 (36,500 x
3)
After calculating these figures, the next step is to compare them with the party or candidate’s past performance in the area to assess whether the vote goal is realistic and gauge just how hard the campaign will have to work to achieve its goals.
If the candidate is new or the party has not stood in this area before, it is still important to look at past performance for similar political parties or candidates to place your campaign goals into some form of context.
Module 3: Research, Strategy and Targeting20
e.
5.
6.
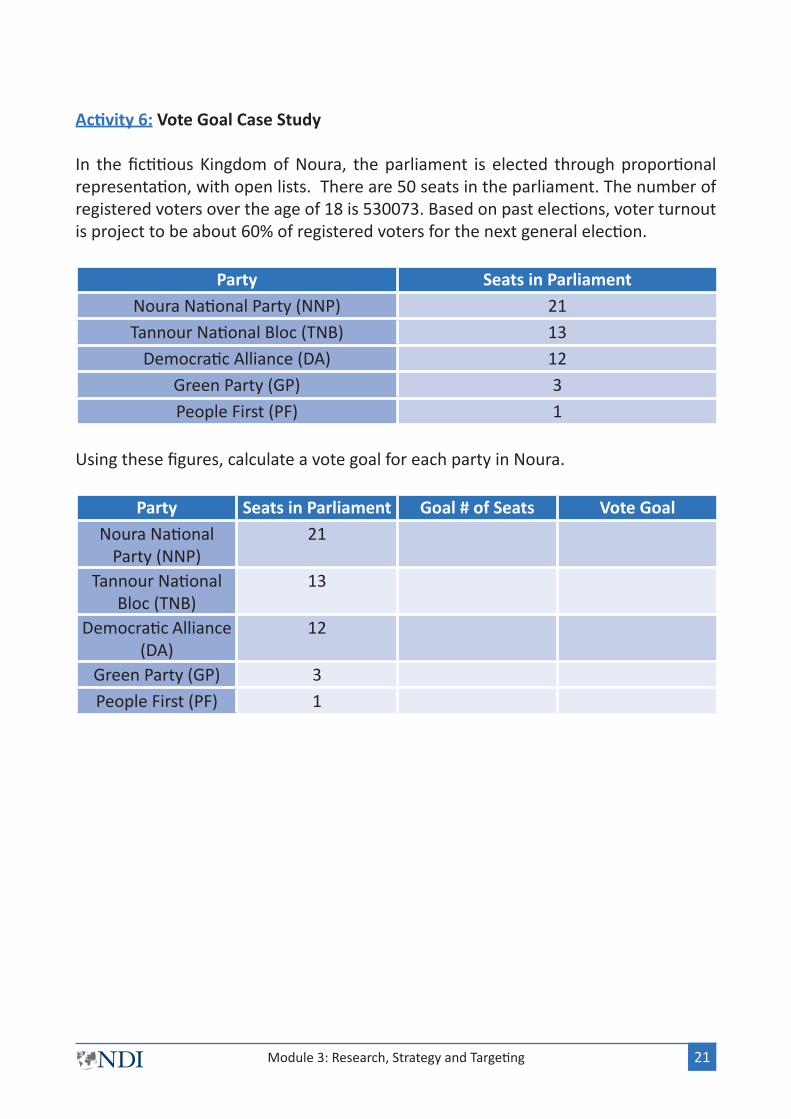
Activity 6: Vote Goal Case Study
In the fictitious Kingdom of Noura, the parliament is elected through proportional representation, with open lists. There are 50 seats in the parliament. The number of registered voters over the age of 18 is 530073. Based on past elections, voter turnout is project to be about 60% of registered voters for the next general election.
Party Seats in ParliamentNoura National Party (NNP) 21Tannour National Bloc (TNB) 13
Democratic Alliance (DA) 12Green Party (GP) 3People First (PF) 1
Using these figures, calculate a vote goal for each party in Noura.
Party Seats in Parliament Goal # of Seats Vote GoalNoura National
Party (NNP)21
Tannour National Bloc (TNB)
13
Democratic Alliance (DA)
12
Green Party (GP) 3People First (PF) 1
Module 3: Research, Strategy and Targeting 21
Geographic Targeting
Geographic targeting is an excellent tool for every campaign. This technique helps a campaign clearly identify where, amongst the hundreds of thousands or millions of voters in the country, its supporters and potential supporters live. This provides the campaign with key strategic information about where to spend precious resources, how you are going to reach your vote goal, and what voters are going to get you there.
With additional analysis, geographic targeting can also help a campaign learn more about the types of people who support the campaign or who are likely to support the campaign. This is called demographic targeting and it is covered in the next section.
To conduct geographic targeting, you will need the results from the last similar election by the smallest geographical unit possible, such as electoral ward or polling station. (See the note below on what to do if you cannot get the election returns.) The smaller the unit, the more accurate your targeting will be.
Examine these results and compare how well your party or candidate did in each area compared to its strongest opponents. You are making an assessment of how competitive the area is for your campaign. In other words, how hard are you going to have to work to win in this area? Based on these past results, categorize each area as one of the following for your campaign:
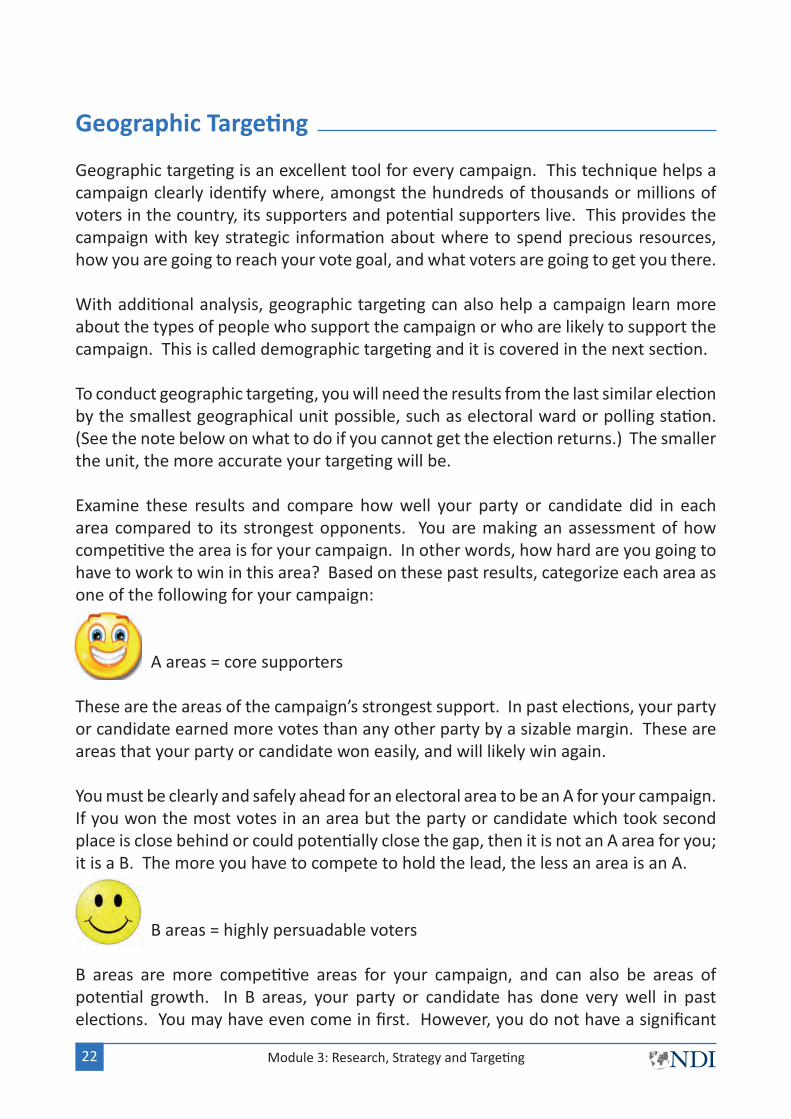
A areas = core supporters
These are the areas of the campaign’s strongest support. In past elections, your party or candidate earned more votes than any other party by a sizable margin. These are areas that your party or candidate won easily, and will likely win again.
You must be clearly and safely ahead for an electoral area to be an A for your campaign. If you won the most votes in an area but the party or candidate which took second place is close behind or could potentially close the gap, then it is not an A area for you; it is a B. The more you have to compete to hold the lead, the less an area is an A.
B areas = highly persuadable voters
B areas are more competitive areas for your campaign, and can also be areas of potential growth. In B areas, your party or candidate has done very well in past elections. You may have even come in first. However, you do not have a significant
Module 3: Research, Strategy and Targeting22
advantage over other parties or candidates and must work hard to maintain your lead or grow your vote.
Your campaign is strong in B areas and there is potential for expanding your support, but hard work and an investment of resources will be required.
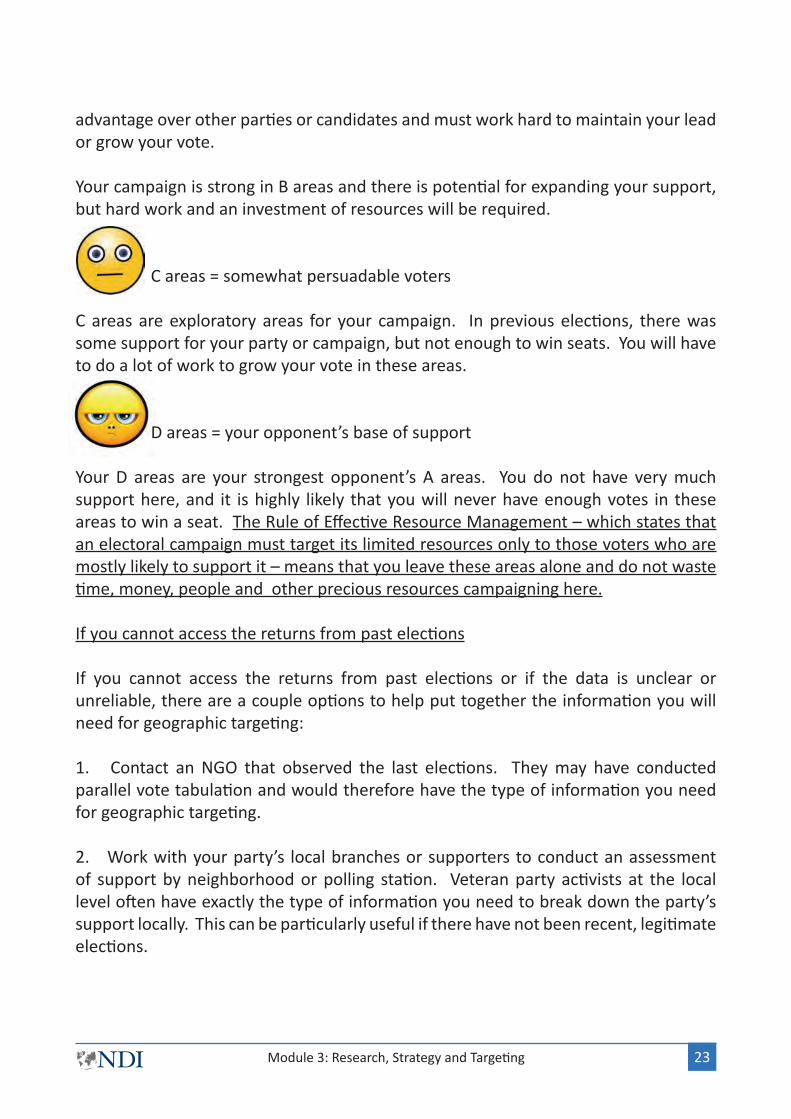
C areas = somewhat persuadable voters
C areas are exploratory areas for your campaign. In previous elections, there was some support for your party or campaign, but not enough to win seats. You will have to do a lot of work to grow your vote in these areas.
D areas = your opponent’s base of support
Your D areas are your strongest opponent’s A areas. You do not have very much support here, and it is highly likely that you will never have enough votes in these areas to win a seat. The Rule of Effective Resource Management – which states that an electoral campaign must target its limited resources only to those voters who are mostly likely to support it – means that you leave these areas alone and do not waste time, money, people and other precious resources campaigning here.
If you cannot access the returns from past elections
If you cannot access the returns from past elections or if the data is unclear or unreliable, there are a couple options to help put together the information you will need for geographic targeting:
1. Contact an NGO that observed the last elections. They may have conducted parallel vote tabulation and would therefore have the type of information you need for geographic targeting.
2. Work with your party’s local branches or supporters to conduct an assessment of support by neighborhood or polling station. Veteran party activists at the local level often have exactly the type of information you need to break down the party’s support locally. This can be particularly useful if there have not been recent, legitimate elections.
Module 3: Research, Strategy and Targeting 23
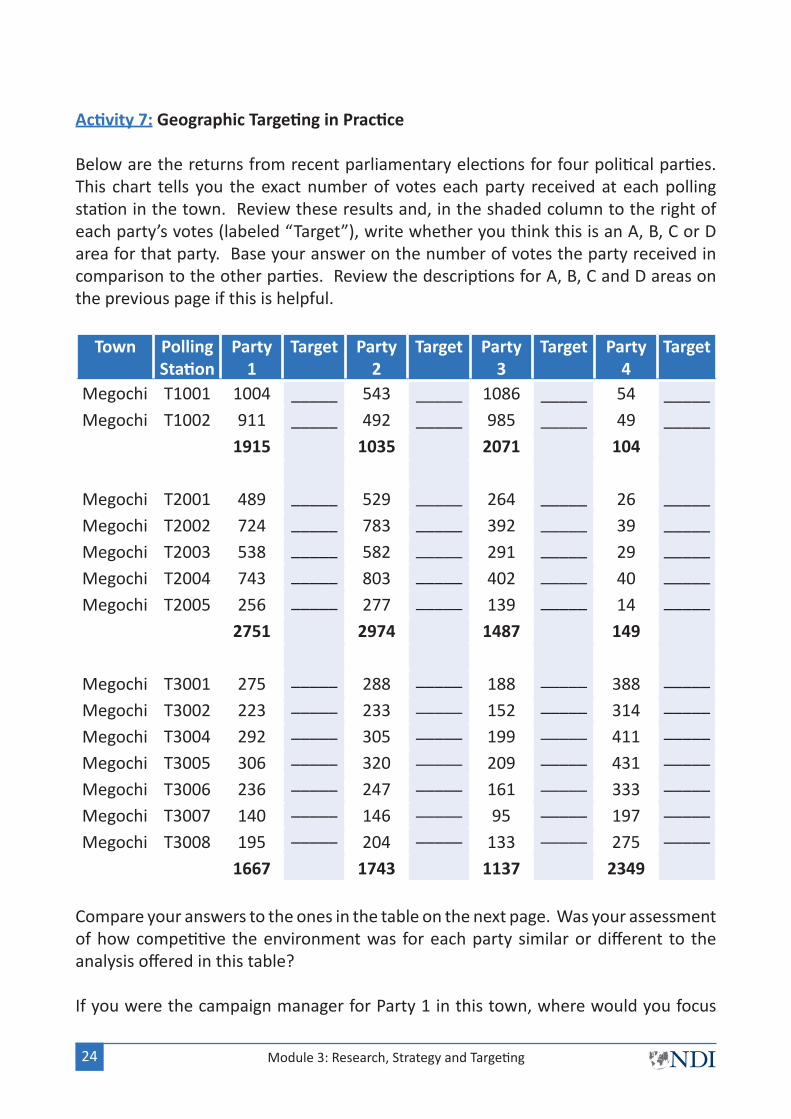
Activity 7: Geographic Targeting in Practice
Below are the returns from recent parliamentary elections for four political parties. This chart tells you the exact number of votes each party received at each polling station in the town. Review these results and, in the shaded column to the right of each party’s votes (labeled “Target”), write whether you think this is an A, B, C or D area for that party. Base your answer on the number of votes the party received in comparison to the other parties. Review the descriptions for A, B, C and D areas on the previous page if this is helpful.
Town Polling Station
Party 1
Target Party 2
Target Party 3
Target Party 4
Target
Megochi T1001 1004 __________
__________ _____ _____ _____
____________________ _____ _____ _____
543 __________
__________ _____ _____ _____
____________________ _____ _____ _____
1086 __________
__________ _____ _____ _____
____________________ _____ _____ _____
54 __________
__________ _____ _____ _____
____________________ _____ _____ _____
Megochi T1002 911 492 985 491915 1035 2071 104
Megochi T2001 489 529 264 26Megochi T2002 724 783 392 39Megochi T2003 538 582 291 29Megochi T2004 743 803 402 40Megochi T2005 256 277 139 14
2751 2974 1487 149
Megochi T3001 275 288 188 388Megochi T3002 223 233 152 314Megochi T3004 292 305 199 411Megochi T3005 306 320 209 431Megochi T3006 236 247 161 333Megochi T3007 140 146 95 197Megochi T3008 195 204 133 275
1667 1743 1137 2349 Compare your answers to the ones in the table on the next page. Was your assessment of how competitive the environment was for each party similar or different to the analysis offered in this table?
If you were the campaign manager for Party 1 in this town, where would you focus
Module 3: Research, Strategy and Targeting24
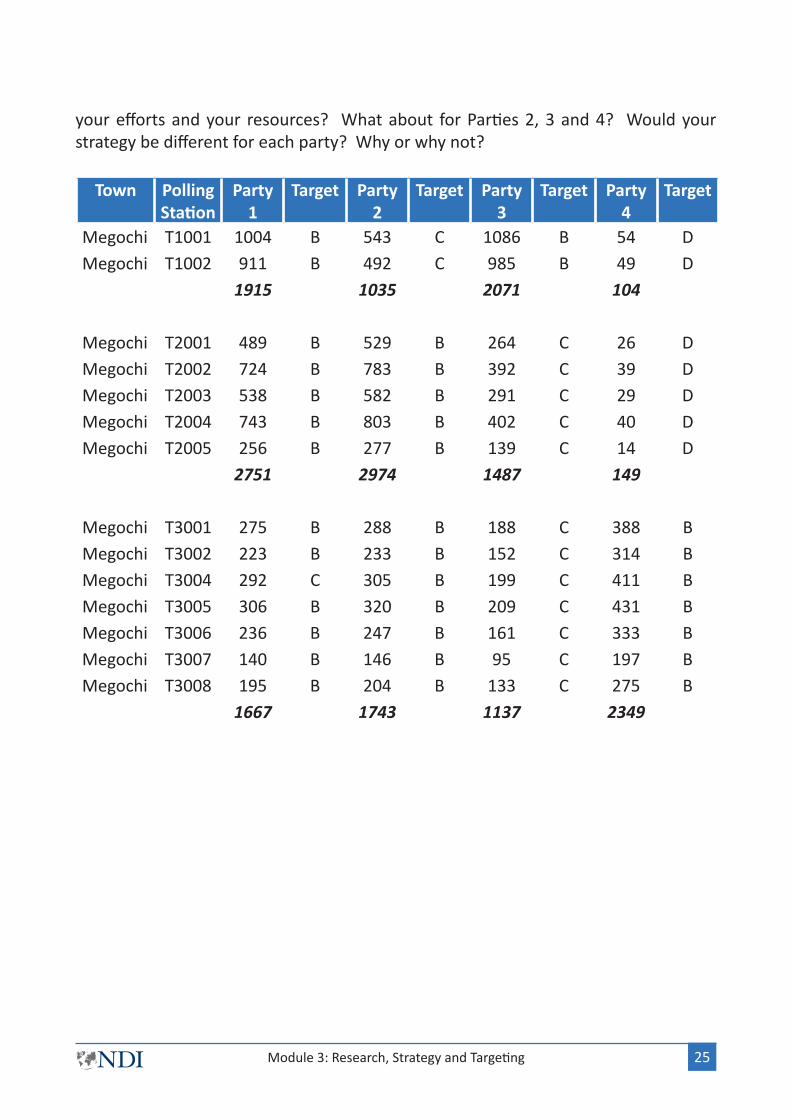
your efforts and your resources? What about for Parties 2, 3 and 4? Would your strategy be different for each party? Why or why not?
Town Polling Station
Party 1
Target Party 2
Target Party 3
Target Party 4
Target
Megochi T1001 1004 B 543 C 1086 B 54 DMegochi T1002 911 B 492 C 985 B 49 D
1915 1035 2071 104
Megochi T2001 489 B 529 B 264 C 26 DMegochi T2002 724 B 783 B 392 C 39 DMegochi T2003 538 B 582 B 291 C 29 DMegochi T2004 743 B 803 B 402 C 40 DMegochi T2005 256 B 277 B 139 C 14 D
2751 2974 1487 149
Megochi T3001 275 B 288 B 188 C 388 BMegochi T3002 223 B 233 B 152 C 314 BMegochi T3004 292 C 305 B 199 C 411 BMegochi T3005 306 B 320 B 209 C 431 BMegochi T3006 236 B 247 B 161 C 333 BMegochi T3007 140 B 146 B 95 C 197 BMegochi T3008 195 B 204 B 133 C 275 B
1667 1743 1137 2349
Module 3: Research, Strategy and Targeting 25
Demographic Targeting
Demographic targeting is the process through which a political party and its candidates assess what types of people are likely to support them. For example, are men more likely to vote for the party than women? Do younger people feel a stronger connection to the party than older people? Are people in rural or urban areas more attracted to the party? How do street vendors, taxi drivers, farm workers, teachers, unemployed young people, business people, students, shop owners, factory workers, mothers, etc., feel about the party or its candidates?
The point of breaking the population down like this is that similar people are likely to have similar concerns and, therefore, be attracted to similar political parties or candidates. This helps political campaigns figure out who they should be talking to and what they should be talking about.
Demographic targeting also ensures that a campaign is aware of existing or emerging trends among the population so that it can incorporate these into its strategy. For example, the large youth population in the Middle East and North Africa is a demographic trend to which all political parties should be responding, in part because this sector of society will ultimately dominate the voting populace. The fact that unemployment is a major characteristic of this demographic group also requires a strategic political response.
Therefore, demographic targeting generally answers three questions for a campaign:
What types of people are already supporting us?
What types of people would be more likely to support us (if they knew more about us or if we had a stronger relationship with them)?
What are the existing or emerging trends or opportunities within the population of which our campaign needs to be aware? For example, is there are large number of young people, an aging population, a sizable immigrant community, do women of voting age significantly outnumber men of voting age, and so on?
There are several ways to conduct demographic targeting, but it is important to first identify the specific geographic areas in which you would like to know more about the population. One of the most accurate ways to do this is by first conducting geographic targeting, but if this is not possible simply mark the areas on a map where your party or candidate either already has support or has the potential to gain more support and begin to seek out demographic information about these areas.
1.
2.
3.
Module 3: Research, Strategy and Targeting26
To conduct demographic targeting:
Make a lists of your priority areas, or mark them on a map. These are the areas in which you need to know more about the voters. If you have conducted geographic targeting, your priority areas are those you have identified as either A, B or C areas for your party or candidate, places where you currently have support or the potential to grow your support.
Collect demographic information for each of these areas. Frequently, the easiest information to use is census data, because voting districts and census data are often organized using the same geographic boundaries. If reliable census information is not available, seek out other sources of useful information about the population in your priority areas. See the note at the end of this handout for ways to do this.
Review the demographic information and consider what it can tell you about voters and issues in that area. You are looking for dominant trends among voters – characteristics which are statistically significant and provide insights into the type of people who live in these areas.
Figuring this out is a bit like putting together a puzzle: you have to be able to connect information with people. Answers come by asking lots of questions, such as:
How do people in this area make a living?1 Are they considered “economically active,” i.e., do they have a job or some form or income? Do they have enough to live on?What is the level of paid employment in the area? Compare this to figures of young women and men who may be looking for work.What are the levels of education and literacy? Do people in these areas have access to decent schools, for example, or do children travel long distances to get an education? What is the sanitation like? Is there access to clean water, a functioning sewerage system or adequate toilets? If there is poor sanitation, what does this mean for the residents? Is there a reliable source of electricity? If not, what does this mean for things like food storage and general health? What does it mean for access to television or the internet as sources of information?Are there large numbers of households headed by women? This is often an indicator of poverty.
1.
2.
3.
1 The section below, “Demographic Targeting in Practice,” explains some of the terminology which is useful to understand when working with census information.
Module 3: Research, Strategy and Targeting 27
How are people in this area likely to get their information? To determine this, look at levels of literacy (can they read newspapers or magazines), sources of electricity (will they have access to television or the internet), and whether they are in geographic areas where radio broadcasts can reach.
Conducting this type of analysis can provide your campaign with very useful information about the lives of groups of voters who are important for your work. While you should always check your conclusions about what’s important to local communities through direct communication such as a survey canvass or community meetings, very basic information about the state and conditions of life can give you strong indications about what the priorities for these citizens might be.
Ultimately, demographic targeting helps a campaign focus its policies and message, so it is talking about the issues its supporters and potential supports care about, and so it can target its communication efforts more effectively.
Activity 8: Demographic Targeting in Practice
Review the excerpts from sample census information below. Assume that this data is from B areas for your party or campaign – an area where you have significant potential to grow your support but you are in tight competition with other parties or candidates. Think through what this type of data could mean for your campaign’s strategy, communication and voter outreach.
Age and Gender
The table below contains census information about the age and gender of the people who live in the local area. Review the data and think through the questions that follow.
Module 3: Research, Strategy and Targeting28
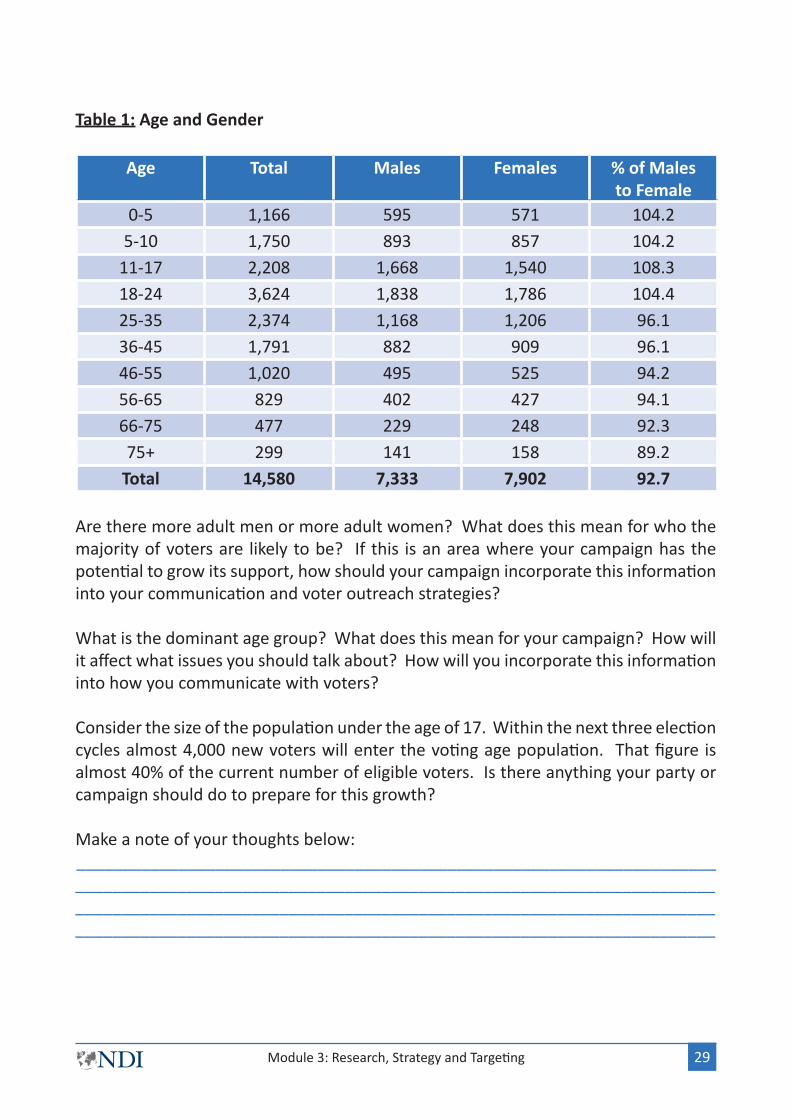
Table 1: Age and Gender
Age Total Males Females % of Males to Female
0-5 1,166 595 571 104.25-10 1,750 893 857 104.2
11-17 2,208 1,668 1,540 108.318-24 3,624 1,838 1,786 104.425-35 2,374 1,168 1,206 96.136-45 1,791 882 909 96.146-55 1,020 495 525 94.256-65 829 402 427 94.166-75 477 229 248 92.375+ 299 141 158 89.2
Total 14,580 7,333 7,902 92.7
Are there more adult men or more adult women? What does this mean for who the majority of voters are likely to be? If this is an area where your campaign has the potential to grow its support, how should your campaign incorporate this information into your communication and voter outreach strategies?
What is the dominant age group? What does this mean for your campaign? How will it affect what issues you should talk about? How will you incorporate this information into how you communicate with voters?
Consider the size of the population under the age of 17. Within the next three election cycles almost 4,000 new voters will enter the voting age population. That figure is almost 40% of the current number of eligible voters. Is there anything your party or campaign should do to prepare for this growth?
Make a note of your thoughts below:____________________________________________________________________________________________________________________________________________________________________________________________________________________________________________________________________________________
Module 3: Research, Strategy and Targeting 29

Household Status
Consider the following census data about households in the area:Table 2: Household Status
Proportion Heads of Households
Male 70.4% Female 29.6%
Occupancy Status Owner 1,083 Rented 1,867 Vacant 86
The term “Heads of Households” is census terminology to indicate who takes primary responsibility for the welfare of a family or those who live within the same dwelling. Because of the way social and economic systems are structured, in many countries a female head of household can be an indicator of poverty because it can be more difficult for women to bring in enough income to support a family. What does it mean that almost 30% of households are headed by women in this area?
Connect this finding to the observation made earlier about the majority of voters being women. Could there be an important connection for your campaign to make about women and their families living in poverty? How would this affect what issues you talk about or what policies you present as priorities?
Census information will also frequently provide some information about housing in the area. This example provides this under the heading of “Occupancy Status,” which specifies whether people own their home or rent it.
These figures can provide you with insights into whether people have the means to afford to own their homes. They can also tell you whether there is affordable or appropriate housing is the area, depending on how competitive the rental market is. Low levels of vacant properties indicate a high demand for housing, which may mean that it is expensive or difficult for people on lower incomes to access.
What does this example tell you about the voters in the area? Are they more likely to own or rent their homes? Could housing be an important issue for them? If this were an area where you could grow your vote, what would this information tell you about potential supporters?
Make a note of your thoughts below:____________________________________________________________________________________________________________________________________________________________________________________________________________________________________________________________________________________
Module 3: Research, Strategy and Targeting30
Occupation and Employment
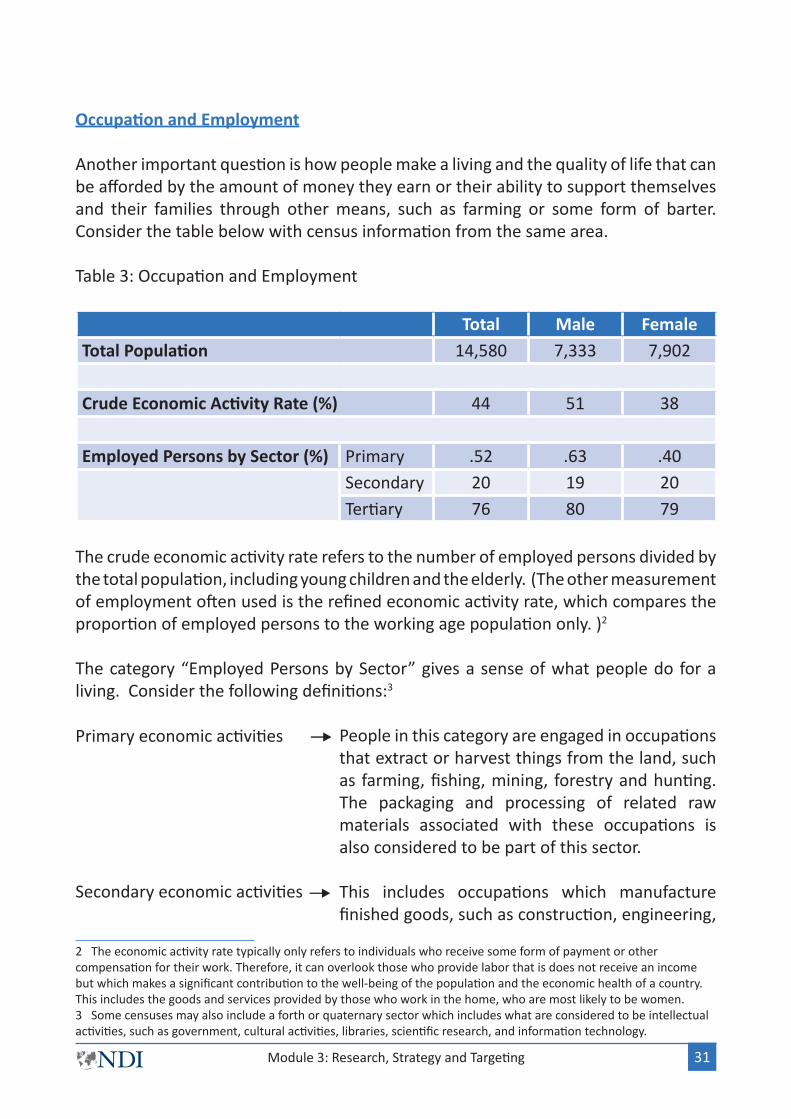
Another important question is how people make a living and the quality of life that can be afforded by the amount of money they earn or their ability to support themselves and their families through other means, such as farming or some form of barter. Consider the table below with census information from the same area.
Table 3: Occupation and Employment
Total Male FemaleTotal Population 14,580 7,333 7,902
Crude Economic Activity Rate (%) 44 51 38
Employed Persons by Sector (%) Primary .52 .63 .40Secondary 20 19 20Tertiary 76 80 79
The crude economic activity rate refers to the number of employed persons divided by the total population, including young children and the elderly. (The other measurement of employment often used is the refined economic activity rate, which compares the proportion of employed persons to the working age population only. )2
The category “Employed Persons by Sector” gives a sense of what people do for a living. Consider the following definitions:3
People in this category are engaged in occupations that extract or harvest things from the land, such as farming, fishing, mining, forestry and hunting. The packaging and processing of related raw materials associated with these occupations is also considered to be part of this sector.
This includes occupations which manufacture finished goods, such as construction, engineering,
2 The economic activity rate typically only refers to individuals who receive some form of payment or other compensation for their work. Therefore, it can overlook those who provide labor that is does not receive an income but which makes a significant contribution to the well-being of the population and the economic health of a country. This includes the goods and services provided by those who work in the home, who are most likely to be women.3 Some censuses may also include a forth or quaternary sector which includes what are considered to be intellectual activities, such as government, cultural activities, libraries, scientific research, and information technology.
Module 3: Research, Strategy and Targeting 31
Primary economic activities
Secondary economic activities
textile and clothing manufacturing, computer and technology production, metal working and other forms of manufacturing.
These are occupations involved in delivering services, such as running a school or a restaurant, tourism and entertainment, retail and wholesale sales, media, clerical services, insurance, healthcare, banking and legal services.
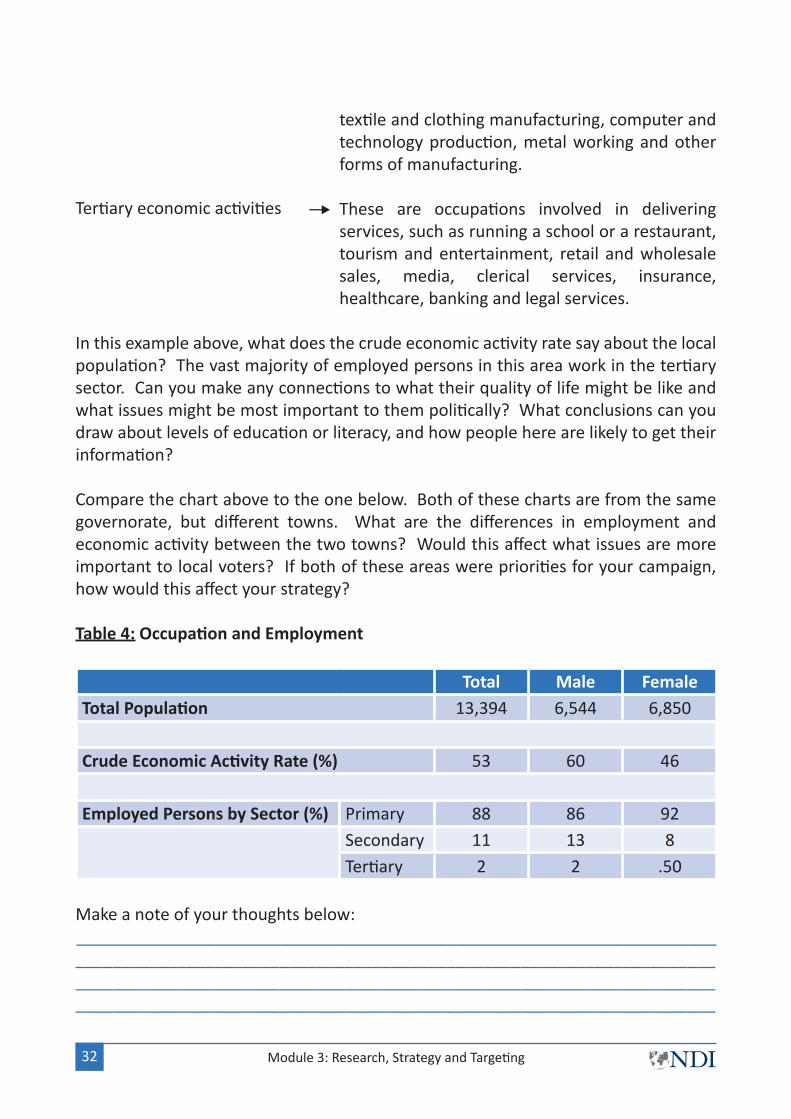
In this example above, what does the crude economic activity rate say about the local population? The vast majority of employed persons in this area work in the tertiary sector. Can you make any connections to what their quality of life might be like and what issues might be most important to them politically? What conclusions can you draw about levels of education or literacy, and how people here are likely to get their information?
Compare the chart above to the one below. Both of these charts are from the same governorate, but different towns. What are the differences in employment and economic activity between the two towns? Would this affect what issues are more important to local voters? If both of these areas were priorities for your campaign, how would this affect your strategy?
Table 4: Occupation and Employment
Total Male FemaleTotal Population 13,394 6,544 6,850
Crude Economic Activity Rate (%) 53 60 46
Employed Persons by Sector (%) Primary 88 86 92Secondary 11 13 8Tertiary 2 2 .50
Make a note of your thoughts below:____________________________________________________________________________________________________________________________________________________________________________________________________________________________________________________________________________________
Tertiary economic activities
Module 3: Research, Strategy and Targeting32
Education and Literacy
Figures on literacy and access to education provide vital information for campaigns. Education and literacy are key development factors. The ability to read and write and to access quality education have a direct impact on the quality of life of individuals and their communities, including the type of work they are able to do, the level of income they can expect to earn, and the degree of financial stability they are likely to experience over a lifetime.
Additionally, higher levels of education are associated with lower levels of poverty. This connection is particularly significant for women and any children they may have. Therefore, information on education frequently provides campaigns with insights into what key issues in the local area might be, and how voters are likely to access information.
Data on education and literacy also provide strategic guidance on how campaigns should communicate with local residents. For example, regions with lower levels of literacy will struggle with campaign communications with large sections of printed word, such as leaflets and manifestos. Areas with higher levels of literacy are likely to have access to multiple types of media, and campaigns will have to identify which are most likely to be used by their target voters.
The two tables below are both connected to the same city. Table 5 is from a neighborhood in the city largely populated by urban professionals. Table 6 is from a neighborhood on the edges of the city where workers who commute to and from the manufacturing district live.
Review the data from both of the tables and consider the questions which follow.
Module 3: Research, Strategy and Targeting 33
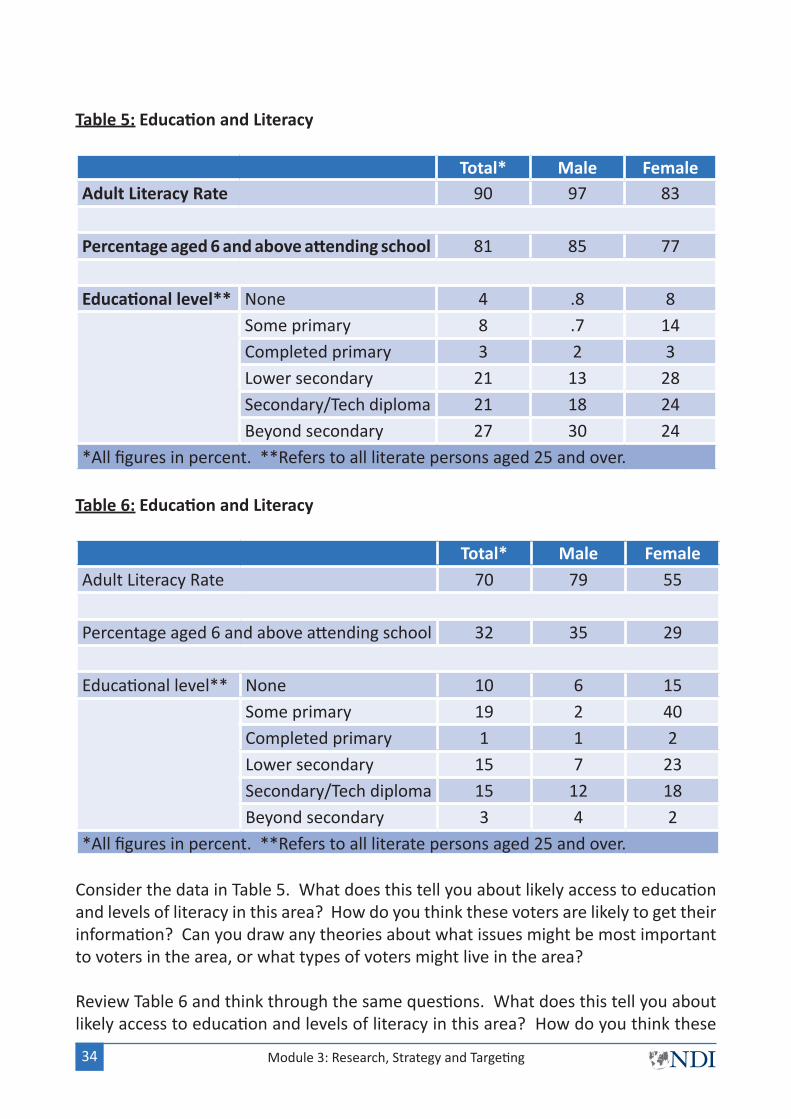
Table 5: Education and Literacy
Total* Male FemaleAdult Literacy Rate 90 97 83
Percentage aged 6 and above attending school 81 85 77
Educational level** None 4 .8 8Some primary 8 .7 14Completed primary 3 2 3Lower secondary 21 13 28Secondary/Tech diploma 21 18 24Beyond secondary 27 30 24
*All figures in percent. **Refers to all literate persons aged 25 and over.
Table 6: Education and Literacy
Total* Male FemaleAdult Literacy Rate 70 79 55
Percentage aged 6 and above attending school 32 35 29
Educational level** None 10 6 15Some primary 19 2 40Completed primary 1 1 2Lower secondary 15 7 23Secondary/Tech diploma 15 12 18Beyond secondary 3 4 2
*All figures in percent. **Refers to all literate persons aged 25 and over.
Consider the data in Table 5. What does this tell you about likely access to education and levels of literacy in this area? How do you think these voters are likely to get their information? Can you draw any theories about what issues might be most important to voters in the area, or what types of voters might live in the area?
Review Table 6 and think through the same questions. What does this tell you about likely access to education and levels of literacy in this area? How do you think these
Module 3: Research, Strategy and Targeting34

voters are likely to get their information? Can you draw any theories about what issues might be most important to voters in the area, or what types of voters might live in the area?
Now compare Table 5 and Table 6. Where are there differences between the two areas? Does this provide your campaign with any important strategic information?Finally, compare levels of education and literacy for males and females in the two areas. Are there differences? Are they significant? Remembering that women outnumber men in this governorate, is this likely to impact what issues your campaign talks about and how you communicate with voters in the area?
Make a note of your thoughts below:____________________________________________________________________________________________________________________________________________________________________________________________________________________________________________________________________________________
Conclusions
Based on your review of the census information provided in this section on demographic targeting, what conclusions could you draw about the types of voters in these areas? What do you think are the most important issues to them? Could there be a difference between the issues that are priorities for men and those that are priorities for women? Could there be differences between what older and younger voters think are important?____________________________________________________________________________________________________________________________________________________________________________________________________________________________________________________________________________________
Below, list at least three things that you have learned about voters in these areas from this census information:
___________________________________________________________________________________________________________________________________________________________________________________________________
Your task now is to find reliable demographic information for the areas that are priorities for your campaign and conduct the same type of
analysis as you did in Activity 8. Extract as much strategic information as you can about voters in these areas.
Module 3: Research, Strategy and Targeting 35
What to do if you cannot get reliable census information
There are a number of other good sources of demographic information if reliable census data is not available. Locally, look to the research departments of universities, as well as survey and marketing firms. They often have dependable and recent demographic data. Private firms may charge a fee for the information, but universities may have already put some of it into the public domain by publishing their research.
International organizations can provide some of this information as well. Countries with Millennium Development Goals projects should have extensive data on which program reports are built. The United Nations Statistical Division and the United Nations Development Program also maintain a number of data systems on demographic and social figures for countries worldwide. The World Bank builds detailed demographic information into their programs and planning. Much of this information is freely published on these organization’s websites and in reports.
Another option is to work with your party’s local branches to think through what you already know about the makeup of the areas you have identified as important for your campaign. Party activists at the branch or regional level may have a lot of the information you need on hand from their work in the local community.
Think about the party’s history in these areas, its origins and its key policy initiatives, the profile and characteristics of prominent party officials and candidates, and assess what types of people these features are likely to attract. If your party is newer, think through where parties with similar characteristics have historically gotten their support.
Finally, consider which government departments need to maintain demographic information for their work, and whether they may make this information available. Agencies which frequently use this type of data include local taxation systems, housing registries, social welfare and assistance programs, driver or vehicle registration systems, job banks or employment assistance programs, and civil or family registries. The information used by these offices can often provide a sense of the general age of a local population, as well as offer insights into quality of life and social and economic well-being.
An important note when using demographic data: International standards on data protection require that any personal information acquired
about individuals must be used only for lawful purposes and that those managing the data must ensure it is kept safe and that personal or private
information is not distributed without the consent of the individual or individuals involved.
Module 3: Research, Strategy and Targeting36

Voter Analysis
Voter Analysis helps a political party and its candidates think through the key areas where their priorities match with the priorities of the voters it is attempting to persuade and mobilize in an election. This information will help guide and direct the party’s campaign message, inform the voter contact and communication strategies, and identify the key issues and characteristics the party needs to highlight during the election campaign.
The relationship between political parties and voters often starts at the level of basic needs, when parties see themselves as service delivery organizations doing things like delivering food or supplies to communities, or setting up their own schools or health clinics. They may offer trainings or courses in local areas to build capacity and skills among citizens.
Over time, the expectations of voters start to change and the reasons why they support a party tend to move away from more material-based motivations towards more aspirational reasons: they want to see things get better for themselves and their children. Voters tire of ad hoc responses to problems – like mobile health clinics and training courses which appear whenever an election is near – and seek longer-term solutions.
Therefore, political parties need to consider how to connect with voters on a more aspirational level. This often includes looking at areas such as values, attitudes, issues and leadership qualities which a political party shares with its supporters. Examining where parties and voters connect in these areas is called voter analysis.
Activity 9: Voter Analysis
Think through your candidate or your party’s relationship with its supporters and review the categories below. Identify the values, attitudes, issues and leadership qualities which the candidate or party and its supporters both think are important. These areas are the bridges between the political party or candidate and its supporters, and are the foundations for how the campaign will communicate with these voters.
Values are beliefs about what is right, what is wrong, and what is important. Members of the campaign’s target audiences (A, B and/or C voters) share the following values with the party or candidate:__________________________________________________________________________________________________________________________________________
Module 3: Research, Strategy and Targeting 37

Attitudes are opinions or dispositions about how certain issues should be handled. Members of the campaign’s target audiences (A, B and/or C voters) share the following attitudes with the party or candidate: __________________________________________________________________________________________________________________________________________
Issues are topics or problems which a society is facing. Members of the campaign’s target audiences (A, B and/or C voters) share concerns with the party or candidate about the following issues:__________________________________________________________________________________________________________________________________________
Leadership Qualities are the traits and characteristics that define a leader. Members of the campaign’s target audiences (A, B and/or C voters) share the same desire for the following leadership qualities:__________________________________________________________________________________________________________________________________________
Module 3: Research, Strategy and Targeting38
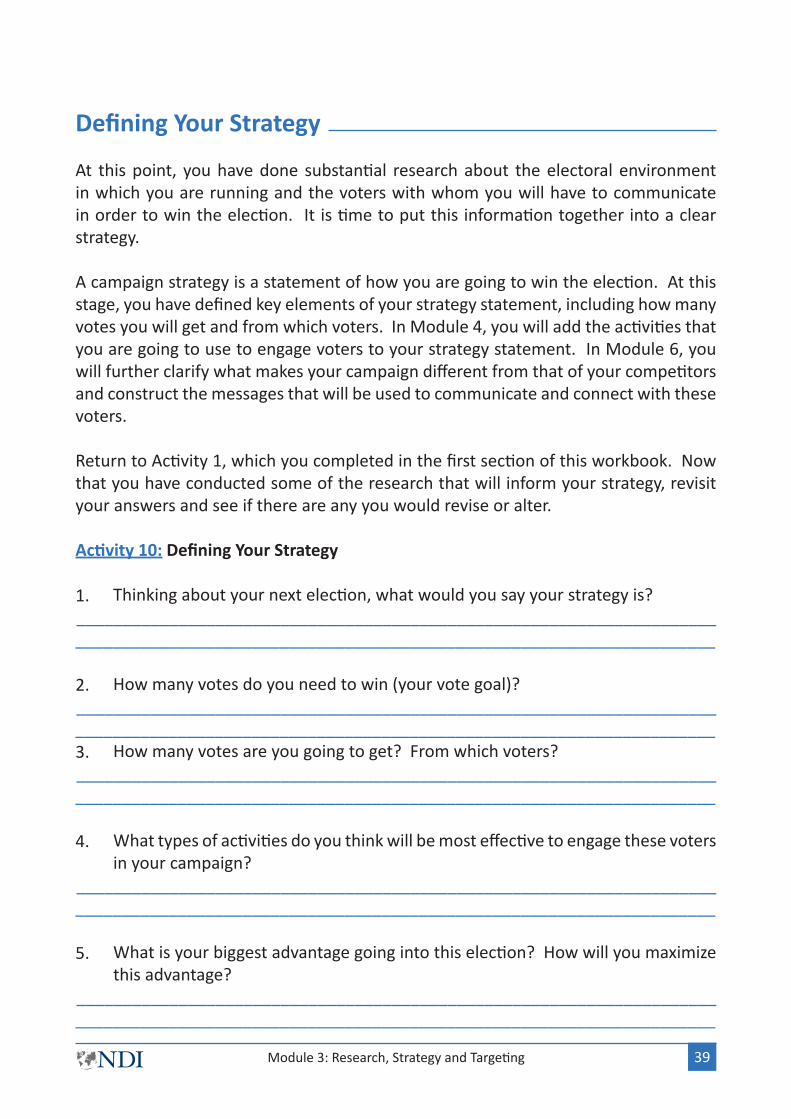
Defining Your Strategy
At this point, you have done substantial research about the electoral environment in which you are running and the voters with whom you will have to communicate in order to win the election. It is time to put this information together into a clear strategy.
A campaign strategy is a statement of how you are going to win the election. At this stage, you have defined key elements of your strategy statement, including how many votes you will get and from which voters. In Module 4, you will add the activities that you are going to use to engage voters to your strategy statement. In Module 6, you will further clarify what makes your campaign different from that of your competitors and construct the messages that will be used to communicate and connect with these voters.
Return to Activity 1, which you completed in the first section of this workbook. Now that you have conducted some of the research that will inform your strategy, revisit your answers and see if there are any you would revise or alter.
Activity 10: Defining Your Strategy
Thinking about your next election, what would you say your strategy is? __________________________________________________________________________________________________________________________________________
How many votes do you need to win (your vote goal)?__________________________________________________________________________________________________________________________________________
How many votes are you going to get? From which voters?__________________________________________________________________________________________________________________________________________
What types of activities do you think will be most effective to engage these voters in your campaign?
__________________________________________________________________________________________________________________________________________
What is your biggest advantage going into this election? How will you maximize this advantage?
__________________________________________________________________________________________________________________________________________
1.
2.
3.
4.
5.
Module 3: Research, Strategy and Targeting 39
Summarize your answers to the questions above into a strategy statement. This is a single sentence that explains how you are going to win the election by defining how many votes you will need, what types of voters will support you, and how you will appeal to them for their support.
“We will win this election by ___________________________________________________________________________________________________________________________________________________________________________________________________________________________________________________________.”
6.
Module 3: Research, Strategy and Targeting40
Appendix 1
Activity 1: Electoral System and Legal Requirements
This version of Activity 2 provides a more comprehensive discussion of some of the issues a political party, candidate or electoral campaign is likely to face in an election. Campaign staff and party strategists should think through and be able to answer the questions below when preparing for an election.
Review and discuss each of these questions with the members of your campaign team who will have responsibility for preparing for the election. If you are not able to answer one or more of the questions, assign a specific member of your team to research the information you need and make arrangements for how and when that individual will report back to the team.
a) Electoral system
What is the type of election or level of office that is being voted on? Is it local, district, regional, national or mixed (multiple levels of office being voted on at one time)?
How is the distribution of seats determined: What is the system of voting? How are votes counted and calculated?
If this is a proportional representation election, is it a closed list system, a semi-closed list system, or an open list system? In other words, will the voter be able to select which party he/she prefers and which candidate within the party list he/she would like to see elected?
Every system of elections creates advantages for some parties and disadvantages for others. What are the implications for your party in this election?
b) Legal requirements
Does the law layout specific requirements for the composition of the lists of candidates that the parties will have to present for registration, such as a minimum number of women candidates, their placement on the list, a youth quota, age limits or other prerequisites?
1.
2.
3.
4.
1.
Module 3: Research, Strategy and Targeting 41
What will the ballot paper look like? Will your campaign have access to sample ballot papers in advance of the election so you can direct your voters to where you are on the list? If not, can you create a sample or mock ballot paper to help your voters?
What do you have to do to be eligible to stand in this election? What are the legal requirements and deadlines for candidates?
Who in your party is in charge of managing the registration process for candidates or parties, and of liaising whatever body is in charge of conducting the elections?
What does a citizen living in your electoral district need to do in order to be able to vote on election day? Is there a voter registration process (as opposed to automatic registration through the civil registry) and, if so, what are the rules for voter registration? Will these regulations make it easier or harder for your supporters to register and vote?
Generally speaking, would you feel comfortable contacting the election authorities to ask them for clarification on a particular issue that you might be unsure about? If you feel that this is OK, do you have the names and contact information of the persons in the body in charge of the election process in your electoral district?
What are the rules about fundraising? Are there restrictions on the amount of money you can raise or spend? Is there a limit on the amount an individual citizen can give to your campaign? Can private companies give? Can you raise money from abroad or from non-citizens?
c) Candidates and campaign
What is the officially defined election campaign period? On what date and at what hour does it begin and end? Are there restrictions on campaigning outside of this timeframe, or communicating with voters before the official campaign begins? If so, which laws prohibit this?
What are the rules or restrictions for campaigning? When can you communicate with voters and when can you not? Are any forms of voter contact restricted or prohibited? Are there restrictions on what language, colors or images your campaign can use? If yes, where is this information officially published and does your campaign have a copy of it?
2.
3.
4.
5.
6.
7.
1.
2.
Module 3: Research, Strategy and Targeting42
How, when and by whom will your candidates be nominated and selected to be included on the election list? Does your party have a specific mechanism for the selection of candidates? Does your party have clear criteria for who is eligible to represent the party as a candidate, such as length of party membership, status as a citizen, demonstrated commitment to their local community, etc.? If so, are these criteria published and accessible to all party activists and staff, and to anyone who might like to be a candidate?
d) Management and organization
How many polling stations are there within the administrative boundaries of your electoral district? Do you have a full list (a map) of the polling stations with their precise address or location?
How many party agents (polling station observers) will your campaign team need for the elections? Is the number of the party agents equal to the number of the polling stations? Have your party agents been trained on the rules of procedure that apply for these elections?
Will the party agents be allowed to have physical access to the polling stations on Election Day and during the counting of ballot papers?
What are the rules for party agent registration? Who in your party is in charge of having your party agents registered, so that they can do their job on Election Day?
What are the mechanisms for filing complaints on Election Day and who in your party is in charge of that? Have the party agents been trained on how to file a complaint?
3.
1.
2.
3.
4.
5.
Module 3: Research, Strategy and Targeting 43