research report - STEEL FRAMING Corrosion of Galvanized Fasteners used in Cold-Formed Steel Framing...
181
research report Corrosion of Galvanized Fasteners used in Cold- Formed Steel Framing RESEARCH REPORT RP04-4 2004 REVISION 2006 American Iron and Steel Institute
-
Upload
trinhthuan -
Category
Documents
-
view
215 -
download
1
Transcript of research report - STEEL FRAMING Corrosion of Galvanized Fasteners used in Cold-Formed Steel Framing...

rese
arch
repo
rt
Corrosion of Galvanized Fasteners used in Cold-Formed Steel Framing
R E S E A R C H R E P O R T R P 0 4 - 4 2 0 0 4 R E V I S I O N 2 0 0 6
American Iron and Steel Institute

Corrosion of Galvanized Fasteners used in Cold-Formed Steel Framing i
DISCLAIMER
The material contained herein has been developed by researchers based on their research findings and is for general information only. The information in it should not be used without first securing competent advice with respect to its suitability for any given application. The publication of the information is not intended as a representation or warranty on the part of the American Iron and Steel Institute, Steel Framing Alliance, or of any other person named herein, that the information is suitable for any general or particular use or of freedom from infringement of any patent or patents. Anyone making use of the information assumes all liability arising from such use.
Copyright 2004 American Iron and Steel Institute / Steel Framing Alliance Revised Edition Copyright 2006 American Iron and Steel Institute / Steel Framing Alliance

ii Corrosion of Galvanized Fasteners used in Cold-Formed Steel Framing
PREFACE
The primary objective of this project was to study the effect of corrosion on the structural integrity of galvanized fasteners used in cold-formed steel-framed construction. A number of specific tasks were developed to meet this objective, including a literature search, design and construction of field enclosures, determination of test sites and installation of field enclosures, test specimen design and fabrication, accelerated corrosion testing, structural tensile testing, data analysis and technology transfer.
The Research Team felt that this report was very well written, but exhaustive in detail. The reader is referred to two summary reports, Corrosion of Galvanized Fasteners in Coastal Environments by Jay Larson and Recommendations for Cold-Formed Steel Framing and Fasteners in Coastal Environments by Dr. Ian Robertson, which were published in the FRAMEWORK section of the March/April 2005 Edition of Metal Home Digest.
The findings of this project provide meaningful data on the performance of cold-formed steel framing and led to the updating of the LGSEA Technical Note on Corrosion Protection for Cold-Formed Steel Framing in Coastal Areas.
Research Team Steel Framing Alliance

Corrosion of Galvanized Fasteners University of Hawaii Final Report Steel Framing Alliance
i
Corrosion of Galvanized Fasteners used in Cold-Formed Steel Framing
FINAL REPORT
December 1, 2004
SUBMITTED BY
STEEL FRAMING ALLIANCE
AND
UNIVERSITY OF HAWAII AT MANOA
HUD CONTRACT No.: H-21248CA
PROJECT TITLE: “Corrosion of Galvanized Fasteners used in Cold-Formed Steel Framing”
CONTRACTOR: Steel Framing Alliance 1201 15th Street, N.W., Suite 320 Washington, DC 20005
Principal Investigator: Larry Williams Co/Investigators: Don Moody and Jay Larson
SUB-CONTRACTOR: University of Hawaii Dept. of Civil Engineering2540 Dole Street, Holmes Hall 383 Honolulu, HI 96822
Principal Investigator Dr. Ian N. Robertson

Corrosion of Galvanized Fasteners University of Hawaii Final Report Steel Framing Alliance
ii
ABSTRACT
This research program investigated the potential for corrosion of galvanized fasteners
used in cold-formed steel framing by exposing test samples to a variety of environmental
conditions frequently found in Hawaii and elsewhere. The results of this research will aid in
the evaluation of galvanized fasteners in various exposure conditions.
Five field enclosures were constructed on the island of Oahu at coastal locations on both
windward and leeward shores, and in the interior of the island. Each field enclosure
represented various aspects of typical cold-formed steel construction and was equipped with
a complete weather station. This report details the design, construction and first two years
of exposure of the field enclosures. Continued monitoring of the enclosures will depend on
availability of funding and permission to leave the enclosures in place beyond the initial
project timeframe.
Standard cold-formed steel connections with galvanized screws have been placed in
various locations within each of the field enclosures as a controlled study of the performance
of galvanized fasteners in typical CFS framing construction. This report outlines the
selection of the screwed connection details, and test results after 7 months exposure in the
field enclosures. Identical screwed test connections have also been subjected to a cyclic salt
spray routine in a corrosion chamber to induce accelerated corrosion. The effect of this
cyclic routine on the strength and ductility of the connections is reported after 2700 cycles in
the corrosion chamber.
Based on the results of this study, recommendations are made for the protection of cold-
formed steel framing and fasteners in coastal environments.
Corrosion of Galvanized Fasteners University of Hawaii Final Report Steel Framing Alliance
iii
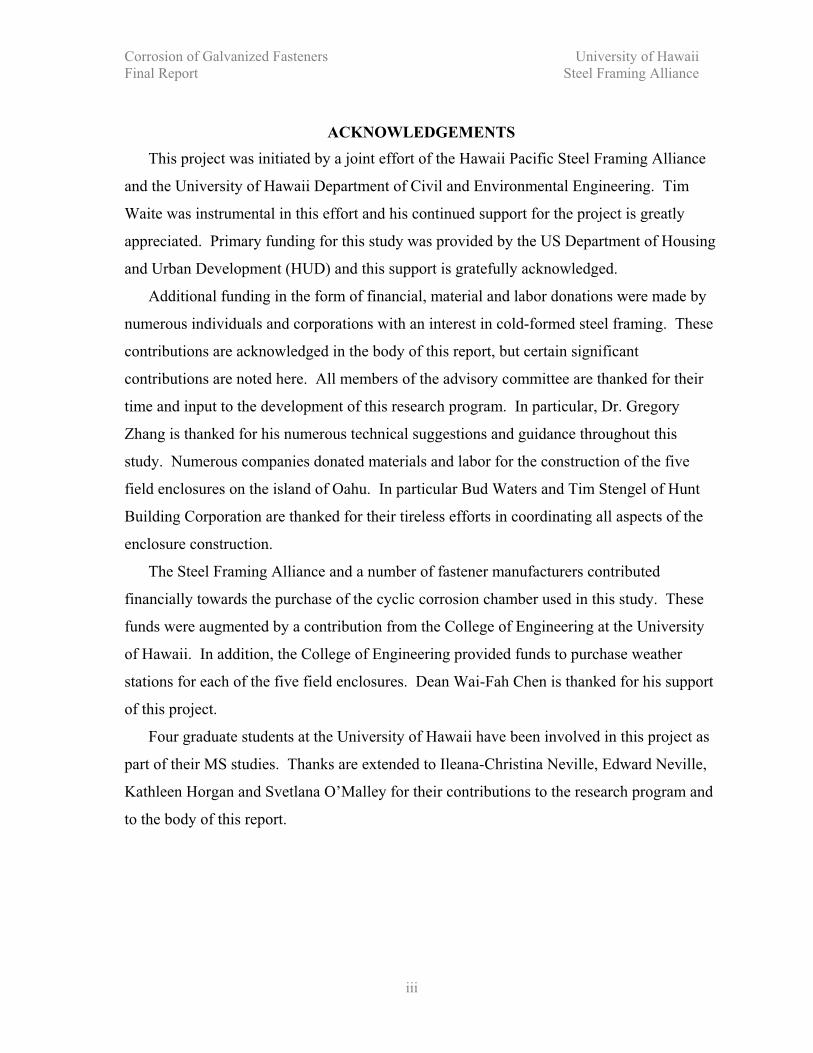
ACKNOWLEDGEMENTS
This project was initiated by a joint effort of the Hawaii Pacific Steel Framing Alliance
and the University of Hawaii Department of Civil and Environmental Engineering. Tim
Waite was instrumental in this effort and his continued support for the project is greatly
appreciated. Primary funding for this study was provided by the US Department of Housing
and Urban Development (HUD) and this support is gratefully acknowledged.
Additional funding in the form of financial, material and labor donations were made by
numerous individuals and corporations with an interest in cold-formed steel framing. These
contributions are acknowledged in the body of this report, but certain significant
contributions are noted here. All members of the advisory committee are thanked for their
time and input to the development of this research program. In particular, Dr. Gregory
Zhang is thanked for his numerous technical suggestions and guidance throughout this
study. Numerous companies donated materials and labor for the construction of the five
field enclosures on the island of Oahu. In particular Bud Waters and Tim Stengel of Hunt
Building Corporation are thanked for their tireless efforts in coordinating all aspects of the
enclosure construction.
The Steel Framing Alliance and a number of fastener manufacturers contributed
financially towards the purchase of the cyclic corrosion chamber used in this study. These
funds were augmented by a contribution from the College of Engineering at the University
of Hawaii. In addition, the College of Engineering provided funds to purchase weather
stations for each of the five field enclosures. Dean Wai-Fah Chen is thanked for his support
of this project.
Four graduate students at the University of Hawaii have been involved in this project as
part of their MS studies. Thanks are extended to Ileana-Christina Neville, Edward Neville,
Kathleen Horgan and Svetlana O’Malley for their contributions to the research program and
to the body of this report.

Corrosion of Galvanized Fasteners University of Hawaii Final Report Steel Framing Alliance
iv
TABLE OF CONTENTS
1 INTRODUCTION ........................................................................................................... 1
1.1 PROJECT OUTLINE .............................................................................................. 1
1.2 PROJECT JUSTIFICATION .................................................................................. 1
1.3 PROJECT OBJECTIVES........................................................................................ 1
1.3.1 Task 1: Literature Search..................................................................................... 2
1.3.2 Task 2: Construction of Field Enclosures............................................................ 2
1.3.3 Task 3: Determination of Test Sites .................................................................... 2
1.3.4 Task 4: Tensile Tests ........................................................................................... 2
1.3.5 Task 5: Corrosion Tests ....................................................................................... 3
1.3.6 Task 6: Technology Transfer............................................................................... 3
1.4 PROJECT TEAM .................................................................................................... 3
1.4.1 Advisory Committee............................................................................................ 4
2 FIELD ENCLOSURES ................................................................................................... 7
2.1 Introduction.............................................................................................................. 7
2.2 Enclosure Design ..................................................................................................... 7
2.2.1 Configuration of Field Enclosures....................................................................... 7
2.3 Enclosure Locations............................................................................................... 10
2.3.1 Selected Field Sites............................................................................................ 11
2.3.2 MCBH Field Enclosure Sites............................................................................. 12

Corrosion of Galvanized Fasteners University of Hawaii Final Report Steel Framing Alliance
v
2.3.3 Iroquois Point Field Enclosure Sites.................................................................. 15
2.3.4 Wheeler Army Airfield Field Enclosure Site .................................................... 17
2.4 Enclosure Construction.......................................................................................... 19
2.5 Field Enclosure Construction Timelines ............................................................... 20
2.6 Meteorological Instrumentation............................................................................. 22
2.6.1 CR10X Measurement and Control Module....................................................... 23
2.6.2 CS500 Temperature and Relative Humidity Probe ........................................... 24
2.6.3 LI200S Pyranometer.......................................................................................... 25
2.6.4 TE525WS Tipping Bucket Rain Gage .............................................................. 25
2.6.5 Wind Sentry ....................................................................................................... 26
2.6.6 Atmospheric Chloride Monitoring .................................................................... 27
2.7 FINAL ENCLOSURE LAYOUT.......................................................................... 29
2.7.1 General Details .................................................................................................. 29
2.7.2 Marine Corps Base Hawaii – Coastal and Inland Sites ..................................... 30
2.7.3 Iroquois Point and Wheeler Army Airfield enclosure sites............................... 32
3 METEOROLOGICAL DATA ...................................................................................... 35
3.1 Introduction............................................................................................................ 35
3.2 Temperature and Relative Humidity ..................................................................... 35
3.2.1 Wheeler AAF Site.............................................................................................. 35
3.2.2 Iroquois Point Coastal Site ................................................................................ 38

Corrosion of Galvanized Fasteners University of Hawaii Final Report Steel Framing Alliance
vi
3.2.3 Marine Corps Base Coastal Site ........................................................................ 40
3.3 Rainfall .................................................................................................................. 43
3.3.1 Wheeler AAF Site.............................................................................................. 43
3.3.2 Iroquois Point Coastal Site ................................................................................ 45
3.3.3 Marine Corps Base Coastal ............................................................................... 45
3.4 Solar Radiation ...................................................................................................... 48
3.4.1 Wheeler AAF Site.............................................................................................. 48
3.4.2 Iroquois Point Coastal Site ................................................................................ 48
3.4.3 Marine Corps Base Coastal Site ........................................................................ 49
3.5 Wind Speed and Direction..................................................................................... 51
3.5.1 Wheeler AAF Site.............................................................................................. 51
3.5.2 Iroquois Point Coastal Site ................................................................................ 52
3.5.3 Iroquois Point Inland ......................................................................................... 54
3.5.4 Marine Corps Base Coastal Site ........................................................................ 55
3.5.5 Marine Corps Base Inland Site .......................................................................... 57
3.6 Chloride Deposition Rate ...................................................................................... 59
3.6.1 Wheeler AAF Site.............................................................................................. 59
3.6.2 Iroquois Point Coastal Site ................................................................................ 59
3.6.3 Iroquois Point Inland Site .................................................................................. 60
3.6.4 Marine Corps Base Coastal Site ........................................................................ 62

Corrosion of Galvanized Fasteners University of Hawaii Final Report Steel Framing Alliance
vii
3.6.5 Marine Corps Base Inland Site .......................................................................... 62
3.7 Analysis of Chloride Data ..................................................................................... 62
3.7.1 Wheeler AAF..................................................................................................... 65
3.7.2 Iroquois Point Coastal and Inland Sites............................................................. 65
3.7.3 Marine Corps Base Coastal Site ........................................................................ 67
3.7.4 Marine Corps Base Inland Site .......................................................................... 69
3.8 Concluding Observations....................................................................................... 72
4 FIELD TEST CONNECTIONS .................................................................................... 73
4.1 Connection Specimens........................................................................................... 73
4.1.1 Test Connection Development .......................................................................... 73
4.1.2 Connection tests................................................................................................. 75
4.1.3 Fastener selection............................................................................................... 85
4.1.4 Field enclosure test connections ........................................................................ 89
5 ACCELERATED CORROSION CHAMBER.............................................................. 91
5.1 Introduction............................................................................................................ 91
5.2 Installation ............................................................................................................. 91
5.3 Cyclic Routines...................................................................................................... 95
5.3.1 ASTM B117....................................................................................................... 95
5.3.2 Prohesion Test ................................................................................................... 96
5.3.3 ASTM G85 ........................................................................................................ 96

Corrosion of Galvanized Fasteners University of Hawaii Final Report Steel Framing Alliance
viii
5.3.4 CCT-1 and CCT-4 ............................................................................................. 98
5.3.5 SAE J2334 ......................................................................................................... 99
5.3.6 Procedure developed by Dr. Zhang at Teck Cominco..................................... 100
5.3.7 Summary of Industry testing procedures......................................................... 101
5.4 Cyclic Corrosion chamber Testing Procedure..................................................... 102
5.4.1 Samples Exposed in Chamber ......................................................................... 102
5.4.2 Testing Documentation.................................................................................... 102
5.5 Steel and zinc coupons......................................................................................... 102
5.5.1 Coupon Preparation ......................................................................................... 102
5.5.2 Coupon Placement ........................................................................................... 103
5.5.3 Corrosion Rates for Steel and Zinc.................................................................. 105
5.5.4 Corrosion Chamber Connection Specimens.................................................... 107
6 CONNECTION TEST RESULTS............................................................................... 109
6.1 Control specimen tests......................................................................................... 109
6.2 Field specimen test results ................................................................................... 110
6.3 Corrosion Chamber Connection Test Results...................................................... 119
7 FIELD ENCLOSURE OBSERVATIONS .................................................................. 133
7.1 Introduction.......................................................................................................... 133
7.2 Wheeler and Iroquois enclosure observations ..................................................... 135
7.2.1 Wall Framing ................................................................................................... 135

Corrosion of Galvanized Fasteners University of Hawaii Final Report Steel Framing Alliance
ix
7.2.2 Vented Attic..................................................................................................... 135
7.2.3 Crawl Space ..................................................................................................... 136
7.3 MCBH Inland enclosure observations................................................................. 137
7.3.1 Wall Framing ................................................................................................... 137
7.3.2 Wall Framing – Lap Siding without Vapor Barrier......................................... 137
7.3.3 Wall Framing – Plywood Sheathing without Vapor Barrier ........................... 138
7.3.4 Vented Attic..................................................................................................... 138
7.3.5 Crawl Space ..................................................................................................... 138
7.4 MCBH coastal enclosure observations................................................................ 141
7.4.1 Wall Framing ................................................................................................... 141
7.4.2 Wall Framing – Lap Siding without Vapor Barrier......................................... 142
7.4.3 Wall Framing – Plywood Sheathing without Vapor Barrier ........................... 143
7.4.4 Vented Attic..................................................................................................... 145
7.4.5 Crawl Space ..................................................................................................... 146
7.5 Summary of field enclosure observations............................................................ 151
8 SUMMARY AND CONCLUSIONS .......................................................................... 153
8.1 Summary.............................................................................................................. 153
8.2 Conclusions.......................................................................................................... 153
9 RECOMMENDATIONS............................................................................................. 155
REFERENCES .................................................................................................................... 159

Corrosion of Galvanized Fasteners University of Hawaii Final Report Steel Framing Alliance
x
LIST OF TABLES
Table 1-1: Advisory Committee Members ............................................................................. 5
Table 2-1: Field enclosure location and associated exposure condition............................... 10
Table 2-2: List of contributors to the field enclosures.......................................................... 19
Table 2-3: Construction and Inspection Timeline for MCBH Enclosures ........................... 21
Table 2-4: Construction Timeline for Iroquois Coastal and Inland Enclosures ................... 21
Table 2-5: Construction Timeline for Wheeler Enclosure ................................................... 22
Table 3.1: Temperature and Relative Humidity Sensor Placement at Wheeler AAF Site .... 35
Table 3.2: Temperature and R. H. Sensor Placement at Iroquois Point Coastal Site............ 38
Table 3.3: Temperature and R. H. Sensor Placement at Marine Corps Base Coastal Site.... 40
Table 4-1: Test Connection Specimens at Iroquois Point and Wheeler AAF enclosures .... 89
Table 4-2: Test Connection Specimens at MCBH Coastal and Inland enclosures............... 90
Table 5-1: List of contributors for the Corrosion Chamber.................................................. 91
Table 5-2: Comparison of the variations in ASTM G85 standard........................................ 97
Table 6-1: Average Peak Strength and Corresponding Elongation for Field Test
Connections ................................................................................................................. 117
Table 6-2: Average Peak Strength and Corresponding Elongation for Test Connections . 128
Table 7-1: Inspection Timeline for MCBH Coastal and Inland Enclosures....................... 134
Table 7-2: Inspection Timeline for Iroquois Coastal and Inland Enclosures ..................... 134
Table 7-3: Inspection Timeline for Wheeler Enclosure ..................................................... 134
Table 9-1: Exposure category assignment .......................................................................... 155

Corrosion of Galvanized Fasteners University of Hawaii Final Report Steel Framing Alliance
xi
LIST OF FIGURES
Figure 1.1: Project Organizational Chart................................................................................ 4
Figure 2.1: Exposure Conditions (FEMA) .............................................................................. 7
Figure 2.2: Field Enclosure Layout ........................................................................................ 8
Figure 2.3: Field Enclosure Connection Details..................................................................... 9
Figure 2.4: Field enclosure locations on Oahu ...................................................................... 11
Figure 2.5: MCBH Kaneohe Locations (with figure orientation) ........................................ 12
Figure 2.6: MCBH Site Profile............................................................................................. 13
Figure 2.7: MCBH Coastal, looking NE, towards the coastline........................................... 13
Figure 2.8: MCBH Coastal, looking S, towards the Ko’olau mountains ............................. 14
Figure 2.9: MCBH Inland, looking SW, towards the Ko’olau mountains ........................... 14
Figure 2.10: Iroquois Point enclosure locations ................................................................... 15
Figure 2.11: Iroquois Point Site Profile................................................................................ 16
Figure 2.12: Iroquois Point, Coastal, Looking South towards ocean ................................... 16
Figure 2.13: Iroquois Point, Inland, looking East................................................................. 16
Figure 2.14: Wheeler Army Airfield enclosure location ...................................................... 17
Figure 2.15: Wheeler field enclosure looking Northeast...................................................... 18
Figure 2.16: Field Enclosure at Various Stages of Construction.......................................... 20
Figure 2.17: Weather station external sensors and datalogger ............................................. 23
Figure 2.18: CR10X Datalogger and Control Unit............................................................... 23
Figure 2.19: External temperature and relative humidity probe in 6-plate radiation shield. 24
Figure 2.20: LI200S solar radiation sensor mounted on leveling plate................................ 25
Figure 2.21: Tipping Bucket Rain Gage showing internal bucket ........................................ 26
Figure 2.22: Wind vane and anemometer............................................................................. 27
Figure 2.23: Atmospheric Chloride Candle.......................................................................... 28
Figure 2.24: Atmospheric Chloride Candle and Shelter....................................................... 29
Figure 2.25: Interior Layout for Field Enclosure at Marine Corps Base Hawaii – Coastal . 31
Figure 2.26: Interior Layout for Field Enclosure at Marine Corps Base Hawaii – Inland ... 32
Figure 2.27: Interior Layout for Field Enclosures at Iroquois Point and Wheeler AAF...... 33
Figure 3.1: Wheeler AAF September 2003 Temperature...................................................... 36
Figure 3.2: Wheeler AAF September 2003 Relative Humidity ............................................ 36

Corrosion of Galvanized Fasteners University of Hawaii Final Report Steel Framing Alliance
xii
Figure 3.3: Wheeler AAF January 2004 Temperature .......................................................... 37
Figure 3.4: Wheeler AAF January 2004 Relative Humidity ................................................. 37
Figure 3.5: Iroquois Point Coastal September 2003 Temperature ........................................ 38
Figure 3.6: Iroquois Point Coastal September 2003 Humidity.............................................. 39
Figure 3.7: Iroquois Point Coastal January 2004 Temperature ............................................. 39
Figure 3.8: Iroquois Point Coastal January 2004 Humidity .................................................. 40
Figure 3.9: Marine Corps Base Coastal September 2003 Temperature ................................ 41
Figure 3.10: Marine Corps Base Coastal September 2003 Humidity ................................... 42
Figure 3.11: Marine Corps Base Coastal January 2004 Temperature ................................... 42
Figure 3.12: Marine Corps Base Coastal January 2004 Humidity ........................................ 43
Figure 3.13: Wheeler AAF January 2004 Rainfall Log ........................................................ 44
Figure 3.14: Wheeler AAF January 2004 Daily Rainfall ...................................................... 44
Figure 3.15: Iroquois Point Coastal January 2004 Daily Rainfall......................................... 45
Figure 3.16: Marine Corps Base Coastal Annual Rainfall 2003 ........................................... 46
Figure 3.17: Marine Corps Base Coastal Monthly Rainfall 2003 ......................................... 46
Figure 3.18: Marine Corps Base Coastal January 2004 Rainfall Log ................................... 47
Figure 3.19: Marine Corps Base Coastal January 2004 Daily Rainfall................................. 47
Figure 3.20: Wheeler AAF January 2004 Solar Radiation.................................................... 48
Figure 3.21: Iroquois Point Coastal January 2004 Solar Radiation....................................... 49
Figure 3.22: Marine Corps Base Coastal January 2004 Solar Radiation .............................. 50
Figure 3.23: Wheeler AAF Monthly January Wind Speed 2004 .......................................... 51
Figure 3.24: Wheeler AAF Wind Direction for January 12-18, 2004................................... 52
Figure 3.25: Iroquois Point Coastal January 2004 Wind Speed............................................ 53
Figure 3.26: Iroquois Point Coastal Wind Direction for January 26 – February 1, 2004 ..... 53
Figure 3.27: Iroquois Point Inland January 2004 Wind Speed.............................................. 54
Figure 3.28: Iroquois Point Inland Wind Direction for January 26-February 1, 2004.......... 55
Figure 3.29: Marine Corps Base Coastal January 2004 Wind Speed.................................... 56
Figure 3.30: Marine Corps Base Coastal Wind Direction for January 26-February 1, 2004 56
Figure 3.31: Marine Corps Base Inland January 2003 Wind Speed...................................... 57
Figure 3.32: Marine Corps Base Inland Wind Direction for January 26-February 1, 2004.. 58
Figure 3.33: Wheeler AAF Chloride Deposition Rates......................................................... 59

Corrosion of Galvanized Fasteners University of Hawaii Final Report Steel Framing Alliance
xiii
Figure 3.34: Iroquois Point Coastal Chloride Deposition Rates............................................ 60
Figure 3.35: Iroquois Point Inland Chloride Deposition Rates ............................................. 61
Figure 3.36: Marine Corps Base Coastal Chloride Deposition Rates ................................... 61
Figure 3.37: Marine Corps Base Inland Chloride Deposition Rates ..................................... 62
Figure 3.38: Chloride Deposition Rates ................................................................................ 63
Figure 3.39: Average Chloride Deposition Rates.................................................................. 63
Figure 3.40: Comparison of Iroquois Coastal, Iroquois Inland and Wheeler Chloride Deposition Rates ............................................................................................................ 64
Figure 3.41: Comparison of Marine Corps Base Coastal vs. Inland Chloride Deposition Rates............................................................................................................................... 65
Figure 3.42: Iroquois Point Inland Wind Direction During Period of High Chloride Deposition...................................................................................................................... 66
Figure 3.43: Iroquois Point Inland Wind Speed During Period of High Chloride Deposition....................................................................................................................................... 66
Figure 3.44: Marine Corps Base Coastal Wind Direction During Period of Low Chloride Deposition...................................................................................................................... 67
Figure 3.45: Marine Corps Base Coastal Wind Speed During Period of Low Chloride Deposition...................................................................................................................... 68
Figure 3.46: Marine Corps Base Coastal Wind Direction During Period of High Chloride Deposition...................................................................................................................... 68
Figure 3.47: Marine Corps Base Coastal Wind Speed During Period of High Chloride Deposition...................................................................................................................... 69
Figure 3.48: Marine Corps Base Inland Wind Direction During Period of Low Chloride Deposition...................................................................................................................... 70
Figure 3.49: Marine Corps Base Inland Wind Speed During Period of Low Chloride Deposition...................................................................................................................... 70
Figure 3.50: Marine Corps Base Inland Wind Direction During Period of High Chloride Deposition...................................................................................................................... 71
Figure 3.51: Marine Corps Base Inland Wind Speed During Period of High Chloride Deposition...................................................................................................................... 71
Figure 4.1: 2" wide 20 gauge strips with 4 #8 or #10 screws............................................... 74
Figure 4.2: 2" wide 16 gauge strips with 4 #8 or #10 screws............................................... 74
Figure 4.3: 1" wide 20 gauge strips with 2 #8 or #10 screws............................................... 75
Figure 4.4: 1" wide 16 gauge strips with 2 #8 or #10 screws............................................... 75
Figure 4.5: Test Specimen in Test Frame. ............................................................................ 76

Corrosion of Galvanized Fasteners University of Hawaii Final Report Steel Framing Alliance
xiv
Figure 4.6: Test results for 2” wide 20 gauge strips with 4#10 screws. ............................... 77
Figure 4.7: Test results for 2” wide 20 gauge strips with 4#8 screws. ................................. 78
Figure 4.8: Test results for 2” wide 16 gauge strips with 4#10 screws. ............................... 79
Figure 4.9: Test results for 2” wide 16 gauge strips with 4#8 screws. ................................. 80
Figure 4.10: Test results for 1” wide 20 gauge strips with 2#10 screws. ............................. 81
Figure 4.11: Test results for 1” wide 20 gauge strips with 2#8 screws. ............................... 82
Figure 4.12: Test results for 1” wide 16 gauge strips with 2#10 screws. ............................. 83
Figure 4.13: Test results for 1” wide 16 gauge strips with 2#8 screws. ............................... 84
Figure 4.14: Test Specimen - 1¼ ” wide 16 gauge (54 mil) lap connection with 2#10 screws....................................................................................................................................... 85
Figure 4.15: Lox-head (left) and Hex-head (right) screws in test connections. ................... 86
Figure 4.16: Test results for 2#10 Lox-head screws in 1” wide 16 gauge lap connection. .. 87
Figure 4.17: Test results for 2#10 Hex-head screws in 1” wide 16 gauge lap connection... 88
Figure 5.1: QFOG Cyclic Corrosion Chamber 1100............................................................ 91
Figure 5.2: Corrosion chamber adjacent to Structures Lab .................................................. 92
Figure 5.3: Oil-less air compressor and air filter.................................................................. 93
Figure 5.4: Reverse Osmosis water purifier behind the QFOG chamber............................. 94
Figure 5.5: Drain sump with sump pump and associated plumbing..................................... 94
Figure 5.6: Daily testing cycle for SAE J2334 standard ...................................................... 99
Figure 5.7: Corrosion ratio for steel and zinc (after Zhang, 1997)..................................... 100
Figure 5.8: Corrosion rates for various test routines (after Zhang, 1997) .......................... 100
Figure 5.9: Steel, sand-blasted steel and zinc coated steel coupons (Left to right) ............ 103
Figure 5.10: Steel and zinc coupons after 5 days in the corrosion chamber (160 cycles).. 104
Figure 5.11: Steel and zinc coupons along with connection specimens in wall cavity. ..... 104
Figure 5.12: Steel and zinc coupons after 3186 cycles in the corrosion chamber.............. 105
Figure 5.13: Comparison of corrosion rates for steel and zinc coupons in the corrosion chamber........................................................................................................................ 106
Figure 5.14: Ratio of corrosion rate for steel and zinc coupons in corrosion chamber ...... 106
Figure 5.15: Steel and zinc corrosion rates in terms of mass loss per surface area per cycle..................................................................................................................................... 107
Figure 5.16: Test connections in the corrosion chamber.................................................... 108
Figure 5.17: Steel and zinc coupons in the corrosion chamber .......................................... 108

Corrosion of Galvanized Fasteners University of Hawaii Final Report Steel Framing Alliance
xv
Figure 6.1: Control specimen in test frame ........................................................................ 109
Figure 6.2: Typical control test specimen after failure....................................................... 110
Figure 6.3: MCBH Coastal – 7 Months Exterior Exposure................................................ 111
Figure 6.4: MCBH Coastal – 7 Months Exterior Exposure – Test Results........................ 111
Figure 6.5: MCBH Coastal – 3 Months Exterior Exposure + 4 Months Open Crawl Exposure ...................................................................................................................... 112
Figure 6.6: MCBH Coastal – 3 Months Ext. Exp. + 4 Months Open Crawl Exp. – Test Results.......................................................................................................................... 112
Figure 6.7: MCBH Coastal – 7 Months Open Crawl Exposure ......................................... 113
Figure 6.8: MCBH Coastal – 7 Months Open Crawl Exposure – Test Results.................. 113
Figure 6.9: MCBH Coastal – 7 Months Covered Crawl Exposure .................................... 114
Figure 6.10: MCBH Coastal – 7 Months Covered Crawl Exposure – Test Results........... 114
Figure 6.11: MCBH Inland – 7 Months Exterior Exposure ............................................... 115
Figure 6.12: MCBH Inland – 7 Months Exterior Exposure – Test Results........................ 115
Figure 6.13: Iroquois Coastal – 7 Months Exterior Exposure ............................................ 116
Figure 6.14: Iroquois Coastal – 7 Months Exterior Exposure – Test Results .................... 116
Figure 6.15: Average Strength Ratio for field specimens after 7 month exposure ............ 117
Figure 6.16: Average Displacement at Peak Load for field specimens exposed for 7 months...................................................................................................................................... 118
Figure 6.17: Test connections after 1056 cycles – Threads up (left) and down (right)...... 119
Figure 6.18: Connection tests after 1056 cycles in corrosion chamber with threads up. ... 120
Figure 6.19: Connection tests after 1056 cycles in corrosion chamber with threads down...................................................................................................................................... 120
Figure 6.20: Test connections after 1309 cycles – Threads up (left) and down (right)...... 121
Figure 6.21: Connection tests after 1309 cycles in corrosion chamber with threads up. ... 121
Figure 6.22: Connection tests after 1309 cycles in corrosion chamber with threads down...................................................................................................................................... 122
Figure 6.23: Test connections after 1537 cycles – Threads up (left) and down (right)...... 122
Figure 6.24: Connection tests after 1537 cycles in corrosion chamber with threads up. ... 123
Figure 6.25: Connection tests after 1537 cycles in corrosion chamber with threads down...................................................................................................................................... 123
Figure 6.26: Test connections after 1695 cycles – Threads up (left) and down (right)...... 124
Figure 6.27: Connection tests after 1695 cycles in corrosion chamber with threads up. ... 124

Corrosion of Galvanized Fasteners University of Hawaii Final Report Steel Framing Alliance
xvi
Figure 6.28: Connection tests after 1695 cycles in corrosion chamber with threads down...................................................................................................................................... 125
Figure 6.29: Test connections after 1979 cycles – Threads up (left) and down (right)...... 125
Figure 6.30: Connection tests after 1979 cycles in corrosion chamber with threads up. ... 126
Figure 6.31: Connection tests after 1979 cycles in corrosion chamber with threads down...................................................................................................................................... 126
Figure 6.32: Test connections after 2772 cycles – Threads up (left) and down (right)...... 127
Figure 6.33: Connection tests after 2772 cycles in corrosion chamber with threads up. ... 127
Figure 6.34: Connection tests after 2772 cycles in corrosion chamber with threads down...................................................................................................................................... 128
Figure 6.35: Strength Ratio versus Number of Cycles in corrosion chamber .................... 129
Figure 6.36: Peak Displacement versus Number of Cycles in corrosion chamber ............ 129
Figure 6.37: Original screw threads.................................................................................... 130
Figure 6.38: Screw threads after 1537 cycles in the corrosion chamber. ........................... 130
Figure 6.39: Close-up of screw threads after control specimen failure. ............................. 131
Figure 6.40: Close-up of screw threads after failure of 1537 cycle specimen. .................. 131
Figure 7.1: Interior wall framing and fasteners at Iroquois Coastal site after 20 months exposure ....................................................................................................................... 135
Figure 7.2: Attic framing at Iroquois Coastal site after 20 months exposure..................... 135
Figure 7.3: Attic framing at Wheeler site after 20 months exposure.................................. 136
Figure 7.4: Crawl space post and cripple wall framing at Iroquois Coastal after 20 months...................................................................................................................................... 136
Figure 7.5: Exposed floor joists at Iroquois Coastal after 20 months exposure. ................ 136
Figure 7.6: Wall framing with vapor barrier at MCBH Inland after 28 months exposure. 137
Figure 7.7: Wall framing without vapor barrier at MCBH Inland after 28 months. .......... 137
Figure 7.8: Wall framing with plywood sheathing at MCBH Inland after 28 months. ...... 138
Figure 7.9: Vented attic framing at MCBH Inland after 28 months exposure. .................. 138
Figure 7.10: Crawl space cripple wall and post at MCBH Inland after 5 months exposure...................................................................................................................................... 139
Figure 7.11: Crawl space cripple wall and post at MCBH Inland after 16 months exposure...................................................................................................................................... 139
Figure 7.12: Crawl space cripple wall and post at MCBH Inland after 28 months exposure...................................................................................................................................... 139
Figure 7.13: Crawl space floor joists at MCBH Inland after 16 months exposure. ........... 140

Corrosion of Galvanized Fasteners University of Hawaii Final Report Steel Framing Alliance
xvii
Figure 7.14: Crawl space floor joists at MCBH Inland after 28 months exposure. ........... 140
Figure 7.15: Floor joist with plywood sheathing after 28 months exposure. ..................... 140
Figure 7.16: Wall framing with lap siding and vapor barrier, MCBH Coastal after 16 months.......................................................................................................................... 141
Figure 7.17: Wall framing with lap siding and vapor barrier, MCBH Coastal after 21 months.......................................................................................................................... 142
Figure 7.18: Wall framing with lap siding and vapor barrier, MCBH Coastal after 28 months.......................................................................................................................... 142
Figure 7.19: Wall framing with lap siding without vapor barrier, MCBH Coastal after 16 months.......................................................................................................................... 143
Figure 7.20: Wall framing with lap siding without vapor barrier, MCBH Coastal after 21 months.......................................................................................................................... 143
Figure 7.21: Wall framing with lap siding without vapor barrier, MCBH Coastal after 28 months.......................................................................................................................... 143
Figure 7.22: Wall framing with plywood sheathing, MCBH Coastal after 16 months. ..... 144
Figure 7.23: Wall framing with plywood sheathing, MCBH Coastal after 21 months. ..... 144
Figure 7.24: Wall framing with plywood sheathing, MCBH Coastal after 28 months. ..... 144
Figure 7.25: Vented attic framing at MCBH Coastal after 16 months. .............................. 145
Figure 7.26: Vented attic framing at MCBH Coastal after 21 months. .............................. 145
Figure 7.27: Vented attic framing at MCBH Coastal after 28 months. .............................. 145
Figure 7.28: Crawl space cripple wall and post, MCBH Coastal after 5 months............... 146
Figure 7.29: Crawl space cripple wall and post, MCBH Coastal after 16 months............. 146
Figure 7.30: Crawl space cripple wall and post, MCBH Coastal after 21 months............. 147
Figure 7.31: Crawl space cripple wall and post, MCBH Coastal after 28 months............. 147
Figure 7.32: Crawl space exposed floor joists, MCBH Coastal after 5 months. ................ 147
Figure 7.33: Crawl space exposed floor joists, MCBH Coastal after 10 months. .............. 148
Figure 7.34: Crawl space exposed floor joists, MCBH Coastal after 16 months. .............. 148
Figure 7.35: Crawl space covered floor joists, MCBH Coastal after 16 months. .............. 149
Figure 7.36: Crawl space exposed floor joists, MCBH Coastal after 21 months. .............. 149
Figure 7.37: Crawl space covered floor joists, MCBH Coastal after 21 months. .............. 150
Figure 7.38: Crawl space exposed floor joists, MCBH Coastal after 28 months. .............. 150

Corrosion of Galvanized Fasteners University of Hawaii Final Report Steel Framing Alliance
xviii

Corrosion of Galvanized Fasteners University of Hawaii Final Report Steel Framing Alliance
1
1 INTRODUCTION
1.1 PROJECT OUTLINE
This research program investigated the potential for corrosion of galvanized fasteners used in cold-formed steel (CFS) framing by exposing test samples to a variety of environmental conditions frequently found in Hawaii. The results of this research will aid in the evaluation of galvanized CFSF fasteners in various exposure conditions.
The project was initiated on September 26, 2000 by an award from the Department of Housing and Urban Development (HUD) to the North American Steel Framing Alliance (NASFA), subsequently changed to the Steel Framing Alliance. The project includes a research effort to study the effects of corrosion of galvanized fasteners on CFSF connection behavior, followed by a final report and development of a Practice Guide for use by industry. As director of the Steel Framing Alliance, Timothy Waite was principal investigator for the first two years of this project, followed by Larry Williams, current president. The Steel Framing Alliance subcontracted the research component of this study to the Civil and Environmental Engineering Department at the University of Hawaii (UH), a non-profit State of Hawaii educational institution. The principal investigator at UH is Dr. Ian N. Robertson, Associate Professor of Structural Engineering.
The project had a two-year duration with various scheduled deliverables, but was extended by an additional year to allow for delays in establishment of the field monitoring sites.
1.2 PROJECT JUSTIFICATION
Cold-formed steel construction is rapidly expanding in the residential construction market, particularly in Hawaii. The primary benefits of this structural material over traditional timber construction are the consistent material properties, relatively stable price, and resistance to termite damage. Over 60% of new residential construction in the State of Hawaii now utilizes light gage steel construction, and this trend is expected to spread to the US mainland, particularly in regions were termite damage to timber construction is a concern. However, the long-term performance of galvanized steel framing in relatively corrosive coastal environments is still a concern. This is a particular concern with respect to fasteners with relatively thin zinc coatings compared with the G60 and G90 coatings on the CFS sections. This project was therefore conceived to investigate the performance of galvanized fasteners typically used in CFS framing construction when subjected to a variety of exposure conditions on the island of Oahu. It is hoped that the results of this study will provide valuable guidance for future CFS framing construction in Hawaii and elsewhere.
1.3 PROJECT OBJECTIVES
The primary objective of this project was to study the effect of corrosion on the structural integrity of galvanized fasteners used in cold-formed steel construction. A number of specific tasks were developed to meet this objective. These tasks are described below.

Corrosion of Galvanized Fasteners University of Hawaii Final Report Steel Framing Alliance
2
1.3.1 Task 1: Literature Search
Over 20 books, papers and other publications relating to galvanized steel and fastener corrosion were collected and reviewed as part of the literature search. The draft literature review report was reviewed by the sponsor in December 2000 and the final report was completed in January 2001. This report is included as Appendix G.
1.3.2 Task 2: Construction of Field Enclosures
UH personnel developed construction drawings of the Field Enclosures based on suggestions received during the advisory committee meetings. These drawings were distributed to suppliers and contractors who donated labor and materials for construction of the enclosures. All five enclosures were panelized during a carpenter-training workshop at Hawaii Pacific Steel Framing Alliance, Aiea, Hawaii. Two enclosures were assembled on site at Marine Corps Base Hawaii, while the other three enclosures were constructed at a field site in Pearl City and then shipped to the field locations at Iroquois Point and Wheeler Army Airfield for erection on pre-poured footings.
1.3.3 Task 3: Determination of Test Sites
UH personnel identified five sites on military bases on Oahu as potential locations for the field enclosures. Permission was obtained from the appropriate authorities at each base to permit installation of the field enclosures and monitoring through September 2003. Extensions to these license agreements have made it possible to maintain the field enclosures for at least a further 2 years at all sites. The original intent was to utilize nearby airfield weather stations to determine meteorological data at the field sites. However, the microclimate at each site would not be identified by this means. The College of Engineering at the University of Hawaii contributed $25,000 towards the purchase of complete weather monitoring stations at each of the five field sites.
1.3.4 Task 4: Tensile Tests
In addition to monitoring the performance of the CFS framing sections in each of the field enclosures, screwed connection specimens have been located in various exposure conditions in each enclosure so as to study the structural condition of the connections over time. The configuration of the tensile test specimens was selected through extensive testing of various screw types and connection configurations. The final connection specimen consists of a lap splice between two 1-1/4” wide 54 mil (16 gage) galvanized sheet metal strips connected by means of two #10 hex-head galvanized screws positioned along the centerline of the strips. Numerous identical specimens have been located in each field enclosure and other identical specimens are being subjected to accelerated corrosion in a corrosion chamber at the University of Hawaii. Control specimens have been tested to determine the base-line shear capacity of the screws. Specimens from the accelerated corrosion chamber have been tested at various stages of corrosion for comparison with the control base line. Future tests of connections from the field enclosures will also be compared with the base-line tests and with the results from the corrosion chamber specimens in an attempt to correlate the field performance to the corrosion chamber exposure.

Corrosion of Galvanized Fasteners University of Hawaii Final Report Steel Framing Alliance
3
1.3.5 Task 5: Corrosion Tests
In order to accelerate the corrosion of connection specimens in the Structural Engineering Laboratory at UH, a cyclic corrosion chamber was purchased with funds from the UH College of Engineering and the Steel Framing Alliance. The chamber was installed and accelerated corrosion tests initiated once the field enclosures had been established.During the initial literature review, and subsequent literature searches, a number of accelerated corrosion test procedures were evaluated. A cyclic wetting and drying salt spray test routine was selected for the initial corrosion chamber tests since it provided the best simulation of atmospheric conditions. A series of test connections have been subjected to this corrosion routine with selected specimens removed at weekly intervals for testing. The corrosion condition of the screws was calibrated to the reduction in shear strength of the screwed lap splice connections.
1.3.6 Task 6: Technology Transfer
A number of presentations to the local engineering, architectural and construction industries have already been made based on the results of this research program. National and international dissemination of the project results will be made subsequent to finalization of this report and the associated industry guidelines.
1.4 PROJECT TEAM
The research project team is presented in Figure 1.1. Overall management of the project was provided by the principal
investigator for the Steel Framing Alliance. Scheduled project review was performed by representatives of the sponsor, Housing and Urban Development (HUD), and the Steel Framing Alliance. An advisory committee made up of 11 members representing suppliers, contractors and user groups provided guidance for the research effort and reviewed all progress reports prior to dissemination. The research has been performed at the University of Hawaii (UH) Structural Engineering Test Laboratory by the UH principal investigator, Ian Robertson, and four graduate research assistants.

Corrosion of Galvanized Fasteners University of Hawaii Final Report Steel Framing Alliance
4
Figure 1.1: Project Organizational Chart
1.4.1 Advisory Committee
The original 11 members of the advisory committee represent a wide range of expertise drawn from all fields related to galvanized fasteners and cold-formed steel design and construction. The committee members are listed in Table 1-1 along with their company affiliation and the sector of the industry that they represent. Advisory committee meetings were held at appropriate times during the project and all progress reports were distributed to the advisory committee for review prior to submission to the sponsor. Committee members had numerous valuable suggestions that were incorporated into the research program.
Overall Project Management Steel Framing Alliance
Principal Investigators: Tim Waite Larry Williams
Project Review HUD and Steel Framing Alliance
HUD Review: Dana Bres Mike BlansfordSFA Review: Don Moody
Jay Larson
Advisory Committee Hawaii Steel Alliance: Nick Benuska Mike Fernandez Bud Waters Bob Wilson Kevin Wolfley Hawaii LGSEA: Brian Ide Les Nagata Cominco Inc.: Dr. Gregory ZhangArmy Corps. of Engrs.: Wayne YamashitaMarine Corps.: Steve Tome Navy: Ronette Lee
Research Facility University of Hawaii at Manoa
Principal Investigator: Ian RobertsonResearch Assistants: Tina Neville Eddie Neville Kathleen Horgan Svetlana O’Malley

Corrosion of Galvanized Fasteners University of Hawaii Final Report Steel Framing Alliance
5
Table 1-1: Advisory Committee Members
Name Company Representing
Nick Benuska SuperDrive Pacific HSA - Fastener Supplier
Mike Fernandez Dietrich Industries HSA - CFS Supplier
Brian Ide JAI Engineers LGSEA - Structural Engineer
Ms. Ronette Lee Navy Aloha Center Navy
Les Nagata Structural Analysis Group LGSEA - Structural Engineer
Steve Tome US Marine Corps Marine Corps
Bud Waters Hunt Building Corporation HSA - Large Contractor
Bob Wilson E. T. & F. HSA - Fastener Supplier
Kevin Wolfley Power Builders HSA - Small Contractor
Wayne Yamashita US Army Corps of Engineers Army
Dr. Gregory Zhang Teck Cominco, Inc. Corrosion Expert

Corrosion of Galvanized Fasteners University of Hawaii Final Report Steel Framing Alliance
6
Corrosion of Galvanized Fasteners University of Hawaii Final Report Steel Framing Alliance
7
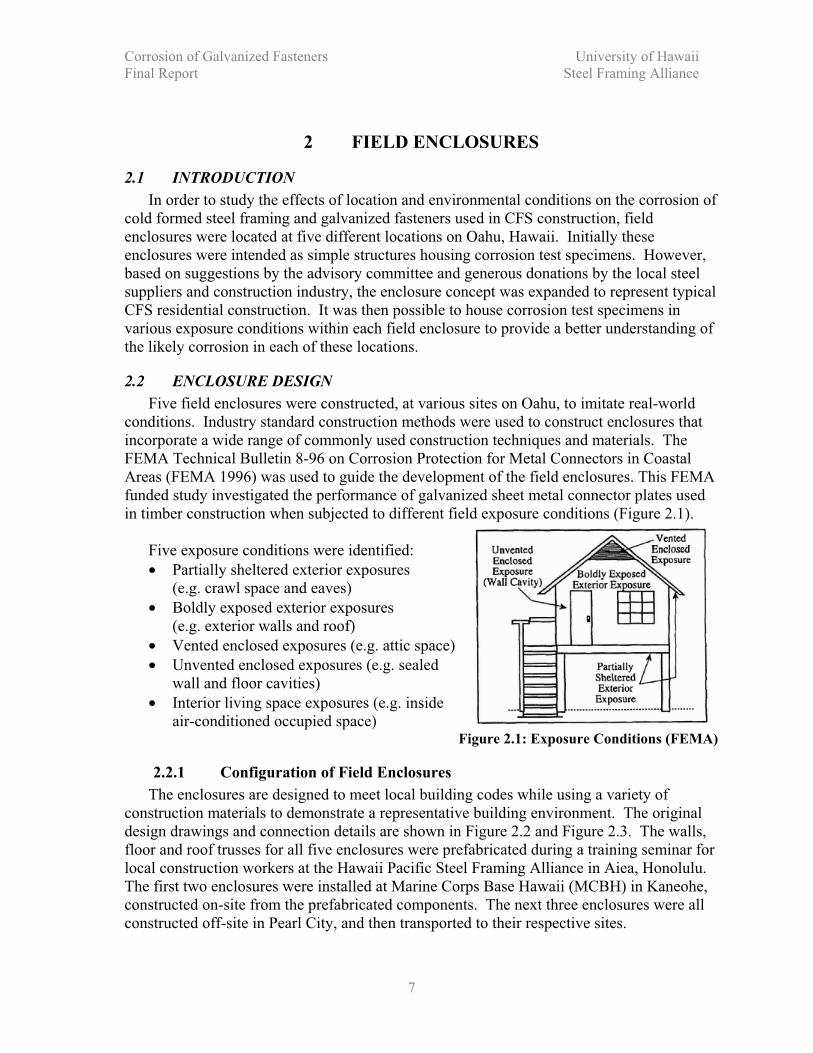
2 FIELD ENCLOSURES
2.1 INTRODUCTION
In order to study the effects of location and environmental conditions on the corrosion of cold formed steel framing and galvanized fasteners used in CFS construction, field enclosures were located at five different locations on Oahu, Hawaii. Initially these enclosures were intended as simple structures housing corrosion test specimens. However, based on suggestions by the advisory committee and generous donations by the local steel suppliers and construction industry, the enclosure concept was expanded to represent typical CFS residential construction. It was then possible to house corrosion test specimens in various exposure conditions within each field enclosure to provide a better understanding of the likely corrosion in each of these locations.
2.2 ENCLOSURE DESIGN
Five field enclosures were constructed, at various sites on Oahu, to imitate real-world conditions. Industry standard construction methods were used to construct enclosures that incorporate a wide range of commonly used construction techniques and materials. The FEMA Technical Bulletin 8-96 on Corrosion Protection for Metal Connectors in Coastal Areas (FEMA 1996) was used to guide the development of the field enclosures. This FEMA funded study investigated the performance of galvanized sheet metal connector plates used in timber construction when subjected to different field exposure conditions (Figure 2.1).
Five exposure conditions were identified:
Partially sheltered exterior exposures(e.g. crawl space and eaves)
Boldly exposed exterior exposures(e.g. exterior walls and roof)
Vented enclosed exposures (e.g. attic space)
Unvented enclosed exposures (e.g. sealed wall and floor cavities)
Interior living space exposures (e.g. inside air-conditioned occupied space)
Figure 2.1: Exposure Conditions (FEMA)
2.2.1 Configuration of Field Enclosures
The enclosures are designed to meet local building codes while using a variety of construction materials to demonstrate a representative building environment. The original design drawings and connection details are shown in Figure 2.2 and Figure 2.3. The walls, floor and roof trusses for all five enclosures were prefabricated during a training seminar for local construction workers at the Hawaii Pacific Steel Framing Alliance in Aiea, Honolulu. The first two enclosures were installed at Marine Corps Base Hawaii (MCBH) in Kaneohe, constructed on-site from the prefabricated components. The next three enclosures were all constructed off-site in Pearl City, and then transported to their respective sites.

Corrosion of Galvanized Fasteners University of Hawaii Final Report Steel Framing Alliance
8
Figure 2.2: Field Enclosure Layout

Corrosion of Galvanized Fasteners University of Hawaii Final Report Steel Framing Alliance
9
Figure 2.3: Field Enclosure Connection Details

Corrosion of Galvanized Fasteners University of Hawaii Final Report Steel Framing Alliance
10
Some common features of all the enclosures are:
Exposed cripple wall and post supports in open crawl space below floor.
Exposed floor joists in half of the crawl space.
Floor joists enclosed by plywood in half of the crawl space.
Hardie Board and/or vinyl siding material for exterior walls.
Some walls with vapor barrier, some without.
Drywall interior to enclose insulated and un-insulated wall cavities.
Vented attic space.
Zinc-chromate coated Lox-head screws used in floor and wall framing.
Zinc galvanized Hex-head screws used in roof framing.
Zinc galvanized screws and ETF pin fasteners used to secure siding.
Zinc galvanized screws used to secure interior drywall.
All steel sections are G60 galvanized
2.3 ENCLOSURE LOCATIONS
Technical Bulletin 8-96 (FEMA 1996) also identifies three environmental exposure conditions based on distance from the coastline, namely coastal (within 100 meters of the coastline), intermediate (between 100 and 1000 meters of the coastline), and inland (beyond 1000 meters from the coastline). The locations of the five field enclosures and the environmental exposure condition at each site are listed in Table 2-1. Military installations were selected for added security against potential vandalism of the field enclosures. These sites were also selected because of their proximity to the weather stations at MCBH airfield, Hickam Airfield and Wheeler Army Airfield. This issue was superceded by the installation of extensive meteorological instrumentation at each of the enclosures.
As these military base locations have increased the security at the field sites, there were significant delays in getting permission to install the enclosures. At times it has also been difficult to gain access to the sites for monitoring purposes; particularly in view of the increased Base security measures implemented subsequent to the World Trade Center attacks on September 11, 2001.
Table 2-1: Field enclosure location and associated exposure condition
Station Location Environmental Exposure
Condition
1 Kaneohe Marine Corps Base Hawaii, Coastal Coastal
(230 meters from coastline)
2 Kaneohe Marine Corps Base Hawaii, Inland Intermediate
(535 meters from coastline)
3 Iroquois Point Naval Housing, Coastal Coastal
(55 meters from coastline)
4 Iroquois Point Naval Housing, Inland Intermediate
(550 meters from coastline)
5 Wheeler Army Airfield, Interior Inland
(beyond 1000 meters from coastline)

Corrosion of Galvanized Fasteners University of Hawaii Final Report Steel Framing Alliance
11
Figure 2.4: Field enclosure locations on Oahu
2.3.1 Selected Field Sites
The five sites selected for field enclosures are shown on a map of Oahu in Figure 2.4. Locations 1 and 2 are in Marine Corps Base Hawaii, which occupies the isthmus forming the outer edge of Kaneohe Bay. These sites are on the NE Windward coast of Oahu, which is subject to the dominant on-shore NE trade wind flow. Locations 3 and 4 are located on the Leeward coast in Iroquois Point Naval Housing, directly across the mouth of Pearl Harbor from Hickam Air force Base and Honolulu International Airport. Location 5 is in Wheeler Army Airfield in the interior of the island between the windward Ko’olau mountain range and the leeward Waianae mountain range.
Corrosion of Galvanized Fasteners University of Hawaii Final Report Steel Framing Alliance
12
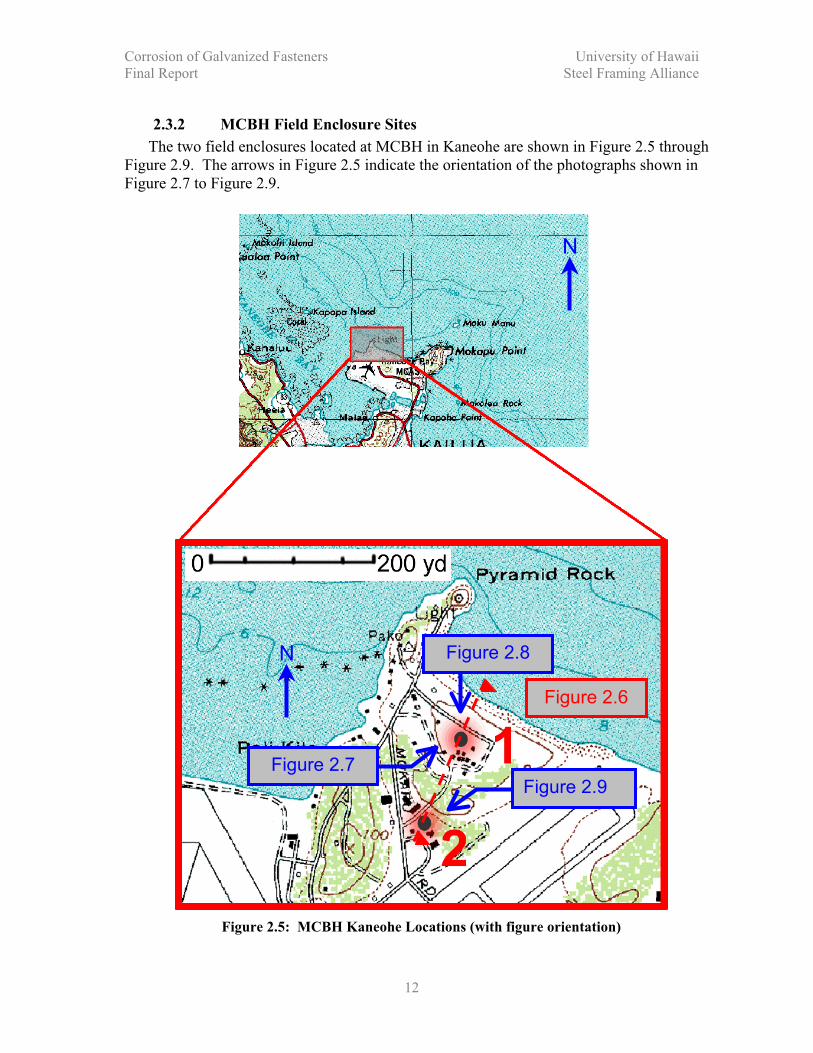
2.3.2 MCBH Field Enclosure Sites
The two field enclosures located at MCBH in Kaneohe are shown in Figure 2.5 through Figure 2.9. The arrows in Figure 2.5 indicate the orientation of the photographs shown in Figure 2.7 to Figure 2.9.
Figure 2.5: MCBH Kaneohe Locations (with figure orientation)
Figure 2.7
Figure 2.8
Figure 2.9
N
N
Figure 2.6

Corrosion of Galvanized Fasteners University of Hawaii Final Report Steel Framing Alliance
13
535 m (1750 ft)
230 m (750 ft)
21 m (70 ft)
10 m (33 ft)
MCBH CoastalMCBH Inland
Prevailing
Wind
Figure 2.6: MCBH Site Profile
Figure 2.7: MCBH Coastal, looking NE, towards the coastline

Corrosion of Galvanized Fasteners University of Hawaii Final Report Steel Framing Alliance
14
Figure 2.8: MCBH Coastal, looking S, towards the Ko’olau mountains
Figure 2.9: MCBH Inland, looking SW, towards the Ko’olau mountains

Corrosion of Galvanized Fasteners University of Hawaii Final Report Steel Framing Alliance
15
2.3.3 Iroquois Point Field Enclosure Sites
Figure 2.10 shows the two field enclosure sites in the Iroquois Point Naval Housing area.The arrows indicate the orientation of the photographs shown in Figure 2.12 and Figure 2.13.
Figure 2.10: Iroquois Point enclosure locations
Figure 2.13 Figure 2.12
N
N
Figure 2.11

Corrosion of Galvanized Fasteners University of Hawaii Final Report Steel Framing Alliance
16
Iroquois Coastal Iroquois Inland
Prevailing
WindVegetation
Grass fieldGrass field
Vegetation
Single story homes
Yacht HarborOcean
55 m
(180 ft)
550 m (1800 ft)
Figure 2.11: Iroquois Point Site Profile
Figure 2.12: Iroquois Point, Coastal, Looking South towards ocean
Figure 2.13: Iroquois Point, Inland, looking East

Corrosion of Galvanized Fasteners University of Hawaii Final Report Steel Framing Alliance
17
2.3.4 Wheeler Army Airfield Field Enclosure Site
Figure 2.14 shows the location of the field enclosure at Wheeler Army Airfield in Wahiawa, central Oahu. The arrow indicates the orientation of the photograph of the enclosure shown in Figure 2.15.
Figure 2.14: Wheeler Army Airfield enclosure location
N
N
Figure 2.15

Corrosion of Galvanized Fasteners University of Hawaii Final Report Steel Framing Alliance
18
Figure 2.15: Wheeler field enclosure looking Northeast

Corrosion of Galvanized Fasteners University of Hawaii Final Report Steel Framing Alliance
19
2.4 ENCLOSURE CONSTRUCTION
Table 2-2 lists the companies and individuals that contributed materials, expertise and time
towards construction of the UH corrosion field chambers.
Table 2-2: List of contributors to the field enclosures
Company Donation Contact
Hunt Building Corporation Coordination, labor & steel framing material for construction of all five enclosures
Bud Waters, Tim Stengel &Ralph Valentino
Niche Site Concrete Inc. Labor to construct footings at all 5 enclosures at MCBH, Iroquois Point and Wheeler AAF
Geoff Michaelson & Bill Wiland
Ameron International Inc. Concrete for footings at all 5 enclosures at MCBH, Iroquois Point and Wheeler AAF
Bill Alina,George West &Frances Ahloy
G. W. Killebrew Insulation and sheetrock for all 5 enclosures at MCBH, Iroquois Point and Wheeler AAF
Kekoa Faurot
Honsador Lumber - Oahu Siding and doors for 2 enclosures at MCBH Wayne Lincoln
John Wagner Associates, Inc. - Grabber Construction Products
Screw fasteners for all enclosures and for all test coupons
Terry Boswell
E T & F Fasteners Pin fasteners for siding Bob Wilson
RSI Roofing & Bldg Supply Tech shield & shingles for 2 enclosures at MCBH
Richie Mudd
Simpson Strong Tie Load-path connectors for all enclosures Steve Duddles
Pacific Steel Construction Labor for construction of all 5 enclosures at MCBH, Iroquois Point and Wheeler AAF
Ken Ball
American Tradition Homes Labor for construction of 2 enclosures at MCBH and installation of vinyl siding at 3 enclosures at Iroquois Point and Wheeler AAF
John Pearson,Matt Winward & Dan Kinney
Sunrise Construction, Inc. Labor for construction of 2 enclosures at MCBH
Marcus Gillespie
Dietrich Industries Inc. Steel to make test coupons Akira Usami
Skyline Roofing, Inc. Roof installation for 3 enclosures at Iroquois Point and Wheeler AAF
Charlie Spiegel

Corrosion of Galvanized Fasteners University of Hawaii Final Report Steel Framing Alliance
20
Figure 2.16: Field Enclosure at Various Stages of Construction
2.5 FIELD ENCLOSURE CONSTRUCTION TIMELINES
The field enclosures were located within military bases on Oahu so as to increase the security and reduce the potential for vandalism. This has indeed proved to be the case, however, obtaining permission to build the enclosures on property controlled by the military proved more difficult than anticipated. The field enclosures were therefore not constructed as early as planned, nor could all sites be constructed at the same time. The exact dates for field enclosure construction and subsequent installation of weather stations, dataloggers and test connections are detailed in the timelines presented in Table 2-3 to Table 2-5.

Corrosion of Galvanized Fasteners University of Hawaii Final Report Steel Framing Alliance
21
Table 2-3: Construction and Inspection Timeline for MCBH Enclosures
Event Date
Select sites Dec. 15, 2000
UH-Navy License agreement finalized June 12, 2001
Enclosures panelized at HSA offices in Aiea June 16, 2001
Foundations constructed Oct. 2001
Framing assembled on site Nov. 2001
Roof sheathing installed Nov. 2001
Wall sheathing installed Dec. 2001
Interior drywall installed Dec. 2001
Weather station installed March 2002
Data logger installed March 2002
5 Month crawl space inspection April 2, 2002
10 Month crawl space inspection Sept. 2002
16 Month full structural inspection March 6, 2003
UH-Navy License agreement extended for 2 years June 11, 2003
Chloride candle installed Aug 12, 2003
21 Month full structural inspection Aug. 11, 2003
Connection test specimens installed Aug. 11, 2003
Steel and zinc coupons installed Sept. 23, 2003
1.5 Month connection exposure (22.5 Month inspection) Sept. 23, 2003
3 Month connection relocation (24 Month inspection) Nov. 11, 2003
7 Month connection relocation (28 Month inspection) March 11, 2004
Steel and zinc coupons and test connections tested March 22, 2004
Table 2-4: Construction Timeline for Iroquois Coastal and Inland Enclosures
Event Date
Select sites Dec. 15, 2000
Enclosures panelized at HSA offices in Aiea June 16, 2001
UH-Navy License agreement finalized June 27, 2002
Framing assembled at Hunt Building site in Pearl City July 2002
Roof sheathing installed July 2002
Wall sheathing installed July 2002
Interior drywall installed July 2002
Foundations constructed March 2003
Enclosure installed on foundations March 2003
Weather station installed June 2003
Data logger installed June 2003
13 Month full structural inspection Aug. 13, 2003
Connection test specimens installed Aug. 13, 2003
Chloride candle installed July 16, 2003
Steel and zinc coupons installed Dec. 11, 2003
7 Month connection relocation (20 Month inspection) March 18, 2004
Steel and zinc coupons and test connections tested March 22, 2004
License transferred from Navy to Chaney Brooks In Process

Corrosion of Galvanized Fasteners University of Hawaii Final Report Steel Framing Alliance
22
Table 2-5: Construction Timeline for Wheeler Enclosure
Event Date
Select site Dec. 15, 2000
Enclosures panelized at HSA offices in Aiea June 16, 2001
Framing assembled at Hunt Building site in Pearl City July 2002
Roof sheathing installed July 2002
Wall sheathing installed July 2002
Interior drywall installed July 2002
UH-Army License agreement finalized July 26, 2002
Foundations constructed May 2003
Enclosure installed on foundations May 2003
Weather station installed June 2003
Data logger installed July 2003
Chloride candle installed July 16, 2003
13 Month full structural inspection Aug. 18, 2003
Connection test specimens installed Aug. 18, 2003
Steel and zinc coupons installed Dec. 11, 2003
7 Month connection relocation (20 Month inspection) March 18, 2004
Steel and zinc coupons and test connections tested March 22, 2004
2.6 METEOROLOGICAL INSTRUMENTATION
In order to correlate corrosion rate to in-service conditions, the field enclosure environment must be monitored. The following is a list of monitored parameters at each field enclosure site:
External Temperature
External Relative Humidity
Internal Temperature (4 locations housing test connection samples)
Internal Relative Humidity (4 locations housing test connection samples)
Wind Speed
Wind Direction
Rainfall
Solar radiation levels
Atmospheric chloride levels
A weather monitoring system was installed at each field enclosure (Figure 2.17). The majority of the monitored parameters are recorded by an automated data collection system. Each system consists of the following components purchased from Campbell Scientific Inc., Logan, Utah:
CR10X Measurement and Control Module (Data logger)
CS500 Temperature and Relative Humidity Probe (5 probes)
LI200S Pyranometer (Solar Radiation sensor)
TE525 Tipping Bucket Rain Gage
03001 Wind Sentry (Wind speed and direction)
Solar Panel
PS12LA Power Supply

Corrosion of Galvanized Fasteners University of Hawaii Final Report Steel Framing Alliance
23
Each of these components is described briefly below. Complete descriptions of the weather monitoring equipment are provided by Neville and Robertson (2003).
Figure 2.17: Weather station external sensors and datalogger
2.6.1 CR10X Measurement and Control Module
The CR10X is a fully programmable datalogger and controller with non-volatile memory and a battery-backed clock (Figure 2.18). The assembly and wiring of each weather station was performed at the UH structural testing laboratory. After assembly, each station was programmed and tested to verify proper operation prior to field installation. The CR10X is accessed via a laptop computer using the PC208 Datalogger Support Software supplied by Campbell Scientific. The software is used to access the datalogger, load the program and retrieve the stored data. The CR10X has 2 Megabytes of Flash Electrically Erasable Programmable Read Only Memory (EEPROM) and 128 kilobytes of Static Random Access Memory (SRAM). The SRAM is used to compile and execute the program instructions and serves as an intermediate data storage location. The EEPROM is used to store the active program and as a final storage area for data.
The datalogger is programmed to sample all probes once every second. This sampled data is averaged every 15 minutes and recorded in final storage where it is later retrieved for analysis.
Figure 2.18: CR10X Datalogger and Control Unit

Corrosion of Galvanized Fasteners University of Hawaii Final Report Steel Framing Alliance
24
2.6.2 CS500 Temperature and Relative Humidity Probe
The CS500 probe contains a Platinum Resistance Temperature (PVT) detector and a
Vaisala INTERCAP capacitive relative humidity sensor. The CS500 probe used to measure the external parameters is installed inside a 6-plate radiation shield (Figure 2.19). The shield mitigates the effect of solar radiation on the temperature readings. The other temperature and relative humidity probes are placed in various locations throughout the field enclosure along with the test connection specimens.
Figure 2.19: External temperature and relative humidity probe in 6-plate radiation shield

Corrosion of Galvanized Fasteners University of Hawaii Final Report Steel Framing Alliance
25
2.6.3 LI200S Pyranometer
The LI200S measures incoming solar radiation with a silicon photovoltaic detector mounted in a cosine-corrected head (Figure 2.20). The LI200S is calibrated against an Eppley Precision Spectral Pyranometer to accurately measure sun plus sky radiation. The datalogger is programmed to store the average flux density, with units in Watts per square
meter. The LI200S has a maximum absolute error in natural daylight of 5%, but is
typically 3%.
Figure 2.20: LI200S solar radiation sensor mounted on leveling plate
2.6.4 TE525WS Tipping Bucket Rain Gage
The tipping rain bucket is an adaptation of the standard Weather Bureau tipping bucket rain gage. An 8-inch diameter funnel is used to direct rainwater to the bucket mechanism (Figure 2.21). As the bucket fills with rainwater, gravity causes the bucket to rotate downward. The bucket is attached to a switch that closes as the bucket tips to one side. The bucket will then rotate in the opposite direction as it fills with more rainwater. This back and forth tipping of the bucket closes and opens the switch. The number of switch cycles is recorded by the datalogger. The number of switch closures is converted to a rainfall rate in inches per hour prior to being stored in the datalogger memory.

Corrosion of Galvanized Fasteners University of Hawaii Final Report Steel Framing Alliance
26
Figure 2.21: Tipping Bucket Rain Gage showing internal bucket
2.6.5 Wind Sentry
A R. M. Young model 03001-5 wind sentry is used to measure wind speed and direction. Wind speed is monitored using a R. M. Young model 03101-5 three-cup anemometer. The datalogger is programmed to record wind speed in miles per hour (mph). An R. M. Young model 03301-5 wind vane is used to record wind direction (Figure 2.22).

Corrosion of Galvanized Fasteners University of Hawaii Final Report Steel Framing Alliance
27
Figure 2.22: Wind vane and anemometer
2.6.6 Atmospheric Chloride Monitoring
The amount of chlorides entrained in the air is required to determine how corrosive an environment will be. To determine and monitor chloride levels in the atmosphere around the field enclosures, an atmospheric chloride candle was installed at each site. The chloride candle measurements are conducted in accordance with the International Organization for Standardization 9225 (ISO 9225:1992(E)) standard. The chloride candle consists of a rain-protected wet textile surface, with a known area, being exposed for a specified duration.The textile surface, or wick, is wetted by capillary action from a purified water reservoir. The water in the reservoir is purified by reverse osmosis. The amount of chloride deposition is determined by chemical analysis of the reservoir solution after exposure. From the results of this analysis the chloride deposition rate is calculated, expressed in milligrams per square
meter per day [mg/(m2 d)].The chloride candles consist of a test tube, rubber stopper, candle wick (surgical gauze)
and a 500 mL polyethylene flask (Figure 2.23). The test tube is used to support the wick of the candle for exposure. The test tube is inserted through a hole in the rubber stopper. The gauze is placed over the test tube, exposing a known area of gauze. The other end of the gauze is routed through grooves in the stopper and allowed to fall to the bottom of the flask

Corrosion of Galvanized Fasteners University of Hawaii Final Report Steel Framing Alliance
28
where the purified water maintains the wick in a wet condition. The atmospheric candle is placed under a 500 mm x 500 mm square roof attached to the side of each field enclosure (Figure 2.24). The roof serves to minimize the effect of dilution from rainfall. After the candle has been exposed to the environment, the candle wick is washed into the flask. The fluid in the flask is then analyzed for its chloride content. This analysis is performed at the UH Mechanical Engineering Corrosion Laboratory using an Orion 290A Portable ISE/pH Meter and an Orion ion-selective electrode.
The procedure involves calibrating the meter and electrode in 0.0001, 0.001 and 0.01M chloride solutions prior to making any measurements. The calibration is checked during and after analysis. 2mL of 5M NaNO3 (ISA - ionic strength adjuster) is added to the calibration standards (100mL) and the samples being measured (100mL). Measurements are made at approximately 25oC.
Figure 2.23: Atmospheric Chloride Candle.

Corrosion of Galvanized Fasteners University of Hawaii Final Report Steel Framing Alliance
29
Figure 2.24: Atmospheric Chloride Candle and Shelter.
Evaporation of the water in the chloride candle flask requires that the candles be replaced with new, full flasks every two weeks. Glycerol can be used to reduce the evaporation rate, but may also affect the accuracy of the electronic chemical analysis, and so has not been used in the candles. Results of the chloride records obtained thus far at each site are presented in Chapter 3.
2.7 FINAL ENCLOSURE LAYOUT
2.7.1 General Details
Figure 2.25 to Figure 2.27 show interior layouts of all five field enclosures. The siding varied on all enclosures as indicated in the figures. The same roofing material was used for all enclosures, consisting of composition tiles over plywood sheathing. All attic spaces were vented by perforated soffits at the eaves on two opposite sides of the enclosure. No CFS framing was exposed to direct exterior conditions at the eaves, but the roof trusses were fully exposed to the environment in the attic. Half of the floor joists in the crawl space were left open (exposed) while the other half were enclosed with a sheet of plywood attached to the bottom of the joists. Floor joists, wall studs and roof trusses were all framed at 16” on center.
A door was provided in the front wall of the enclosure and permanently open louver vents were located on the two side walls. The interior finish consisted of plywood flooring, with gypsum board on all walls and the ceiling. Portions of the walls and ceiling were

Corrosion of Galvanized Fasteners University of Hawaii Final Report Steel Framing Alliance
30
insulated while others were not. Initially the interior gypsum board joints were not taped, however once the test connections and corrosion coupons were installed in the walls and ceiling, all gypsum board joints were sealed with tape. This tape was removed when coupons were extracted for testing, and then replaced to maintain sealed conditions between the interior space and the wall or ceiling cavities, as would be typical in regular residential housing construction.
Test connections and steel and zinc corrosion coupons were installed in each enclosure at locations indicated in Figure 2.25 to Figure 2.27 as L1 to L7. For locations L1 through L6, 15 test connections were installed at each location to provide 5 sets of 3 specimens for future strength tests. Numerous specimens were placed in the exterior racks to allow for relocation after 3 and 6 month “construction exposure” while others will remain permanently exposed in the racks. Steel and zinc coupons are included at each location to establish the reference corrosion rates. Relative humidity and temperature sensors are included with the test connections at locations indicated by H&T1 to H&T4. The ambient exterior relative humidity and shade temperature are also recorded by the external RH and Temp sensor. At the MCBH locations, the relative humidity and temperature in the open crawl space is assumed to be the same as the ambient conditions.
2.7.2 Marine Corps Base Hawaii – Coastal and Inland Sites
The two enclosures at MCBH were constructed at the same time. There are many similarities between them but some minor differences. Figure 2.25 shows the interior layout of the coastal enclosure at MCBH. Figure 2.26 shows the interior layout of the inland enclosure. Both enclosures have two types of exterior siding. Two walls were clad with plywood and vinyl siding while the other two walls were clad with Hardie Board horizontal lap siding (Figure A.5). Since the laps in the Hardie Board siding are not sealed, a vapor barrier is usually provided on the inside of the siding (Figures A.50 to A.52). A vapor barrier was provided for one of the walls at each enclosure, but not for the other. At the coastal enclosure, the vapor barrier was not installed on the East side wall (Figures A.40 to A.45) while at the inland enclosure the vapor barrier was not installed on the East front wall (Figures B.62 and B.64). No vapor barrier was provided at the plywood sheathing with vinyl siding.
In the MCBH enclosures, three sets of field connections and corrosion coupons were installed in the wall cavities along with relative humidity and temperature sensors (L1, L2 and L3, Figures A.107 to A.109 resp.). One set of field specimens was installed in the attic space (L4, Figure A.110) while two sets were installed in the crawl space, one in the exposed portion (L5, Figure A.111) and one in the covered crawl space (L6, Figure A.112).Finally, a rack of test connections was left in the open adjacent to the enclosure (L7, Figures A.113 to A.115).

Corrosion of Galvanized Fasteners University of Hawaii Final Report Steel Framing Alliance
31
8'
H&T3
Relative Humidity and
Temperature Sensors
Coupon Location
Plywood below joists
Plywood sheathing with
Insulation
L1
6'-6"
Interior Layout
Marine Corps Base Hawaii
Coastal Site
H&T3
L3
Hardy Board with
vapor barrier
H&T1Side Wall
Open
Crawl
Space
L5
H&T2
L2
Front
Wall
KEY:
L3Covered
Crawl
Space
L6
Side Wall
External Coupon
Rack
L7
L4
H&T4
Hardy Board
without vapor barrier
Ceiling Plan
8'
6'-6"
Plywood with
Vinyl Siding
8'
Plywood with
Vinyl Siding
Back
Wall
8'
North
Hardy Board lap siding
with Insulation
Figure 2.25: Interior Layout for Field Enclosure at Marine Corps Base Hawaii – Coastal

Corrosion of Galvanized Fasteners University of Hawaii Final Report Steel Framing Alliance
32
L4
Interior Layout
Marine Corps Base Hawaii
Inland Site
H&T3Open
Crawl
Space
Front
Wall
8'
8'
6'-6"
L2
Side Wall
External Coupon
Rack
6'-6"
L7
Relative Humidity and
Temperature Sensors
Coupon Location
Plywood sheathing with
Insulation
Plywood below joists
L3
H&T3
Covered
Crawl
Space
H&T4
L5
KEY:
Side Wall
8'
L1 H&T1
Back
Wall
H&T2
Ceiling Plan
L3
8'
North
Hardy Board with
vapor barrier
Plywood with
Vinyl Siding
Plywood with
Vinyl Siding
Hardy Board
without vapor
barrier
L6
Hardy Board lap siding
with Insulation
Figure 2.26: Interior Layout for Field Enclosure at Marine Corps Base Hawaii – Inland
2.7.3 Iroquois Point and Wheeler Army Airfield enclosure sites
The two enclosures located at Iroquois Point and the one at Wheeler AAF were constructed at the same time at a Hunt Building construction site in Pearl City (Figure C.1). They were stored at this site for 6 months before being transported to their final locations. Figure 2.27 shows the interior layout for all three enclosures. They differ somewhat from the enclosures at MCBH. The roofing and truss framing are the same as for the MCBH

Corrosion of Galvanized Fasteners University of Hawaii Final Report Steel Framing Alliance
33
enclosures except that insulation is provided between the ceiling joists for half of the attic space. The floor framing is the same as MCBH, with half exposed to the crawl space while half is enclosed by a plywood sheet attached to the joist bottom flanges. The walls all consist of plywood sheathing with vinyl siding. No vapor barrier was provided for any of the walls, but half of each wall had insulation installed between the plywood sheathing and the interior drywall.
Because the wall cladding was the same throughout, only one set of test connections was installed in the wall cavities (L1, Figure C.27). Test connections and corrosion coupons were also installed in the attic, crawl space and on and external rack as described for the MCBH enclosures (L2 through L5, Figure 2.27). Relative humidity and temperature sensors were also installed in each of these locations.
L3
Interior Layout
Iroquois Coastal and Inland
Wheeler AAF
H&T3
Open
Crawl
Space
Front
Wall
8'
8'
North at Iroquois Inland
North at Wheeler
North at Iroquois Coastal
8'
Side Wall
External Coupon
Rack
8'
L5
Relative Humidity and
Temperature Sensors
Coupon Location
Plywood sheathing with
Insulation
Plywood below joists
Insulation between
ceiling joists
L3
H&T3
Covered
Crawl
Space
H&T4
L4
KEY:
Side Wall
8'
L1
H&T1
Back
Wall
H&T2
Ceiling Plan
L2
8'
Figure 2.27: Interior Layout for Field Enclosures at Iroquois Point and Wheeler AAF

Corrosion of Galvanized Fasteners University of Hawaii Final Report Steel Framing Alliance
34

Corrosion of Galvanized Fasteners University of Hawaii Final Report Steel Framing Alliance
35
3 METEOROLOGICAL DATA
3.1 INTRODUCTION
Full weather stations have been installed at each of the field enclosures as described in Chapter 2. Each weather station includes an automated data logger to record all electronic readings. The data loggers were programmed to monitor each instrument once every second. These data are then averaged over each 15-minute period and stored in the data logger memory for later downloading and processing.
Data have been collected continuously from each weather station since installation and commissioning of the weather stations. Representative samples of this data are presented below for each of the weather conditions monitored.
3.2 TEMPERATURE AND RELATIVE HUMIDITY
3.2.1 Wheeler AAF Site
Temperature and relative humidity probes were installed at Wheeler AAF on August 18, 2003 in the locations shown in Table 3.1.
Table 3.1: Temperature and Relative Humidity Sensor Placement at Wheeler AAF Site
Wheeler AAF Site
Location 1 (L1) Wall - Plywood Sheathing without Vapor Barrier
Location 2 (L2) Attic - Vented
Location 3 (L3) Open Crawl - Open to Elements
Location 4 (L4) Closed Crawl - Plywood Sheathing Below Joists
Location 5 (L5) Exterior
Figure 3.1 and Figure 3.2 show temperature and relative humidity records for September 2003, a typical summer month. Exterior temperature varies between 65 and 95 degrees in September 2003 while the attic experiences temperatures often 20 degrees higher than other interior and exterior locations. Open crawl and exterior locations experience humidity ranging from 40 to 95% in September, 2003, while the wall and the closed crawl space vary between 45 and 75%, and the attic experiences humidity from 25 to 80%. Low humidity levels correspond to high temperatures for the attic location. Figure 3.3 and Figure 3.4 show temperature and relative humidity records for January 2004, a typical winter month. In January 2004 the exterior temperature varies from 60 to 85 degrees while the attic experiences temperatures of about 10 degrees warmer than the other probe locations. The first three days of January indicate a low temperature range from 65 to 75 degrees, with little variation between probe locations. This was a particularly rainy, overcast period as discussed later. In January, 2004 open crawl and exterior humidity varies from 50 to 95% while the wall and closed crawl experience 55 to 85% humidity and the attic experiences 35 to 85% humidity. The first three days of January show a high humidity reading of 85 to 95%, with little variation between probe locations. As mentioned previously, this was a particularly rainy, overcast period.

Corrosion of Galvanized Fasteners University of Hawaii Final Report Steel Framing Alliance
36
September 2003 Temperature
60
65
70
75
80
85
90
95
100
105
110
115
1201-S
ep
2-S
ep
3-S
ep
4-S
ep
5-S
ep
6-S
ep
7-S
ep
8-S
ep
9-S
ep
10-S
ep
11-S
ep
12-S
ep
13-S
ep
14-S
ep
15-S
ep
16-S
ep
17-S
ep
18-S
ep
19-S
ep
20-S
ep
21-S
ep
22-S
ep
23-S
ep
24-S
ep
25-S
ep
26-S
ep
27-S
ep
28-S
ep
29-S
ep
30-S
ep
Tem
p (
F)
1-Wall2-Attic3-Open Crawl4-Closed Crawl5-Exterior
Figure 3.1: Wheeler AAF September 2003 Temperature
September 2003 Humidity
0
10
20
30
40
50
60
70
80
90
100
1-S
ep
2-S
ep
3-S
ep
4-S
ep
5-S
ep
6-S
ep
7-S
ep
8-S
ep
9-S
ep
10-S
ep
11-S
ep
12-S
ep
13-S
ep
14-S
ep
15-S
ep
16-S
ep
17-S
ep
18-S
ep
19-S
ep
20-S
ep
21-S
ep
22-S
ep
23-S
ep
24-S
ep
25-S
ep
26-S
ep
27-S
ep
28-S
ep
29-S
ep
30-S
ep
Hum
idity
(%
)
1-Wall2-Attic3-Open Crawl4-Closed Crawl5-Exterior
Figure 3.2: Wheeler AAF September 2003 Relative Humidity

Corrosion of Galvanized Fasteners University of Hawaii Final Report Steel Framing Alliance
37
January 2004 Temperature
60
65
70
75
80
85
90
95
100
105
110
115
1201-J
an
2-J
an
3-J
an
4-J
an
5-J
an
6-J
an
7-J
an
8-J
an
9-J
an
10-J
an
11-J
an
12-J
an
13-J
an
14-J
an
15-J
an
16-J
an
17-J
an
18-J
an
19-J
an
20-J
an
21-J
an
22-J
an
23-J
an
24-J
an
25-J
an
26-J
an
27-J
an
28-J
an
29-J
an
30-J
an
31-J
an
Tem
p (
F)
1-Wall2-Attic3-Open Crawl4-Closed Crawl5-Exterior
Figure 3.3: Wheeler AAF January 2004 Temperature
January 2004 Humidity
0
10
20
30
40
50
60
70
80
90
100
1-J
an
2-J
an
3-J
an
4-J
an
5-J
an
6-J
an
7-J
an
8-J
an
9-J
an
10-J
an
11-J
an
12-J
an
13-J
an
14-J
an
15-J
an
16-J
an
17-J
an
18-J
an
19-J
an
20-J
an
21-J
an
22-J
an
23-J
an
24-J
an
25-J
an
26-J
an
27-J
an
28-J
an
29-J
an
30-J
an
31-J
an
Hum
idity
(%
)
1-Wall2-Attic3-Open Crawl4-Closed Crawl5-Exterior
Figure 3.4: Wheeler AAF January 2004 Relative Humidity

Corrosion of Galvanized Fasteners University of Hawaii Final Report Steel Framing Alliance
38
3.2.2 Iroquois Point Coastal Site
Temperature and relative humidity probes were installed at Iroquois Point Coastal site on August 13, 2003 in the locations shown in Table 3.2.
Table 3.2: Temperature and R. H. Sensor Placement at Iroquois Point Coastal Site
Iroquois Point Coastal Site
Location 1 (L1) Wall - Plywood Sheathing without Vapor Barrier
Location 2 (L2) Attic - Vented
Location 3 (L3) Open Crawl - Open to Elements
Location 4 (L4) Closed Crawl - Plywood Sheathing Below Joists
Location 5 (L5) Exterior
Figure 3.5 and Figure 3.6 show temperature and relative humidity records for September 2003, while Figure 3.7 and Figure 3.8 show data for January 2004. The temperature and relative humidity records for this site and the Iroquois Inland site are similar to those for the Wheeler site.
September 2003 Temperature
60
65
70
75
80
85
90
95
100
105
110
115
120
1-S
ep
2-S
ep
3-S
ep
4-S
ep
5-S
ep
6-S
ep
7-S
ep
8-S
ep
9-S
ep
10-S
ep
11-S
ep
12-S
ep
13-S
ep
14-S
ep
15-S
ep
16-S
ep
17-S
ep
18-S
ep
19-S
ep
20-S
ep
21-S
ep
22-S
ep
23-S
ep
24-S
ep
25-S
ep
26-S
ep
27-S
ep
28-S
ep
29-S
ep
30-S
ep
Tem
p (
F)
1-Wall2-Attic3-Open Crawl4-Closed Crawl5-Exterior
Figure 3.5: Iroquois Point Coastal September 2003 Temperature

Corrosion of Galvanized Fasteners University of Hawaii Final Report Steel Framing Alliance
39
September 2003 Humidity
0
10
20
30
40
50
60
70
80
90
1001-S
ep
2-S
ep
3-S
ep
4-S
ep
5-S
ep
6-S
ep
7-S
ep
8-S
ep
9-S
ep
10-S
ep
11-S
ep
12-S
ep
13-S
ep
14-S
ep
15-S
ep
16-S
ep
17-S
ep
18-S
ep
19-S
ep
20-S
ep
21-S
ep
22-S
ep
23-S
ep
24-S
ep
25-S
ep
26-S
ep
27-S
ep
28-S
ep
29-S
ep
30-S
ep
Hum
idity (
%)
1-Wall2-Attic3-Open Crawl4-Closed Crawl5-Exterior
Figure 3.6: Iroquois Point Coastal September 2003 Humidity
January 2004 Temperature
60
65
70
75
80
85
90
95
100
105
110
115
120
1-J
an
2-J
an
3-J
an
4-J
an
5-J
an
6-J
an
7-J
an
8-J
an
9-J
an
10-J
an
11-J
an
12-J
an
13-J
an
14-J
an
15-J
an
16-J
an
17-J
an
18-J
an
19-J
an
20-J
an
21-J
an
22-J
an
23-J
an
24-J
an
25-J
an
26-J
an
27-J
an
28-J
an
29-J
an
30-J
an
31-J
an
Tem
p (
F)
1-Wall2-Attic3-Open Crawl4-Closed Crawl5-Exterior
Figure 3.7: Iroquois Point Coastal January 2004 Temperature

Corrosion of Galvanized Fasteners University of Hawaii Final Report Steel Framing Alliance
40
January 2004 Humidity
0
10
20
30
40
50
60
70
80
90
1001-J
an
2-J
an
3-J
an
4-J
an
5-J
an
6-J
an
7-J
an
8-J
an
9-J
an
10-J
an
11-J
an
12-J
an
13-J
an
14-J
an
15-J
an
16-J
an
17-J
an
18-J
an
19-J
an
20-J
an
21-J
an
22-J
an
23-J
an
24-J
an
25-J
an
26-J
an
27-J
an
28-J
an
29-J
an
30-J
an
31-J
an
Hum
idity (
%)
1-Wall2-Attic3-Open Crawl4-Closed Crawl5-Exterior
Figure 3.8: Iroquois Point Coastal January 2004 Humidity
3.2.3 Marine Corps Base Coastal Site
Temperature and relative humidity probes were installed at Marine Corps Base Coastal site on August 12, 2003 in the locations shown in Table 3.3.
Table 3.3: Temperature and R. H. Sensor Placement at Marine Corps Base Coastal Site
Marine Corps Base Coastal Site
Location 1 (L1) Wall - Plywood Sheathing without Vapor Barrier
Location 2 (L2) Wall - Hardie Board Lap Siding with Vapor Barrier
Location 3 (L3) Wall - Hardie Board Lap Siding without Vapor barrier
Location 4 (L4) Attic - Vented
Location 7 (L7) Exterior
The exterior temperature probe ceased recording accurate temperature measurements in March, 2003 and data have been omitted after this date. Wall locations 1, 2, and 3 experience similar temperature variations while the attic experiences higher temperatures during peak temperature periods. Wall location 1 with plywood sheathing and insulation experiences temperatures higher than the other interior locations but does not see temperatures as high as the attic space.
Figure 3.9 and Figure 3.10 show temperature and relative humidity records for September 2003, while Figure 3.11 and Figure 3.12 show data for January 2004. Wall

Corrosion of Galvanized Fasteners University of Hawaii Final Report Steel Framing Alliance
41
locations vary between 75 and 95 degrees in September, 2003 while the attic experiences temperatures from 75 to 115 degrees. In January, 2004 the wall 1 temperature varies from 65 to 93 degrees while the other interior wall spaces reach a maximum of 85 degrees and the attic experiences temperatures of 65 to 105 degrees. The first three days of January show a low temperature reading of 68 to 78 degrees, with little variation between probe locations. This was a particularly rainy, overcast period as discussed later.
Interior wall spaces experience smaller fluctuations than the attic probe location. There is not a distinct difference in humidity levels between walls with vapor barrier and without at the coastal enclosure. The attic experiences the most dramatic relative humidity fluctuation, where low humidity corresponds to high temperatures. The interior walls experience relative humidity ranging from 40 to 85% in September, 2003 while the attic experiences humidity from 30 to 85%. Low humidity levels correspond to high temperatures for the attic location. In January, 2004 the wall locations experience 45 to 90% humidity and the attic experiences 25 to 90% humidity. The first three days of January show a high humidity reading of 80 to 95%, with little variation between probe locations. As previously mentioned, this was a particularly rainy, overcast period.
September 2003 Temperature
60
65
70
75
80
85
90
95
100
105
110
115
120
1-S
ep
2-S
ep
3-S
ep
4-S
ep
5-S
ep
6-S
ep
7-S
ep
8-S
ep
9-S
ep
10-S
ep
11-S
ep
12-S
ep
13-S
ep
14-S
ep
15-S
ep
16-S
ep
17-S
ep
18-S
ep
19-S
ep
20-S
ep
21-S
ep
22-S
ep
23-S
ep
24-S
ep
25-S
ep
26-S
ep
27-S
ep
28-S
ep
29-S
ep
30-S
ep
Tem
p (
F)
1-Wall2-Wall3-Wall4-Attic7-Exterior
Figure 3.9: Marine Corps Base Coastal September 2003 Temperature

Corrosion of Galvanized Fasteners University of Hawaii Final Report Steel Framing Alliance
42
September 2003 Humidity
0
10
20
30
40
50
60
70
80
90
1001-S
ep
2-S
ep
3-S
ep
4-S
ep
5-S
ep
6-S
ep
7-S
ep
8-S
ep
9-S
ep
10-S
ep
11-S
ep
12-S
ep
13-S
ep
14-S
ep
15-S
ep
16-S
ep
17-S
ep
18-S
ep
19-S
ep
20-S
ep
21-S
ep
22-S
ep
23-S
ep
24-S
ep
25-S
ep
26-S
ep
27-S
ep
28-S
ep
29-S
ep
30-S
ep
Hum
idity (
%)
1-Wall2-Wall3-Wall4-Attic7-Exterior
Figure 3.10: Marine Corps Base Coastal September 2003 Humidity
January 2004 Temperature
60
65
70
75
80
85
90
95
100
105
110
115
120
1-J
an
2-J
an
3-J
an
4-J
an
5-J
an
6-J
an
7-J
an
8-J
an
9-J
an
10-J
an
11-J
an
12-J
an
13-J
an
14-J
an
15-J
an
16-J
an
17-J
an
18-J
an
19-J
an
20-J
an
21-J
an
22-J
an
23-J
an
24-J
an
25-J
an
26-J
an
27-J
an
28-J
an
29-J
an
30-J
an
31-J
an
Tem
p (
F)
1-Wall2-Wall3-Wall4-Attic7-Exterior
Figure 3.11: Marine Corps Base Coastal January 2004 Temperature

Corrosion of Galvanized Fasteners University of Hawaii Final Report Steel Framing Alliance
43
January 2004 Humidity
0
10
20
30
40
50
60
70
80
90
1001-J
an
2-J
an
3-J
an
4-J
an
5-J
an
6-J
an
7-J
an
8-J
an
9-J
an
10-J
an
11-J
an
12-J
an
13-J
an
14-J
an
15-J
an
16-J
an
17-J
an
18-J
an
19-J
an
20-J
an
21-J
an
22-J
an
23-J
an
24-J
an
25-J
an
26-J
an
27-J
an
28-J
an
29-J
an
30-J
an
31-J
an
Hum
idity (
%)
1-Wall2-Wall3-Wall4-Attic7-Exterior
Figure 3.12: Marine Corps Base Coastal January 2004 Humidity
3.3 RAINFALL
Rainfall data have been collected continuously since the installation of the meteorological data equipment. Rainfall is measured using a tipping bucket rain gage and averaged over every 15 minute period.
3.3.1 Wheeler AAF Site
Figure 3.13 shows data for January, 2004, a typical winter month. The January total was approximately 10.25 inches with a peak 15 minute period of 0.62 inches. Figure 3.14 shows the daily total for January. The maximum daily total occurred on January 2 for a total of 4.48 inches. The first three days of January were especially wet, accumulating a total of 6.61 inches. These first few days of January correspond to low temperatures, and high humidity readings experienced at all five monitoring locations.

Corrosion of Galvanized Fasteners University of Hawaii Final Report Steel Framing Alliance
44
January 2004 Rainfall
0
0.1
0.2
0.3
0.4
0.5
0.6
0.7
0.81-J
an
2-J
an
3-J
an
4-J
an
5-J
an
6-J
an
7-J
an
8-J
an
9-J
an
10-J
an
11-J
an
12-J
an
13-J
an
14-J
an
15-J
an
16-J
an
17-J
an
18-J
an
19-J
an
20-J
an
21-J
an
22-J
an
23-J
an
24-J
an
25-J
an
26-J
an
27-J
an
28-J
an
29-J
an
30-J
an
31-J
an
Rain
fall
(in)
Figure 3.13: Wheeler AAF January 2004 Rainfall Log
January 2004 Daily Rainfall Totals
0.0
0.5
1.0
1.5
2.0
2.5
3.0
3.5
4.0
4.5
1-J
an
2-J
an
3-J
an
4-J
an
5-J
an
6-J
an
7-J
an
8-J
an
9-J
an
10
-Jan
11
-Jan
12
-Jan
13
-Jan
14
-Jan
15
-Jan
16
-Jan
17
-Jan
18
-Jan
19
-Jan
20
-Jan
21
-Jan
22
-Jan
23
-Jan
24
-Jan
25
-Jan
26
-Jan
27
-Jan
28
-Jan
29
-Jan
30
-Jan
31
-Jan
Rain
fall
(in)
Figure 3.14: Wheeler AAF January 2004 Daily Rainfall

Corrosion of Galvanized Fasteners University of Hawaii Final Report Steel Framing Alliance
45
3.3.2 Iroquois Point Coastal Site
Figure 3.15 shows the daily total rainfall for January 2004. The maximum daily total occurred on January 2 for a total of 3.62 inches. The first three days of January were especially wet, accumulating a total of 4.87 inches. These first few days of January correspond to low temperatures and high humidity readings at all monitoring locations.
January 2004 Daily Rainfall Totals
0.0
0.5
1.0
1.5
2.0
2.5
3.0
3.5
4.0
1-J
an
2-J
an
3-J
an
4-J
an
5-J
an
6-J
an
7-J
an
8-J
an
9-J
an
10
-Jan
11
-Jan
12
-Jan
13
-Jan
14
-Jan
15
-Jan
16
-Jan
17
-Jan
18
-Jan
19
-Jan
20
-Jan
21
-Jan
22
-Jan
23
-Jan
24
-Jan
25
-Jan
26
-Jan
27
-Jan
28
-Jan
29
-Jan
30
-Jan
31
-Jan
Rain
fall
(in)
Figure 3.15: Iroquois Point Coastal January 2004 Daily Rainfall
3.3.3 Marine Corps Base Coastal
Measurement of rainfall data at the Marine Corps Base Coastal site began on March 3, 2002. Rainfall totals over 15 minute periods are shown in Figure 3.16 from January through December, 2003. Monthly rainfall totals for 2003 are shown in Figure 3.17. Winter months accumulate more rainfall than summer months.
Figure 3.18 shows data for January, 2004, a typical winter month. The total rainfall for January was 5.94 inches with a peak 15 minute period of 0.19 inches. Figure 3.19 shows the daily totals for January. The maximum daily total occurred on January 2 for a total of 3.60 inches. The first three days of January were especially wet, accumulating a total of 5.15 inches. These first few days of January correspond to low temperatures and high humidity readings at all five monitoring locations.
The Marine Corps Base Coastal site experienced trends similar to Wheeler AAF and Iroquois Point rainfall periods. Marine Corps Base coastal recorded higher totals and peak rainfall periods for summer months such as August, September and October while
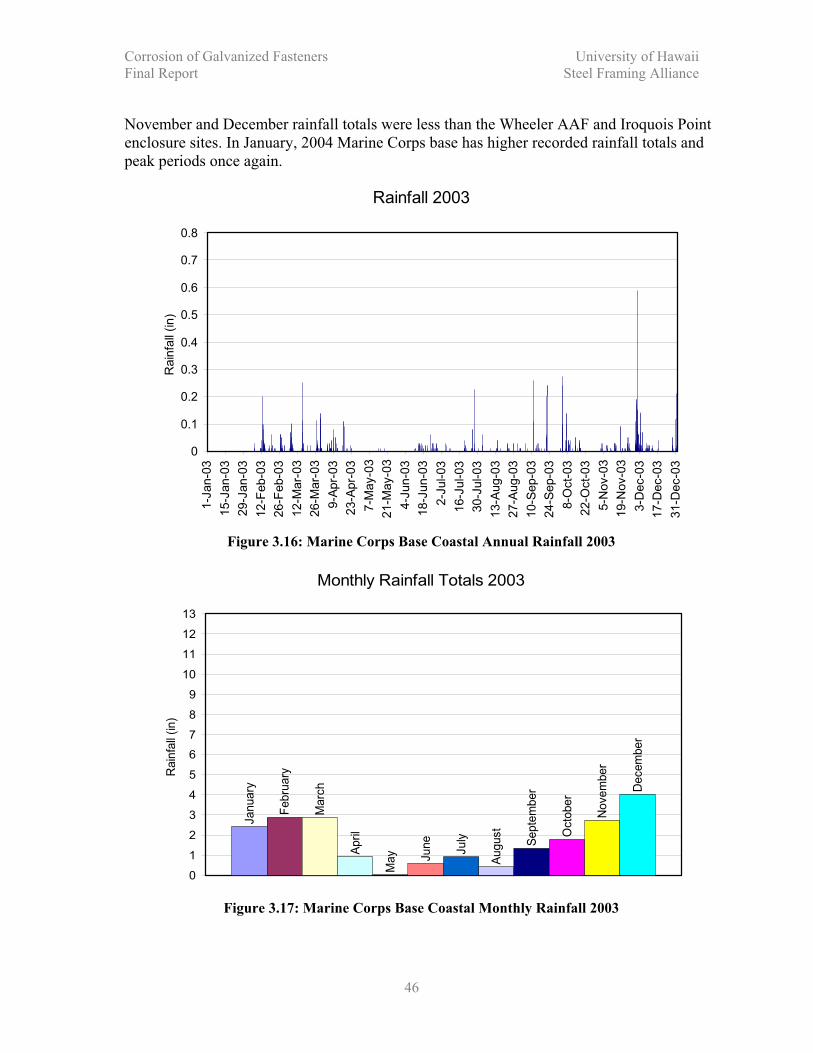
Corrosion of Galvanized Fasteners University of Hawaii Final Report Steel Framing Alliance
46
November and December rainfall totals were less than the Wheeler AAF and Iroquois Point enclosure sites. In January, 2004 Marine Corps base has higher recorded rainfall totals and peak periods once again.
Rainfall 2003
0
0.1
0.2
0.3
0.4
0.5
0.6
0.7
0.8
1-J
an-0
3
15-J
an-0
3
29-J
an-0
3
12-F
eb-0
3
26-F
eb-0
3
12-M
ar-
03
26-M
ar-
03
9-A
pr-
03
23-A
pr-
03
7-M
ay-0
3
21-M
ay-0
3
4-J
un-0
3
18-J
un-0
3
2-J
ul-03
16-J
ul-03
30-J
ul-03
13-A
ug-0
3
27-A
ug-0
3
10-S
ep-0
3
24-S
ep-0
3
8-O
ct-
03
22-O
ct-
03
5-N
ov-0
3
19-N
ov-0
3
3-D
ec-0
3
17-D
ec-0
3
31-D
ec-0
3
Rain
fall
(in)
Figure 3.16: Marine Corps Base Coastal Annual Rainfall 2003
Monthly Rainfall Totals 2003
January
Febru
ary
Marc
h
April
May June
July
August
Septe
mber
Octo
ber
Novem
ber
Decem
ber
0
1
2
3
4
5
6
7
8
9
10
11
12
13
Rain
fall
(in)
Figure 3.17: Marine Corps Base Coastal Monthly Rainfall 2003

Corrosion of Galvanized Fasteners University of Hawaii Final Report Steel Framing Alliance
47
January 2004 Rainfall
0
0.1
0.2
0.3
0.4
0.5
0.6
0.7
0.81-J
an
2-J
an
3-J
an
4-J
an
5-J
an
6-J
an
7-J
an
8-J
an
9-J
an
10-J
an
11-J
an
12-J
an
13-J
an
14-J
an
15-J
an
16-J
an
17-J
an
18-J
an
19-J
an
20-J
an
21-J
an
22-J
an
23-J
an
24-J
an
25-J
an
26-J
an
27-J
an
28-J
an
29-J
an
30-J
an
31-J
an
Rain
fall
(in)
Figure 3.18: Marine Corps Base Coastal January 2004 Rainfall Log
January 2004 Daily Rainfall Totals
0.0
0.5
1.0
1.5
2.0
2.5
3.0
3.5
4.0
1-J
an
2-J
an
3-J
an
4-J
an
5-J
an
6-J
an
7-J
an
8-J
an
9-J
an
10
-Ja
n
11
-Ja
n
12
-Ja
n
13
-Ja
n
14
-Ja
n
15
-Ja
n
16
-Ja
n
17
-Ja
n
18
-Ja
n
19
-Ja
n
20
-Ja
n
21
-Ja
n
22
-Ja
n
23
-Ja
n
24
-Ja
n
25
-Ja
n
26
-Ja
n
27
-Ja
n
28
-Ja
n
29
-Ja
n
30
-Ja
n
31
-Ja
n
Rain
fall
(in)
Figure 3.19: Marine Corps Base Coastal January 2004 Daily Rainfall

Corrosion of Galvanized Fasteners University of Hawaii Final Report Steel Framing Alliance
48
3.4 SOLAR RADIATION
Solar Radiation data have been continuously collected since the installation of the meteorological data equipment. Solar radiation is recorded in watts per square meter using a LI200S Pyranometer.
3.4.1 Wheeler AAF Site
Measurement of solar radiation data at the Wheeler AAF site began on July 16, 2003. On most days solar radiation levels peak at midday and return to zero during evening hours. Cloudy days see much lower levels of solar radiation. Summer months have higher solar radiation levels during peak periods compared to winter months.
Figure 3.20 shows data for January, 2004, a typical winter month. The maximum solar radiation level in January was 545.4 watts per square meter. The first few days of January show much lower solar radiation peaks that correspond with high rainfall totals, a low temperature range of 65 to 75 degrees, and high humidity readings of 80 to 95% for these days.
January 2004 Solar Radiation
0
100
200
300
400
500
600
700
800
1-J
an
2-J
an
3-J
an
4-J
an
5-J
an
6-J
an
7-J
an
8-J
an
9-J
an
10-J
an
11-J
an
12-J
an
13-J
an
14-J
an
15-J
an
16-J
an
17-J
an
18-J
an
19-J
an
20-J
an
21-J
an
22-J
an
23-J
an
24-J
an
25-J
an
26-J
an
27-J
an
28-J
an
29-J
an
30-J
an
31-J
an
Sola
r R
adia
tion (
W/m
2)
Figure 3.20: Wheeler AAF January 2004 Solar Radiation
3.4.2 Iroquois Point Coastal Site
Measurement of solar radiation data at the Iroquois Point Coastal site began on August 2, 2003. Figure 3.21 shows data for January 2004, a typical winter month. The maximum solar radiation level in January was 455.8 watts per square meter. The first few days of January show much lower solar radiation peaks that correspond with high rainfall totals, a low temperature range of 65 to 75 degrees, and high humidity readings of 80 to 95%

Corrosion of Galvanized Fasteners University of Hawaii Final Report Steel Framing Alliance
49
for these days. January 23 also shows lower levels of solar radiation that also correspond to rainfall. The Iroquois Point Coastal site shows slightly lower maximum solar radiation levels than the Wheeler AAF site but follows similar trends.
January 2004 Solar Radiation
0
100
200
300
400
500
600
700
800
1-J
an
2-J
an
3-J
an
4-J
an
5-J
an
6-J
an
7-J
an
8-J
an
9-J
an
10-J
an
11-J
an
12-J
an
13-J
an
14-J
an
15-J
an
16-J
an
17-J
an
18-J
an
19-J
an
20-J
an
21-J
an
22-J
an
23-J
an
24-J
an
25-J
an
26-J
an
27-J
an
28-J
an
29-J
an
30-J
an
31-J
an
Sola
r R
adia
tion (
W/m
2)
Figure 3.21: Iroquois Point Coastal January 2004 Solar Radiation
3.4.3 Marine Corps Base Coastal Site
Measurement of solar radiation data at the Marine Corps Base Coastal site began on March 3, 2002. Figure 3.22 shows data for January 2004, a typical winter month. The maximum solar radiation level in January was 535.5 watts per square meter. The first few days of January show much lower solar radiation peaks that correspond with high rainfall totals, a low temperature range of 65 to 75 degrees, and high humidity readings of 80 to 95% for these days. January 23 also shows lower levels of solar radiation that also correspond to rainfall.
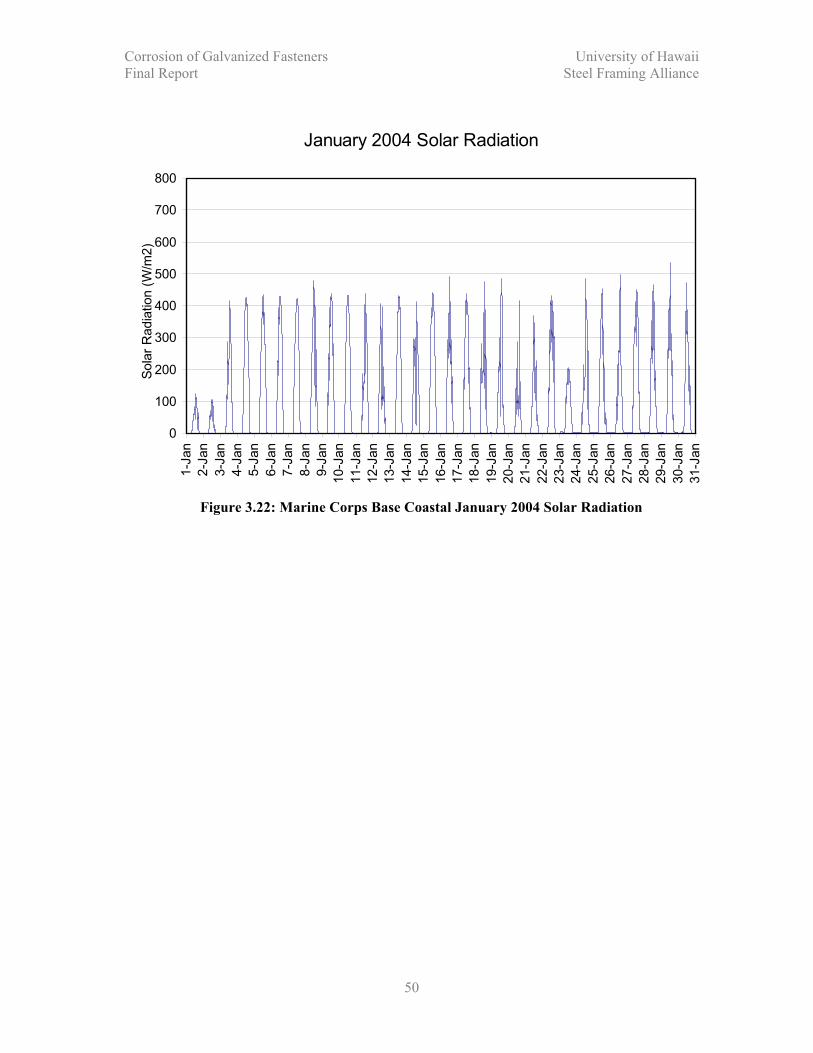
Corrosion of Galvanized Fasteners University of Hawaii Final Report Steel Framing Alliance
50
January 2004 Solar Radiation
0
100
200
300
400
500
600
700
8001-J
an
2-J
an
3-J
an
4-J
an
5-J
an
6-J
an
7-J
an
8-J
an
9-J
an
10-J
an
11-J
an
12-J
an
13-J
an
14-J
an
15-J
an
16-J
an
17-J
an
18-J
an
19-J
an
20-J
an
21-J
an
22-J
an
23-J
an
24-J
an
25-J
an
26-J
an
27-J
an
28-J
an
29-J
an
30-J
an
31-J
an
Sola
r R
adia
tion (
W/m
2)
Figure 3.22: Marine Corps Base Coastal January 2004 Solar Radiation

Corrosion of Galvanized Fasteners University of Hawaii Final Report Steel Framing Alliance
51
3.5 WIND SPEED AND DIRECTION
Wind data have been continuously collected since the installation of the meteorological data equipment. Wind speed is monitored by a wind sentry that records wind speed in miles per hour and wind direction. Wind speed and direction are monitored every second and averaged over each 15 minute interval. These 15-minute averages are recorded and reported here.
3.5.1 Wheeler AAF Site
Measurement of wind speed and direction data at the Wheeler AAF site began on July 16, 2003. Wind speeds at the Wheeler enclosure were in the 0 to 10 mph range in 2003. Speeds of 20-25 mph were recorded on several days in January and February 2004. On most days the wind speed decreases during the evening and increases around midday.
Figure 3.23 shows data for January 2004, a typical winter month. Most of the wind speed readings were within the 0 to 10 mph range with the exception of the maximum 15-minute wind speed that occurred on January 14 at 26.3 mph and wind speeds over 20 mph on January 23.
January 2004 Wind Speed
0
5
10
15
20
25
30
35
1-J
an
2-J
an
3-J
an
4-J
an
5-J
an
6-J
an
7-J
an
8-J
an
9-J
an
10-J
an
11-J
an
12-J
an
13-J
an
14-J
an
15-J
an
16-J
an
17-J
an
18-J
an
19-J
an
20-J
an
21-J
an
22-J
an
23-J
an
24-J
an
25-J
an
26-J
an
27-J
an
28-J
an
29-J
an
30-J
an
31-J
an
Win
d S
peed (
mph)
Figure 3.23: Wheeler AAF Monthly January Wind Speed 2004
Wind direction was recorded by the wind sentry every second and then averaged over a 15 minute period, as previously noted. The recorded 15-minute average is reported as a compass degree readout. The wind direction data are displayed using weekly frequency rosettes such as Figure 3.24. The plotted values represent the frequency with which the wind was recorded from a particular 10-degree arc during the week. For example, Figure

Corrosion of Galvanized Fasteners University of Hawaii Final Report Steel Framing Alliance
52
3.24 shows a week with variable wind orientation. The largest frequency of 0.08 represents wind from the 325 to 335 degree arc for 8% of the time during that week. The highest wind speeds in January 2004 were recorded on the 14th-15th and 23rd. January 14 had predominantly SW winds while January 15 had mostly NW winds. On January 23 the winds were NW.
Week 1-12-04 to 1-18-04
Frequency Rosette
0
0.1
0.2
0.3
0.4
0.5
010
2030
40
50
60
70
80
90
100
110
120
130
140150
160170
180190
200210
220
230
240
250
260
270
280
290
300
310
320330
340350
W
S
E
N
Figure 3.24: Wheeler AAF Wind Direction for January 12-18, 2004
3.5.2 Iroquois Point Coastal Site
Measurement of wind speed and direction data at the Iroquois Point Coastal site began on August 2, 2003. Wind speeds at the Iroquois Point Coastal enclosure are in the 0 to 13 mph range. Figure 3.25 shows data for January 2004, a typical winter month. Most of the data falls within the 0-7 mph range with the exception of January 14, 23, and the 29-31. The maximum recorded 15-minute average wind speed occurred on January 29 at 12.6 mph. The peaks on 14th and the 23rd correspond to peaks on the same days as Wheeler AAF though the recorded wind speeds are significantly lower at the Iroquois site.

Corrosion of Galvanized Fasteners University of Hawaii Final Report Steel Framing Alliance
53
January 2004 Wind Speed
0
5
10
15
20
25
30
35
1-J
an
2-J
an
3-J
an
4-J
an
5-J
an
6-J
an
7-J
an
8-J
an
9-J
an
10-J
an
11-J
an
12-J
an
13-J
an
14-J
an
15-J
an
16-J
an
17-J
an
18-J
an
19-J
an
20-J
an
21-J
an
22-J
an
23-J
an
24-J
an
25-J
an
26-J
an
27-J
an
28-J
an
29-J
an
30-J
an
31-J
an
Win
d S
peed (
mph)
Figure 3.25: Iroquois Point Coastal January 2004 Wind Speed
Figure 3.26 shows the wind direction rosette for the last week of January, 2004. The winds are predominantly from the SE during this week. The highest wind speeds in January, 2004 were recorded on 14th, 23rd and 29th-31st. January, 14 had predominantly NW winds while on 23rd the winds were variable. Winds were SE on the 29th-31st.
Week 1-26-04 to 2-1-04
Frequency Rosette
0
0.1
0.2
0.3
0.4
0.5
010
2030
40
50
60
70
80
90
100
110
120
130
140150
160170
180190
200210
220
230
240
250
260
270
280
290
300
310
320330
340350
W
S
E
N
Figure 3.26: Iroquois Point Coastal Wind Direction for January 26 – February 1, 2004

Corrosion of Galvanized Fasteners University of Hawaii Final Report Steel Framing Alliance
54
3.5.3 Iroquois Point Inland
Measurement of wind speed and direction data at the Iroquois Point inland site began on August 2, 2003. Figure 3.27 shows data for January 2004, a typical winter month. The peaks on January 14 and the 23 correspond to peaks on the same days as the Iroquois Point coastal and Wheeler AAF sites. The inland site consistently experiences wind speeds 3-5 mph higher than the coastal site.
January 2004 Wind Speed
0
5
10
15
20
25
30
35
1-J
an
2-J
an
3-J
an
4-J
an
5-J
an
6-J
an
7-J
an
8-J
an
9-J
an
10-J
an
11-J
an
12-J
an
13-J
an
14-J
an
15-J
an
16-J
an
17-J
an
18-J
an
19-J
an
20-J
an
21-J
an
22-J
an
23-J
an
24-J
an
25-J
an
26-J
an
27-J
an
28-J
an
29-J
an
30-J
an
31-J
an
Win
d S
peed (
mph)
Figure 3.27: Iroquois Point Inland January 2004 Wind Speed
Figure 3.28 shows the wind direction rosette for the last week of January, 2004. The predominant wind direction is from the ESE, slightly different from the SE direction for the coastal site. The differences in wind speed and direction at the Iroquois sites is attributed to the effects of vegetation shielding.

Corrosion of Galvanized Fasteners University of Hawaii Final Report Steel Framing Alliance
55
Week 1-26-04 to 2-1-04
Frequency Rosette
0
0.1
0.2
0.3
0.4
0.5
010
2030
40
50
60
70
80
90
100
110
120
130
140150
160170
180190
200210
220
230
240
250
260
270
280
290
300
310
320330
340350
W
S
E
N
Figure 3.28: Iroquois Point Inland Wind Direction for January 26-February 1, 2004
3.5.4 Marine Corps Base Coastal Site
Measurement of wind speed and direction data at the Marine Corps Base Coastal site began on March 3, 2003. Wind speeds averaged over 15 minute periods at the Marine Corps Base Coastal enclosure are in the 0 to 25 mph range with speeds up to 31 mph. These speeds were significantly greater than at any of the other sites, including the nearby Marine Corps Base Inland enclosure. This confirms the open exposure to predominant trade winds for this MCBH Coastal location.
Figure 3.29 shows data for January 2004, a typical winter month. Most of the data falls within the 0 to 15 mph range with the exception of January 12 when winds reached 22 mph and the 14th and 26th when winds reached nearly 33 mph. The peaks on January 14 and the 23 correspond to peaks on the same days as the Iroquois Point coastal and Wheeler AAF sites, but with significantly higher speeds.

Corrosion of Galvanized Fasteners University of Hawaii Final Report Steel Framing Alliance
56
January 2004 Wind Speed
0
5
10
15
20
25
30
35
1-J
an
2-J
an
3-J
an
4-J
an
5-J
an
6-J
an
7-J
an
8-J
an
9-J
an
10-J
an
11-J
an
12-J
an
13-J
an
14-J
an
15-J
an
16-J
an
17-J
an
18-J
an
19-J
an
20-J
an
21-J
an
22-J
an
23-J
an
24-J
an
25-J
an
26-J
an
27-J
an
28-J
an
29-J
an
30-J
an
31-J
an
Win
d S
peed (
mph)
Figure 3.29: Marine Corps Base Coastal January 2004 Wind Speed
Figure 3.30 shows that during the last week of January 2004, ENE winds prevailed for 96% of the time. This was also a period of sustained high wind speeds and corresponds to the prevailing trade winds at this location.
Week 1-26-04 to 2-1-04
Frequency Rosette
0
0.1
0.2
0.3
0.4
0.5
010
2030
40
50
60
70
80
90
100
110
120
130
140150
160170
180190
200210
220
230
240
250
260
270
280
290
300
310
320330
340350
W
S
E
N
Figure 3.30: Marine Corps Base Coastal Wind Direction for January 26-February 1, 2004

Corrosion of Galvanized Fasteners University of Hawaii Final Report Steel Framing Alliance
57
3.5.5 Marine Corps Base Inland Site
Measurement of wind speed and direction data at the Marine Corps Base inland site began on February 28, 2003. Figure 3.31 shows data for January 2004, a typical winter month. Most of the data falls within the 0 to 15 mph range with the exception of January 14 when winds reached the peak 15-minute wind speed for the month at 32 mph. The peak on the 14 corresponds to a peak on the same day at the Iroquois Point coastal and inland sites and Wheeler AAF site. Marine Corps Base inland did not experience the same high wind speed trend during the last few days of January as was observed at the coastal site and the Iroquois Point sites. The Marine Corps Base Inland site generally experiences 15-minute wind speeds somewhat lower than the coastal site.
January 2004 Wind Speed
0
5
10
15
20
25
30
35
1-J
an
2-J
an
3-J
an
4-J
an
5-J
an
6-J
an
7-J
an
8-J
an
9-J
an
10-J
an
11-J
an
12-J
an
13-J
an
14-J
an
15-J
an
16-J
an
17-J
an
18-J
an
19-J
an
20-J
an
21-J
an
22-J
an
23-J
an
24-J
an
25-J
an
26-J
an
27-J
an
28-J
an
29-J
an
30-J
an
31-J
an
Win
d S
peed (
mph)
Figure 3.31: Marine Corps Base Inland January 2003 Wind Speed
Figure 3.32 shows the wind direction rosette for the last week of January 2004 showing variable wind direction with highest frequencies from the N and NE. This is in contrast to the coastal site that had predominantly ENE winds during this week. The wind speeds during this period are also significantly lower than those measured at the coastal site, confirming the effect of the slight hill and vegetation providing shielding for the inland site from the coastal conditions.

Corrosion of Galvanized Fasteners University of Hawaii Final Report Steel Framing Alliance
58
Week 1-26-04 to 2-1-04
Frequency Rosette
0
0.1
0.2
0.3
0.4
0.5
010
2030
40
50
60
70
80
90
100
110
120
130
140150
160170
180190
200210
220
230
240
250
260
270
280
290
300
310
320330
340350
W
S
E
N
Figure 3.32: Marine Corps Base Inland Wind Direction for January 26-February 1, 2004

Corrosion of Galvanized Fasteners University of Hawaii Final Report Steel Framing Alliance
59
3.6 CHLORIDE DEPOSITION RATE
Chloride candles have been used at each of the field enclosures to determine chloride deposition rates over a 6 month period. Each candle was exposed for an average duration of two weeks. When a sample was recovered from the field, purified water was added to the field sample to produce 400 mL of solution. A 100mL sample of the diluted solution was then analyzed for its molar chloride concentration based on the known level of purified water in the flask. These tests were performed using an ion-selective electrode in the Corrosion Laboratory of the Mechanical Engineering Department at the University of Hawaii. Based on the exposed area of the candle wick, the measured chloride concentration is converted to a chloride deposition rate in mg/m2/day. This represents the average deposition rate during the candle exposure period.
3.6.1 Wheeler AAF Site
Chloride deposition rates for the Wheeler AAF site are shown in Figure 3.33. Chloride deposition rates vary from 80-580 mg/m2/day range. The highest rate was recorded during the December 5-11, 2003 period at 581 mg/m2/day. The lowest rate was 80 mg/m2/day, during the January 5 to February 3, 2004 period.
0
500
1000
1500
2000
2500
3000
Chlo
ride D
epositio
n (
mg/m
2/d
ay)
8/18
/200
3 - 8
/26/
2003
9/4/
2003
- 9/
23/2
003
9/23
/200
3- 9
/30/
2003
10/8
/200
3- 1
0/17
/200
3
10/1
7/20
03 -
10/3
1/20
03
10/3
1/20
03 -
11/1
4/20
03
11/1
4/20
03 -
12/0
5/20
03
12/5
/200
3- 12
/11/
2003
12/1
1/20
03 -
1/05
/200
4
1/5/
2004
- 2/
03/2
004
2/28
/200
4 -
3/22
/200
4
Chloride Deposition Rate
Figure 3.33: Wheeler AAF Chloride Deposition Rates
3.6.2 Iroquois Point Coastal Site
Chloride deposition rates for the Iroquois Point coastal site are shown in Figure 3.34. The highest rate was recorded during the December 5-11, 2003 period at 516 mg/m2/day.

Corrosion of Galvanized Fasteners University of Hawaii Final Report Steel Framing Alliance
60
Wheeler AAF experienced the same peak period as the Iroquois Point coastal site. The lowest rate was 167 mg/m2/day during the February 3-28, 2004 period.
0
500
1000
1500
2000
2500
3000
Chlo
ride D
epositio
n (
mg/m
2/d
ay)
8/13
/200
3 -
8/21
/200
3
8/21
/200
3 -
8/29
/200
3
8/29
/200
3 - 9
/04/
2003
9/30
/200
3- 10
/08/
2003
10/8
/200
3- 1
0/17
/200
3
10/1
7/20
03- 1
0/31
/200
3
10/3
1/20
03- 1
1/14
/200
3
11/1
4/20
03 -
12/0
5/20
03
12/5
/200
3 - 1
2/11
/200
3
12/1
1/20
03 -
1/05
/200
4
1/5/
2004
- 1
/19/
2004
1/19
/200
4 - 2
/03/
2004
2/3/
2004
- 2/
28/2
004
Chloride Deposition Rate
Figure 3.34: Iroquois Point Coastal Chloride Deposition Rates
3.6.3 Iroquois Point Inland Site
Chloride deposition rates for the Iroquois Point inland site are shown in Figure 3.35. The highest rate was recorded during the December 5-11 period at 669 mg/m2/day. Iroquois Point inland experienced the same peak period as the Iroquois Point coastal and the Wheeler AAF site. The lowest rate was 105 mg/m2/day, during the November 14 to December 5, 2004 period.

Corrosion of Galvanized Fasteners University of Hawaii Final Report Steel Framing Alliance
61
0
500
1000
1500
2000
2500
3000
Chlo
ride D
epositio
n (
mg/m
2/d
ay)
8/21
/200
3 -
8/29
/200
3
8/29
/200
3 - 9
/04/
2003
9/30
/200
3- 1
0/08
/200
3
10/8
/200
3- 10
/17/
2003
10/1
7/20
03 -
10/3
1/20
03
10/3
1/20
03- 1
1/14
/200
3
11/1
4/20
03- 1
2/05
/200
3
12/5
/200
3 - 1
2/11
/200
3
12/1
1/20
03 -
1/05
/200
4
1/5/
2004
- 1
/19/
2004
1/19
/200
4 - 2
/03/
2004
2/3/
2004
- 2/
28/2
004
2/28
/200
4- 3
/18/
2004
Chloride Deposition Rate
Figure 3.35: Iroquois Point Inland Chloride Deposition Rates
0
500
1000
1500
2000
2500
3000
Chlo
ride D
epositio
n (
mg/m
2/d
ay)
8/12
/200
3 -
8/21
/200
3
8/21
/200
3- 8
/26/
2003
8/26
/200
3- 9
/04/
2003
9/23
/200
3- 9
/30/
2003
9/30
/200
3 - 10
/10/
2003
11/1
1/20
03- 1
1/26
/200
3
11/2
6/20
03 -1
2/18
/200
3
12/1
8/20
03 -
1/13
/200
4
2/3/
2004
- 3/1
1/20
04
Chloride Deposition Rate
Figure 3.36: Marine Corps Base Coastal Chloride Deposition Rates

Corrosion of Galvanized Fasteners University of Hawaii Final Report Steel Framing Alliance
62
3.6.4 Marine Corps Base Coastal Site
Chloride deposition rates for the Marine Corps Base coastal site are shown in Figure 3.36. Chloride deposition rates for Marine Corps Base coastal fall within the 216-2883 mg/m2/day range, a significant increase over deposition rates for Wheeler AAF and Iroquois Point sites. The highest rate was seen during the November 26 to December 18 period at 2883 mg/m2/day. The lowest rate was 216 mg/m2/day, during the December 18, 2003 to January 13, 2004 period.
3.6.5 Marine Corps Base Inland Site
Chloride deposition rates for the Marine Corps Base inland site are shown in Figure 3.37. Chloride deposition rates for Marine Corps Base Inland fall within the 165-768 mg/m2/day range, a significant decrease from deposition rates for the coastal site. The highest rate was seen during the November 26 to December 18 period at 768 mg/m2/day,less than one third the rate seen at the coastal site for the same period.
0
500
1000
1500
2000
2500
3000
Chlo
ride D
epositio
n (
mg/m
2/d
ay)
8/12
/200
3 -
8/21
/200
3
8/21
/200
3 - 8
/26/
2003
8/26
/200
3- 9
/04/
2003
9/23
/200
3 - 9
/30/
2003
9/30
/200
3- 1
0/10
/200
3
10/3
1/20
03 -
11/1
1/20
03
11/2
6/20
03-1
2/18
/200
3
12/1
8/20
03- 1
/13/
2004
1/13
/200
4 - 2
/03/
2004
2/3/
2004
- 3/
11/2
004
Chloride Deposition Rate
Figure 3.37: Marine Corps Base Inland Chloride Deposition Rates
3.7 ANALYSIS OF CHLORIDE DATA
Figure 3.38 shows a comparison of the chloride deposition data collected from each of the five field sites. The chloride deposition rates at the same site may vary widely, depending on various weather conditions. The average chloride deposition rate at each enclosure is shown in Figure 3.39. The Marine Corps Base coastal site experienced deposition rates of more than four times the deposition rates of the other four sites, where the average deposition rates are relatively similar.

Corrosion of Galvanized Fasteners University of Hawaii Final Report Steel Framing Alliance
63
Wheeler AAF
Iriquois InlandIriquois Coastal
MCBH InlandMCBH Coastal0
500
1000
1500
2000
2500
3000
Ch
lori
de D
ep
osit
ion
Rate
(mg
/m2/d
ay)
Chloride Deposition Rates
Figure 3.38: Chloride Deposition Rates
0
200
400
600
800
1000
1200
1400
1600
Ch
lori
de
Dep
osit
ion
Ra
te
(mg
/m2/d
ay)
MCBH Coastal MCBH Inland Iroquois Coastal Iroquois Inland Wheeler
Location
Average Chloride Deposition Rates
Figure 3.39: Average Chloride Deposition Rates

Corrosion of Galvanized Fasteners University of Hawaii Final Report Steel Framing Alliance
64
Wheeler AAF and Iroquois Point sites experienced similar trends over the same periods of observation as shown in Figure 3.40. The Iroquois Point Inland site experienced slightly higher chloride deposition rates than Wheeler AAF and the Iroquois coastal site in all but one monitoring period. All three sites experience peak rates during the same period from December 5-11, 2003. Similarly, all three sites experienced relative low deposition rates in the preceding period from November 14 to December 5.
Chloride Deposition Rates
0
500
1000
1500
2000
2500
3000
8/21
/200
3- 8/
29/2
003
8/29
/200
3- 9/
04/2
003
9/30
/200
3- 10
/08/
2003
10/8
/200
3- 10
/17/
2003
10/1
7/20
03- 10
/31/
2003
10/3
1/20
03- 11
/14/
2003
11/1
4/20
03- 12
/05/
2003
12/5
/200
3- 12
/11/
2003
12/1
1/20
03- 1/
05/2
004
1/5/
2004
- 1/19
/200
4
1/19
/200
4- 2/
03/2
004
2/3/
2004
- 2/2
8/20
04
Chlo
ride D
epositio
n R
ate
s (
mg/m
2/d
ay) Wheeler
Iroquois - Coastal
Iroquois - Inland
Figure 3.40: Comparison of Iroquois Coastal, Iroquois Inland and Wheeler Chloride
Deposition Rates
A similar comparison for the Marine Corps Base sites is shown in Figure 3.41. Not all monitoring periods correspond for the two sites, but the following observations can still be made. The coastal site experienced much higher chloride deposition rates than the inland site except for the period from December 18, 2003 to January 13, 2004. During this period, the coastal site experienced its lowest deposition rate, while the inland site saw its highest deposition rate. During the period from November 26 to December 18, 2003 the coastal site reached its maximum recorded deposition rate while the inland site experienced a relatively low deposition rate.

Corrosion of Galvanized Fasteners University of Hawaii Final Report Steel Framing Alliance
65
Chloride Deposition Rates
0
500
1000
1500
2000
2500
3000
8/12
/200
3- 8/
21/2
003
8/21
/200
3- 8/
26/2
003
8/26
/200
3- 9/
04/2
003
9/23
/200
3- 9/
30/2
003
9/30
/200
3- 10
/10/
2003
10/3
1/20
03- 11
/11/
2003
11/2
6/20
03-1
2/18
/200
3
12/1
8/20
03- 1/
13/2
004
1/13
/200
4- 2/
03/2
004
2/3/
2004
- 3/1
1/20
04
Chlo
ride D
epositio
n R
ate
s (
mg/m
2/d
ay) MCBH - Inland
MCBH - Coastal
Figure 3.41: Comparison of Marine Corps Base Coastal vs. Inland Chloride Deposition Rates
3.7.1 Wheeler AAF
Low chloride deposition rates were experienced at Wheeler AAF site for most of the monitoring period. This site is a considerable distance from the ocean in all directions, with intervening mountain ranges to the NE and W. The slightly higher chloride deposition rates during some of the monitoring periods are attributed to S and SE winds that are less obstructed between the southern shoreline and the site. The periods of high chloride deposition matched those at the Iroquois Point sites, situated on the southern shoreline.
3.7.2 Iroquois Point Coastal and Inland Sites
High and low chloride deposition rates occur during the same monitoring periods for these two sites, though the rates at the inland site are slightly higher than the coastal site.Low chloride deposition rates were experienced at Iroquois Point sites during predominantly N and NE winds. The periods with higher deposition rates generally include a significant S or SE wind component, approaching the site as onshore winds. For example, Figure 3.42 and Figure 3.43 show the wind direction rosette and wind speed measured at the Iroquois Point inland site during a high chloride deposition period. The slightly higher rates at the inland site are attributed to the proximity to Pearl Harbor entrance and to the lack of vegetation around the inland site compared with the coastal site.

Corrosion of Galvanized Fasteners University of Hawaii Final Report Steel Framing Alliance
66
12-5-03 to 12-11-03
Frequency Rosette
0
0.1
0.2
0.3
0.4
0.5
010 20
3040
50
60
70
80
90
100
110
120
130
140150
160170180
190200210
220
230
240
250
260
270
280
290
300
310
320330
340350
W
S
E
N
Figure 3.42: Iroquois Point Inland Wind Direction During Period of High Chloride Deposition
Wind Speed December 5 to 11, 2003
0
5
10
15
20
25
30
35
6-D
ec-
03
7-D
ec-
03
8-D
ec-
03
9-D
ec-
03
10-D
ec-
03
11-D
ec-
03
12-D
ec-
03
Win
d S
peed (
mph)
Figure 3.43: Iroquois Point Inland Wind Speed During Period of High Chloride Deposition

Corrosion of Galvanized Fasteners University of Hawaii Final Report Steel Framing Alliance
67
3.7.3 Marine Corps Base Coastal Site
Low chloride deposition rates were experienced at Marine Corps Base coastal site during the period from December 18, 2003 to January 13, 2004. The wind direction frequency rosette for this period is shown in Figure 3.44. Wind direction varied from NE to SW during this period. Figure 3.45 shows the wind speed in the 0 to 15 mph range during this low chloride deposition period. The low chloride deposition rate is attributed to the high frequency of SW winds during this monitoring period.
High chloride deposition rates were experienced at Marine Corps Base coastal site during the period from November 26 to December 18, 2003. Figure 3.46 shows the wind direction frequency rosette for this period, with ENE winds prevailing 81% of the time. Figure 3.47 shows that the wind speeds during this high chloride deposition period were significantly higher than the low deposition period. Chloride deposition rates increase as the percentage of NE (onshore) winds increases, and as the wind speed increases.
12-18-03 to 1-13-04
Frequency Rosette
0
0.1
0.2
0.3
0.4
0.5
010 20
3040
50
60
70
80
90
100
110
120
130
140150
160170180
190200210
220
230
240
250
260
270
280
290
300
310
320330
340350
W
S
E
N
Figure 3.44: Marine Corps Base Coastal Wind Direction During Period of Low Chloride
Deposition

Corrosion of Galvanized Fasteners University of Hawaii Final Report Steel Framing Alliance
68
Windspeed December 18 to January 13, 2003
0
5
10
15
20
25
30
35
18-D
ec-0
3
19-D
ec-0
3
20-D
ec-0
3
21-D
ec-0
3
22-D
ec-0
3
23-D
ec-0
3
24-D
ec-0
3
25-D
ec-0
3
26-D
ec-0
3
27-D
ec-0
3
28-D
ec-0
3
29-D
ec-0
3
30-D
ec-0
3
31-D
ec-0
3
1-J
an-0
4
2-J
an-0
4
3-J
an-0
4
4-J
an-0
4
5-J
an-0
4
6-J
an-0
4
7-J
an-0
4
8-J
an-0
4
9-J
an-0
4
10-J
an-0
4
11-J
an-0
4
12-J
an-0
4
13-J
an-0
4
14-J
an-0
4
Win
dspeed (
mph)
Figure 3.45: Marine Corps Base Coastal Wind Speed During Period of Low Chloride
Deposition
11-26-03 to 12-18-03
Frequency Rosette
0
0.1
0.2
0.3
0.4
0.5
010 20
3040
50
60
70
80
90
100
110
120
130
140150
160170180
190200210
220
230
240
250
260
270
280
290
300
310
320330
340350
W
S
E
N
Figure 3.46: Marine Corps Base Coastal Wind Direction During Period of High Chloride
Deposition

Corrosion of Galvanized Fasteners University of Hawaii Final Report Steel Framing Alliance
69
Windspeed November 26 to December 18, 2003
0
5
10
15
20
25
30
35
26-N
ov-0
3
27-N
ov-0
3
28-N
ov-0
3
29-N
ov-0
3
30-N
ov-0
3
1-D
ec-0
3
2-D
ec-0
3
3-D
ec-0
3
4-D
ec-0
3
5-D
ec-0
3
6-D
ec-0
3
7-D
ec-0
3
8-D
ec-0
3
9-D
ec-0
3
10-D
ec-0
3
11-D
ec-0
3
12-D
ec-0
3
13-D
ec-0
3
14-D
ec-0
3
15-D
ec-0
3
16-D
ec-0
3
17-D
ec-0
3
18-D
ec-0
3
Win
dspeed (
mph)
Figure 3.47: Marine Corps Base Coastal Wind Speed During Period of High Chloride
Deposition
3.7.4 Marine Corps Base Inland Site
The chloride deposition rates measured at the MCBH inland site are significantly lower than the coastal site, and compare more closely with the Iroquois Point and Wheeler sites. This difference between the MCBH coastal and inland sites is attributed to the presence of a small hill and dense vegetation between the two sites. The inland site is therefore shielded from direct onshore winds, reflected by the lower wind speeds measured at this site compared with the coastal site.
Low chloride deposition rates were experienced at Marine Corps Base inland site during the period from November 26 to December 18, 2003. This is the same period that the Marine Corps Base Coastal site experienced the highest chloride deposition rate. Figure 3.48 shows the wind direction frequency rosette for this period. N winds predominate during this period, however the wind speeds are low (Figure 3.49) and the site is shielded by vegetation to the North.
High chloride deposition rates were experienced at Marine Corps Base inland site during the period from December 18, 2003 to January 13, 2004, the same period the coastal site experiences low chloride deposition rates. The wind direction frequency rosette for this period of high chloride deposition is shown in Figure 3.50. A significant portion of the wind is from the S. The wind speeds are also slightly higher than during the low deposition period (Figure 3.51). The southerly exposure for this site is an open airfield and the nearby Kaneohe Bay. The higher chloride deposition rate during this period is attributed to southerly winds passing over the bay and airfield to the site.

Corrosion of Galvanized Fasteners University of Hawaii Final Report Steel Framing Alliance
70
12-5-03 to 12-11-03
Frequency Rosette
0
0.1
0.2
0.3
0.4
0.5
010 20
3040
50
60
70
80
90
100
110
120
130
140150
160170180
190200210
220
230
240
250
260
270
280
290
300
310
320330
340350
W
S
E
N
Figure 3.48: Marine Corps Base Inland Wind Direction During Period of Low Chloride
Deposition
Windspeed November 26 to December 18, 2003
0
5
10
15
20
25
30
35
26-N
ov-0
3
27-N
ov-0
3
28-N
ov-0
3
29-N
ov-0
3
30-N
ov-0
3
1-D
ec-0
3
2-D
ec-0
3
3-D
ec-0
3
4-D
ec-0
3
5-D
ec-0
3
6-D
ec-0
3
7-D
ec-0
3
8-D
ec-0
3
9-D
ec-0
3
10-D
ec-0
3
11-D
ec-0
3
12-D
ec-0
3
13-D
ec-0
3
14-D
ec-0
3
15-D
ec-0
3
16-D
ec-0
3
17-D
ec-0
3
18-D
ec-0
3
Win
dspe
ed (
mph
)
Figure 3.49: Marine Corps Base Inland Wind Speed During Period of Low Chloride
Deposition

Corrosion of Galvanized Fasteners University of Hawaii Final Report Steel Framing Alliance
71
12-18-03 to 1-13-03
Frequency Rosette
0
0.1
0.2
0.3
0.4
0.5
010 20
3040
50
60
70
80
90
100
110
120
130
140150
160170180
190200210
220
230
240
250
260
270
280
290
300
310
320330
340 350
W
S
E
N
Figure 3.50: Marine Corps Base Inland Wind Direction During Period of High Chloride
Deposition
Windspeed December 18 to January 13, 2003
0
5
10
15
20
25
30
35
18-D
ec-0
3
19-D
ec-0
3
20-D
ec-0
3
21-D
ec-0
3
22-D
ec-0
3
23-D
ec-0
3
24-D
ec-0
3
25-D
ec-0
3
26-D
ec-0
3
27-D
ec-0
3
28-D
ec-0
3
29-D
ec-0
3
30-D
ec-0
3
31-D
ec-0
3
1-J
an-0
4
2-J
an-0
4
3-J
an-0
4
4-J
an-0
4
5-J
an-0
4
6-J
an-0
4
7-J
an-0
4
8-J
an-0
4
9-J
an-0
4
10-J
an-0
4
11-J
an-0
4
12-J
an-0
4
13-J
an-0
4
14-J
an-0
4
Win
dspeed (
mph)
Figure 3.51: Marine Corps Base Inland Wind Speed During Period of High Chloride
Deposition

Corrosion of Galvanized Fasteners University of Hawaii Final Report Steel Framing Alliance
72
3.8 CONCLUDING OBSERVATIONS
Meteorological data for the five enclosure field sites show many similarities, particularly relating to temperature and relative humidity, rainfall and solar radiation. However, there are also significant differences, particularly in terms of wind speed and direction, and chloride deposition rates, even over short distances. The prevailing wind direction, proximity to the coastline, condition of the shoreline and the resulting wave action appear to have a major impact on chloride deposition rates. The presence of vegetation and topographical features can significantly alter the exposure to onshore winds carrying salt spray.
The significant difference between the chloride deposition rates at the Iroquois Point coastal site compared with the Marine Corps Base coastal site is attributed to the following influencing factors:
Prevailing winds on the Island of Oahu are from the N and NE, with less frequent winds from the S.
Onshore wind speeds are generally much lower on southern shorelines than at the MCBH coastal site.
Because of offshore reefs on the south shore, there is only small shoreline wave action at the Iroquois Point coastline, compared with significant open ocean swells breaking on the MCBH coastline. In addition, the Iroquois shoreline is a relatively flat sandy beach while the shoreline at the MCBH coastal site is a combination of steep beach and rocky outcrops.
There is vegetation between the shoreline and the Iroquois Point sites, while the coastal site at MCBH is fully exposed to the onshore winds.
More conclusive results could be made if the chloride deposition rates were monitored more frequently, over periods with predominantly the same wind speed and direction. In addition, information on surf heights would confirm the relation of higher chloride deposition rates to breaking wave size.

Corrosion of Galvanized Fasteners University of Hawaii Final Report Steel Framing Alliance
73
4 FIELD TEST CONNECTIONS
4.1 CONNECTION SPECIMENS
4.1.1 Test Connection Development
In order to evaluate the effect of atmospheric corrosion on the strength of a typical screwed lap connection, numerous test connection specimens were placed in the field enclosures for periodic monitoring and testing. Identical test connections were also subjected to cyclic corrosion testing in the corrosion chamber. The selection of the test connections was based on the following criteria:
The connections should test the shear strength of the fasteners since this is the most common utilization of fasteners in CFS framing connections.
The connections should be simple and small so that they can be housed in the various field enclosure exposure conditions in sufficient numbers for future testing.
To improve the validity of comparisons between the control connections and subsequent tests, it was desirable to use connections producing relatively consistent test results. A large standard deviation in the connection test strengths would make it difficult to evaluate the significance of strength reduction caused by corrosion.
The failure should be controlled by failure of the fastener and not the plate elements, since this project is designed to focus on fastener corrosion.
Eight possible connection configurations were considered for these specimens. These configurations consist of:
2" wide 20 gage (33 mil) strips with 4#10 screws (Figure 4.1)
2" wide 20 gage (33 mil) strips with 4#8 screws (Figure 4.1)
2" wide 16 gage (54 mil) strips with 4#10 screws (Figure 4.2)
2" wide 16 gage (54 mil) strips with 4#8 screws (Figure 4.2)
1" wide 20 gage (33 mil) strips with 2#10 screws (Figure 4.3)
1" wide 20 gage (33 mil) strips with 2#8 screws (Figure 4.3)
1" wide 16 gage (54 mil) strips with 2#10 screws (Figure 4.4)
1" wide 16 gage (54 mil) strips with 2#8 screws (Figure 4.4)

Corrosion of Galvanized Fasteners University of Hawaii Final Report Steel Framing Alliance
74
Figure 4.1: 2" wide 20 gauge strips with 4 #8 or #10 screws.
Figure 4.2: 2" wide 16 gauge strips with 4 #8 or #10 screws.

Corrosion of Galvanized Fasteners University of Hawaii Final Report Steel Framing Alliance
75
Figure 4.3: 1" wide 20 gauge strips with 2 #8 or #10 screws.
Figure 4.4: 1" wide 16 gauge strips with 2 #8 or #10 screws.
4.1.2 Connection tests
Five samples of each configuration were fabricated by a local CFS supplier and tested in a universal test frame in the Material Testing Laboratory at the University of Hawaii (Figure 4.5). Each test was performed under strain control with a typical test taking 60 to 90 seconds from start to failure. Applied axial load and overall specimen deformation were recorded every second during the test.

Corrosion of Galvanized Fasteners University of Hawaii Final Report Steel Framing Alliance
76
Figure 4.5: Test Specimen in Test Frame.
The test results for these trial connections are shown in Figure 4.6 through Figure 4.13.The plots show load vs. deformation for each of the five specimens in the test series, along with the average response. Values for the average peak load and standard deviation of the peak values are listed on each plot.

Fig
ure
4.6
: T
est
resu
lts
for
2”
wid
e 2
0 g
au
ge
stri
ps
wit
h 4
#1
0 s
crew
s.
2" w
ide
20
ga
ug
e s
trip
s w
ith
4#
10
sc
rew
s
0
50
0
10
00
15
00
20
00
25
00
30
00 0
.00
0.0
50
.10
0.1
50
.20
0.2
50
.30
0.3
50
.40
Exte
nsio
n (
in)
Load (lb)
Sp
ecim
en
1
Sp
ecim
en
2
Sp
ecim
en
3
Sp
ecim
en
4
Sp
ecim
en
5
Ave
rage
Ave
rage
Pe
ak S
tre
ngth
= 2
48
2 lb
S
tan
da
rd D
evia
tio
n =
47
lb
77

Fig
ure
4.7
: T
est
resu
lts
for
2”
wid
e 2
0 g
au
ge
stri
ps
wit
h 4
#8
scr
ews.
2" w
ide
20
ga
ug
e s
trip
s w
ith
4#
8 s
cre
ws
0
50
0
10
00
15
00
20
00
25
00
30
00 0
.00
0.0
50
.10
0.1
50
.20
0.2
50
.30
0.3
50
.40
Exte
nsio
n (
in)
Load (lb)
Sp
ecim
en
1
Sp
ecim
en
2
Sp
ecim
en
3
Sp
ecim
en
4
Sp
ecim
en
5
Ave
rage
Ave
rage
Pe
ak S
tre
ngth
= 2
74
9 lb
S
tan
da
rd D
evia
tio
n =
63
lb
78

Fig
ure
4.8
: T
est
resu
lts
for
2”
wid
e 1
6 g
au
ge
stri
ps
wit
h 4
#1
0 s
crew
s.
2" w
ide
16
ga
ug
e s
trip
s w
ith
4#
10
sc
rew
s
0
50
0
10
00
15
00
20
00
25
00
30
00
35
00
40
00
45
00
50
00 0
.00
0.0
50
.10
0.1
50
.20
0.2
50
.30
0.3
50
.40
Ex
ten
sio
n (
in)
Load (lb)
Sp
ecim
en
1
Sp
ecim
en
2
Sp
ecim
en
3
Sp
ecim
en
4
Sp
ecim
en
5
Ave
rage
Ave
rage
Pe
ak S
tre
ngth
= 3
82
0 lb
S
tan
da
rd D
evia
tio
n =
23
1 lb
79

Fig
ure
4.9
: T
est
resu
lts
for
2”
wid
e 1
6 g
au
ge
stri
ps
wit
h 4
#8
scr
ews.
2" w
ide
16
ga
ug
e s
trip
s w
ith
4#
8 s
cre
ws
0
50
0
10
00
15
00
20
00
25
00
30
00
35
00
40
00
45
00
50
00 0
.00
0.0
50
.10
0.1
50
.20
0.2
50
.30
0.3
50
.40
Exte
nsio
n (
in)
Load (lb)
Sp
ecim
en
1
Sp
ecim
en
2
Sp
ecim
en
3
Sp
ecim
en
4
Sp
ecim
en
5
Ave
rage
Ave
rage
Pe
ak S
tre
ngth
= 4
56
1 lb
S
tan
da
rd D
evia
tio
n =
15
0 lb
80

Fig
ure
4.1
0:
Tes
t re
sult
s fo
r 1
” w
ide
20
ga
ug
e st
rip
s w
ith
2#
10
scr
ews.
1" w
ide
20
ga
ug
e s
trip
s w
ith
2#
10
sc
rew
s
0
20
0
40
0
60
0
80
0
10
00
12
00
14
00
16
00 0
.00
0.0
50
.10
0.1
50
.20
0.2
50
.30
0.3
50
.40
Exte
nsio
n (
in)
Load (lb)
Sp
ecim
en
1
Sp
ecim
en
2
Sp
ecim
en
3
Sp
ecim
en
4
Sp
ecim
en
5
Ave
rage
Ave
rage
Pe
ak S
tre
ngth
= 1
24
0 lb
S
tan
da
rd D
evia
tio
n =
49
lb
81

Fig
ure
4.1
1:
Tes
t re
sult
s fo
r 1
” w
ide
20
ga
ug
e st
rip
s w
ith
2#
8 s
crew
s.
1" w
ide
20
ga
ug
e s
trip
s w
ith
2#
8 s
cre
ws
0
20
0
40
0
60
0
80
0
10
00
12
00
14
00
16
00 0
.00
0.0
50
.10
0.1
50
.20
0.2
50
.30
0.3
50
.40
Exte
nsio
n (
in)
Load (lb)
Sp
ecim
en
1
Sp
ecim
en
2
Sp
ecim
en
3
Sp
ecim
en
4
Sp
ecim
en
5
Ave
rage
Ave
rage
Pe
ak S
tre
ngth
= 1
37
8 lb
S
tan
da
rd D
evia
tio
n =
80
lb
82

Fig
ure
4.1
2:
Tes
t re
sult
s fo
r 1
” w
ide
16
ga
ug
e st
rip
s w
ith
2#
10
scr
ews.
1" w
ide
16
ga
ug
e s
trip
s w
ith
2#
10
sc
rew
s
0
50
0
10
00
15
00
20
00
25
00 0
.00
0.0
50
.10
0.1
50
.20
0.2
50
.30
0.3
50
.40
Exte
nsio
n (
in)
Load (lb)
Sp
ecim
en
1
Sp
ecim
en
2
Sp
ecim
en
3
Sp
ecim
en
4
Sp
ecim
en
5
Ave
rage
Ave
rage
Pe
ak S
tre
ngth
= 1
91
5 lb
S
tan
da
rd D
evia
tio
n =
13
5 lb
83

Fig
ure
4.1
3:
Tes
t re
sult
s fo
r 1
” w
ide
16
ga
ug
e st
rip
s w
ith
2#
8 s
crew
s.
1" w
ide
16
ga
ug
e s
trip
s w
ith
2#
8 s
cre
ws
0
50
0
10
00
15
00
20
00
25
00 0
.00
0.0
50
.10
0.1
50
.20
0.2
50
.30
0.3
50
.40
Exte
nsio
n (
in)
Load (lb)
Sp
ecim
en
1
Sp
ecim
en
2
Sp
ecim
en
3
Sp
ecim
en
4
Sp
ecim
en
5
Ave
rage
Ave
rage
Pe
ak S
tre
ngth
= 2
28
4 lb
S
tan
da
rd D
evia
tio
n =
74
lb
84

Corrosion of Cold Formed Steel Fasteners University of Hawaii Final Report Steel Framing Alliance
85
The following observations were made based on the results of these initial connection tests.
With 20 gauge steel, the failure was the result of yielding and tearing of the steel around the screw hole. In 16 gauge steel, the failure was related more to the screw shear or tilting and stripping of the threads in the plate.
The 20 gauge failures are more ductile, with a closer scatter, while the 16 gauge failures are more abrupt. The 16 gauge failures are therefore also less consistent, with generally higher standard deviations.
In the 20 gauge steel, the 4 screw connections seem slightly more consistent than the 2 screw (ie. lower standard deviation) however, for the 16 gauge steel, 2 screw connections (both with #8 and #10 screws) are more consistent than 4 screw connections.
The smaller #8 screws typically gave more consistent peak strength values than the #10 screws.
After discussions with members of the advisory panel, it was decided that only #10 screws should be considered since these are becoming the standard for CFS framing connections. It was also desirable that the failure occurs due to fastener shear rather than plate yielding.Consequently the following test connection configuration was selected for all future testing:
16ga. (54 mils)
Connection Test Specimen
2#10 Screws
Load
Load
Section
0.625"
Figure 4.14: Test Specimen - 1¼ ” wide 16 gauge (54 mil) lap connection with 2#10 screws
4.1.3 Fastener selection
As described earlier, the field enclosures were constructed using two different screws for the CFS framing connections. All floor and wall framing used #10 Lox-head zinc-chromate coated self-drilling, self-threading screw fasteners (Figure 4.15). All roof truss connections used #10 Hex-head zinc coated self-drilling, self-threading screw fasteners (Figure 4.15). In order to select the screw to be used in the test connection specimens, 10 sample connections with each screw type were tested in the universal test frame at the University of Hawaii. Figure 4.16 and Figure 4.17 show the results of these tests.

Corrosion of Cold Formed Steel Fasteners University of Hawaii Final Report Steel Framing Alliance
86
Figure 4.15: Lox-head (left) and Hex-head (right) screws in test connections.

Fig
ure
4.1
6:
Tes
t re
sult
s fo
r 2
#1
0 L
ox
-hea
d s
crew
s in
1”
wid
e 1
6 g
au
ge
lap
co
nn
ecti
on
.
Lo
x-H
ead
Scre
w C
on
necti
on
s
0
500
10
00
15
00
20
00
25
00
30
00
35
00
00
.05
0.1
0.1
50
.20
.25
0.3
0.3
50
.40
.45
Dis
pla
ce
me
nt
(in
)
Load (lbf)
Lo
x 1
Lox 2
Lo
x 3
Lox 4
Lo
x 5
Lox 6
Lo
x 7
Lox 8
Lo
x 9
Lox 1
0
87

Fig
ure
4.1
7:
Tes
t re
sult
s fo
r 2
#1
0 H
ex-h
ead
scr
ews
in 1
” w
ide
16
ga
ug
e la
p c
on
nec
tio
n.
Hex-H
ead
Scre
w C
on
necti
on
s
0
50
0
1000
1500
2000
2500
3000
3500
00.0
50
.10.1
50.2
0.2
50
.30.3
50.4
0.4
5
Dis
pla
ce
me
nt
(in
.)
Load (lbf)
He
x 1
Hex 2
He
x 4
Hex 5
He
x 6
Hex 8
He
x 9
Hex 1
0
He
x 1
1H
ex 1
2
88

Corrosion of Cold Formed Steel Fasteners University of Hawaii Final Report Steel Framing Alliance
89
The Hex-head zinc coated fasteners were selected based on the following considerations:
The Hex-head fastener test results were more consistent than those for the Lox-head fasteners. The Lox-head fasteners often failed due to separation of the screw head from the shaft, while the Hex-head fastener failure was more commonly a shear failure of the screw shaft at the shear plane.
The Hex-head fasteners have a standard zinc coating (electroplated) rather than the zinc-chromate coating for the Lox-head fasteners.
The Hex-head fasteners are not a proprietary design.
4.1.4 Field enclosure test connections
Numerous test specimens are included in the field enclosures for testing at various stages during the project. Each test series will consist of three nominally identical test specimens. Some specimens will be installed during construction, while others will be left outside the enclosure for 3 and 6 months to simulate conditions for prefabricated framing that is left exposed prior to construction, or conditions at a delayed construction site. Specimens will be extracted from the enclosure after 6 months, one year and two years of exposure for testing at the UH Material Testing Laboratory under the same conditions as the initial control specimens. Additional specimens are included in the event that permission is granted to leave the enclosures in place for longer than the planned two years.
Table 4-1 shows the number and location of test specimens included in the field enclosures at Iroquois Point and Wheeler AAF.
Table 4-1: Test Connection Specimens at Iroquois Point and Wheeler AAF enclosures
Location Location in Enclosure Time installed Series*
At construction 5 L1
Inside wall cavity
Plywood sheathing with vinyl siding After 7 months ext. exposure 5
At construction 5 L2 In vented attic
After 7 months ext. exposure 5
At construction 5 L3
In open crawl space
Without plywood sheathing After 7 months ext. exposure 5
At construction 5 L4
In covered crawl space
With plywood sheathing After 7 months ext. exposure 5
L5 Permanent exterior exposure At construction 10
TOTAL – Each enclosure 50
* Each test series consists of three test connections. One series is intended for testing at each of 6 months, 1 year and 2 years exposure, with two test series saved for potential longer term testing.

Corrosion of Cold Formed Steel Fasteners University of Hawaii Final Report Steel Framing Alliance
90
Table 4-2 shows the number and location of test specimens included in MCBH field enclosures.
Table 4-2: Test Connection Specimens at MCBH Coastal and Inland enclosures
Location Location in Enclosure Time installed Series*
At construction 5
After 3 months ext. exposure ** 5 L1Inside wall cavity
Plywood sheathing with vinyl siding After 7 months ext. exposure 5
At construction 5
After 3 months ext. exposure ** 5 L2
Inside wall cavity
Hardie Board with vapor barrier (Coastal)
Hardie Board without vapor barrier (Inland) After 7 months ext. exposure 5
At construction 5
After 3 months ext. exposure ** 5 L3
Inside wall cavity
Hardie Board without vapor barrier (Coastal)
Hardie Board with vapor barrier (Inland) After 7 months ext. exposure 5
At construction 5
After 3 months ext. exposure ** 5 L4 In vented attic
After 7 months ext. exposure 5
At construction 5
After 3 months ext. exposure ** 5 L5In open crawl space
Without plywood sheathing After 7 months ext. exposure 5
At construction 5
After 3 months ext. exposure ** 5 L6In covered crawl space
With plywood sheathing After 7 months ext. exposure 5
L7 Permanent exterior exposure At construction 10
TOTAL – Coastal
TOTAL – Inland
100
70
* Each test series consists of three test connections. One series is intended for testing at each of 6 months, 1 year and 2 years exposure, with two test series saved for potential longer term testing.** The 3 month exterior exposure was only applied at MCBH coastal enclosure because of the low corrosion rate at the inland site.
A total of 320 test series were installed at the field enclosure, for an overall total of 960 test specimens. These test connections were installed in Fall 2003 as indicated in the field enclosure timelines in section 2.5. Identical specimens were also prepared for use in the cyclic corrosion chamber described in the following chapter.

Corrosion of Cold Formed Steel Fasteners University of Hawaii Final Report Steel Framing Alliance
91
5 ACCELERATED CORROSION CHAMBER
5.1 INTRODUCTION
It is anticipated that some of the field exposure sites will not produce significant corrosion of the galvanized fasteners or cold formed steel sections for a number of years, particularly for those elements enclosed in unvented interior spaces. An accelerated corrosion chamber was therefore used to induce more rapid corrosion of CFS connections.
5.2 INSTALLATION
The corrosion chamber purchased for this project is the QFOG Cyclic Corrosion Tester 1100 (Figure 5.1), manufactured by Q-Panel Lab Products of Cleveland, Ohio. The QFOG 1100 has a chamber volume of approximately 1100 liters, which is capable of handling up to two hundred 4”x12” samples. The corrosion chamber was purchased with funds from two main contributors. The UH College of Engineering contributed $10,000 to the purchase of the chamber. The Steel Framing Alliance collected and contributed $7,000 in donations from companies listed in Table 5-1.
Table 5-1: List of contributors for the Corrosion Chamber
Company Address Contact
CEMCO263 Covina Lane City of Industry, CA 91746
Tom Porter
Western Metal Lath 6510 General Drive Riverside, CA 92509
John Maciel
Steeler, Inc. 10023 MLK Jr. Way So. Seattle, WA 98178
Michael Vailencour
E T & F Fasteners 29019 Solon Rd. Solon, OH 44139
Dave Nolan
Figure 5.1: QFOG Cyclic Corrosion Chamber 1100

Corrosion of Cold Formed Steel Fasteners University of Hawaii Final Report Steel Framing Alliance
92
The corrosion chamber was installed on the west side of Holmes Hall at UH. The chamber is located along the exterior of the building; this reduces the impact of the corrosive chamber exhaust on the surroundings (Figure 5.2).
The corrosion chamber is not a self-contained unit; various utilities are required to be connected to the chamber once the chamber is in place. The chamber requires a source of air, with a pressure range of 40-120 psi and a maximum flow rate of 3.5 standard cubic feet per minute (SCFM), which is free of oil, dirt and moisture.
Figure 5.2: Corrosion chamber adjacent to Structures Lab

Corrosion of Cold Formed Steel Fasteners University of Hawaii Final Report Steel Framing Alliance
93
A stand-alone oil-less air compressor and tank (Campbell and Hausfeld model WL6100) was purchased and installed next to the chamber (Figure 5.3). A water and debris filter was installed on the inlet to the chamber to remove any moisture and dirt from the incoming air (Figure 5.3).
Figure 5.3: Oil-less air compressor and air filter
The chamber also requires a source of purified water, which fills the bubble tower that maintains the humidity level in the chamber. A General Electric, model GXRV10ABL, reverse osmosis water purification system was installed adjacent to the chamber (Figure 5.4). A permanent water line was installed to supply the water purifier with tap water. A second reverse osmosis water purification system and storage tank were installed to provide a pure water supply for use in creating the saline mixture for the spray supply tank.

Corrosion of Cold Formed Steel Fasteners University of Hawaii Final Report Steel Framing Alliance
94
Figure 5.4: Reverse Osmosis water purifier behind the QFOG chamber
The chamber and the reverse osmosis system are required to discharge to a drain. The chamber has a drain for the main chamber, solution tank and bubble tower while the reverse osmosis system has a drain from the contaminate side of the membrane filter. The location of the chamber is not close to a drain access that would allow gravity drainage to the sewer system. A tank with a submersible sump pump was assembled and installed adjacent to the chamber (Figure 5.5). The sump pump has a pressure actuated level switch that starts the pump when the tank level is between 7-10 inches and pumps the tank down to a level of approximately 1-2 inches. The last connection need for the chamber is the electrical power. The chamber requires a 220-volt power source to operate. The larger voltage is needed to operate the chamber heaters as well as provide power to the controls and solution pump.
Figure 5.5: Drain sump with sump pump and associated plumbing
Sump Pump

Corrosion of Cold Formed Steel Fasteners University of Hawaii Final Report Steel Framing Alliance
95
The corrosion chamber exposes the samples to a series of different environments in a repetitive cycle. The following exposure functions are used to develop the exposure environments:
Fog Function: During the Fog Function, the chamber generates a conventional salt spray. Typically compressed air is humidified in the bubbler tower as it is passed to the spray nozzles. The corrosive solution is pumped to the spray nozzle where it mixes with the compressed air. The spray nozzle atomizes the corrosive solution. Heaters are used to maintain the programmed chamber temperature during the Fog cycle.
Dry-Off Function: During the Dry-Off Function, a purge blower moves ambient air over heaters then into the chamber. This produces a low humidity condition inside the chamber. The chamber heaters in conjunction with the purge air heaters maintain the chamber temperature. This mode can also be operated without heaters.
Humidity Function: During the Humidity Function, the chamber environment is maintained at a 100% relative humidity condition by moving hot water vapor into the chamber. The vapor generator heaters maintain the chamber temperature.
Dwell Function: During the Dwell Function, the chamber temperature is maintained by the chamber heaters. No fog, dry-off, air purge, or humidity is generated.
5.3 CYCLIC ROUTINES
Numerous testing schemes and standards have been developed to accelerate the corrosion of materials in order to develop more resistant materials and protective coatings. The American Society for Testing and Materials (ASTM), the Society of Automotive Engineers (SAE) and several corporations standardized their corrosion tests. The oldest standardized corrosion standard practice is the ASTM B117. The ASTM B117 was originally published in 1939. The latest revision to ASTM B117 was made in 1995.
5.3.1 ASTM B117
The ASTM B117 standard describes the apparatus, procedure, and condition required to create and maintain the salt spray test environment. The ASTM B117 does not prescribe the type of specimen or the exposure period to be used. The ASTM B117 does define the salt solution parameters, air supply specifications, and the condition in the chamber.
The salt spray concentration is specified to be 5 ± 1% NaCl by mass. The salt used shall be substantially free of nickel and copper. Some salts contain additives that may act as corrosion inhibitors, therefore careful attention should be given to the chemical content of the salt.
The compressed air supply to the nozzle is specified to be free of oil and dirt and maintained between 10 and 25 psi.
ASTM B117 still is widely used in all spheres of industry, yet it was initially developed over the period 1910-1920 and first standardized in 1939. ASTM B117 specification defines a corrosion test that applies a continuous salt spray (fog) to the specimens. According to the specification, the spray operates continuously except for the short daily interruptions necessary to inspect, rearrange, or remove test specimens, to check and replenish the solution in the reservoir, and to make necessary recordings of temperature. The cycling of wetting and drying is not defined in this older standard.

Corrosion of Cold Formed Steel Fasteners University of Hawaii Final Report Steel Framing Alliance
96
5.3.2 Prohesion Test
During the 1970’s considerable work was done to determine and alternative to the continuous salt spray defined by ASTM B117 test. A pioneer in the early testing development was F.D. Timmins who determined that the conventional salt spray test was qualifying coatings in the laboratory, but failures were still occurring in practice (Cremer, 1989). Timmins along with Dr. J.B. Harrison and T.C.K Tickle questioned the use of a relatively concentrated solution of 5% sodium chloride at elevated temperatures (Cremer, 1989). Harrison and Tickle noticed that the behavior of zinc phosphate primers was excellent outdoors in an industrial environment, but their performance during accelerated salt spray testing was poor (Cremer, 1989). Harrison hypothesized that a solution of common atmospheric salts would be more appropriate. Timmins decided that a weak solution of Harrison’s mixture should be used, consisting of 0.40% wt ammonium sulphate and 0.05% wt sodium chloride. It was also concluded that ambient temperature spray would correspond closely to natural weathering. Timmins dubbed his test Prohesion, which is an acronym for Protection is Adhesion. The prohesion test has been standardized as ASTM G85 modification 5.
5.3.3 ASTM G85
The current ASTM G85 standard was approved on February 15, 1994. The original standard was published in 1985. The G85 standard defines the following five modifications to salt spray (fog) testing:
o Acetic acid-salt spray test, continuous o Cyclic acidified salt spray test o Seawater acidified test, cyclic (SWAAT) o SO2 salt spray test, cyclic o Dilute electrolyte cyclic fog dry test
Each modification has it’s own salt solution, solution pH, temperature parameters, and standard cycle events. Table 5-2 shows the defining parameters for each modification.

Corrosion of Cold Formed Steel Fasteners University of Hawaii Final Report Steel Framing Alliance
97
Table 5-2: Comparison of the variations in ASTM G85 standard
ModificationSalt
solution
Solution
pH
Temperature
requirementsCycle
Bubble tower: 117±2°FAcetic acid-salt
spray test 5 ±1% NaCl
by weight 3.1 – 3.3 using
acetic acid Chamber: 95+2 or -3°F
Continuous
Bubble tower: 135±2°FCyclic acidified
salt spray test 5 ±1% NaCl
by weight 2.8 – 3.0 using
acetic acid Chamber: 120+2 or -3°F
¾ hour spray followed by 2-hour dry air purge (use
ambient air) followed by a 3¼ hour soak at high
relative humidity
Bubble tower: 117±2°F or 135 ± 2°F depending on
chamber temp. Seawater
acidified test, cyclic (SWAAT)
42 g of synthetic sea
salt and 10 mL of glacial
acetic acid per liter
2.8 – 3.0 Chamber:
Depends on material, but
generally 120°F
30 minute spray followed by 90 minute soak at >98%
relative humidity.
Bubble tower: 117±2°F
SO2 salt spray test
42 g of synthetic sea
salt OR 5 ±1% NaCl by
weight. SO2
gas will be injected into
cabinet
2.5 – 3.2
Chamber: 95+2 or -3°F
Depends on material or product being tested.
Example cycle: ½ hour salt spray followed
by ½ hour SO2 gas followed by 2 hour soak.
Dilute electrolyte cyclic fog dry
test
0.05% NaCl and 0.35% ammonium
sulfate,(NH4)2SO4 by
weight.
5.0 – 5.4
Dryoff Temperature:
95±3°FFog Temperature:
75±6°F
1 hour of fog followed by 1 hour of dry-off at elevated
temperature.

Corrosion of Cold Formed Steel Fasteners University of Hawaii Final Report Steel Framing Alliance
98
5.3.4 CCT-1 and CCT-4
The Japanese automotive manufacturers developed the Cyclic Corrosion Test 1 and 4 (also known as CCT-A and CCT-D (QFOG, 2000)). The CCT programs installed in the Q-Fog corrosion chamber have added transition steps.
CCT-1 exposure conditions include: Electrolyte solution: 5% sodium chloride Acidity: not specified Typical duration: 200 cycles (1600 hours)
The CCT-1 exposure cycle is:
Step 1: Salt fog at 35 C for 4 hours
Step 2: Dry-Off at 60 C for 2 hours
Step 3*: Dry-Off at 40 C for ½ hour
Step 4: Soak at 50 C, RH>95% for 2 hours Step 5: Go to step 1
*Q-Fog programmers added Step 3 to improve transition times between steps. The other Japanese automotive testing procedure, CCT-4, is unique in the sense that after a
salt fog cycle followed by drying off cycle, a sub-cycle inserted. The sub-cycle, consisting of alternating periods of high humidity and dry-off, is performed for five repetitions. In SAE and AISI research projects CCT-4 was shown to be one of the exposures that best correlated with actual vehicle corrosion results (Repp, 2002).
CCT-4 exposure conditions include: Electrolyte solution: 5% sodium chloride Acidity: not specified Typical duration: 50 cycles (1200 hours) The CCT-4 exposure cycle is:
Step 1: Salt fog at 35 C for 10 minutes
Step 2: Dry-Off at 60 C for 2 hours, 10 minutes
Step 3*: Dry-Off at 50 C for 15 minutes
Step 4: 95% RH at 60 C for 1 hour, 15 minutes Step 5: Sub-cycle: steps 6 – 8 repeat 5 times
Step 6: Dry-Off at 60 C for 2 hours, 25 minutes
Step 7*: Dry-Off at 50 C for 15 minutes
Step 8: 95% RH at 60 C for 1 hour, 20 minutes
Step 9*: Dry-Off at 35 C for 10 minutes Step 10: Go to Step 1
*Q-Fog programmers added Steps 3,7 and 9 to improve transition times between steps.

Corrosion of Cold Formed Steel Fasteners University of Hawaii Final Report Steel Framing Alliance
99
5.3.5 SAE J2334
The Society of Automotive Engineers (SAE) has developed a standard testing procedure for cosmetic corrosion. The SAE J2334 Cosmetic Corrosion Testing Procedure was originally issued in June of 1998. The latest revision to the SAE J2334 was published in October 2002.This cosmetic corrosion lab test procedure is based on field correlated lab test procedure parameters as determined by a Design of Experiment process conducted by the SAE Automotive Corrosion and Prevention Committee (SAE/ACAP) and the Auto/Steel Partnership (A/SP) Corrosion Task Force. Results from this test will provide excellent correlation to severe corrosive field environments with respect to cosmetic corrosion performance (Repp, 2002).
SAE J2334 standard encompasses various methods of establishing the different environments. It is generally understood that some form of chamber will be used. SAE J2334 has separate testing alternatives for manual application of the salt solution and automatic application with a cyclic corrosion chamber. The automatic method will be discussed here since UH has purchased an automated chamber. The electrolyte solution outlined in the J2334 is comprised of the following salts:
0.5% NaCl 0.1% CaCl2
0.075% NaHCO3
The test cycle outline in the J2334 consists of three basic stages (Figure 5.6): 1. Humid Stage—50 °C and 100% Humidity, 6 h in duration, 2. Salt Application Stage—15 min duration conducted at ambient conditions 3. Dry Stage—60 °C and 50% RH, 17 h and 45 min in duration
Figure 5.6: Daily testing cycle for SAE J2334 standard
Typical test durations are a minimum of 60 cycles in length. The J2334 is primarily designed to evaluate automotive coatings. Longer duration testing may be required when heavier metallic precoats are used.

Corrosion of Cold Formed Steel Fasteners University of Hawaii Final Report Steel Framing Alliance
100
5.3.6 Procedure developed by Dr. Zhang at Teck Cominco
Past research has shown that the corrosion rate of zinc exposed to the atmosphere is less than one tenth of the corrosion rate for steel (Figure 5.7). Tech Cominco investigated numerous cyclic test routines to establish a routine that approximated this relative corrosion rate (Figure 5.8).
Figure 5.7: Corrosion ratio for steel and zinc (after Zhang, 1997)
Figure 5.8: Corrosion rates for various test routines (after Zhang, 1997)

Corrosion of Cold Formed Steel Fasteners University of Hawaii Final Report Steel Framing Alliance
101
Figure 5.8 shows that a continuous salt spray test (as prescribed by ASTM B117) produces a corrosion ratio of 1.5 between steel and zinc (test routine 6), which does not simulate atmospheric conditions. Test routine 8 is recommended to replicate the relative corrosion rates under atmospheric conditions. This routine utilizes a 0.01 M NaCl solution for the following series of steps:
Salt spray for 15 minutes at 35 oC
Heated drying for 30 minutes at 35 oC
RepeatEach cycle therefore lasts 45 minutes. The 0.01 M NaCl solution represents 0.8g of NaCl
per liter of distilled water, or a 0.08% salt solution.
5.3.7 Summary of Industry testing procedures
The ideal testing procedure is one that will produce consistent and reproducible results and also replicate the relative corrosiveness of zinc and steel in atmospheric conditions. The consistency of the testing process will allow for correlation of a given exposure in the laboratory to actual corrosion rates in the field. The reproducibility of the testing procedure relates to the ability of other laboratories to perform the same test and achieve the same results. There are numerous factors that determine the consistency and the reproducibility of the testing procedure.
Industry experts tend to agree on one thing with regard to corrosion testing. That is, the widely used ASTM B117 salt spray test produces extremely poor correlation to observed corrosion in the environment. In fact, Robert E. Townsend a consultant for Bethlehem Steel submitted a paper titled “The Salt Spray Test is Bogus” to the 2000 SAE World Congress [Romanchick, 2000]. In the paper, Townsend criticizes the use of ASTM B117 in the automotive industry.
The reason that the ASTM B117 test methods do not accurately reproduce corrosion performance for auto parts is that they do not accurately reproduce the conditions in which automotive parts must exist. For one thing, parts tested in a salt-spray cabinet are continuously wet, while those parts on a vehicle experience periods of wet and dry [Romanchick, 2000]. The same conclusion can be made when trying to relate construction related corrosion to exposures in the ASTM B117.
The automotive industry has done ample research to update their testing procedures for coatings. The SAE J2334 has been revised to incorporate different methods for salt solution application and for different methods of obtaining the desired relative humidity. The United States Army, as a representative for the Department of Defense, has worked closely with automotive industry leaders to continually update the J2334 standard. A report from Corrpro Companies, Inc. at the 2002 US Army Corrosion Summit concluded that the J2334 procedure produced the most repeatable and reproducible results out of any of the testing standards. This conclusion was based on 5-years of test data from 13 different laboratories. This test routine was not used in the current study because of the one day length of each corrosion cycle, and the likelihood that numerous cycles would be required to affect the strength of galvanized fasteners.
The routine developed by Teck Cominco utilizes numerous short duration cycles with relatively low salt concentrations. This routine has been shown to provide good replication of the effects of atmospheric exposure on zinc galvanizing, and was therefore selected for the cyclic corrosion testing performed as part of this study.

Corrosion of Cold Formed Steel Fasteners University of Hawaii Final Report Steel Framing Alliance
102
5.4 CYCLIC CORROSION CHAMBER TESTING PROCEDURE
5.4.1 Samples Exposed in Chamber
As discussed in section 2.2, testing samples will be placed in various locations throughout the field enclosures. Similar samples will be exposed in the corrosion chamber. The samples in the field will be the standard corrosion example we are trying to achieve in the laboratory. In addition to the connection samples, plain steel and zinc samples (coupons) will be tested in the chamber to monitor the corrosion process. Mass loss of the coupons will be recorded to monitor the corrosiveness of the environment. Coupons will be removed and analyzed after a predetermined number of cycles throughout the test to monitor corrosion. To analyze coupons, remove 1 coupon from rack and prepare for weighing and mass loss determination. Insure enough coupons are exposed in the test so monitoring frequency can be accomplished. Additional unexposed coupons can be added throughout the test to obtain interval data in addition to cumulative data. Before weighing, clean the coupons using a mild “sand blast” (preferably glass beads) to remove all corrosion by-products from the coupon surface. Once clean, wipe the coupons with methanol and weigh to determine the coupon mass loss rate using equation 4.1.
daym
g
ExposedDays AreaSurface
MassExposureofEnd-MassInitialRateLoss
2 (4.1)
Generally, the preparation and processing of the testing coupons should follow:
Sand blast the coupon to obtain a clean finish
Stamp the coupon number and date of preparation
Weigh the coupon and record
Measure the dimensions of the coupon and record
Place the coupon in the corrosion chamber or the field enclosure as applicable
Remove the coupon at a predetermined time
Sand blast (preferably with glass beads) or wire brush the coupon to remove all corrosion products.
Weigh the cleaned testing coupon and compute the mass loss rate
5.4.2 Testing Documentation
Prior to each test, the fog deposition rate should be determined following the procedure for doing the fog deposition test is listed in Appendix D. The air pressure and pump speed should be adjusted to provide a rate between 1 – 2 mL/hour of fog in each collection funnel. The test results should be maintained in a log to ensure consistent fog dispersion for each test. Along with fog deposition, the solution concentration and periodicity of refilling should be logged.These values are above and beyond the data collected from mass loss and sample degradation. A QFOG LOG has been established in the laboratory.
5.5 STEEL AND ZINC COUPONS
5.5.1 Coupon Preparation
In order to correlate the corrosion rates at the various field sites with those observed in the corrosion chamber or at other sites around the State and elsewhere, standard steel and zinc coupons were prepared and placed in each exposure condition at the field sites and in the corrosion chamber along with the screwed test connections. Both steel and zinc plates are

Corrosion of Cold Formed Steel Fasteners University of Hawaii Final Report Steel Framing Alliance
103
made from 3/16” thick 2” wide flat steel strips cut 3.5” long (Figure 5.9). The steel coupons were sand-blasted and weighed immediately prior to placement in the field enclosures or in the corrosion chamber. The zinc specimens were created by sand-blasting steel coupons and hot-dip galvanizing them at a steel fabrication plant on Oahu. These coupons were then weighed and placed in the field enclosures and corrosion chamber.
After exposure, the coupons were cleaned to remove all corrosion products and re-weighed to measure the mass loss during the time of exposure. The steel coupons were cleaned using a hydrochloric acid solution and wire brushing, while the zinc coupons were cleaned using an ammonium chloride solution and soft plastic bristle brush.
5.5.2 Coupon Placement
Steel and zinc coupons were placed in plastic racks in the corrosion chamber (Figure 5.10) and hung from line supports in the field enclosures (Figure 5.11). Coupons in the corrosion chamber were recovered at the same time that a set of test connections was extracted and tested.A typical set of coupons after 3186 cycles is shown in Figure 5.12. It was clear in both atmospheric and chamber conditions that the steel coupon corrosion was progressing significantly faster than the zinc corrosion. This was also confirmed by the weight loss results presented below.
Figure 5.9: Steel, sand-blasted steel and zinc coated steel coupons (Left to right)

Corrosion of Cold Formed Steel Fasteners University of Hawaii Final Report Steel Framing Alliance
104
Figure 5.10: Steel and zinc coupons after 5 days in the corrosion chamber (160 cycles)
Figure 5.11: Steel and zinc coupons along with connection specimens in wall cavity.

Corrosion of Cold Formed Steel Fasteners University of Hawaii Final Report Steel Framing Alliance
105
Figure 5.12: Steel and zinc coupons after 3186 cycles in the corrosion chamber.
5.5.3 Corrosion Rates for Steel and Zinc
Figure 5.13 to Figure 5.15 compare the corrosion rates for steel and zinc coupons recovered after various periods of exposure in the corrosion chamber. Figure 5.13 shows the weight loss in percent of original weight for steel and zinc coupons. The steel coupons are corroding at a far higher rate than the zinc coupons as shown by the trend lines in Figure 5.13. Figure 5.14 shows the ratio between the percent weight loss for steel and zinc. The trend line shows that this rate started close to 10 and has reduced to 7.5 after 3200 cycles. The cyclic routine applied in the corrosion chamber is therefore replicating atmospheric conditions reasonably well according to the reported rate of approximately 10 (Zhang, 1997).
Figure 5.15 shows the corrosion rate for steel and zinc coupons in terms of average mass loss per surface area per cycle in the corrosion chamber. For both materials, this rate decreases with time spent in the chamber, though this decrease is greater for the steel coupons.

Corrosion of Cold Formed Steel Fasteners University of Hawaii Final Report Steel Framing Alliance
106
Comparison of Steel and Zinc Corrosion Rates
y = 5.356E-04x
y = 6.564E-05x
0
0.2
0.4
0.6
0.8
1
1.2
1.4
1.6
1.8
0 500 1000 1500 2000 2500 3000 3500
Number of cycles
Weig
ht
loss, %
Steel Coupons
Zinc Coupons
Figure 5.13: Comparison of corrosion rates for steel and zinc coupons in the corrosion chamber
Ratio of Steel/Zinc corrosion rates
0
2
4
6
8
10
12
14
16
0 500 1000 1500 2000 2500 3000 3500
Number of cycles
Ra
tio
of
Ste
el/
Zin
c %
Lo
ss
Figure 5.14: Ratio of corrosion rate for steel and zinc coupons in corrosion chamber

Corrosion of Cold Formed Steel Fasteners University of Hawaii Final Report Steel Framing Alliance
107
Comparison of Steel and Zinc Corrosion Rates
0
0.02
0.04
0.06
0.08
0.1
0.12
0.14
0.16
0.18
0.2
0 500 1000 1500 2000 2500 3000 3500
Number of cycles
Weig
ht
loss (
gm
/m2/c
yc
le*1
03)
Steel Coupons
Zinc Coupons
Figure 5.15: Steel and zinc corrosion rates in terms of mass loss per surface area per cycle
5.5.4 Corrosion Chamber Connection Specimens
The first cyclic corrosion testing performed in the corrosion chamber involved numerous standard test connections and steel and zinc coupons. Specimens in the chamber are supported by slot-racks that keep the specimens at approximately 80 degrees from the horizontal (Figure 5.16). The test connection specimens were installed on July 13, 2003. Control connections were tested to establish the baseline for connection shear strength. Half of the specimens were installed with screw heads up, while the other half were installed with screw threads up. The connections and coupons were rotated every week to ensure even exposure to the salt spray.Connections and coupons were removed at various intervals to evaluate the effect of the salt spray cycling. The connections were tested in sets of three for comparison with the control set.
The steel and zinc coupons (Figure 5.17) were cleaned of all corrosion product and weighed for comparison with the original weight. The resulting average corrosion rate for steel and zinc could then be established for the period of exposure of the coupons. These results were presented in section 5.5.

Corrosion of Cold Formed Steel Fasteners University of Hawaii Final Report Steel Framing Alliance
108
Figure 5.16: Test connections in the corrosion chamber
Figure 5.17: Steel and zinc coupons in the corrosion chamber

Corrosion of Cold Formed Steel Fasteners University of Hawaii Final Report Steel Framing Alliance
109
6 CONNECTION TEST RESULTS
6.1 CONTROL SPECIMEN TESTS
Development of the lap splice test specimens was described in Chapter 4. In order to ensure a shear failure in the screws rather than yielding of the CFS plates, the following test specimen configuration was selected:
1¼ ” wide 16 gauge (54 mil) lap connection with 2#10 screws
Three control specimens were tested to provide a benchmark for comparison with future specimens recovered from the field sites or removed from the accelerated corrosion chamber. Each specimen was tested in the same MTS 55 kip universal test frame used for the connection development tests (Figure 6.1). Tension was applied under displacement control at 0.01 in/sec (0.25 mm/sec) until complete separation of the lap connection. This same test frame and procedure were used for all subsequent connection tests. Figure 6.2 shows a typical control test specimen after failure.
Figure 6.1: Control specimen in test frame
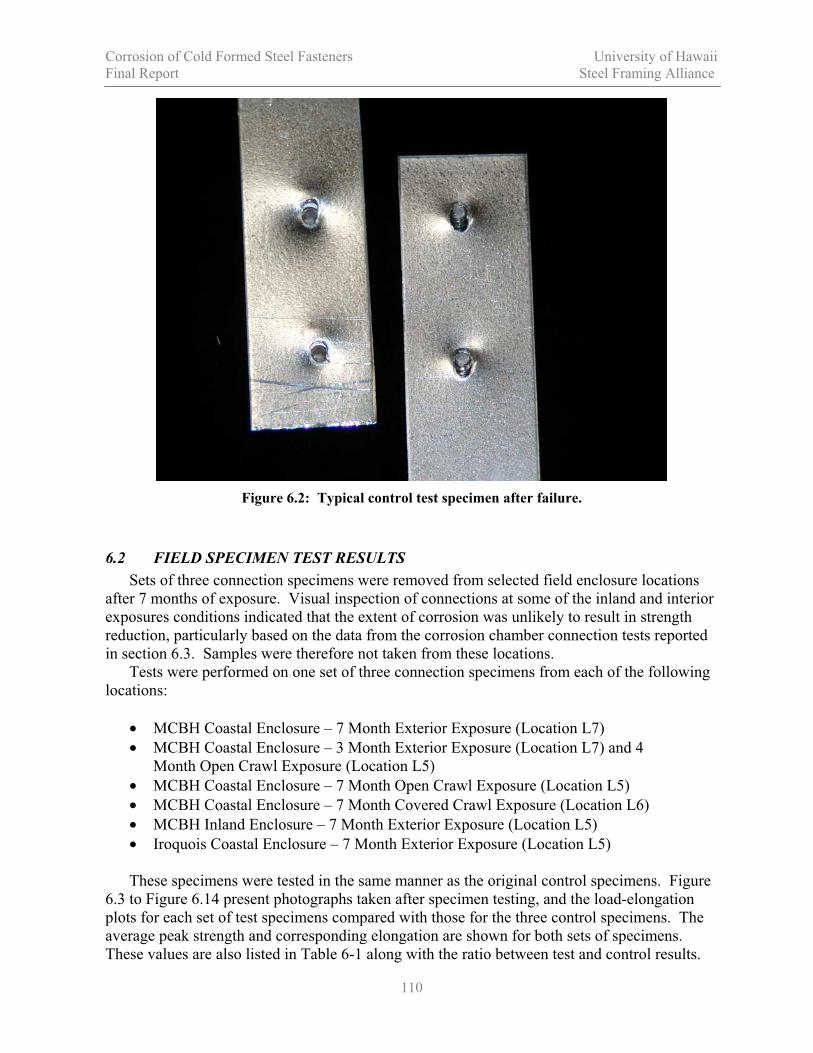
Corrosion of Cold Formed Steel Fasteners University of Hawaii Final Report Steel Framing Alliance
110
Figure 6.2: Typical control test specimen after failure.
6.2 FIELD SPECIMEN TEST RESULTS
Sets of three connection specimens were removed from selected field enclosure locations after 7 months of exposure. Visual inspection of connections at some of the inland and interior exposures conditions indicated that the extent of corrosion was unlikely to result in strength reduction, particularly based on the data from the corrosion chamber connection tests reported in section 6.3. Samples were therefore not taken from these locations.
Tests were performed on one set of three connection specimens from each of the following locations:
MCBH Coastal Enclosure – 7 Month Exterior Exposure (Location L7)
MCBH Coastal Enclosure – 3 Month Exterior Exposure (Location L7) and 4 Month Open Crawl Exposure (Location L5)
MCBH Coastal Enclosure – 7 Month Open Crawl Exposure (Location L5)
MCBH Coastal Enclosure – 7 Month Covered Crawl Exposure (Location L6)
MCBH Inland Enclosure – 7 Month Exterior Exposure (Location L5)
Iroquois Coastal Enclosure – 7 Month Exterior Exposure (Location L5)
These specimens were tested in the same manner as the original control specimens. Figure 6.3 to Figure 6.14 present photographs taken after specimen testing, and the load-elongation plots for each set of test specimens compared with those for the three control specimens. The average peak strength and corresponding elongation are shown for both sets of specimens. These values are also listed in Table 6-1 along with the ratio between test and control results.

Corrosion of Cold Formed Steel Fasteners University of Hawaii Final Report Steel Framing Alliance
111
Figure 6.3: MCBH Coastal – 7 Months Exterior Exposure
MCBH Coastal - Exterior exposure (L7) - 7 Months
0
0.5
1
1.5
2
2.5
3
3.5
0 0.05 0.1 0.15 0.2 0.25 0.3 0.35 0.4
Elongation (in)
Lo
ad
(k
ips
)
Field Specimen 1
Field Specimen 2
Field Specimen 3
Control 1
Control 2
Control 3
Field Ave Strength
Field Peak Disp.
Control Ave Strength
Control Peak Disp.
Figure 6.4: MCBH Coastal – 7 Months Exterior Exposure – Test Results

Corrosion of Cold Formed Steel Fasteners University of Hawaii Final Report Steel Framing Alliance
112
Figure 6.5: MCBH Coastal – 3 Months Exterior Exposure + 4 Months Open Crawl Exposure
MCBH Coastal - 7 Months[3 Months Exterior Exp. (L7) + 4 Months Open Crawl Exp. (L5)]
0
0.5
1
1.5
2
2.5
3
3.5
0 0.05 0.1 0.15 0.2 0.25 0.3 0.35 0.4
Elongation (in)
Lo
ad
(k
ips
)
Field Specimen 1
Field Specimen 2
Field Specimen 3
Control 1
Control 2
Control 3
Field Ave Strength
Field Peak Disp.
Control Ave Strength
Control Peak Disp.
Figure 6.6: MCBH Coastal – 3 Months Ext. Exp. + 4 Months Open Crawl Exp. – Test Results

Corrosion of Cold Formed Steel Fasteners University of Hawaii Final Report Steel Framing Alliance
113
Figure 6.7: MCBH Coastal – 7 Months Open Crawl Exposure
MCBH Coastal - Open Crawl exposure (L5) - 7 Months
0
0.5
1
1.5
2
2.5
3
3.5
0 0.05 0.1 0.15 0.2 0.25 0.3 0.35 0.4
Elongation (in)
Lo
ad
(k
ips
)
Field Specimen 1
Field Specimen 2
Field Specimen 3
Control 1
Control 2
Control 3
Field Ave Strength
Field Peak Disp.
Control Ave Strength
Control Peak Disp.
Figure 6.8: MCBH Coastal – 7 Months Open Crawl Exposure – Test Results

Corrosion of Cold Formed Steel Fasteners University of Hawaii Final Report Steel Framing Alliance
114
Figure 6.9: MCBH Coastal – 7 Months Covered Crawl Exposure
MCBH Coastal - Covered Crawl exposure (L6) - 7 Months
0
0.5
1
1.5
2
2.5
3
3.5
0 0.05 0.1 0.15 0.2 0.25 0.3 0.35 0.4
Elongation (in)
Lo
ad
(k
ips
)
Field Specimen 1
Field Specimen 2
Field Specimen 3
Control 1
Control 2
Control 3
Field Ave Strength
Field Peak Disp.
Control Ave Strength
Control Peak Disp.
Figure 6.10: MCBH Coastal – 7 Months Covered Crawl Exposure – Test Results

Corrosion of Cold Formed Steel Fasteners University of Hawaii Final Report Steel Framing Alliance
115
Figure 6.11: MCBH Inland – 7 Months Exterior Exposure
MCBH Inland - Exterior exposure (L7) - 7 Months
0
0.5
1
1.5
2
2.5
3
3.5
0 0.05 0.1 0.15 0.2 0.25 0.3 0.35 0.4
Elongation (in)
Lo
ad
(k
ips
)
Field Specimen 1
Field Specimen 2
Field Specimen 3
Control 1
Control 2
Control 3
Field Ave Strength
Field Peak Disp.
Control Ave Strength
Control Peak Disp.
Figure 6.12: MCBH Inland – 7 Months Exterior Exposure – Test Results

Corrosion of Cold Formed Steel Fasteners University of Hawaii Final Report Steel Framing Alliance
116
Figure 6.13: Iroquois Coastal – 7 Months Exterior Exposure
Iroquois Coastal - Exterior exposure (L5) - 7 Months
0
0.5
1
1.5
2
2.5
3
3.5
0 0.05 0.1 0.15 0.2 0.25 0.3 0.35 0.4
Elongation (in)
Lo
ad
(k
ips
)
Field Specimen 1
Field Specimen 2
Field Specimen 3
Control 1
Control 2
Control 3
Field Ave Strength
Field Peak Disp.
Control Ave Strength
Control Peak Disp.
Figure 6.14: Iroquois Coastal – 7 Months Exterior Exposure – Test Results

Corrosion of Cold Formed Steel Fasteners University of Hawaii Final Report Steel Framing Alliance
117
Table 6-1: Average Peak Strength and Corresponding Elongation for Field Test Connections
Site Exposure Ave Peak Load
(kips)
Test/Control Ave Peak Disp.
(in)
Test/Control
Control - 2.927 - 0.197 -
MCBHCoastal
7 Months L7 2.880 0.98 0.126 0.64
MCBHCoastal
3 Months L7
4 Months L5
2.750 0.94 0.107 0.54
MCBHCoastal
7 Months L5 2.928 1.00 0.161 0.82
MCBHCoastal
7 Months L6 2.829 0.97 0.168 0.85
MCBH Inland 7 Months L5 3.087 1.05 0.175 0.89
IroquoisCoastal
7 Months L5 2.920 1.00 0.134 0.68
Average 0.99 0.74
Average Peak Strength - 7 Month exposure
0.00
0.10
0.20
0.30
0.40
0.50
0.60
0.70
0.80
0.90
1.00
1.10
Control MCBH Inland
Exterior
MCBH Coast
Open Crawl
Iroquois
Coast
Exterior
MCBH Coast
Exterior
MCBH Coast
Covered
Crawl
MCBH Coast
Ext 3M Open
Crawl 4M
Str
en
gth
Ra
tio
Figure 6.15: Average Strength Ratio for field specimens after 7 month exposure
The strength ratios in Table 6-1 are plotted in Figure 6.15, and show that there has been no change in the average failure strength of the lap connections recovered from the field after 7 months exposure. The average strength ratio is 0.99 for all 6 connection sets tested.

Corrosion of Cold Formed Steel Fasteners University of Hawaii Final Report Steel Framing Alliance
118
However, the displacement ratio shows a significant decrease in ductility for the MCBH Coastal specimens that were subjected to exterior exposure, and a modest decrease for the other connection sets (Figure 6.16). The average peak elongation of the field test specimens after 7 months exposure is 74% of that observed in the control connections. This reduction in average elongation is often the result of a single connection, which failed at a significantly lower deformation than the control specimens.
Average Displacement at Peak Load - 7 Months Exposure
0.00
0.10
0.20
0.30
0.40
0.50
0.60
0.70
0.80
0.90
1.00
Control MCBH Inland
Exterior
MCBH Coast
Covered
Crawl
MCBH Coast
Open Crawl
Iroquois
Coast Exterior
MCBH Coast
Exterior
MCBH Coast
Ext 3M Open
Crawl 4M
Dis
pla
ce
me
nt
Ra
tio
Figure 6.16: Average Displacement at Peak Load for field specimens exposed for 7 months.

Corrosion of Cold Formed Steel Fasteners University of Hawaii Final Report Steel Framing Alliance
119
6.3 CORROSION CHAMBER CONNECTION TEST RESULTS
Sets of three connection specimens were removed from the corrosion chamber at various stages and tested to failure. Figure 6.18 shows typical specimens after 1056 cycles. The test results for these sets of connections are shown in Figure 6.18 and Figure 6.19 along with the control specimen results. Figure 6.20 to Figure 6.34 show typical specimens and test results for all tests performed to date. The average peak strength and corresponding displacement are highlighted for comparison with the control specimens. These peak values are also listed in Table 6-2 along with the ratio between the test results and the control specimens. Figure 6.35 shows the strength ratio against the number of cycles in the corrosion chamber while Figure 6.36 shows the ratio between peak displacement and the number of cycles.
After 2772 cycles in the corrosion chamber, the galvanized screws showed significant surface corrosion (Figure 6.32). Nevertheless, the average connection strength had not decreased, regardless of whether the threads were oriented up or down in the corrosion chamber (Figure 6.35). However, the average specimen elongation at the peak load had decreased to around 80% of that for the control specimen (Figure 6.36). This decrease was larger for the connections stored with threads up. It appears that the connection ductility is affected by this level of corrosion, though the strength is not. Figure 6.37 to Figure 6.40 show microscopic images of the screw threads for control and 1537 cycle test specimens before and after testing. Although the surface corrosion appears significant, it has not yet penetrated the shaft of the screw, and hence has not affected the screw failure strength (Figure 6.40).
Figure 6.17: Test connections after 1056 cycles – Threads up (left) and down (right)

Corrosion of Cold Formed Steel Fasteners University of Hawaii Final Report Steel Framing Alliance
120
Connection Tests - 1056 cycles - Threads up
0
0.5
1
1.5
2
2.5
3
3.5
0 0.05 0.1 0.15 0.2 0.25 0.3 0.35 0.4
Elongation (in)
Lo
ad
(k
ips
)
Specimen 1
Specimen 2
Specimen 3
Control 1
Control 2
Control 3
Specimen Ave Strength
Control Ave Strength
Specimen Peak Disp.
Control Ave Peak Disp.
Figure 6.18: Connection tests after 1056 cycles in corrosion chamber with threads up.
Connection Tests - 1056 cycles - Threads down
0
0.5
1
1.5
2
2.5
3
3.5
0 0.05 0.1 0.15 0.2 0.25 0.3 0.35 0.4
Elongation (in)
Lo
ad
(k
ips
)
Specimen 1
Specimen 2
Specimen 3
Control 1
Control 2
Control 3
Specimen Ave Strength
Specimen Peak Disp.
Control Ave Strength
Control Ave Peak Disp.
Figure 6.19: Connection tests after 1056 cycles in corrosion chamber with threads down.

Corrosion of Cold Formed Steel Fasteners University of Hawaii Final Report Steel Framing Alliance
121
Figure 6.20: Test connections after 1309 cycles – Threads up (left) and down (right)
Connection Tests - 1309 cycles - Threads up
0
0.5
1
1.5
2
2.5
3
3.5
0 0.05 0.1 0.15 0.2 0.25 0.3 0.35 0.4
Elongation (in)
Lo
ad
(k
ips
)
Specimen 1
Specimen 2
Specimen 3
Control 1
Control 2
Control 3
Specimen Ave Strength
Specimen Peak Disp.
Control Ave Strength
Control Ave Peak Disp.
Figure 6.21: Connection tests after 1309 cycles in corrosion chamber with threads up.

Corrosion of Cold Formed Steel Fasteners University of Hawaii Final Report Steel Framing Alliance
122
Connection Tests - 1309 cycles - Threads up
0
0.5
1
1.5
2
2.5
3
3.5
0 0.05 0.1 0.15 0.2 0.25 0.3 0.35 0.4
Elongation (in)
Lo
ad
(k
ips
)Specimen 1
Specimen 2
Specimen 3
Control 1
Control 2
Control 3
Specimen Ave Strength
Specimen Peak Disp.
Control Ave Strength
Control Peak Disp.
Figure 6.22: Connection tests after 1309 cycles in corrosion chamber with threads down.
Figure 6.23: Test connections after 1537 cycles – Threads up (left) and down (right)

Corrosion of Cold Formed Steel Fasteners University of Hawaii Final Report Steel Framing Alliance
123
Connection Tests - 1537 cycles - Threads up
0
0.5
1
1.5
2
2.5
3
3.5
0 0.05 0.1 0.15 0.2 0.25 0.3 0.35 0.4
Elongation (in)
Lo
ad
(k
ips
)
Specimen 1
Specimen 2
Specimen 3
Control 1
Control 2
Control 3
Specimen Ave Strength
Specimen Peak Disp.
Control Ave Strength
Control Peak Disp.
Figure 6.24: Connection tests after 1537 cycles in corrosion chamber with threads up.
Connection Tests - 1537 cycles - Threads down
0
0.5
1
1.5
2
2.5
3
3.5
0 0.05 0.1 0.15 0.2 0.25 0.3 0.35 0.4
Elongation (in)
Lo
ad
(k
ips
)
Specimen 1
Specimen 2
Specimen 3
Control 1
Control 2
Control 3
Specimen Ave Strength
Specimen Peak Disp.
Control Ave Strength
Control Peak Disp.
Figure 6.25: Connection tests after 1537 cycles in corrosion chamber with threads down.

Corrosion of Cold Formed Steel Fasteners University of Hawaii Final Report Steel Framing Alliance
124
Figure 6.26: Test connections after 1695 cycles – Threads up (left) and down (right)
Connection Tests - 1695 cycles - Threads up
0
0.5
1
1.5
2
2.5
3
3.5
0 0.05 0.1 0.15 0.2 0.25 0.3 0.35 0.4
Elongation (in)
Lo
ad
(k
ips
)
Specimen 1
Specimen 2
Specimen 3
Control 1
Control 2
Control 3
Specimen Ave Strength
Specimen Peak Disp.
Control Ave Strength
Control Peak Disp.
Figure 6.27: Connection tests after 1695 cycles in corrosion chamber with threads up.

Corrosion of Cold Formed Steel Fasteners University of Hawaii Final Report Steel Framing Alliance
125
Connection Tests - 1695 cycles - Threads down
0
0.5
1
1.5
2
2.5
3
3.5
0 0.05 0.1 0.15 0.2 0.25 0.3 0.35 0.4
Elongation (in)
Lo
ad
(k
ips
)
Specimen 1
Specimen 2
Specimen 3
Control 1
Control 2
Control 3
Specimen Ave Strength
Specimen Peak Disp.
Control Ave Strength
Control Peak Disp.
Figure 6.28: Connection tests after 1695 cycles in corrosion chamber with threads down.
Figure 6.29: Test connections after 1979 cycles – Threads up (left) and down (right)

Corrosion of Cold Formed Steel Fasteners University of Hawaii Final Report Steel Framing Alliance
126
Connection Tests - 1979 cycles - Threads up
0
0.5
1
1.5
2
2.5
3
3.5
0 0.05 0.1 0.15 0.2 0.25 0.3 0.35 0.4
Elongation (in)
Lo
ad
(k
ips
)Specimen 1
Specimen 2
Specimen 3
Control 1
Control 2
Control 3
Specimen Ave Strength
Specimen Peak Disp.
Control Ave Strength
Control Peak Disp.
Figure 6.30: Connection tests after 1979 cycles in corrosion chamber with threads up.
Connection Tests - 1979 cycles - Threads down
0
0.5
1
1.5
2
2.5
3
3.5
0 0.05 0.1 0.15 0.2 0.25 0.3 0.35 0.4
Elongation (in)
Lo
ad
(k
ips
)
Specimen 1
Specimen 2
Specimen 3
Control 1
Control 2
Control 3
Specimen Ave Strength
Specimen Peak Disp.
Control Ave Strength
Control Peak Disp.
Figure 6.31: Connection tests after 1979 cycles in corrosion chamber with threads down.

Corrosion of Cold Formed Steel Fasteners University of Hawaii Final Report Steel Framing Alliance
127
Figure 6.32: Test connections after 2772 cycles – Threads up (left) and down (right)
Connection Tests - 2772 cycles - Threads up
0
0.5
1
1.5
2
2.5
3
3.5
0 0.05 0.1 0.15 0.2 0.25 0.3 0.35 0.4
Elongation (in)
Lo
ad
(k
ips
)
Specimen 1
Specimen 2
Specimen 3
Control 1
Control 2
Control 3
Specimen Ave Strength
Specimen Peak Disp.
Control Ave Strength
Control Peak Disp.
Figure 6.33: Connection tests after 2772 cycles in corrosion chamber with threads up.

Corrosion of Cold Formed Steel Fasteners University of Hawaii Final Report Steel Framing Alliance
128
Connection Tests - 2772 cycles - Threads down
0
0.5
1
1.5
2
2.5
3
3.5
0 0.05 0.1 0.15 0.2 0.25 0.3 0.35 0.4
Elongation (in)
Lo
ad
(k
ips
)Specimen 1
Specimen 2
Specimen 3
Control 1
Control 2
Control 3
Specimen Ave Strength
Specimen Peak Disp.
Control Ave Strength
Control Peak Disp.
Figure 6.34: Connection tests after 2772 cycles in corrosion chamber with threads down.
Table 6-2: Average Peak Strength and Corresponding Elongation for Test Connections
Cycles Orientation Ave Peak Load
(kips)
Test/Control Ave Peak Disp.
(in)
Test/Control
0 Control 2.927 - 0.197 -
Threads up 2.874 0.98 0.135 20.25 1056
Threads down 2.967 1.01 0.176 21.08
Threads up 2.817 0.96 0.12 19.78 1309
Threads down 2.826 0.97 0.149 20.03
Threads up 3.013 1.03 0.182 21.45 1537
Threads down 2.992 1.02 0.191 21.34
Threads up 2.933 1.00 0.172 20.84 1695
Threads down 2.964 1.01 0.175 21.06
Threads up 3.030 1.04 0.181 21.58 1979
Threads down 2.963 1.01 0.183 21.10
Threads up 3.005 1.03 0.156 21.27 2772
Threads down 2.953 1.01 0.172 20.99
Average 1.01 20.9

Corrosion of Cold Formed Steel Fasteners University of Hawaii Final Report Steel Framing Alliance
129
0.00
0.20
0.40
0.60
0.80
1.00
1.20
0 500 1000 1500 2000 2500 3000
Number of cycles
Str
en
gth
Ra
tio
Threads up
Treads down
Figure 6.35: Strength Ratio versus Number of Cycles in corrosion chamber
0.00
0.20
0.40
0.60
0.80
1.00
1.20
0 500 1000 1500 2000 2500 3000
Number of cycles
Pe
ak
Dis
pla
ce
me
nt
Ra
tio
Threads up
Threads down
Figure 6.36: Peak Displacement versus Number of Cycles in corrosion chamber

Corrosion of Cold Formed Steel Fasteners University of Hawaii Final Report Steel Framing Alliance
130
Figure 6.37: Original screw threads.
Figure 6.38: Screw threads after 1537 cycles in the corrosion chamber.

Corrosion of Cold Formed Steel Fasteners University of Hawaii Final Report Steel Framing Alliance
131
Figure 6.39: Close-up of screw threads after control specimen failure.
Figure 6.40: Close-up of screw threads after failure of 1537 cycle specimen.

Corrosion of Cold Formed Steel Fasteners University of Hawaii Final Report Steel Framing Alliance
132

Corrosion of Cold Formed Steel Fasteners University of Hawaii Final Report Steel Framing Alliance
133
7 FIELD ENCLOSURE OBSERVATIONS
7.1 INTRODUCTION
Since construction of the field enclosures, the framing and fasteners have been inspected at regular intervals to monitor the initiation and progression of corrosion in the various exposure conditions at each enclosure. Table 7-1, Table 7-2 and Table 7-3 show the inspection timelines for each of the field enclosures. Inspections have been performed at least once every 6 months, with more frequent visits when necessary. The 6 month inspections will continue for as long as the field enclosures are permitted to remain at each site.
During each inspection, numerous photographs were taken of the CFS framing and fasteners in the various exposure conditions in each enclosure. During some of the inspections, only the exposed framing was observed. During other inspections, the interior drywall, ceiling and crawl space soffit plywood were removed to allow observation of the concealed framing elements and connections. A complete chronological record of these inspection photographs is included in Appendices A through E for the five field enclosures as follows:
Appendix A: Wheeler AAF Enclosure Appendix B: Iroquois Inland Enclosure Appendix C: Iroquois Coastal Enclosure Appendix D: MCBH Inland Enclosure Appendix E: MCBH Coastal Enclosure
This section provides a condensed version of the photographic record in Appendices A through E, along with a description of the visual inspection observations. The field enclosures at Wheeler Army Airfield and both Iroquois Inland and Coastal have performed almost identically for the 20 months of exposure covered by this report. Therefore, only images from the Iroquois Coastal enclosure are presented in Section 7.2. Section 7.3 presents images from the MCBH Inland site while Section 7.4 presents images from the MCBH Coastal site.
In the description of the extent of corrosion observed on the CFS framing members and fasteners, the following terminology is used:
“Mint” or “like new” refers to framing and fasteners that show no deterioration since construction.
“Tarnished” refers to the loss of luster, or graying of the zinc coating due to zinc corrosion products on the surface. This does not represent a detrimental condition since the zinc layer is still in place to provide protection for the underlying steel.
“Fully tarnished” means a complete absence of the original luster on the zinc galvanizing.
“Ferrous Oxide” refers to the presence of red rust on exposed steel, either at cut ends or where the galvanizing has corroded to the point of exposing the steel.
“Severe” refers to complete corrosion of the zinc coating and formation of significant flaking red rust on the steel section.

Corrosion of Cold Formed Steel Fasteners University of Hawaii Final Report Steel Framing Alliance
134
Table 7-1: Inspection Timeline for MCBH Coastal and Inland Enclosures
Event Date
Enclosure assembled on site Nov. 2001
5 Month crawl space inspection April 2, 2002
10 Month crawl space inspection Sept. 2002
16 Month full structural inspection March 6, 2003
21 Month full structural inspection (Connection test specimens installed) Aug. 11, 2003
Steel and zinc coupons installed Sept. 23, 2003
1.5 Month connection exposure (22.5 Month inspection) Sept. 23, 2003
3 Month connection relocation (24 Month inspection) Nov. 11, 2003
7 Month connection relocation (28 Month inspection) March 11, 2004
Steel and zinc coupons and test connections tested March 22, 2004
Table 7-2: Inspection Timeline for Iroquois Coastal and Inland Enclosures
Event Date
Enclosure assembled at Hunt Building site in Pearl City July 2002
Enclosure installed at site March 2003
13 Month full structural inspection (Connection test specimens installed) Aug. 13, 2003
Steel and zinc coupons installed Dec. 11, 2003
7 Month connection relocation (20 Month inspection) March 18, 2004
Steel and zinc coupons and test connections tested March 22, 2004
Table 7-3: Inspection Timeline for Wheeler Enclosure
Event Date
Enclosure assembled at Hunt Building site in Pearl City July 2002
Enclosure installed at site May 2003
13 Month full structural inspection (Connection test specimens installed) Aug. 18, 2003
Steel and zinc coupons installed Dec. 11, 2003
7 Month connection relocation (20 Month inspection) March 18, 2004
Steel and zinc coupons and test connections tested March 22, 2004

Corrosion of Cold Formed Steel Fasteners University of Hawaii Final Report Steel Framing Alliance
135
7.2 WHEELER AND IROQUOIS ENCLOSURE OBSERVATIONS
Because of the similarity in performance of the CFS framing and fasteners at these three sites, most of the images presented here are from the Iroquois Coastal site. Since only minor corrosion has been detected in the first 20 months at these sites, images are only shown at the end of the 20 month inspection.
7.2.1 Wall Framing
As seen in Figure 7.1, there were no signs of corrosion on the CFS framing or fasteners in the enclosed wall framing for these three sites.
Figure 7.1: Interior wall framing and fasteners at Iroquois Coastal site after 20 months exposure
7.2.2 Vented Attic
Initiation of corrosion was evident at the cut edges of the CFS framing and on some of the fasteners in the vented attics of the two Iroquois sites as shown in Figure 7.2. The fasteners in the vented attic at the Wheeler site showed no corrosion as seen in Figure 7.3.
Figure 7.2: Attic framing at Iroquois Coastal site after 20 months exposure.

Corrosion of Cold Formed Steel Fasteners University of Hawaii Final Report Steel Framing Alliance
136
Figure 7.3: Attic framing at Wheeler site after 20 months exposure.
7.2.3 Crawl Space
Almost no signs of corrosion were noted in the crawl space framing of these three sites after 20 months of exposure. Initiation of corrosion was evident on a few of the fasteners with full exposure to the elements as shown in the post base connection in Figure 7.4. The floor joists showed no evidence of corrosion whether exposed (Figure 7.5) or covered with plywood sheathing.
Figure 7.4: Crawl space post and cripple wall framing at Iroquois Coastal after 20 months.
Figure 7.5: Exposed floor joists at Iroquois Coastal after 20 months exposure.
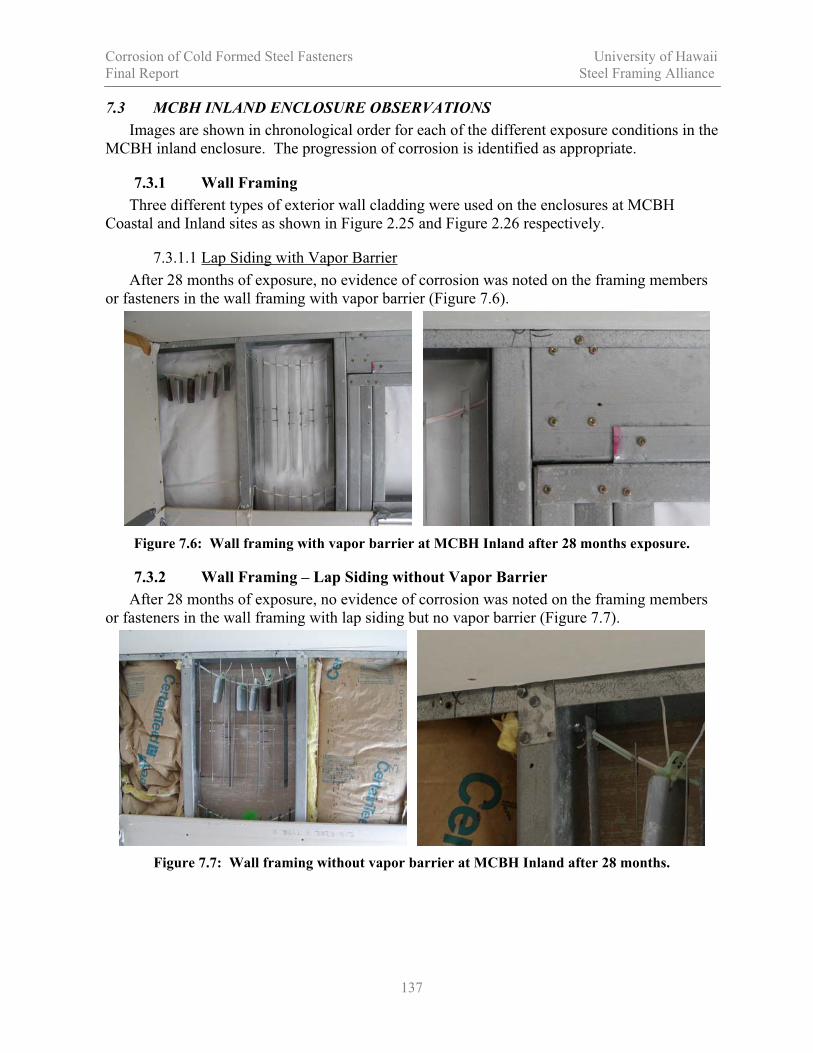
Corrosion of Cold Formed Steel Fasteners University of Hawaii Final Report Steel Framing Alliance
137
7.3 MCBH INLAND ENCLOSURE OBSERVATIONS
Images are shown in chronological order for each of the different exposure conditions in the MCBH inland enclosure. The progression of corrosion is identified as appropriate.
7.3.1 Wall Framing
Three different types of exterior wall cladding were used on the enclosures at MCBH Coastal and Inland sites as shown in Figure 2.25 and Figure 2.26 respectively.
7.3.1.1 Lap Siding with Vapor Barrier
After 28 months of exposure, no evidence of corrosion was noted on the framing members or fasteners in the wall framing with vapor barrier (Figure 7.6).
Figure 7.6: Wall framing with vapor barrier at MCBH Inland after 28 months exposure.
7.3.2 Wall Framing – Lap Siding without Vapor Barrier
After 28 months of exposure, no evidence of corrosion was noted on the framing members or fasteners in the wall framing with lap siding but no vapor barrier (Figure 7.7).
Figure 7.7: Wall framing without vapor barrier at MCBH Inland after 28 months.

Corrosion of Cold Formed Steel Fasteners University of Hawaii Final Report Steel Framing Alliance
138
7.3.3 Wall Framing – Plywood Sheathing without Vapor Barrier
After 28 months of exposure, no evidence of corrosion was noted on the framing members or fasteners in the wall framing with plywood sheathing and no vapor barrier (Figure 7.8).
Figure 7.8: Wall framing with plywood sheathing at MCBH Inland after 28 months.
7.3.4 Vented Attic
Portions of the CFS framing in the vented attic showed signs of tarnishing due to zinc coating corrosion, but all fasteners were free of ferrous oxide (Figure 7.9).
Figure 7.9: Vented attic framing at MCBH Inland after 28 months exposure.
7.3.5 Crawl Space
Figure 7.10, Figure 7.11 and Figure 7.12 show a progression of the corrosion on the cripple wall and post supports in the crawl space of the MCBH Inland enclosure. After 5 months there were signs of tarnishing of the zinc galvanizing, but no evidence of ferrous oxide on the fastener heads or threads. By 16 months, the galvanizing was fully tarnished and ferrous oxide was evident on some of the fastener heads and threads. By 28 months, there was more significant corrosion on the same fasteners and initiation of corrosion at other fasteners elsewhere in the crawl space support framing.
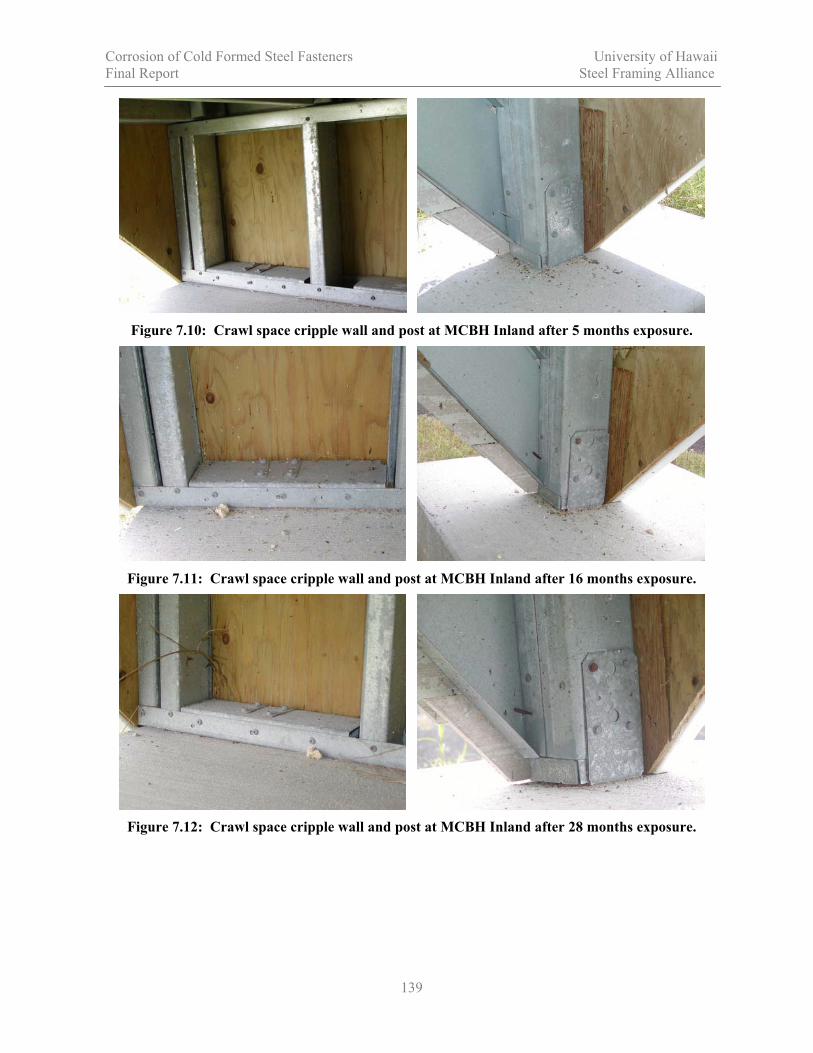
Corrosion of Cold Formed Steel Fasteners University of Hawaii Final Report Steel Framing Alliance
139
Figure 7.10: Crawl space cripple wall and post at MCBH Inland after 5 months exposure.
Figure 7.11: Crawl space cripple wall and post at MCBH Inland after 16 months exposure.
Figure 7.12: Crawl space cripple wall and post at MCBH Inland after 28 months exposure.

Corrosion of Cold Formed Steel Fasteners University of Hawaii Final Report Steel Framing Alliance
140
Figure 7.13 and Figure 7.14 show the exposed floor joist framing in the crawl space of the MCBH Inland enclosure. After 16 months, there was some tarnishing of the joists, but no evidence of ferrous oxide on the fasteners. By 28 months, the joists were fully tarnished and minor ferrous oxide was noted on some of the fastener threads. For the floor joists enclosed by plywood sheathing, there were no signs of corrosion after 28 months of exposure (Figure 7.15).
Figure 7.13: Crawl space floor joists at MCBH Inland after 16 months exposure.
Figure 7.14: Crawl space floor joists at MCBH Inland after 28 months exposure.
Figure 7.15: Floor joist with plywood sheathing after 28 months exposure.

Corrosion of Cold Formed Steel Fasteners University of Hawaii Final Report Steel Framing Alliance
141
7.4 MCBH COASTAL ENCLOSURE OBSERVATIONS
Images are shown in chronological order for each of the different exposure conditions in the MCBH coastal enclosure. The progression of corrosion is identified as appropriate.
7.4.1 Wall Framing
Three different types of wall cladding were used in the MCBH Coastal and Inland enclosures as shown in Figure 2.25 and Figure 2.26 respectively.
7.4.1.1 Lap Siding with Vapor Barrier
After 16 months of exposure, there was evidence of corrosion of both the CFS members and framing fasteners at the top plate of the wall with vapor barrier (Figure 7.16). This corrosion appeared limited to the top plate and top section of the studs. There was considerably less corrosion further down the stud. This conditioned worsened after 21 months (Figure 7.17) and 28 months (Figure 7.18), by which time most of the framing fasteners in the top plate connections showed signs of ferrous oxide. There was still very little sign of corrosion on the studs at mid-height of the wall. It appeared that humid, chloride rich air was passing from the vented attic to the top plate connections, resulting in the localized corrosion. No seal had been provided between the top plate and the attic space. For the first 16 months, the interior drywall had also not been taped, so humidity could also have entered the wall cavity through the drywall joints. It was noted that the ETF pins used to secure the Hardie Board had less ferrous oxide corrosion than the framing screws (Figure 7.16).
Figure 7.16: Wall framing with lap siding and vapor barrier, MCBH Coastal after 16 months.

Corrosion of Cold Formed Steel Fasteners University of Hawaii Final Report Steel Framing Alliance
142
Figure 7.17: Wall framing with lap siding and vapor barrier, MCBH Coastal after 21 months.
Figure 7.18: Wall framing with lap siding and vapor barrier, MCBH Coastal after 28 months.
7.4.2 Wall Framing – Lap Siding without Vapor Barrier
After 16 months of exposure, there was evidence of ferrous oxide on the cut ends of CFS sections and on both heads and threads of the framing fasteners in the wall with lap siding but without a vapor barrier (Figure 7.19). This corrosion was particularly severe at the top plate and top section of the studs, but was evident throughout the height of the studs. This conditioned worsened after 21 months (Figure 7.20) and 28 months (Figure 7.21). In addition to any exterior air entering through the vented attic to the top of the wall, there was now easy access for exterior air through the lap siding itself (Figure 7.19). The corrosion in this wall was considerably worse than that in either the lap siding wall with vapor barrier or the plywood sheathed wall without vapor barrier.

Corrosion of Cold Formed Steel Fasteners University of Hawaii Final Report Steel Framing Alliance
143
Figure 7.19: Wall framing with lap siding without vapor barrier, MCBH Coastal after 16 months.
Figure 7.20: Wall framing with lap siding without vapor barrier, MCBH Coastal after 21 months.
Figure 7.21: Wall framing with lap siding without vapor barrier, MCBH Coastal after 28 months.
7.4.3 Wall Framing – Plywood Sheathing without Vapor Barrier
After 16 months of exposure, there was some evidence of ferrous oxide on the cut ends of CFS sections and on the heads and threads of the framing fasteners at the top of the wall with plywood siding but without a vapor barrier (Figure 7.22). There were many framing fasteners, and virtually all ETF pin fasteners, that showed no signs of corrosion. There were also many

Corrosion of Cold Formed Steel Fasteners University of Hawaii Final Report Steel Framing Alliance
144
areas of the CFS that were untarnished. There was some progression of the corrosion after 21 months (Figure 7.23) and 28 months (Figure 7.24), including on the ETF pin fasteners used to secure the plywood sheathing, particularly at the top of the wall. In general the observed condition was similar to or better than the wall with lap siding and vapor barrier.
Figure 7.22: Wall framing with plywood sheathing, MCBH Coastal after 16 months.
Figure 7.23: Wall framing with plywood sheathing, MCBH Coastal after 21 months.
Figure 7.24: Wall framing with plywood sheathing, MCBH Coastal after 28 months.

Corrosion of Cold Formed Steel Fasteners University of Hawaii Final Report Steel Framing Alliance
145
7.4.4 Vented Attic
After 16 months there was already significant ferrous oxide on virtually all of the fasteners in the vented attic (Figure 7.25). This conditioned worsened at 21 months (Figure 7.26) and 28 months (Figure 7.27), by which time there was also significant ferrous oxide at cut ends of the CFS framing members (Figure 7.27).
Figure 7.25: Vented attic framing at MCBH Coastal after 16 months.
Figure 7.26: Vented attic framing at MCBH Coastal after 21 months.
Figure 7.27: Vented attic framing at MCBH Coastal after 28 months.

Corrosion of Cold Formed Steel Fasteners University of Hawaii Final Report Steel Framing Alliance
146
7.4.5 Crawl Space
Figure 7.28, Figure 7.29, Figure 7.30 and Figure 7.31 show a progression of the corrosion on the cripple wall and post supports in the crawl space of the MCBH Coastal enclosure. After 5 months there were signs of tarnishing of the zinc galvanizing, and ferrous oxide on some of the fastener heads or threads, and cut ends of the CFS members (Figure 7.28). By 16 months, the zinc coating on portions of the CFS framing had corroded completely and ferrous oxide was forming on end regions of the CFS members and galvanized anchor hardware. There was also significant ferrous oxide on the exposed fastener heads (Figure 7.29). At the 21 month inspection it was clear that this corrosion had progressed rapidly (Figure 7.30) and after 28 months there was clear indication that the corrosion had compromised the integrity of the CFS studs, post and post base hardware (Figure 7.31). The corrosion appeared to concentrate in regions exposed directly to through flow of chloride laden air from the nearby coastline.
Figure 7.28: Crawl space cripple wall and post, MCBH Coastal after 5 months.
Figure 7.29: Crawl space cripple wall and post, MCBH Coastal after 16 months.

Corrosion of Cold Formed Steel Fasteners University of Hawaii Final Report Steel Framing Alliance
147
Figure 7.30: Crawl space cripple wall and post, MCBH Coastal after 21 months.
Figure 7.31: Crawl space cripple wall and post, MCBH Coastal after 28 months.
Figure 7.32 through Figure 7.38 show the exposed floor joist framing in the crawl space of the MCBH Coastal enclosure. After 5 months, the surface of the joists was tarnished and there was evidence of ferrous oxide on cut edges and some of the exposed fasteners (Figure 7.32). After 10 months exposure, this corrosion had progressed significantly with considerable ferrous oxide at the joist bottom flange and at cut ends and punchouts. There were also signs of ferrous oxide on most of the exposed fasteners (Figure 7.33).
Figure 7.32: Crawl space exposed floor joists, MCBH Coastal after 5 months.

Corrosion of Cold Formed Steel Fasteners University of Hawaii Final Report Steel Framing Alliance
148
Figure 7.33: Crawl space exposed floor joists, MCBH Coastal after 10 months.
After 16 months, large sections of the exposed floor joists were almost entirely devoid of galvanizing with ferrous oxide extending the full height of the web (Figure 7.34). Ferrous oxide was evident on all of the exposed fasteners in the joist end connections and between the plywood flooring and the joist top flange. However, the joists covered by plywood sheathing showed no signs of corrosion (Figure 7.35). Fasteners in this enclosed floor framing also exhibited no signs of corrosion.
Figure 7.34: Crawl space exposed floor joists, MCBH Coastal after 16 months.

Corrosion of Cold Formed Steel Fasteners University of Hawaii Final Report Steel Framing Alliance
149
Figure 7.35: Crawl space covered floor joists, MCBH Coastal after 16 months.
After 21 months, corrosion of the exposed floor joists had progressed to the point where it would be described as severe (Figure 7.36). Large areas of the zinc galvanizing have corroded completely, allowing significant corrosion of the underling steel sheet. Exposed fasteners in the joist end connections and between the plywood flooring and the joist top flange also showed significant corrosion. However, the joists covered by plywood sheathing were still in the original “like new” condition (Figure 7.37). The only signs of corrosion on these enclosed floor joists were at the end connections where there was corrosion on the member cut ends and the connection fasteners. This corrosion was attributed to leaking of exterior air between the end of the plywood sheathing and the cripple wall top plate (Figure 7.37). This edge of the plywood sheathing simply butted against the edge of the top plate, and had not been sealed.
Figure 7.36: Crawl space exposed floor joists, MCBH Coastal after 21 months.

Corrosion of Cold Formed Steel Fasteners University of Hawaii Final Report Steel Framing Alliance
150
Figure 7.37: Crawl space covered floor joists, MCBH Coastal after 21 months.
After 28 months, corrosion of the exposed floor joists had extended over virtually the entire length and depth of each joist (Figure 7.38). Connection fasteners had significant ferrous oxide on exposed heads and threads.
Figure 7.38: Crawl space exposed floor joists, MCBH Coastal after 28 months.

Corrosion of Cold Formed Steel Fasteners University of Hawaii Final Report Steel Framing Alliance
151
7.5 SUMMARY OF FIELD ENCLOSURE OBSERVATIONS
After 20 months field exposure, the enclosure at Wheeler Army Airfield and the inland enclosure at Iroquois Point showed only minor signs of corrosion of framing fasteners in the fully exposed crawl space posts. No corrosion was noted in the exposed floor joists, vented attic or enclosed wall framing. After the same exposure, the coastal enclosure at Iroquois Point exhibited similar behavior, with the addition of the initiation of corrosion of fasteners and cut ends of CFS framing in the vented attic.
In contrast, fully exposed CFS members and fasteners in the crawl space of the coastal enclosure at MCBH showed initiation of corrosion after as little as 5 months exposure. This corrosion proceeded rapidly so that by 28 months, the exposed floor joists and supporting posts and cripple wall have experienced severe corrosion. Areas of the floor joists that were enclosed by plywood sheathing show very little signs of corrosion except where exterior air has leaked into the enclosed space through unsealed edge joints.
After 28 months, fasteners in the vented attic at the MCBH coastal enclosure experienced significant corrosion. The CFS roof framing members were tarnished with some cut end corrosion. Similar corrosion was noted in the wall with lap siding and no vapor barrier, while the walls with lap siding and vapor barrier, or plywood sheathing, only showed signs of corrosion at the top plate that was exposed to air in the vented attic. It was noted that the ETF pins used to secure the Hardie Board and plywood sheathing had less ferrous oxide corrosion than the framing screws for the same exposure conditions.
The MCBH inland enclosure exhibited corrosion levels significantly less than the coastal site, but more severe than any of the Iroquois or Wheeler sites. The additional distance from the coastline, and the intervening vegetation appear to have provided significant protection for this enclosure.

Corrosion of Cold Formed Steel Fasteners University of Hawaii Final Report Steel Framing Alliance
152

Corrosion of Cold Formed Steel Fasteners University of Hawaii Final Report Steel Framing Alliance
153
8 SUMMARY AND CONCLUSIONS
8.1 SUMMARY
This research program investigated the potential for corrosion of galvanized fasteners used in cold-formed steel framing by exposing test samples to a variety of environmental conditions frequently found in Hawaii and elsewhere. The results of this research will aid in the evaluation of galvanized fasteners in various exposure conditions.
This report details the design, construction and first two years of exposure of five field enclosures constructed on the island of Oahu. The enclosures each represent typical residential cold-formed steel construction and are equipped with weather stations to track climatic conditions at each enclosure site. The field sites selected for this study represent coastal and near-coastal conditions on windward and leeward shores of Oahu, and one interior site remote from the coast.
The cold-formed steel framing and fasteners in each enclosure were inspected visually at regular intervals for a two-year period after construction. The results of these inspections are discussed in detail and numerous photographic images included in the Appendices to this report.
Standard cold-formed steel connections with galvanized screws were placed in various locations within each of the field enclosures as a controlled study of the performance of galvanized fasteners in typical CFS framing construction. The selection of the screwed connection details are outlined along with test results after 7 months exposure in the field enclosures.
Standard screwed test connections were also subjected to a cyclic salt spray routine in a corrosion chamber to induce accelerated corrosion. The effect of this cyclic routine on the strength and ductility of the connections are reported after 2700 cycles in the corrosion chamber.
8.2 CONCLUSIONS
The following conclusions are based on 28 months of visual inspection of the cold-formed steel framing and fasteners at five field enclosure sites on the island of Oahu.
The predominant factors affecting the rate of corrosion are the level of chlorides in the atmosphere, the wind speed and direction, and the degree of exposure for the cold-formed steel framing and galvanized fasteners.
Framing and fasteners within enclosed wall and floor sections are protected from corrosive environments. Precautions must however be taken to prevent ingress of air-borne salts into these sections.
In coastal environments with on-shore winds carrying significant salt spray, exposed cold-formed steel framing and fasteners in crawl spaces, vented attics or exterior exposure may corrode very rapidly.
Vegetation or other obstructions between the coastline and the enclosure site can significantly reduce the salt content of the air, leading to less corrosion.
Coastal environments with predominantly offshore winds experience significantly lower levels of corrosion on framing and fasteners in crawl spaces, vented attics or exterior exposure.

Corrosion of Cold Formed Steel Fasteners University of Hawaii Final Report Steel Framing Alliance
154
The following conclusions are based on tests of screwed lap splice connections exposed to 45 minute cycles of 0.1M NaCl salt spray (0.08% salt solution) and heated drying in an accelerated corrosion chamber.
After 2772 cycles, the average failure strength of the screwed connections was the same as the original control specimens.
After 2772 cycles, the average elongation at peak load had reduced to 80% of that experience in the control specimens.

Corrosion of Cold Formed Steel Fasteners University of Hawaii Final Report Steel Framing Alliance
155
9 RECOMMENDATIONS
A number of industry guidelines provide recommendations regarding corrosion protection of cold-formed steel framing (AISI 2004; ASTM A1003; LGSEA 2002). The recommendations provided here generally agree with these prior publications, but provide more specific guidelines for construction in coastal exposure, and the corrosion of fasteners used in CFS construction.
The following recommendations are based on the results observed in this study and detailed in this report.
Guidelines for protection of CFS framing and fasteners from atmospheric corrosion induced by air-borne chlorides are presented below for the following three exposure categories:
Category A: Extreme exposure. Category B: Moderate exposure. Category C: Mild exposure.
Each building location should be assigned to one of these exposure categories based on geographical location, surrounding features and meteorological records. Table 9-1 gives preliminary suggestions for this assignment:
Table 9-1: Exposure category assignment
Site Characteristics
Onshore Wind Offshore Wind
Distance from Shoreline
(m)Unshielded Shielded Unshielded Shielded
200L A A A B
500200 L A B B B
1000500 L B B C C
1000L C C C C
Distance from shoreline is the straight line distance measured perpendicular to the coast. Onshore and offshore wind refers to the predominant wind direction for the building
location. If winds are variable or unknown, onshore wind should be assumed. Shielded refers to the presence of vegetation and/or structures, at least as tall as the
proposed building, located between the coast and the proposed site. Sites that do not satisfy these conditions are considered to be Unshielded. Shielded conditions are afforded by medium to dense vegetation covering at least 25 meters of the straight line distance from the coast. Shielded conditions are also afforded by two or more rows of housing between the proposed site and the coast. A single barrier, such as a wall, fence, or hedge, should not be considered to provide shielded conditions. A small hill or rise with no vegetation should not be considered to provide shielded conditions.

Corrosion of Cold Formed Steel Fasteners University of Hawaii Final Report Steel Framing Alliance
156
Category A Design Recommendations: The following recommendations are made for CFS framing in category A exposure
conditions:
o No CFS members or fasteners should be exposed to ambient atmospheric conditions. This includes both sheltered and non-sheltered exposure.
o Exposure to atmospheric conditions during construction should be limited. If such exposure is expected to exceed 2 months, protective measures should be taken to prevent chloride accumulation on the CFS members.
o No CFS framing should be exposed in sheltered locations such as crawl spaces or the interior of garages, carports and other unfinished spaces. Plywood sheathing or gypsum board, with sealed joints, is effective for protection of CFS in these locations. The fastener heads on this sheathing remain exposed, but are not structural, and can be augmented in the future as necessary.
o Attic spaces require particular attention because of the need for venting to prevent moisture accumulation and potential mold development. However, venting in exposure category A conditions permits the ingress of air-borne chlorides. Two options are proposed for these conditions:
the attic space can be designed as a sealed environment with insulation placed directly under the roof sheathing (a.k.a. cathedral ceiling), and the area underneath designed as a conditioned space.attic venting, particularly on the coastal elevation, can be kept to the minimum permitted by the applicable building code, while extra protection can be provided for the framing members and fasteners in the attic space through increased galvanizing thickness and/or the addition of zinc rich coatings after fabrication.
Neither of these options was evaluated in this study. o Attic framing should be inspected regularly for signs of corrosion. These
inspections should be performed at least once every 2 years. The building occupants may choose to perform the inspection themselves, or hire an experienced contractor. Tarnishing of the galvanized framing members and minor ferrous oxide at cut ends and on screw threads is not of immediate concern. However, any spread of ferrous oxide from the cut ends or punch-outs, and signs of significant ferrous oxide on a majority of fasteners would indicate the need for additional protective measures.
o Protection for CFS framing and fasteners in exterior walls can be achieved by providing an enclosed wall cavity. The exterior of the wall should consist of plywood sheathing, or siding with vapor barrier. All openings, window and door framing, service penetrations, etc. must be sealed so as to prevent airflow into the wall cavity. The interior drywall joints should be taped and all openings sealed.The top of the wall must be sealed from any vented attic space above. Even a small amount of air circulation in an enclosed wall cavity will lead to corrosion in exposure category A.

Corrosion of Cold Formed Steel Fasteners University of Hawaii Final Report Steel Framing Alliance
157
o Protection of CFS framing and fasteners in interior walls and floor systems can be provided by gypsum board coverings on both sides of the wall cavity, and as a ceiling below elevated floor framing. The drywall joints should be taped and all openings sealed. The top of the wall should be sealed from any vented attic space above.
o Consideration should be given to increasing the thickness of galvanizing on CFS framing members, connection hardware and fasteners throughout buildings in exposure category A. This increased zinc coating will provide additional protection in case of unintended exposure to air borne chlorides.
Category B Design Recommendations: The following recommendations are made for CFS framing in category B exposure
conditions:
o No CFS members or fasteners should be permanently exposed to ambient atmospheric conditions. This includes both sheltered and non-sheltered exposure.
o Exposure to atmospheric conditions during construction should be limited. If such exposure is expected to exceed 4 months, protective measures should be taken to prevent chloride accumulation on the CFS members.
o No CFS framing should be permanently exposed in sheltered locations such as crawl spaces or the interior of garages, carports and other unfinished spaces.Plywood sheathing or gypsum board, with sealed joints, is effective for protection of CFS in these locations.
o Attics can be vented, but framing members and fasteners in the attic space should be provided with additional protection through the use of increased zinc coating thickness or the addition of zinc rich coatings after fabrication.
o Attic framing should be inspected regularly for signs of corrosion. These inspections should be performed at least once every 5 years.
o Protection for CFS framing and fasteners in exterior walls can be achieved by providing an enclosed wall cavity. The exterior of the wall should consist of plywood sheathing, or siding with vapor barrier, while drywall with taped joints is adequate for the interior face. The top of the wall should be sealed from any vented attic space above.
o Protection of CFS framing and fasteners in interior walls and floor systems is provided effectively by gypsum board coverings on both sides of the wall cavity, and as a ceiling below elevated floor framing. The top of the wall should be sealed from any vented attic space above.
Category C Design Recommendations: Category C exposure is synonymous with normal inland exposure. The following
recommendations are made for CFS framing in category C exposure conditions:
o Standard industry construction practices should be followed.
o Permanent exposure of CFS members or fasteners to ambient atmospheric conditions should be avoided.

Corrosion of Cold Formed Steel Fasteners University of Hawaii Final Report Steel Framing Alliance
158
o Exposure to atmospheric conditions during construction should be limited to 6 months.
o Attic and crawl space framing should be inspected regularly for signs of corrosion. These inspections should be performed at least once every 5 years.

Corrosion of Cold Formed Steel Fasteners University of Hawaii Final Report Steel Framing Alliance
159
REFERENCES
AISI, 2004. “Standard for Cold-Formed Steel Framing – General Provisions, 2004 Edition” American Iron and Steel Institute, Washington, D.C., 2004.
ASTM A1003/A1003M-02a. “Standard Specification for Steel Sheet, Carbon, Metallic- and Nonmetallic-Coated for Cold-Formed Framing Members” American Society for Testing and Materials, West Conshohocken, PA, 2000.
ASTM B117, 1998. "Standard Practice for Operating Salt Spray (Fog) Apparatus" American Society for Testing and Materials.
ASTM G85, 1995. “Standard Practice for Modified Salt Spray (Fog) Testing” American Society for Testing and Materials.
Campbell Scientific, 2001. “CR10X Measurement and Control Module Operator’s Manual,” Campbell Scientific, Inc.
Cremer, N.D., 1989 “Prohesion Compared to Salt Spray and Outdoors – Cyclic Methods of Accelerated Corrosion Testing”, Paper, C.&W. Specialist Equipment Ltd., Shropshire, England.
FEMA, 1996. “Corrosion Protection for Metal Connectors in Coastal Areas.” Technical Bulletin 8-96, FIA-TB-8, Federal Emergency Management Agency /Mitigation Directorate, Washington, DC, pp. 12.
ISO 9225:1992 (E). “Corrosion of metals and alloys - Corrosivity of atmospheres - Measurement of pollution,” International Organization for Standardization.
LGSEA, 2002. “Corrosion Protection for Cold-Formed Steel Framing in Coastal Areas” Technical Note 140, Light Gauge Steel Engineers Association, Washington, D.C.
Neville, E., and Robertson, I. N., 2003. “Corrosion monitoring program”, Research Report UHM/CEE/03-05, University of Hawaii, pp. 74.
QFOG, 2000. “Cyclic Corrosion Tester – Operating Manual” Q-Panel Lab Products.
Romanchik, D., May 2000 “Engineers Say Salt Spray Test is Bogus”, Article, Automotive Test Report.
SAE J2334, 2002. “Cosmetic Corrosion Lab Test” Society of Automotive Engineers.
Zhang, X. G., 1997. “Corrosion and Electrochemistry of Zinc”, Book, Plenum Publication Co., New York.
Repp, J., 2002. “Update on the Development of SAE J2334 Accelerated Corrosion Test Protocol”, Powerpoint Presentation, Corrpro Companies Inc., www.armycorrosion.com/past_summits/summit2002/02presentations/Day_2_Afternoon/Landy_session/John_Repp.pdf

1201 15th Street, NW
Suite 320
Washington, DC 20005
www.steelframing.org
American Iron and Steel Institute
1140 Connecticut Avenue, NW
Suite 705
Washington, DC 20036
www.steel.org
Re
se
arc
h R
ep
ort
RP
-04
-4