RESEARCH REPORT Measuring the Effectiveness of Services to ...
109
RESEARCH REPORT Measuring the Effectiveness of Services to Employers Options for Performance Measures under the Workforce Innovation and Opportunity Act Shayne Spaulding Burt Barnow Amanda Briggs John Trutko URBAN INSTITUTE GEORGE WASHINGTON URBAN INSTITUTE CAPITAL RESEARCH UNIVERSITY CORPORATION Alex Trutko Ian Hecker CAPITAL RESEARCH URBAN INSTITUTE CORPORATION January 2021 INCOME AND BENEFITS POLICY CENTER
Transcript of RESEARCH REPORT Measuring the Effectiveness of Services to ...
RESEARCH REPORT
Measuring the Effectiveness of Services to Employers Options for Performance Measures under the Workforce Innovation and Opportunity Act
Shayne Spaulding Burt Barnow Amanda Briggs John Trutko URBAN INSTITUTE GEORGE WASHINGTON URBAN INSTITUTE CAPITAL RESEARCH UNIVERSITY CORPORATION
Alex Trutko Ian Hecker CAPITAL RESEARCH URBAN INSTITUTE CORPORATION
January 2021
I N C O M E A N D B E N E F I T S P O L I C Y C E N T E R

DISCLAIMER
This report was prepared for the US Department of Labor, Chief Evaluation Office and Employment
and Training Administration, by the Urban Institute, under contract number DOLQ129633251. The
views expressed are those of the authors and should not be attributed to the US Department of Labor,
nor does mention of trade names, commercial products, or organizations imply endorsement of same
by the US government.
ABOUT THE URBAN INSTITUTE
The nonprofit Urban Institute is a leading research organization dedicated to developing evidence-
based insights that improve people’s lives and strengthen communities. For 50 years, Urban has been
the trusted source for rigorous analysis of complex social and economic issues; strategic advice to
policymakers, philanthropists, and practitioners; and new, promising ideas that expand opportunities
for all. Our work inspires effective decisions that advance fairness and enhance the well-being of
people and places.
AUTHORS
Shayne Spaulding, Urban Institute
Burt Barnow, George Washington University
Amanda Briggs, Urban Institute
John Trutko, Capital Research Corporation
Alex Trutko, Capital Research Corporation
Ian Hecker, Urban Institute
Copyright © January 2021. Urban Institute. Permission is granted for reproduction of this file, with attribution to the Urban Institute. Cover image by Tim Meko.
Suggested citation: Spaulding, Shayne, Burt Barnow, Amanda Briggs, John Trutko, Alex Trutko, and Ian Hecker (2021). Measuring the Effectiveness of Services to Employers: Options for Performance Measures under the Workforce Innovation and Opportunity Act (Research Report). Prepared for the US Department of Labor, Chief Evaluation Office. Washington, DC: Urban Institute
Contents Acknowledgments viii
Glossary of Key Terms and Abbreviations x
Abstract xiv
Executive Summary xv Findings on How Employer Services Are Defined and Delivered xvi Assessment of the Pilot ESE Measures xvii
Employer Penetration Rate Has the Most Weaknesses as a Standalone Measure xviii Repeat Business Customers Is a Useful Measure, but It Would Be Improved by the Use of
Statistical Adjustment xviii Retention with the Same Employer Measure Is Easiest to Implement, but Has Some Limitations
xix Considering Alternative Measures and Data Sources xix Considerations for Adopting One or More Than One Measure xx Considerations for Supporting Successful Implementation of the Measures xx
Improving Appropriateness, Data Quality, and Use of the Measures xxi Increasing Relevance for All WIOA Programs and Local Areas xxi Dealing with Unintended Consequences xxi
Considerations for Future Study xxii
Chapter 1: Introduction 1 1.1 Study Background 1 1.2 Performance Measurement Background and Key Concepts 3
Validity 4 Reliability 5 Practicality 6 Unintended Consequences 6
1.3 Research Design 7 Knowledge Synthesis and Conceptual Framework 7 Data Collection Activities 10 Limitations 13
Chapter 2: Evolution of Employer Services Requirements and Performance Measurement Approaches 14
2.1 History of Requirements for Providing Services to Employers via the Public Workforce System 14
i v C O N T E N T S , F I G U R E S , A N D T A B L E S
Requirements Governing Employer Service Delivery: WIOA Core Programs 16 2.2 Measuring the Effectiveness of Employer Services 19
Before WIOA 20 Changes under WIOA to Assess Effectiveness in Serving Employers 23
Chapter 3: How the Public Workforce System Provides Services to Employers 25 3.1 Types of Services Provided 26
Definitions of “Core Program Services” Provided to Employers under Employer Penetration Rate and Repeat Business Customers Rate 26
Types of Services Provided 28 3.2 Variation in Service Delivery across Core Programs and Alignment with Performance
Specifications 30 Differences in Employer Services Provided across WIOA Core Programs 31 Alignment of Performance Specifications to Services Provided to Employers 34
Chapter 4: Implementation of Pilot Measures 37 4.1 Performance Data Submitted by States 38 4.2 Assessing Implementation of the ESE Measures 39
Validity 41 Reliability 45 Practicality 49 Unintended Consequences 53
Summary 56
Chapter 5: Alternative Measures and Data Sources 57 5.1 Alternative Measures 57
Measures Used by Other Federal Programs 58 Alternative Measures and Measurement Approaches in States and Localities 59 Other Approaches to Measuring Employer Services 60 Summary of Alternative Measures 61
5.2 Alternative Data Sources 62
Chapter 6: Options and Considerations for Next Steps 64 6.1 Options and Considerations for Measure Adoption 64
Considerations for Choosing One or More than One Measure 64 Selecting among the Current Pilot Measures 67 Employer Penetration Rate 68 Repeat Business Customers 70 Retention with the Same Employer 71 Consideration of Alternative Measures 73
6.2 Supporting Successful Implementation of the Measures 74
C O N T E N T S , F I G U R E S , A N D T A B L E S v
Support States in Improving Reliability and Increasing Practical Use of the Measures 74 Make Measures More Relevant and Useful for All WIOA Titles and Local Areas 75 Dealing with Unintended Consequences 76
6.3 Potential Options for Future Study 76 Further Analyze Selected Measure or Measures to Strengthen Them, Support Their Adoption,
and Establish Satisfactory Levels of Performance 77 Examine Alternative Measures and Approaches That Could Supplement Adopted Measures and
Improve Performance Measurement 77 Explore Alternative Data from the Census Bureau, Private Vendors, and the States as Potential
Sources for Validating Results and Supporting State Data Collection Efforts 78 Develop Adjustment Models and Baseline Standards to Meet Federal Requirements and
Improve Usefulness of Adopted Measures 78 Concluding Remarks 80
Index of Key Terms 81
References 83
Statement of Independence 86
v i C O N T E N T S , F I G U R E S , A N D T A B L E S
Figures and Tables Figure 1.1: WIOA Employer Services Conceptual Framework
Table 1.1: State Program Director Survey Response Rates by Program
Table 1.2: Virtual Site Visits: Sample and Interviews Conducted by State and Local Area
Table 2.1: National Pilot Measures for Effectiveness in Serving Employers Indicators
Table 3.1: Definitions of Employer Services Counted under the Employer Penetration and Repeat
Business Customer Measures
Figure 3.1: Percentage of Total Reported Services Provided to Employer Establishments by Service
Type across All States, Program Year 2018
Figure 3.2: Data on Employer Services Delivered, as Reported by One State in Program Year 2018,
Disaggregated by Program
Figure 3.3: Percentage of WIOA Program Directors Overseeing Core Programs That Indicated
Employer Services Are Provided in Coordination with Other Core WIOA Programs as Part of a State
Strategy for Integrated Service Delivery
Figure 3.4: Percentage of Survey Respondents by Program That Indicated Services Provided to
Employers Vary by Region or Locality
Table 3.2: Core Program Services Offered to Employers through Core WIOA Programs
Table 4.1: Number of States Piloting ESE Measures in Program Years 2017 and 2018
Figure 4.1: Number of ESE Measures Piloted across States in Program Years 2017 and 2018
Table 4.2: Summary Assessment of Each Pilot Measure
Table 4.3: Percentage of Survey Respondents by Program That Indicated for Each Measure Adopted
by Their State That They Agreed or Strongly Agreed with the Statement, “Measures Accurately
Capture Whether Services Provided to Employers by the State Workforce System Are Achieving
Desired Outcomes”
C O N T E N T S , F I G U R E S , A N D T A B L E S v i i
Table 4.4: Percentage of Survey Respondents by Program That Indicated for Each Measure Adopted
by Their State That They Agreed or Strongly Agreed with the Statement, “Measures Accurately
Capture the Quality of the Employer Services Provided”
Figure 4.2: Percentage of States with Single- versus Multiagency Administration of Core WIOA
Programs
Table 4.5: Percentage of Overall Survey Respondents That Indicated Their Agency’s Ability to
Aggregate Information into a Statewide Figure for Reporting Is Strong or Very Strong
Table 4.6: State Program Director Survey Open Responses Related to Reliable Reporting on the Pilot
Measures
Figure 4.3: Percentage of Program Directors Overall Who Indicated That “Ease of Use” and
“Availability of Data” Were among the Reasons for Adopting the ESE Measures in Their State
Table 5.1: Measures Used by Other Federal Programs
Table 5.2: State Alternative ESE measures Surfaced during Site Visit and Survey Data Collection
Table 5.3: Approaches to Measuring Employer Services from Outside the Public Workforce System
Table 6.1: Strengths and Weaknesses of the Pilot Measures
v i i i A C K N O W L E D G M E N T S
Acknowledgments This report was funded by the US Department of Labor, Chief Evaluation Office and Employment and
Training Administration, under contract number DOLQ129633251. The views expressed by the
authors should not be attributed to the Urban Institute, its trustees, or its funders. Funders do not
determine research findings or the insights and recommendations of Urban experts. Further
information on the Urban Institute’s funding principles is available at urban.org/fundingprinciples.
The authors acknowledge several people who contributed to and supported this research. First,
our US Department of Labor project officers, Michelle Ennis and Heather Parker, have provided
guidance throughout the study to help improve the design, data collection, and analysis and ensure
the findings in our reports are relevant to key audiences. In addition, Megan Lizik, project officer, and
Christina Yancey in the Chief Evaluation Office at the US Department of Labor have contributed key
insights throughout the project period and to revisions of the report. We are also grateful to C.J.
Krizan in the Chief Evaluation Office for sharing his knowledge about Bureau of Labor Statistics data,
which informed our discussion of alternative data sources in the report.
In the Office of Policy Development and Research in the Employment and Training Administration
of the US Department of Labor, we would like to thank Heidi Casta and Adele Gagliardi. In the office’s
Divisions of Research and Evaluation and Strategic Planning and Performance, we are appreciative of
the support on this project and technical reviews of the report provided by Wayne Gordon and Neil
Ridley and by Karen Staha, Greg Wilson, and Christina Eckenroth, respectively. We would also like to
thank managers and staff from the Employment and Training Administration’s Office of Workforce
Investment for their review of the first draft of the report.
From the US Department of Education, we thank Cheryl Keenan and John “Jay” LeMaster in the
Office of Career, Technical and Adult Education’s Division of Adult Education and Literacy, and Chris
Pope from the Office of Special Education and Rehabilitation Services’ Rehabilitation Services
Administration for their many contributions throughout this project and reviews of the report.
We are also grateful to our partners, including Yvette Chocolaad and her colleagues from the
National Association of State Workforce Agencies, for their partnership and contributions to the
design of the study, analysis, and final report. Jamie Costilow and Shannon Offord, from
DirectEmployers Association, worked with us to field a survey to members. Pat Tyler (National
Association of State Directors of Adult Education), Steve Wooderson, Kathleen West-Evans, and Rita
Martin (Council of State Administrators of Vocational Rehabilitation) contributed to the project by

A C K N O W L E D G M E N T S i x
testing data collection instruments, confirming program director contact lists, and assisting with
outreach on the state survey and identifying employers for interviews.
We appreciate all the time and information provided by Workforce Innovation and Opportunity
Act program staff in states and local areas, as well as other national experts and employer
representatives, who contributed their time and insights during the height of a global pandemic and
jobs crisis. A team of subject matter experts, including Bruce Ferguson, Harry Hatry, Carolyn Heinrich,
and Jason Palmer contributed their expertise in performance measurement, the workforce system,
and knowledge of workforce programs to inform the study design and provide feedback on the final
report. Finally, we thank the Urban Institute staff who helped us design and implement data collection
and with analysis for this report, especially Rob Pitingolo, who played a critical role in programming
the state survey and in the analysis of survey findings, Teresa Derrick-Mills, who played an important
role in the study design and reviewed the final report, and Lauren Eyster, who also served as a
reviewer of the final report.
x G L O S S A R Y O F K E Y T E R M S A N D A B B R E V I A T I O N S
Glossary of Key Terms and Abbreviations American Customer Satisfaction Index: The American Customer Satisfaction Index is a national cross-
industry measure of customer satisfaction used in the United States. The Department of Labor utilized
the index to understand customer satisfaction of jobseekers and employers who engaged with the
workforce system. Workforce Investment Act performance accountability requirements (section
136(b)(2)(B)) required each state to administer the index until the requirement was waived in 2005.
American Job Centers: Authorized under the Workforce Innovation and Opportunity Act, these
centers provide free help to job seekers for a variety of career- and employment-related needs. Nearly
2,400 American Job Centers are located throughout the United States.
Common Measures: Six core performance outcomes monitored under the Workforce Investment Act
performance accountability system. The Common Measures included Entered Employment Rate,
Employment Retention Rate, and Average Earnings (which apply to Adult and Dislocated Worker
programs), and Placement in Employment, Education, or Training; Attainment of a Degree or
Certificate; and Literacy and Numeracy Gains (which apply to Youth Programs).
Comprehensive Employment and Training Act: A United States federal law enacted by Congress in
the 1970s to train workers and provide them with jobs in the public service. It is a key piece of public
workforce system legislation that increased the involvement of businesses and the private sector in
the development and implementation of public employment and training activities.
Council of State Administrators of Vocational Rehabilitation: A national organization comprising
Directors of State Vocational Rehabilitation Agencies. The Council’s members supervise the
rehabilitation of some 1.2 million persons with disabilities.
DirectEmployers Association: A member-owned and managed association of more than 900
employers of Fortune 1000 companies that are mostly large federal contractors, which are required
under federal law to demonstrate engagement with the public workforce system through mandatory
job listings and positive recruitment.
Effectiveness in serving employer (ESE) measures: In this report, “ESE measures” refers to the
indicators of performance required under section 116(b)(2)(A)(i)(VI) of the Workforce Innovation and
Opportunity Act.
G L O S S A R Y O F K E Y T E R M S A N D A B B R E V I A T I O N S x i
Establishments: The physical location of a certain economic activity, such as a factory, mine, store, or
office. A single establishment generally produces a single good or provides a single service. An
enterprise (a private firm, government, or nonprofit organization) can consist of a single establishment
or several establishments.
Employer Penetration Rate measure: Percentage of employers using services out of all employers in
the state.
Government Performance and Results Act: Enacted in 1993, the Government Performance and
Results Act provided guidance for agencies to implement results-oriented Performance Management
systems. It was updated in 2010 as the GPRA Modernization Act.
National Association of State Directors of Adult Education: A membership association of state staff
representing Adult Education and Family Literacy Act programs throughout the states and territories
that supports efforts to increase literacy and prepare adults for success as contributing members of
society.
National Association of State Workforce Agencies: This is the primary national association
representing state administrators of the publicly funded state workforce system, including the 2014
Workforce Innovation and Opportunity Act, employment services, training programs, unemployment
insurance, employment statistics, and labor market and workforce information
Performance accountability: Performance accountability focuses on how well policies, plans,
programs, and people are performing. Policy planning, strategic planning, and operational planning and
budgeting processes all incorporate accountability. Accountability is a basic requirement of mission-
driven, results-oriented government.
Performance measure: Indicators measuring aspects of programs that are related to their mission,
goals, and intended results.
Pilot “effectiveness in serving employer” (ESE) measures: States could select two of three measures
of effectiveness in serving employers to be implemented during a pilot period. These pilot ESE
measures included Employer Penetration Rate; Repeat Business Customers; and Retention with the
Same Employer.
Practicality: In performance measurement, practicality refers to the idea that measures must be
relatively uncomplicated and simple to administer to avoid threats to reliability and validity. For this
report, we also consider whether measures are practical to use in administering programs.
x i i G L O S S A R Y O F K E Y T E R M S A N D A B B R E V I A T I O N S
Program Memorandum: Guidance and reporting memoranda issued from the US Department of
Education. Other than statutory and regulatory requirements included in the document, these
documents are intended only to provide clarity to the public regarding existing requirements under
the law or agency policies and do not have the force and effect of law.
Reliability: Refers to the ability to maintain consistency in data collection over time and across the
organizations collecting the data.
Repeat Business Customers measure: Percentage of employers receiving services in a given year who
also received services within the previous three years.
Retention with the Same Employer measure: Percentage of participants who exit and are employed
with the same employer in the second and fourth quarters after exit.
Statistical adjustment model: Method for setting performance goals that accounts for variation in the
characteristics of the participants being served as well as for differences in the economies they are
being served in. A statistical model objectively quantifies how, and to what extent, each of these
factors affects program performance outcomes. The Workforce Innovation and Opportunity Act
section 116, Performance Accountability System, requires the use of a statistical adjustment model.
Technical Assistance Circular (TAC): Guidance and reporting circulars issued from the Rehabilitation
Services Administration to provide clarity to the public regarding existing requirements under the law
or agency policies.
Training and Employment Guidance Letter (TEGL): Guidance and reporting letters issued from the
Department of Labor providing information to clarify requirements described in federal legislation for
the workforce system, such as the Workforce Innovation and Opportunity Act.
Unintended consequences: Negative consequences or behaviors that result from the implementation
of a measure, such as the displacement of other goals or conflict between goals.
US Department of Education (ED): Federal agency overseeing Title II and IV Workforce Innovation
and Opportunity Act programs, in partnership with the US Department of Labor.
US Department of Labor (DOL): Federal agency overseeing Title I and III Workforce Innovation and
Opportunity Act programs, in partnership with the US Department of Education.
G L O S S A R Y O F K E Y T E R M S A N D A B B R E V I A T I O N S x i i i
Validity: In this study, validity refers to measurement validity, which is used to assess whether
performance measures are capturing what they intend to measure, including how well a measure
aligns with a program and its goals and outcomes.
Workforce Investment Act (WIA): Law preceding the Workforce Innovation and Opportunity Act,
which governed public workforce programs.
2014 Workforce Innovation and Opportunity Act (WIOA): Primary federal statute governing the
public workforce system aimed at helping job seekers, including those with barriers to employment,
access employment, education, training, and support services to succeed in the labor market and
matching employers with the skilled workers they need to compete in the global economy. The full
text of the law includes six purposes.1
1 For a summary of WIOA’s purposes, see “WIOA | About,” US Department of Labor, Employment and Training
Administration, accessed December 20, 2020, https://www.dol.gov/agencies/eta/wioa/about. For the original language, see section 2 of the full text at “Workforce Innovation and Opportunity Act,” Pub. L. No. 113-128, 128 Stat. 1425 (2014).
x i v A B S T R A C T
Abstract This study informs the US Departments of Labor and Education about options to consider in adopting
one or more Effectiveness in Serving Employers (ESE) measures across all Workforce Innovation and
Opportunity Act core programs. Since Program Year 2016, states have reported annually on at least
two of three pilot measures. The study team assessed each pilot ESE measure for validity, reliability,
practicality, and unintended consequences. The study raises several options for next steps, including
further research on the implementation of the ESE measures, additional examination of alternative
measures and data, and the development of statistical adjustment models.
E X E C U T I V E S U M M A R Y x v
Executive Summary The 2014 Workforce Innovation and Opportunity Act (WIOA) aims to provide all job seekers and
workers, including those with barriers to employment, with access to career services, education,
training, and support services to succeed in the labor market, while providing employers with skilled
workers and other business services.2 WIOA requires the implementation of performance
accountability measures to inform whether the public workforce system is successfully achieving
these goals. This includes a performance indicator for the effectiveness in serving employers (ESE
measure). Beginning in Program Year 2016, states have been required to select at least two of three
pilot measures that had been identified after input from the states and a period of public comment.
The three pilot ESE measures are Retention with the Same Employer, Repeat Business Customers,
and Employer Penetration Rate (box ES.1). Ultimately, these new performance measures are aimed at
improving the effectiveness of services to employers by giving the federal government, states, and
local areas information to set targets, track and monitor performance, and implement performance
improvements.
BOX ES.1 Pilot ESE Measures
Retention with the Same Employer: Percentage of participants who exit and are employed with the same employer in the second and fourth quarters after exit.
Repeat Business Customers: Percentage of employers receiving services in a given year who also received services within the previous three years.
Employer Penetration Rate: Percentage of employers using services out of all employers in the state.
Source: Adapted from “Training and Employment Guidance Letter No. 10-16, Change 1,” US Department of Labor, August 23, 2017, https://wdr.doleta.gov/directives/corr_doc.cfm?DOCN=3255.
This study seeks to inform the US Department of Labor (DOL) and US Department of Education
(ED) with objective information, collected from states and local areas and publicly available
information, for their use in making decisions on the adoption and implementation of one or more ESE
measures across all six core WIOA programs. These programs include Title I Adult, Dislocated Worker,
2 “Business services” are defined in “What are the business services provided through the one-stop delivery system, and how are they provided?” 34 CFR 361.435, https://www.law.cornell.edu/cfr/text/34/361.435#.
x v i E X E C U T I V E S U M M A R Y
and Youth Programs and the Title III Wagner-Peyser Program, which are administered by DOL, and
Title II Adult Education Programs and Title IV Vocational Rehabilitation Programs, which are
administered by ED. Federal regulations require each pilot ESE measure to be reported by states as a
shared outcome across all four titles in alignment with the goal to “ensure a holistic approach”3 and
promote coordination and collaboration across programs in serving employers. States were also
encouraged to develop alternative ESE measures. At the end of the pilot period, the federal
government will select one or more of the ESE measures as a permanent indicator of performance for
the effectiveness in serving employers.
The study team conducted a survey and interviews, reviewed documents and literature, and
analyzed state performance data to inform the assessment of the measurement approaches piloted by
states. The team assessed each pilot ESE measure for reliability, validity, and practicality and
considered possible unintended consequences. The study team also sought to identify promising
alternative measures and alternative data sources for assessing performance. This report summarizes
our results and presents a set of considerations to inform DOL’s and ED’s selection of one or more
final measures. Based on these considerations, the authors also assess where further study of aspects
of measuring the effectiveness in serving employers may be useful to consider by the research arms of
DOL and ED.
Findings on How Employer Services Are Defined and Delivered Two of the pilot ESE measures, Employer Penetration Rate and Repeat Business Customers, require
counts of services provided to employers. As part of the pilot, states and local areas reported on
unique counts of employer establishments receiving services through WIOA’s six core programs
across eight unique service categories established in federal rulemaking (i.e., in TEGL 10-16, Change 1;
PM 17-2; and TAC 17-01). The categories of services are as follows:
Employer information and support services
3 “Training and Employment Guidance Letter (TEGL) No. 10-16, Change 1,” US Department of Labor, August 23,
2017, https://wdr.doleta.gov/directives/corr_doc.cfm?DOCN=3255; “Program Memorandum (PM) 17-2.” US Department of Education, August 23, 2017, https://www2.ed.gov/about/offices/list/ovae/pi/AdultEd/octae-program-memo-17-2.pdf; and “Technical Assistance Circular (TAC) 17-01,” US Department of Education, August 17, 2017.
E X E C U T I V E S U M M A R Y x v i i
Workforce recruitment assistance
Engagement in strategic planning and economic development
Accessing untapped labor pools
Training services
Incumbent worker training services
Rapid response/business downsizing assistance
Planning layoff response
Across all states and territories in Program Year 2018, the two most common types of services
delivered to employer establishments were (1) workforce recruitment assistance and (2) employer
information and support services. In our surveys and site visits, we found considerable variation
observed in the services provided to employers across WIOA’s core programs. State and local staff
indicated during interviews that the categories of employer services used for reporting on employer
services during the pilot were adequate for performance reporting but had some limitations, including
that some of the categories were not specific enough to capture the intensity of services provided by
Title II and IV programs, such as providing adult basic education to incumbent workers or training to
employers on how to work with persons with disabilities.
Assessment of the Pilot ESE Measures Survey and interview responses suggest that the ESE measures implemented during the pilot period—
Retention with the Same Employer, Repeat Business Customers, and Employer Penetration Rate—
have helped the public workforce system focus on providing and tracking services to employers.
Performance data submitted by states in Program Year 2018 indicate that states were most commonly
piloting the Retention with the Same Employer and Employer Penetration Rate measures: 42 states
were piloting each of these measures. In fact, in Program Year 2018, 14 states were piloting all three
measures. For each ESE measure, the study team identified threats to validity, reliability, and
practicality as well as potential unintended consequences as required as part of the scope of work to
assess the pilot ESE measures. We describe in more detail below the various options and factors for
DOL and ED to consider when selecting one or more final measures. We also examine options for
developing statistical adjustment models and options for further research to support successful
adoption of ESE measures moving forward.
x v i i i E X E C U T I V E S U M M A R Y
Employer Penetration Rate Has the Most Weaknesses as a Standalone Measure
The Employer Penetration Rate measures the share of employers in the state served by the workforce
development system. We find that this measure provides broad information on the extent to which
employers in the state are engaged with the workforce development system and that it provides an
incentive to reach out to additional employers in the state. In interviews, many officials indicated that
the Employer Penetration Rate provides useful information. However, we find that the measure
emphasizes quantity rather than the quality or intensity of the employer service provided, does not
reflect the workforce system’s efforts to target particular sectors, and poses reliability issues because
of problems in how employer services data are entered and how the programs count establishments.
Further weaknesses of the Employer Penetration Rate measure include that it measures outputs not
outcomes, that it could potentially create harmful incentives to prioritize breadth rather than depth in
service delivery, and that it is not sensitive to industry sectors targeted by state and local workforce
agencies. The Employer Penetration Rate could function as a secondary measure or be suggested to
states as something they could track for management or planning purposes, because it encourages
states and local areas to expand their outreach to businesses.
Repeat Business Customers Is a Useful Measure, but It Would Be Improved by the Use of Statistical Adjustment
The Repeat Business Customers measure is an attempt to gauge employer satisfaction with public
workforce system services. The measure is related to the outcome of assisting employers in finding
workers. The Repeat Business Customers measure ranked second compared with the other two pilot
measures for ease of measure implementation and data availability. In interviews with state officials,
respondents noted that it was generally a better measure of quality and outcomes than the Employer
Penetration Rate because it provides a signal of employer satisfaction with the workforce system.
However, they expressed concern that the measure may provide a disincentive to reach out to new
employers. Further, this measure is subject to variation by economic conditions, industry, and sector.
A statistical adjustment model would likely help mitigate these factors and make implementation and
interpretation of outcomes more appropriate for this measure as well as other measures.
E X E C U T I V E S U M M A R Y x i x
Retention with the Same Employer Measure Is Easiest to Implement, but Has Some Limitations
This pilot measure is aligned with and attempts to measure the workforce system’s goal of improving
the skills of the workforce and reducing turnover. Although it captures different aspects of service
quality than the Repeat Business Customers measure (namely the match with an employer), it has
similar attributes. The measure scored better in the study survey than the other two pilot measures in
terms of ease of implementation and data availability among program directors, who were asked why
they were using particular measures. Fifty-seven percent of the respondents indicated that ease of
use was a factor in selecting the Retention with the Same Employer measure. The other two pilot
measures’ corresponding figures were 42 percent for the Employer Penetration Rate and 47 percent
for Repeat Business Customers.
Like the Repeat Business Customers measure, a statistical adjustment model could improve the
Retention with the Same Employer measure. In some cases, being retained by the same employer
might not reflect the optimal outcome for a given worker. Currently, the measurement approach does
not account for whether employers retaining job seekers have received business services from any of
the WIOA core programs, and we suggest using the measure only to assess the effectiveness of
serving employers when the employer or business receives a business service.
Considering Alternative Measures and Data Sources We identified few options for alternative measures or sources of data that appear to be more valid,
reliable, or practical than what is currently used. The most promising alternative federal measure we
learned about during our data collection activities across states is “Business Placement Rate.” Business
Placement Rate measures the number of establishments that received a business service in a quarter
and had employed a recently exited participant during the service quarter or the following two
quarters, and divides that by the number of establishments that received a business service in a
quarter. This measure is notable because it may capture the extent to which a given workforce service
led to hiring, potentially showing its effectiveness, although it may be less useful for capturing
employer services not related to job placement.
We also investigated whether there are superior data sources that could be leveraged to
understand the workforce system’s effectiveness in serving employers. Currently, the Repeat Business
Customers and Employer Penetration Rate measures rely on the Quarterly Census of Employment and
x x E X E C U T I V E S U M M A R Y
Wages as the database of businesses used to count the total number of employer establishments that
received a service. We did not find a strong rationale to consider replacing the Quarterly Census of
Employment and Wages. However, it would be useful to explore other databases, especially the
Census Bureau Listing of Employers, to further validate the measures and support use by states for
their employer engagement, service provision, and measurement efforts.
Considerations for Adopting One or More Than One Measure The statute provides flexibility for the Secretaries of Labor and Education to develop and implement
one or more measures when finalizing the standardized performance indicator for the effectiveness of
serving employers. Based on our study’s findings, there are trade-offs for adopting one measure or
multiple measures.
Factors that support having a single measure include less resources devoted to record keeping,
clarity on how state performance is assessed, and that the statute does not require the selection of
multiple measures. A case can be made for adopting a single measure if the measure is aligned with
the goals of and services provided to employers, has limited threats to reliability and practicality, and
has minimal risk of unintended consequences.
Reasons to adopt more than one measure include that the measures capture different aspects of
performance (e.g., reaching a large number of employers, reducing turnover, or providing quality
services overall), having several measures is more likely to reduce unintended consequences, and
WIOA uses several measures for the participant performance measures. There is no overwhelming
case for either approach, but having more than one measure offers the advantage of capturing more
aspects of performance and reducing unintended consequences.
Considerations for Supporting Successful Implementation of the Measures Given that we identified few alternative measures or data sources that would offer advantages to the
three piloted ESE measures, we provide considerations related to the implementation of one or more
of the existing ESE measures.
E X E C U T I V E S U M M A R Y x x i
Improving Appropriateness, Data Quality, and Use of the Measures
The piloted ESE measures require states to look at data they have not used before to track
performance and report shared outcomes across core programs of WIOA and geographic areas.
Therefore, it is not surprising that state program directors reported issues with the pilot ESE measures’
data in regard to validity, reliability, and practicality. One important finding is that states had relatively
low confidence in how well data are collected for the measures. A practical first step to be considered
would be implementing a rigorous quality control effort to help address the states’ concerns about
data collection. Such an effort would be aimed at revealing the types of errors that appear and their
frequency to inform future technical assistance and training efforts. This could include supporting
states to develop dashboards that present data on ESE measures; these could be disaggregated by the
local area and WIOA core program to make the information more actionable.
Increasing Relevance for All WIOA Programs and Local Areas
The current reporting requirements call for the data on employer services to be reported as a shared
outcome across core programs. Although DOL and ED encouraged programs within a state to
coordinate their business services, reporting the data disaggregated by program and local area could
make the performance data more actionable. Any changes in reporting requirements would require
regulatory change. State adult education officials and vocational rehabilitation officials revealed that
while they engaged in important work with employers, their programs viewed their work with
employers differently from how adult, dislocated worker, and youth officials and staff in Wagner-
Peyser programs viewed employer services. Serving employers is not currently a part of the statute
governing Title II Adult Education and Family Literacy Act programs under WIOA.
Dealing with Unintended Consequences
The performance measurement system under WIOA includes financial penalties, or sanctions, for
states that fail to meet adjusted levels of performance for two consecutive years. This study surfaced
data collection and reliability issues that may warrant attention, and the measures would benefit from
the development of a statistical adjustment model (as required by law) before the implementation of
sanctions. Data collection issues identified through our data collection point to the potential benefits
of implementing quality control and technical assistance guidance so that states are better able to
meet performance expectations.
x x i i E X E C U T I V E S U M M A R Y
Considerations for Future Study Findings from the study suggest several options for next steps should DOL be interested in further
study of the measures as they are implemented. These steps include the following:
Further analyze selected measure or measures to strengthen them, support their adoption,
and establish satisfactory levels of performance. Additional research could involve
understanding adoption of the measures. Depending on what measures are adopted, new
lessons could emerge on how to define measures, support new adopters, and establish
satisfactory levels of performance. Another method of assessing newly adopted measures
would be to examine the relationship between measures. This includes looking at state
performance on participant measures in relation to the ESE measures. For example, DOL and
ED might compare state performance on job seeker participant measures to the Retention
with the Same Employer measure to determine whether additional employer retention
measures add value.
Examine alternative measures and measurement approaches that could supplement adopted
measures and improve performance measurement. A comparative analysis of alternative
measures, measurement approaches, and data sources could yield information useful to states
allocating scarce resources. States could use this analysis to determine how to collect and
track information about their services provided to employers.
Develop adjustment models and baseline standards to meet federal requirements and
improve usefulness of adopted measures. Regardless of which measure or measures are
selected, our findings point to the value of a statistical adjustment model. Although the WIOA
statute requires the application of statistical adjustment models, our research suggests that a
statistical adjustment model may address many of the concerns raised by respondents about
the validity of the measures and may prevent unintended consequences of the measures.
Because we believe a majority of employer services are provided by Wagner-Peyser
programs, we suggest that variables included in the Wagner-Peyser performance measure
statistical adjustment model be considered for the ESE measures’ statistical adjustment
models. However, additional work will be required involving a multiyear process to develop
models that are appropriate for the ESE measure or measures.
M E A S U R I N G T H E E F F E C T I V E N E S S O F S E R V I C E S T O E M P L O Y E R S 1
Chapter 1: Introduction 1.1 Study Background The 2014 Workforce Innovation and Opportunity Act (WIOA) was “designed to help job seekers
access employment, education, training, and support services to succeed in the labor market and to
match employers with the skilled workers they need to compete in the global economy.”4 WIOA
requires the implementation of performance measures to understand whether the public workforce
system is successfully achieving these goals, including measures of the workforce system’s
effectiveness in serving employers (WIOA section 116(b)(2)(A)(iv)). Beginning in 2016, WIOA required
states and their localities to select a minimum of two of three pilot measures to assess the
effectiveness in serving employers (“ESE measures”) that had been identified by the US Department of
Labor (DOL) and US Department of Education (ED) after input from the states and a period of public
comment. The three pilot ESE measures are Retention with the Same Employer, Repeat Business Customers, and Employer Penetration Rate (box 1). To help identify potential new measures, states
were also encouraged to develop alternative measures of their own. The ultimate goal of these
measures is to improve the effectiveness of services to employers.
BOX 1 Pilot ESE Measures
Retention with the Same Employer: percentage of participants who exit and are employed with the same employer in the second and fourth quarters after exit.
Repeat Business Customers: percentage of employers receiving services in a given year who also received services within the previous three years.
Employer Penetration Rate: percentage of employers using services out of all employers in the state,
Source: Adapted from “Training and Employment Guidance Letter No. 10-16, Change 1,” US Department of Labor, August 23, 2017, https://wdr.doleta.gov/directives/corr_doc.cfm?DOCN=3255.
The Urban Institute, under contract with DOL’s Chief Evaluation Office and in collaboration with
the Employment and Training Administration, conducted an exploratory study to understand the
implementation of ESE measures. The research team was asked to assess each for their reliability,
4 “Training and Employment Guidance Letter No. 10-16, Change 1,” US Department of Labor, August 23, 2017, https://wdr.doleta.gov/directives/corr_doc.cfm?DOCN=3255.

2 M E A S U R I N G T H E E F F E C T I V E N E S S O F S E R V I C E S T O E M P L O Y E R S
validity, practicality, and unintended consequences in relation to the services being provided to
employers across the six core programs of WIOA (box 2), across states, and across local areas within
states. Moreover, the study was aimed at identifying what alternative measures and data sources
might be used to understand engagement with and effectiveness of services to employers. Finally, the
team was asked to identify opportunities for further research to inform selection of the measures and
the provision of services to employers under WIOA, including options for statistical adjustment as
required under WIOA statute. This study aims to inform federal decisionmaking related to new
performance measures assessing the effectiveness of the public workforce system in serving
employers. Further, findings will be useful to state and local administrators of WIOA core programs
and others in the policy and research community concerned with how to effectively engage employers
and measure the results of those efforts, filling gaps in the evidence base.
BOX 2 WIOA Titles and Core Programs
Title I: Workforce Development Activities, authorizes job training and related services to unemployed or underemployed individuals and establishes the governance and performance accountability system for WIOA.
Title II: Amendments to the Adult Education and Family Literacy of 1998, authorizes education services to assist adults in improving their basic literacy skills, and knowledge for employment and self-sufficiency.a
Title III: Amendments to the Wagner-Peyser Act of 1933, integrates the US Employment Service into the American Job Center system authorized by WIOA.
Title IV: Amendments to the Rehabilitation Act of 1973, authorizes vocational rehabilitation services to eligible individuals with disabilities, to further align the vocational rehabilitation program with other core programs in the workforce development system.
The core programs of WIOA are
Title I Adult, Title I Dislocated Worker, and Title I Youth programs;
Title II Adult Education program;
Title III Wagner-Peyser program; and
Title IV Vocational Rehabilitation Program.
Source: Text excerpted from Bradley (2015); describing the “Workforce Innovation and Opportunity Act,” Pub. L. No. 113-128, 128 Stat. 1425 (2014). a See section 202 of “the Workforce Innovation and Opportunity Act,” Pub. L. No. 113-128, 128 Stat. 1425 (2014) for more information about the purposes of the Adult Education and Family Literacy Act
M E A S U R I N G T H E E F F E C T I V E N E S S O F S E R V I C E S T O E M P L O Y E R S 3
To achieve the study goals, we used several methods, including a literature review, a state survey
of WIOA core program directors, interviews with state program administrators, interviews with local
administrators and local service delivery staff, and additional interviews with other key experts.
This report is organized as follows:
The remainder of Chapter 1 provides background on the key concepts of performance
measurement and describes our study design and methodology.
Chapter 2 discusses the evolution of employer services and measurement in the public
workforce system based on our review of the literature, public documents, and other publicly
available information from websites.
Chapter 3 discusses employer services provided by the public workforce system as context
for assessing employer pilot measures.
Chapter 4 includes an assessment of the pilot measures for validity, reliability, practicality, and
unintended consequences.
Chapter 5 discusses findings on alternatives to the pilot measures and alternative data
sources.
Chapter 6 summarizes findings and provides options for consideration in determining next
steps in selecting and supporting implementation of ESE measures.
1.2 Performance Measurement Background and Key Concepts In this section, we provide background on performance measurement in federal programs, including
the concepts of validity, reliability, practicality, and unintended consequences. We rely on the
foundations of performance measurement in developing the study design to assess the pilot ESE
measures. Before describing our methodology, we review key concepts of performance measurement
as context for understanding our study design.
An important purpose of performance measurement in government programs is accountability, or
ensuring the programs and strategies implemented are accomplishing what is intended (Poister 2003).
A second purpose is to create organizational learning and improvement (Winkler and Fyffe 2016),
which is specified in the Government Performance and Results Act Modernization Act of 2010 (OMB
2020). Performance measures can be especially important for creating accountability in federal
programs implemented within a multitiered system involving state, local, and private actors (Barnow
4 M E A S U R I N G T H E E F F E C T I V E N E S S O F S E R V I C E S T O E M P L O Y E R S
2011). In a multitiered system (such as WIOA), a performance measurement system can help reduce
the “principal-agent problem,” where the goals of the lower-tier organizations (the states, which are
“agents”) do not align with the goals of the higher-tier organization (the federal government or
“principal”) by rewarding or sanctioning the lower-tier organization based on how well its performance
conforms to the goals of the higher-tier organization (Barnow 2000).
Performance measures are indicators measuring aspects of programs that are directly related to
their mission, goals, and intended results (Poister 2003). Performance measures may track outputs and
outcomes related to program effectiveness, operating efficiency, productivity, service quality,
customer satisfaction, or cost effectiveness (Poister 2003). Output indicators are defined under GPRA
as “a tabulation, calculation, or recording of activity or effort that can be expressed in a quantitative or
qualitative manner.”5 To be useful, output indicators should be linked to the intended outcomes of a
program. Intermediate indicators show progress toward the ultimate outcome of interest. Outcome
indicators gauge progress toward achieving the intended results or goals of a program and alert you to
“changes in conditions that the government is trying to influence” (OMB 2020, 200.22).
OMB Circular A-11 (OMB 2020) definitions suggest that considerations for appropriate measures
should (1) include the logic or evidence that relates them to the intended results of programs (validity);
(2) include data and measurement techniques providing consistency of measurement (reliability); and
(3) weigh rigor and the level of accuracy against timely and actionable information (practicality).
Circular A-11 also indicates that measures should be assessed to determine whether they may
encourage negative unintended consequences (OMB 2020, 200.5). We explore each of these
concepts in further detail here.
Validity
“Are you accurately measuring what you intend to measure?” (Newcomer, Hatry, and Wholey 2015, 702)
In this study, validity refers to measurement validity, which is used to assess whether you are
measuring what you intend to measure (Newcomer, Hatry, and Wholey 2015).6 This is also known as
5 “Primer on Performance Measurement,” Office of Management and Budget, revised February 28, 1995, https://govinfo.library.unt.edu/npr/library/resource/gpraprmr.html.
6 Measurement validity is different than internal validity, which is the primary focus in establishing causal relationships, or external validity, which is concerned with the populations and settings to which statistical findings may be reasonably applied.
M E A S U R I N G T H E E F F E C T I V E N E S S O F S E R V I C E S T O E M P L O Y E R S 5
construct validity, the ability to measure phenomena or variables that are theoretically related to those
that you are attempting to measure, or the higher-order constructs (Shadish, Cook and Campbell
2002). It addresses how well a specific measure aligns with a program and its goals and outcomes.
A first step to establishing validity for a performance measure is to establish the conceptual link
between a measure and the program being assessed through development of a logic model. A logic
model allows you to lay out the thinking behind the relationships between the services provided to
employers, the intended results, and the indicators used to track those results. As Poister (2003, 2015)
emphasizes, a key principle of performance measurement is linking measures and measurement to the
activities and strategies of a program, often using a graphic logic model, to show how the activities of
a program focus on a particular population to produce their intended results. In the next section, we
present a logic model (figure 1.1) to explain our study design.
Reliability
Are you able to maintain consistency in data collection over time and across organizations collecting the data? (Poister 2015)
Reliability in the context of performance measurement refers to the ability to maintain consistency in
data collection over time and across the organizations collecting the data (Poister 2015). The primary
threats to reliability are a lack of clear definitions of the terms in the performance measures, a lack of
clear procedures for making observations and collecting data, and a lack of precision in data entry into
performance measurement data systems (Poister 2015). In translating these threats into the context
of a multistate system where states may define services differently, concerns may arise about
reliability of measures across the states. Even if definitions, data collection procedures, and precision
of data entry are maintained within states, these aspects of data collection may not be consistent
across states. Further, because WIOA includes programs that are often implemented by different
agencies within a given state, administration, service delivery, and data collection can vary across
programs within states.
6 M E A S U R I N G T H E E F F E C T I V E N E S S O F S E R V I C E S T O E M P L O Y E R S
Practicality
Are measures simple to administer and practical to use? (OMB 2020; Hatry 2013; Poister 2015)
When considering the practicality of the measures, we define practicality in two ways. First, measures
must be relatively uncomplicated and simple to administer to avoid threats to reliability and validity.
Second, measures must be practical to use in administering programs. Although OMB Circular A-11
does not name the concept of practicality, it emphasizes the importance of performance measures
being timely and actionable. That means data must be available on a regular basis and information for
the indicators must provide enough detail such that managers can determine the kind of change that
may need to occur to improve performance as indicated by the measure. Performance measurement
data are primarily collected by service delivery staff and managers through their routine program
actions, from administrative data, and through special surveys. Hatry (2013) suggests that
disaggregating data by service units makes it more actionable for managers.
Unintended Consequences
Are there negative consequences or behaviors that result, like the displacement of goals or conflict with other goals? (OMB 2020; Poister 2010; Barnow 2011)
Finally, possible unintended consequences should be considered (as directed under OMB Circular A-
11) when establishing performance measures. Goal displacement (Poister 2010) is a concern; focus on
measuring one feature or dimension may cause managers to emphasize the feature under scrutiny
while de-emphasizing the features not under scrutiny. Different goals can also come into conflict.
Because the WIOA system has multiple goals, some of which are set at the state level, the ESE
measures could have the unintended effect of drawing resources away from job-seeker-focused
activities. Further, states also play an important role in establishing goals in the public workforce
system, and if state priorities and activities are not aligned with the goals reflected in the federal
measures, other important goals might not receive sufficient emphasis. This could have different
effects on the states depending on how aligned state priorities and activities are with the emphasis of
the federal measures. Different attributes of the measures may also come into conflict. For example, a
measure may be valid but not practical to implement.
M E A S U R I N G T H E E F F E C T I V E N E S S O F S E R V I C E S T O E M P L O Y E R S 7
1.3 Research Design We developed a design for this exploratory study that builds on concepts for appropriate performance
measurement and deploys several methods in understanding (1) the services provided to employers
across core WIOA programs, states, and lower levels of government; and (2) the adoption since 2016
of pilot and alternative measures in relation to these different parts of the public workforce system
and its services. We were further tasked with exploring options for developing a statistical adjustment
model for setting performance targets related to the measures and for identifying options for future
evaluation and research to fill knowledge gaps. For a list of the study’s research questions, see box 3.
A panel of subject matter experts—including WIOA administrators and experts in performance
measurement—informed the design of this study and reviewed this report.7
BOX 3 Research Questions
1. How are “services to employers” operationalized within and across WIOA’s core programs, and how do they vary across states, regions, and local areas?
2. What does the implementation of the pilot measures across states, core WIOA programs, and local areas tell us about the validity, reliability, practicality, and unintended consequences of adopting these measures?
3. What alternative measures or alternative data sources might be used to understand engagement with and effectiveness of services to employers?
4. What are the options, considerations, and next steps for identifying and defining measures of effectiveness in serving employers?
Knowledge Synthesis and Conceptual Framework
As a first step, we conducted a literature review (see Chapter 2) and knowledge synthesis to inform
development of the study design and a conceptual framework (in this case a logic model) to understand
7 The subject matter experts who contributed to the research design, methodology, and review of the final report included Bruce Ferguson, president and CEO of CareerSource Northeast Florida; Harry Hatry, distinguished Fellow in the Metropolitan Housing and Communities Policy Center at the Urban Institute; Carolyn Heinrich, Patricia and Rodes Hart Professor of Public Policy, Education and Economics at Vanderbilt University and codirector of the International Education Policy and Management Program in the Department of Leadership Policy and Organizations; and Jason Palmer, director of the Bureau of Labor Market information and Strategic Initiatives at the Michigan Department of Technology, Management and Budget.
8 M E A S U R I N G T H E E F F E C T I V E N E S S O F S E R V I C E S T O E M P L O Y E R S
the validity of the pilot measures. As discussed, a logic model can establish validity by showing the
relationship between a selected measure and the inputs, outputs, outcomes, and goals of a program
(Poister 2003, 2015). A logic model can also help depict some of the threats to reliability and practicality.
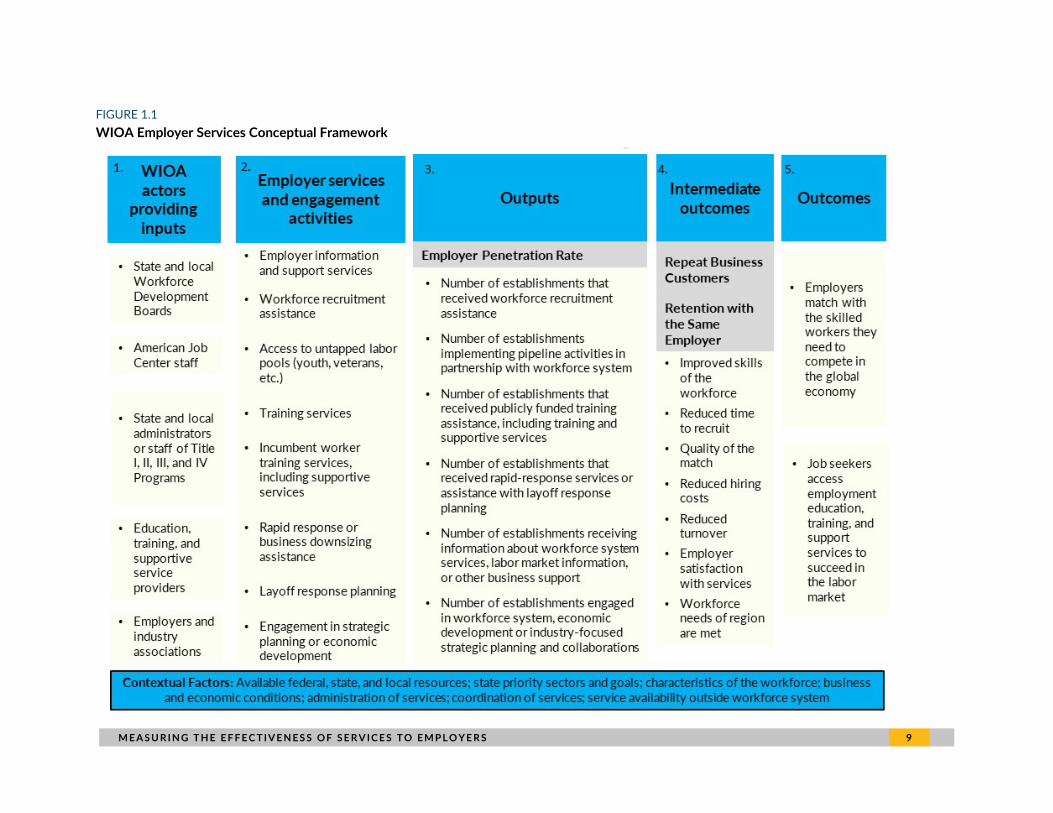
Figure 1.1 shows a logic model developed for understanding the services provided to employers,
the outputs and intended outcomes of these services, and the various performance measures that
might appropriately assess progress toward and achievement of those outcomes. As shown in column
5, the workforce system is focused on achieving outcomes for two primary customers: employers and
job seekers. Column 1 shows the inputs into the workforce system, and the multiple actors and layers
involved in service delivery. Column 2 shows the services provided to employers as defined in
regulatory guidance.8 Part of assessing the measures is assessing whether these services as defined in
federal law align with the services provided (validity) and whether definitions are clear (reliability).
Columns 3 and 4 show the outputs and intermediate outcomes of these activities; whether pilot
measures are providing information on outputs or outcomes is relevant to understanding the strength
of the selected measures.
As described, output indicators can be useful if there is a “reasonable connection or strong
positive correlation between outputs used as performance indicators and outcomes” (OMB 2020,
200.18). The Employer Penetration Rate is an output indicator because it measures the number of
employers receiving services. Our study design aims at assessing the strength of the relationship
between these outputs and the ultimate goals or outcomes of the program (i.e., assessing the validity
of the measures). The Retention with the Same Employer and Repeat Business Customer measures
are intermediate outcomes because they contribute to the ultimate outcome of ensuring employers
are matched with the skilled workers they need to compete in the global economy. Like the Employer
Penetration Rate measure, our study design aims to assess the alignment of these measures with the
program’s ultimate goals or outcomes.
The closer the measures are to the outcomes the public workforce system is trying to achieve for
employers, the greater the likelihood that those measures will be actionable by program
administrators (practical use) and valid as performance indicators. The contextual factors shown at the
bottom can affect the validity of the measures (if they do not account for variation in local context),
the reliability of the measures (if there are inadequate support for data collection), and practicality (if
contextual issues affect the ease of implementation).
8 “Training and Employment Guidance Letter No. 10-16, Change 1,” US Department of Labor, August 23, 2017,
https://wdr.doleta.gov/directives/corr_doc.cfm?DOCN=3255. “Program Memorandum (PM) 17-2.” US Department of Education, August 23, 2017, https://www2.ed.gov/about/offices/list/ovae/pi/AdultEd/octae-program-memo-17-2.pdf; and “Technical Assistance Circular (TAC) 17-01,” US Department of Education, August 17, 2017.
M E A S U R I N G T H E E F F E C T I V E N E S S O F S E R V I C E S T O E M P L O Y E R S 9
FIGURE 1.1 WIOA Employer Services Conceptual Framework
1 0 M E A S U R I N G T H E E F F E C T I V E N E S S O F S E R V I C E S T O E M P L O Y E R S
Data Collection Activities
To achieve our objectives, we developed a study design that aims to understand the services to
employers across the complex and multilayered workforce system, including several agencies at the
federal level, state, and local levels. This includes a survey of state program directors; interviews with
WIOA state- and local-level administrators and staff in eight states and eight local areas; performance
data analysis; and additional information-gathering activities with experts and other informants,
document reviews, and web searches.9
SURVEY OF STATE PROGRAM DIRECTORS
The survey of state WIOA core program directors provided information on the spectrum of services
provided to employers through WIOA and how performance is being measured, including perspectives
on the pilot measures and related challenges. By surveying program directors rather than single
agencies within states, we are able to understand variation across WIOA programs. We fielded the
online survey to 210 program directors of the Title I Adult, Dislocated Worker, and Youth programs;
Title II Adult Education and Family Literacy Act programs; Title III Employment Service programs; and
Title IV (State Vocational Rehabilitation, or VR, agencies that serve all eligible individuals with
disabilities and State VR agencies that serve only eligible individuals in the general program or those
who are blind or have visual impairments). The survey was shared with program directors across the
50 states, the District of Columbia, and the five territories of the US. We requested a unique survey
response from each program director (rather than a single response from each state). Directors in 46
states and four territories responded to the survey. A total of 116 unique individuals agreed to
participate across all program directors surveyed (55.2 percent). Some program directors oversee
several core WIOA programs and therefore submitted responses on behalf of more than one program.
Response rates are shown in table 1.1.
9 We also conducted an online qualitative information collection and discussions with a set of employers. Because
of the global pandemic, we received a small number of responses on the employer information collection form and our requests for additional informal conversations with employers. Results from the online qualitative information collection form and six employer consultations yielded limited information and were excluded from the study findings.
M E A S U R I N G T H E E F F E C T I V E N E S S O F S E R V I C E S T O E M P L O Y E R S 1 1
TABLE 1.1
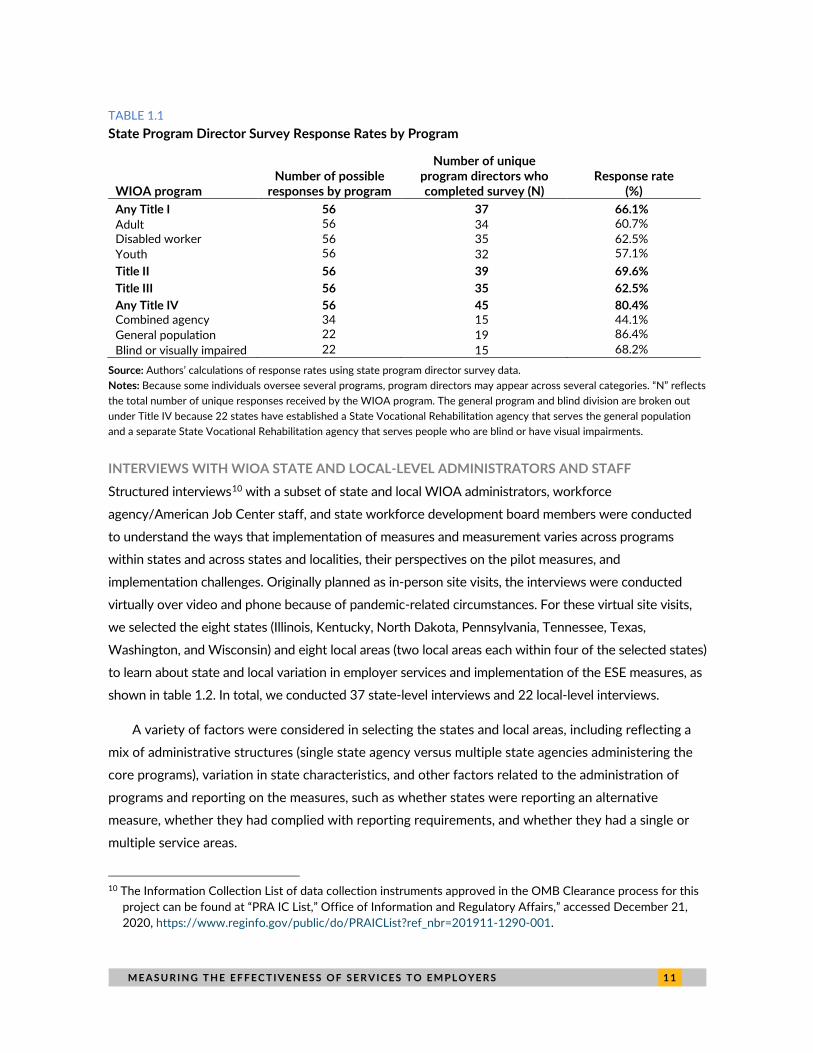
State Program Director Survey Response Rates by Program
WIOA program Number of possible
responses by program
Number of unique program directors who completed survey (N)
Response rate (%)
Any Title I 56 37 66.1% Adult 56 34 60.7% Disabled worker 56 35 62.5% Youth 56 32 57.1% Title II 56 39 69.6% Title III 56 35 62.5% Any Title IV 56 45 80.4% Combined agency 34 15 44.1% General population 22 19 86.4% Blind or visually impaired 22 15 68.2%
Source: Authors’ calculations of response rates using state program director survey data. Notes: Because some individuals oversee several programs, program directors may appear across several categories. “N” reflects the total number of unique responses received by the WIOA program. The general program and blind division are broken out under Title IV because 22 states have established a State Vocational Rehabilitation agency that serves the general population and a separate State Vocational Rehabilitation agency that serves people who are blind or have visual impairments.
INTERVIEWS WITH WIOA STATE AND LOCAL-LEVEL ADMINISTRATORS AND STAFF Structured interviews10 with a subset of state and local WIOA administrators, workforce
agency/American Job Center staff, and state workforce development board members were conducted
to understand the ways that implementation of measures and measurement varies across programs
within states and across states and localities, their perspectives on the pilot measures, and
implementation challenges. Originally planned as in-person site visits, the interviews were conducted
virtually over video and phone because of pandemic-related circumstances. For these virtual site visits,
we selected the eight states (Illinois, Kentucky, North Dakota, Pennsylvania, Tennessee, Texas,
Washington, and Wisconsin) and eight local areas (two local areas each within four of the selected states)
to learn about state and local variation in employer services and implementation of the ESE measures, as
shown in table 1.2. In total, we conducted 37 state-level interviews and 22 local-level interviews.
A variety of factors were considered in selecting the states and local areas, including reflecting a
mix of administrative structures (single state agency versus multiple state agencies administering the
core programs), variation in state characteristics, and other factors related to the administration of
programs and reporting on the measures, such as whether states were reporting an alternative
measure, whether they had complied with reporting requirements, and whether they had a single or
multiple service areas.
10 The Information Collection List of data collection instruments approved in the OMB Clearance process for this
project can be found at “PRA IC List,” Office of Information and Regulatory Affairs,” accessed December 21, 2020, https://www.reginfo.gov/public/do/PRAICList?ref_nbr=201911-1290-001.
1 2 M E A S U R I N G T H E E F F E C T I V E N E S S O F S E R V I C E S T O E M P L O Y E R S
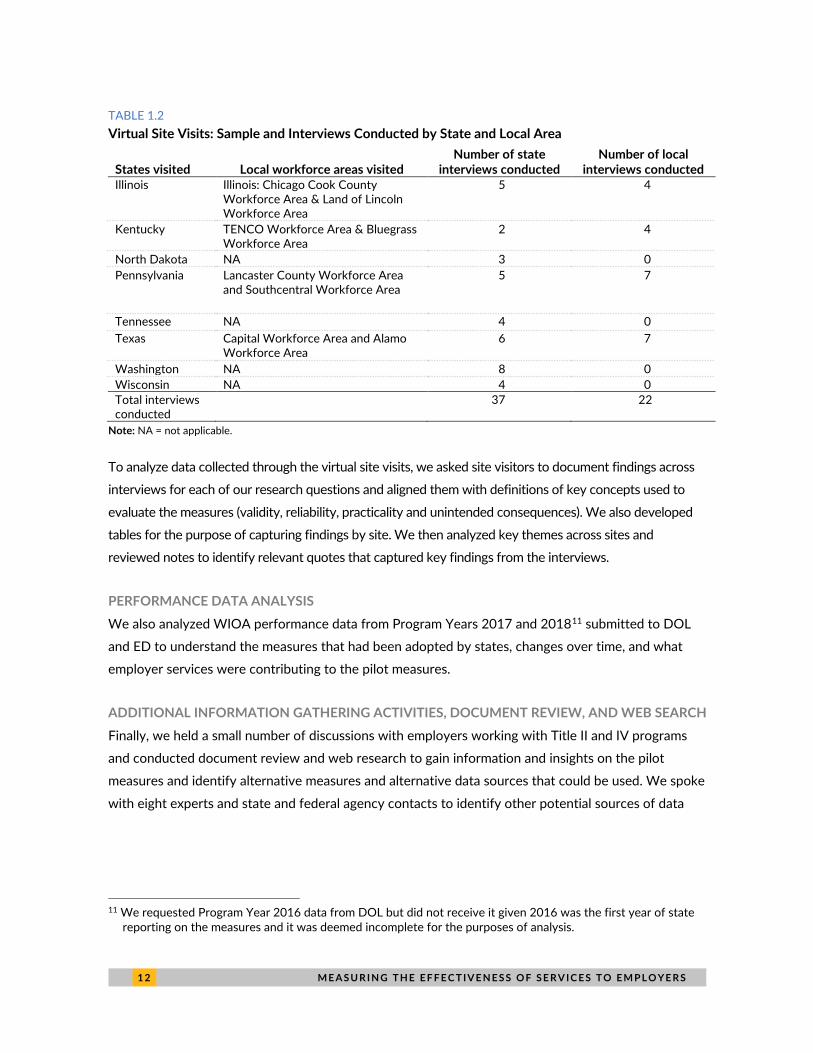
TABLE 1.2
Virtual Site Visits: Sample and Interviews Conducted by State and Local Area
States visited Local workforce areas visited Number of state
interviews conducted Number of local
interviews conducted Illinois Illinois: Chicago Cook County
Workforce Area & Land of Lincoln Workforce Area
5 4
Kentucky TENCO Workforce Area & Bluegrass Workforce Area
2 4
North Dakota NA 3 0 Pennsylvania Lancaster County Workforce Area
and Southcentral Workforce Area 5 7
Tennessee NA 4 0 Texas Capital Workforce Area and Alamo
Workforce Area 6 7
Washington NA 8 0 Wisconsin NA 4 0 Total interviews conducted
37 22
Note: NA = not applicable.
To analyze data collected through the virtual site visits, we asked site visitors to document findings across
interviews for each of our research questions and aligned them with definitions of key concepts used to
evaluate the measures (validity, reliability, practicality and unintended consequences). We also developed
tables for the purpose of capturing findings by site. We then analyzed key themes across sites and
reviewed notes to identify relevant quotes that captured key findings from the interviews.
PERFORMANCE DATA ANALYSIS We also analyzed WIOA performance data from Program Years 2017 and 201811 submitted to DOL
and ED to understand the measures that had been adopted by states, changes over time, and what
employer services were contributing to the pilot measures.
ADDITIONAL INFORMATION GATHERING ACTIVITIES, DOCUMENT REVIEW, AND WEB SEARCH Finally, we held a small number of discussions with employers working with Title II and IV programs
and conducted document review and web research to gain information and insights on the pilot
measures and identify alternative measures and alternative data sources that could be used. We spoke
with eight experts and state and federal agency contacts to identify other potential sources of data
11 We requested Program Year 2016 data from DOL but did not receive it given 2016 was the first year of state
reporting on the measures and it was deemed incomplete for the purposes of analysis.
M E A S U R I N G T H E E F F E C T I V E N E S S O F S E R V I C E S T O E M P L O Y E R S 1 3
that could be used to assess the validity, reliability, practicality, and unintended consequences of the
current measures or any alternative measures of effectiveness of services to employers.12
Limitations
The COVID-19 pandemic created several limitations to the study. Most notably, low response rates on
the state program director survey, as well as the lack of participation of employers in data collection,
may be attributable to massive shifts in business operations, closure of service-related industries, and
emergency measures across communities and industries because of the pandemic. To increase survey
response rates, we extended the period of data collection and used several outreach methods to
increase survey response, including follow-up emails and phone calls from the study team, as well as
through our partners. In addition to National Association of State Workforce Agencies (NASWA) and
the DirectEmployers Association, we coordinated with the National Association of State Directors of
Adult Education and the Council of State Administrators of Vocational Rehabilitation to reach Title II
and Title IV program directors, respectively. In addition, the team conducted site visit interviews
virtually, rather than in-person as planned, which meant we could not observe employer services or
conduct interviews in the context of the services being delivered and could not conduct focus groups.
In one local area, we had difficulty scheduling interviews, potentially because of challenges related to
the pandemic.
A second limitation of the study is the timing of data collection. The findings are based on the
perspectives of states’ experiences collecting data and reporting on the selected measures during the
pilot period, as states were refining and, in some cases, developing new data systems and processes to
more completely and effectively collect required data. Still in a pilot period, states have not yet faced
consequences for the measures they have reported. Thus, how states responded to the measures
outside the pilot phase is likely different than how they would have if there were penalties connected
to performance.
12 As described, results from the online qualitative information collection form and six employer consultations
yielded limited information and were excluded from the study findings.

Chapter 2: Evolution of Employer Services Requirements and Performance Measurement Approaches This section provides a brief history of employer services provided in the public workforce system and
information on prior measurement approaches through enactment of WIOA in 2014. It also describes
the statutory provisions that govern service delivery across core WIOA programs, noting changes over
time. It lays the groundwork and context for our discussion of findings about employer services
provided, measurement approaches utilized, and potential measures and data sources for future
consideration.
2.1 History of Requirements for Providing Services to Employers via the Public Workforce System The public workforce system under WIOA is aimed at achieving two primary goals: (1) job seekers
have access to employment, education, and training support services to succeed in the labor market,
and (2) employers are matched with the skilled workers they need to compete in the global economy.
The federal public workforce system has a long history of providing services to employers. Box 4
describes key services historically provided by the federal workforce system by highlighting key pieces
of legislation over time.
BOX 4 Key Public Workforce System Legislation and Description of Employer Service Delivery in Statute
Comprehensive Employment and Training Act. Before the Comprehensive Employment and Training Act, there was no statutory recognition of the business role in the design or implementation of federal workforce programs (Guttman 1983). Title VII amendments to the act passed in 1978 established Private Industry Councils as part of federal policy. Private Industry Councils increased the involvement of businesses and the private sector in the development and implementation of public employment and training activities.
Job Training Partnership Act. When the Comprehensive Employment and Training Act was replaced by the Job Training Partnership Act in 1982, the new legislation gave state and local
M E A S U R I N G T H E E F F E C T I V E N E S S O F S E R V I C E S T O E M P L O Y E R S 1 5
governments more discretion over the administration of federal training programs (Barnow and Spaulding 2015). As part of the enactment of the Job Training Partnership Act, Private Industry Councils were required to have majority representation from the business community and became partners in the local administration of workforce programs, providing a more substantial role for the private sector in Local Workforce Development Boards in the administration of workforce program services. Businesses also played a role at the state level and were required members of State Job Training Coordinating Councils.
Workforce Investment Act of 1998. This act, public law 105-220, further expanded the role of businesses in the public workforce system by giving local boards—renamed Workforce Investment Boards—the authority to set local policy (Barnow and Spaulding 2015, 234). The Workforce Investment Boards remained majority-employer led at the state and local levels (Barnow and Spaulding 2015). The legislation authorized education and training entities to deliver programs and activities in partnership with the American Job Center system.
Workforce Innovation and Opportunity Act (WIOA). Passed in 2014, public law 113-128 brought about the first major structural changes in the public workforce development system in the US in more than 15 years. It builds on the network of One-Stop Career Centers under WIA (renamed American Job Centers) to align services to employers and job seekers more seamlessly for customers of each of the six WIOA core programs. The law accomplishes this through increased integration of service delivery at the state, regional, and local levels; across American Job Center partners; and via shared performance accountability requirements.a
a “Training and Employment Guidance Letter No. 16-16, One-Stop Operating Guidance for the Workforce Innovation and Opportunity Act,” US Department of Labor, created January 18, 2017, https://wdr.doleta.gov/directives/attach/TEGL/TEGL_16-16.pdf; “Training and Employment Guidance Letter No. 10-16, Change 1,” US Department of Labor, August 23, 2017, https://wdr.doleta.gov/directives/corr_doc.cfm?DOCN=3255; “Program Memorandum (PM) 17-2.” US Department of Education, August 23, 2017, https://www2.ed.gov/about/offices/list/ovae/pi/AdultEd/octae-program-memo-17-2.pdf; and “Technical Assistance Circular (TAC) 17-01,” US Department of Education, August 17, 2017.
Before enactment of WIOA, WIA also mandated that the public workforce system serve both job
seekers and employers as part of a dual customer approach.13 Networks of One-Stop Career Centers14
across the US were established as part of WIA Title I to provide points of access to services for all
individuals with training and employment needs (Bradley 2013). Services included those funded and
administered at the federal level by DOL and other agencies, including ED and the US Department of
13 “Workforce Investment Act of 1998,” Pub. L. No. 105-220, 112 Stat. 936 (1998). 14 “American Job Center” is the current term used under WIOA to describe One-Stop Career Centers by
workforce practitioners.
1 6 M E A S U R I N G T H E E F F E C T I V E N E S S O F S E R V I C E S T O E M P L O Y E R S
Health and Human Services (NSC 2011). “Business Services”15 representatives at One-Stop Career
Centers across the US offered a variety of customized training resources and employer services to
businesses, often in partnership with the Employment Service under Title III.
Over the past 20 years, DOL has also sponsored several competitive grant programs with federal
funds that are focused on more effectively connecting the workforce system to businesses’ workforce
needs. For example, the High Growth Job Training Initiative Program (2001–06) and the Community-
Based Job Training Grant Program (2005–09), two DOL initiatives, included a focus on business
engagement and services (Eyster, Durham, and Anderson 2016). The Trade Adjustment Assistance
Community College and Career Training Grant Program (2012–18), a $2 billion federal investment
aimed at increasing the capacity of community colleges in every state, also emphasized the
involvement of employers and industry representatives. Through the Trade Adjustment Assistance
Community College and Career Training grants, employer and industry groups sit on the committees
of local community college and technical training programs and inform the development of curriculum
that reflects the needs of the community served by the community college. Evaluations of these
efforts demonstrated the importance of employer partnerships in designing successful training for in-
demand occupations (Nightingale et al. 2008; Eyster et al. 2013; Scott et al. 2018; Barnow and
Spaulding 2015).
Requirements Governing Employer Service Delivery: WIOA Core Programs
WIOA TITLE I
WIOA’s statutory requirements16 mandated an increased focus on serving employers, including
requirements that all core programs be held accountable for reporting on their effectiveness in serving
employers. State formula grant funds flow to local areas to target service delivery based on the
education and training needs of specific regions and localities. WIOA builds on the American Job
Center network under WIA to align services to employers and job seekers more seamlessly for
customers of the six WIOA core programs. It accomplishes this through increased integration of
15 “Business services” are defined in “What are the business services provided through the one-stop delivery
system, and how are they provided?” 34 CFR 361.435, https://www.law.cornell.edu/cfr/text/34/361.435# 16 “Workforce Innovation and Opportunity Act,” Pub. L. No. 113-128, 128 Stat. 1425 (2014).
M E A S U R I N G T H E E F F E C T I V E N E S S O F S E R V I C E S T O E M P L O Y E R S 1 7
service delivery at the state, regional, and local levels, across American Job Center partners, and
through shared performance accountability requirements.17
In addition to the state formula grant programs funded under WIOA Title I—for youth, adult, and
dislocated worker training and employment activities—several national programs18 and the Job Corps
are authorized under Title I of WIOA (Bradley 2015). The Job Corps, Native American Programs,
Migrant and Farmworker Programs, and YouthBuild must also report on one of the ESE measures,
Retention with the Same Employer.
WIOA also describes additional funding reserved for the governor of each state to support
statewide employment and training activities. These are funds that can be used to implement
programs and strategies to meet the needs of employers in a state; they include
incumbent worker training programs,
customized training,
sectoral and industry cluster strategies,
industry or sector partnerships,
career pathway programs,
microenterprise and entrepreneurial training and support programs,
utilization of effective business intermediaries,
layoff aversion strategies, and
activities to improve linkages between American Job Centers and all employers.
17 TEGL 16-16, describing one-stop operations guidance for the American Job Center network, was issued jointly
by DOL’s Employment and Training Administration, ED’s Office of Career Training and Adult Education and its Rehabilitation Services Administration, and the US Department of Health and Human Services’ Administration for Children and Families. See “Training and Employment Guidance Letter No. 16-16, One-Stop Operating Guidance for the Workforce Innovation and Opportunity Act,” US Department of Labor, created January 18, 2017, https://wdr.doleta.gov/directives/attach/TEGL/TEGL_16-16.pdf; and “Training and Employment Guidance Letter No. 10-16, Change 1,” US Department of Labor, August 23, 2017, https://wdr.doleta.gov/directives/corr_doc.cfm?DOCN=3255.
18 Native American Programs, Migrant and Seasonal Farmworker Program, Technical Assistance, Evaluations and Research, National Dislocated Worker Grants, and YouthBuild Program.
1 8 M E A S U R I N G T H E E F F E C T I V E N E S S O F S E R V I C E S T O E M P L O Y E R S
DOL’s Employment and Training Administration has also encouraged states to use WIOA Title I
funding to support Registered Apprenticeship programs in high-demand fields (TEGL 13-16).19
Services that may be available for employers to support apprenticeship activities include contracted
classes with an Eligible Training Provider to train a cohort of potential apprentices; leveraging
supportive services for supplies apprentices need; customized training; on-the-job training; and
incumbent worker training.20
WIOA TITLE II Although Title II programs are required to report on the ESE measures, these programs are less
focused on services to employers than other core programs. In fact, there is no explicit statutory
requirement for serving employers, nor does the statute include employer services in its definition of
required local activities, though ED’s Office of Career Training and Adult Education has encouraged
such partnerships, such as through development of a toolkit for building partnerships, including tools
for educators and employers.21 WIOA Title II programs offer one such way to collaborate, helping to
further the alignment of adult education programs with employer demand. In particular, employers
have the opportunity under WIOA to partner with education providers to design educational
opportunities for low-skilled workers, addressing their developmental and essential skills needs.22
WIOA TITLE III The Title III Employment Service, authorized under the Wagner-Peyser Act and amended by WIOA,23 is a
key component of most states’ service delivery to job seekers and employers under the workforce system
and operates via offices colocated at American Job Centers (Bradley 2015). This colocation of the
Employment Service within American Job Centers is a significant change from WIA, which allowed
19 “Guidance on Registered Apprenticeship Provisions and Opportunities in the Workforce Innovation and
Opportunity Act,” TEGL 13-16, US Department of Labor, Employment and Training Administration, January 12, 2017, https://wdr.doleta.gov/directives/attach/TEGL/TEGL_13-16.pdf.
20 “Guidance on Registered Apprenticeship Provisions and Opportunities in the Workforce Innovation and Opportunity Act,” TEGL 13-16, US Department of Labor, Employment and Training Administration, January 12, 2017, https://wdr.doleta.gov/directives/attach/TEGL/TEGL_13-16.pdf.
21 “Tools for Building Employer-Educator Partnerships,” Literacy Information and Communication System, accessed June 29,2018, https://lincs.ed.gov/employers/.
22 “Fact Sheet: Workforce Resources for Employers,” US Department of Labor, Employment and Training Administration, accessed December 23, 2020, https://www.doleta.gov/business/pdf/Factsheet_Resources_for_Employers.pdf.
23 “Workforce Innovation and Opportunity Act,” Pub. L. No. 113-128, 128 Stat. 1425 (2014).
M E A S U R I N G T H E E F F E C T I V E N E S S O F S E R V I C E S T O E M P L O Y E R S 1 9
separate, stand-alone Employment Service offices.24 This is one example of how WIOA legislation has
helped shift the workforce system toward integrated service delivery to employers across core programs.
WIOA TITLE IV
Title I of the Rehabilitation Act of 1973, as amended by Title IV of WIOA, expands the scope of
services that State VR agencies may provide to employers, including activities that educate and serve
employers who help individuals with disabilities achieve competitive integrated employment. There
are also Title IV state planning requirements under WIOA that are aimed at helping states build
relationships with employers, through their interactions within the public workforce system and with
employers directly.25 This can involve working with employers to provide opportunities for work-
based learning experiences26 and opportunities for pre-employment transition services, training
employees with disabilities, and promoting awareness of disability-related obstacles to continued
employment. VR agencies may also assist employers with hiring or providing accommodations for
individuals with disabilities.
Mirroring the shifts described in this section to include employers as customers of the workforce
system, performance measures also have evolved to encompass both measurement of services
provided to job seekers and to employers. The next section briefly describes the evolution of employer
services measurement approaches before WIOA to the present day.
2.2 Measuring the Effectiveness of Employer Services Although the public workforce system has long had performance measures related to the goals for job
seekers, efforts to systematically measure achievement of goals for employers are more recent. This
24 Under WIA, Title III Employment Services were encouraged to be offered via integrated one-stops, but
colocation was not a requirement. 25 “Overview and Discussion of Federal Regulations on Services to Businesses,” presentation by US Department
of Education, Office of Special Education and Rehabilitative Services, Rehabilitation Services Administration, accessed December 23, 2020, https://www2.ed.gov/about/offices/list/osers/rsa/publications/csavr-2016-services-to-business.pdf.
26 “Work-based learning experiences” do not include Registered Apprenticeships but do include internships, short-term employment, apprenticeships, and fellowships. This is because apprenticeships as defined by Title I of the Rehabilitation Act are designed to provide individuals and students with disabilities with work-based learning and career exploration opportunities. See: “Overview and Discussion of Federal Regulations on Services to Businesses,” presentation by US Department of Education, Office of Special Education and Rehabilitative Services, Rehabilitation Services Administration, accessed December 23, 2020, https://www2.ed.gov/about/offices/list/osers/rsa/publications/csavr-2016-services-to-business.pdf.
2 0 M E A S U R I N G T H E E F F E C T I V E N E S S O F S E R V I C E S T O E M P L O Y E R S
section describes the evolution of performance measurement both before and as a result of the passage
of WIOA to provide context for efforts to identify new indicators of effectiveness in serving employers.
Before WIOA
Performance measurement in federal government programs became statutorily mandated in 1993 under
the Government Performance and Results Act, although the implementation of performance measures in
some federal programs, including workforce programs administered by DOL, began in the 1970s (Barnow
and Smith 2009). The Comprehensive Employment and Training Act, in effect from 1973 through 1982,
included performance indicators for employment outcomes, and the Job Training Partnership Act, in effect
from 1982 through 1998, more formally included financial incentives for service delivery areas that
performed well on labor market outcome levels relative to performance measure standards (Barnow and
Smith 2004). The Job Training Partnership Act also required the measurement of program outcomes
relative to cost (Barnow and Smith 2004). However, neither piece of legislation required performance
accountability measures of engagement with employers or business service provision.
As part of a shift with the enactment of WIA to include employers as customers of the workforce
system, performance measures also changed to encompass both measurement of services provided to
job seekers and to employers.27 One of the 17 performance accountability outcomes established for
Title I-B programs28 under WIA was a requirement to track customer satisfaction of employers served
by the workforce system (Dunham et al. 2006). A customer satisfaction outcome for participants was
also established. To collect information on customer satisfaction, WIA section 136(b)(2)(B) required
each state to administer customer satisfaction surveys to employers and participants (jobseekers)
served by state and local agency programs where education and training was provided. DOL selected
the American Customer Satisfaction Index as the customer satisfaction survey instrument. The
department required a 70 percent response rate29 to the three federally required questions on the
survey (box 5).
27 “Workforce Investment Act of 1998,” Pub. L. No. 105-220, 112 Stat. 936 (1998). 28 Adult, Dislocated Worker, Older Youth, and Younger Youth programs. 29 Response rate was calculated as the number of respondents with complete customer satisfaction information
divided by the total number in the sample.
M E A S U R I N G T H E E F F E C T I V E N E S S O F S E R V I C E S T O E M P L O Y E R S 2 1
BOX 5 Required Questions from the American Customer Satisfaction Index
1. Utilizing a scale of 1 to 10, where “1” means “Very Dissatisfied” and “10” means “Very Satisfied,” what is your overall satisfaction with the services provided from [Service Provider Name]?
2. Considering all of the expectations you may have had about the services, to what extent have the services met your expectations? “1” now means “Falls Short of Your Expectations” and “10” means “Exceeds Your Expectations.”
3. Now think of the ideal program for people in your circumstances. How well do you think the services you received compare with the ideal set of services? “1” now means “Not Very Close to the Ideal” and “10” means “Very Close to the Ideal.”
Source: “Customer Satisfaction Survey Technical Assistance Guide,” last revised May 2004, http://labor.idaho.gov/wia1/tags/customersatisfactiontag.doc.
To score the survey, the weighted average of participant ratings on the three core American
Customer Satisfaction Index questions' values were transformed into 0 to 100 score values, with
specific weighted factors developed for each state (Bradley 2013). New weighting factors for each
state were published annually. State and local agencies could also add their own questions on
employer satisfaction and include other groups of employers in the pool of customers as part of their
state assessment of customer satisfaction under WIA. Some examples of state and local employer
customer satisfaction methodologies were included in states’ Program Year 2013 annual reports. For
example, Kentucky asked employer customers visiting One-Stop Career Centers who received
workforce services to respond to questions regarding the reason for the visit and whether their needs
were met (Kentucky Workforce Investment Board 2014). Such questions included (1) “How
convenient are our business services to use?” (2) “How professional are our business services staff?”
(3) “How knowledgeable were the business services staff?” and (4) “How responsive was our business
services staff?”
In addition, the San Diego Workforce Partnership (2015) commissioned a third-party online survey
of five client types to better understand customer satisfaction within the workforce system from June
12 to July 29, 2015. Results are published in a November 2015 report, detailing results of a sampling
of employers (small, medium, and large) from 14 sectors, most of which accessed services from the
North County Coastal Career Center. Business services accessed by employers included a range of
activities from customized recruitment to job fairs and customized training.
2 2 M E A S U R I N G T H E E F F E C T I V E N E S S O F S E R V I C E S T O E M P L O Y E R S
Beginning in 2005, the Employment and Training Administration at DOL started approving waivers
to support implementation of six Common Measures, a subset of the 17 performance measures that
constituted the WIA performance accountability system. Each of the six performance measures had
reporting requirements applicable to Title I-B grantees and programs (WIA), the Employment Service
(Wagner-Peyser Act), the Jobs for Veterans State Grants, and Trade Adjustment Assistance programs.30
Other programs authorized under WIA, Adult Education, and Vocational Rehabilitation programs were
not required to report on the measures. These measures became the basis of performance accountability
for the workforce system,31 unless a state did not request a waiver to report only on common
performance measure outcomes, and included the following six measures: Entered Employment Rate,
Employment Retention Rate, and Average Earnings (which apply to Adult and Dislocated Worker
programs), and Placement in Employment, Education, or Training; Attainment of a Degree or Certificate;
and Literacy and Numeracy Gains (which apply to Youth Programs).
Customer satisfaction measures were not included in the common performance measures. As of
Program Year 2013, all but four states had a waiver to implement only the common performance
measures, “resulting in significantly limited access to customer satisfaction data at the national level.”32
Waivers submitted by states and publicly available online provide insight into why some states
decided to opt out of the administering the customer satisfaction survey to employers.33 States
reported challenges to survey administration, including the cost of administering the surveys by
phone—a requirement based on instructions by DOL—and the time burden on state workforce staff
and employers associated with responding to the survey.
30 Trade Adjustment Assistance programs implemented Common Measures on October 1, 2005. All other
programs implemented the requirements on July 1, 2005. See TEGL 17-05 at “Common Measures Policy for the Employment and Training Administration’s Performance Accountability System and Related Performance Issues,” TEGL 17-05, US Department of Labor, Employment and Training Administration, February 17, 2006, https://wdr.doleta.gov/directives/attach/TEGL17-05.pdf.
31 “Guidance for Implementation of the Workforce Investment Act and Wagner-Peyser Act Funding in the American Recovery and Reinvestment Act of 2009 and State Planning Requirements for Program Year 2009,” TEGL 14-08, US Department of Labor, Employment and Training Administration, March 18, 2009, https://wdr.doleta.gov/directives/attach/TEGL/TEGL14-08.pdf.
32 “Workforce Investment Act Program Year 2013 Annual Report Narrative,” TEGL 9-14, US Department of Labor, Employment and Training Administration, October 8, 2014, https://wdr.doleta.gov/directives/attach/TEGL/TEGL-9-14.pdf.
33 “Hawaii State Request for a Waiver: Waiver from the Requirement to Conduct WIA Customer Satisfaction Surveys Only over the Phone per WIA Section 136 and WIA Final Rule CFR Part 666 and USDOL ETA TEGL 36-10,” Hawaii Department of Labor and Industrial Relations, April 16, 2012, http://labor.hawaii.gov/wdc/files/2013/01/WaiverFromConductingTelephoneInterviews_033012.pdf
M E A S U R I N G T H E E F F E C T I V E N E S S O F S E R V I C E S T O E M P L O Y E R S 2 3
Changes under WIOA to Assess Effectiveness in Serving Employers
Enactment of WIOA in 2014 brought major statutory changes to the administration of programs in the
public workforce system, including the designation of six core programs34 and the establishment of
new primary indicators of performance for these core programs. WIOA requires an indicator of the
effectiveness of services provided to employers as one of these primary indicators of performance.
The legislation directed DOL and ED to define this indicator.35 Public comments were solicited as part
of an Information Collection Request on WIOA Common Performance Reporting in April 2016, and in
response to these activities, DOL and ED determined there was insufficient consensus to proceed
with a single definition for the indicator and that several approaches would be piloted once the WIOA
joint final rule took effect in October 2016.
As such, the departments piloted three measures to assess the effectiveness of employer services
provided by the workforce system. This pilot was designed to help inform the departments on the
pros, cons, and trade-offs of the pilot indicators to track outcomes on employer service delivery.
States had flexibility during this pilot period to test approaches that best suit their needs. Rather than
requiring feedback directly from employers, the ESE indicators required state agencies and program
staff to collect information on the pilot indicators.
TEGL 10-16, Change 1,36 “Performance Accountability for the Workforce Innovation and Opportunity
Act,” describes the three national pilot measures in detail. Each of the three piloted ESE measures require
states to track performance and report shared outcomes across core programs of WIOA (box 6).
BOX 6 ESE Measures Were Designed to Capture Shared Outcomes across All Core WIOA Programs
As described in TEGL 10-16, Change 1; PM 17-2; TAC 17-01; and section 116(b)(2)(A)(i)(VI) of WIOA, the Departments of Labor and Education determined that the effectiveness in serving employers indicator and pilot measures “will be measured as a shared outcome across all six core programs within each State to ensure a holistic approach to serving employers.”
34 WIOA Title I Adult Program, Title I Dislocated Worker Program, Title I Youth Program, Title II Adult Education
Program, Title III Wagner-Peyser Employment Service, Title IV Vocational Rehabilitation Program (combined, general and services for the blind).
35 Described in section 116(b)(2)(A)(iv) of “Workforce Innovation and Opportunity Act,” Pub. L. No. 113-128, 128 Stat. 1425 (2014).
36 Program Memorandum 17-2 and Rehabilitation Services Administration (RSA) Technical Assistance Circular (TAC) 17-1
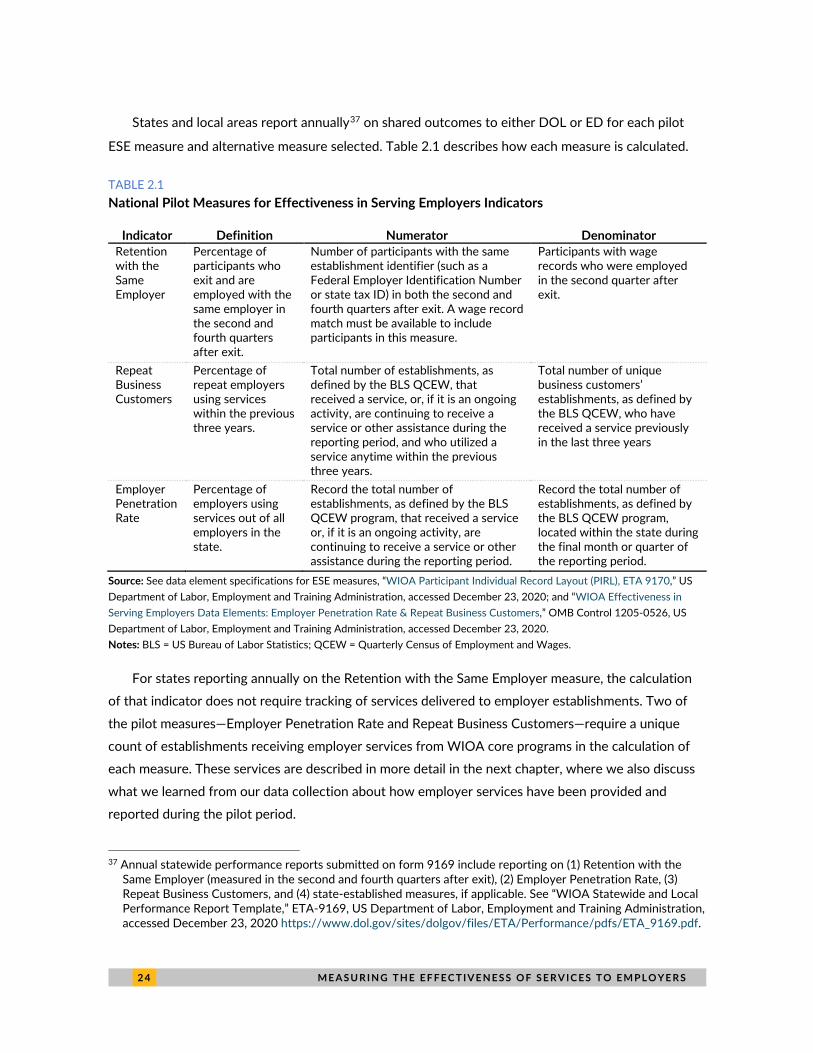
2 4 M E A S U R I N G T H E E F F E C T I V E N E S S O F S E R V I C E S T O E M P L O Y E R S
States and local areas report annually37 on shared outcomes to either DOL or ED for each pilot
ESE measure and alternative measure selected. Table 2.1 describes how each measure is calculated.
TABLE 2.1
National Pilot Measures for Effectiveness in Serving Employers Indicators
Indicator Definition Numerator Denominator Retention with the Same Employer
Percentage of participants who exit and are employed with the same employer in the second and fourth quarters after exit.
Number of participants with the same establishment identifier (such as a Federal Employer Identification Number or state tax ID) in both the second and fourth quarters after exit. A wage record match must be available to include participants in this measure.
Participants with wage records who were employed in the second quarter after exit.
Repeat Business Customers
Percentage of repeat employers using services within the previous three years.
Total number of establishments, as defined by the BLS QCEW, that received a service, or, if it is an ongoing activity, are continuing to receive a service or other assistance during the reporting period, and who utilized a service anytime within the previous three years.
Total number of unique business customers’ establishments, as defined by the BLS QCEW, who have received a service previously in the last three years
Employer Penetration Rate
Percentage of employers using services out of all employers in the state.
Record the total number of establishments, as defined by the BLS QCEW program, that received a service or, if it is an ongoing activity, are continuing to receive a service or other assistance during the reporting period.
Record the total number of establishments, as defined by the BLS QCEW program, located within the state during the final month or quarter of the reporting period.
Source: See data element specifications for ESE measures, “WIOA Participant Individual Record Layout (PIRL), ETA 9170,” US Department of Labor, Employment and Training Administration, accessed December 23, 2020; and “WIOA Effectiveness in Serving Employers Data Elements: Employer Penetration Rate & Repeat Business Customers,” OMB Control 1205-0526, US Department of Labor, Employment and Training Administration, accessed December 23, 2020. Notes: BLS = US Bureau of Labor Statistics; QCEW = Quarterly Census of Employment and Wages.
For states reporting annually on the Retention with the Same Employer measure, the calculation
of that indicator does not require tracking of services delivered to employer establishments. Two of
the pilot measures—Employer Penetration Rate and Repeat Business Customers—require a unique
count of establishments receiving employer services from WIOA core programs in the calculation of
each measure. These services are described in more detail in the next chapter, where we also discuss
what we learned from our data collection about how employer services have been provided and
reported during the pilot period.
37 Annual statewide performance reports submitted on form 9169 include reporting on (1) Retention with the
Same Employer (measured in the second and fourth quarters after exit), (2) Employer Penetration Rate, (3) Repeat Business Customers, and (4) state-established measures, if applicable. See “WIOA Statewide and Local Performance Report Template,” ETA-9169, US Department of Labor, Employment and Training Administration, accessed December 23, 2020 https://www.dol.gov/sites/dolgov/files/ETA/Performance/pdfs/ETA_9169.pdf.
M E A S U R I N G T H E E F F E C T I V E N E S S O F S E R V I C E S T O E M P L O Y E R S 2 5
Chapter 3: How the Public Workforce System Provides Services to Employers This chapter describes findings from state performance data for Program Year 2018, the state program
director survey, and interviews with state and local WIOA administrators38 conducted in February to May
2020 about their experiences providing services to employers. We collected this data to answer the first
set of research questions, “How are “services to employers” operationalized within and across WIOA’s
core programs, and how do they vary across states, regions, and local areas?”
The following are the key findings for Chapter 3:
According to Program Year 2018 federally reported performance data submitted by states on the
ESE measures, services delivered to employer establishments across all states and territories in
Program Year 2018 were concentrated in two categories: Workforce Recruitment Assistance (56
percent) and Employer Information and Support Services (30 percent).
In the site visit and state program director survey data, we found considerable variation in the
services provided to employers across WIOA’s core programs; this variation is primarily tied to the
service population and strategic priorities of each core WIOA program. Title II and Title IV
programs tend to more narrowly focus on intensive engagement with fewer employers and, in
practice, contribute less to the overall counts of services provided to employer establishments.
Some Title II staff also indicated that they viewed serving employers as outside of their core
mission, given there is no authority in the Title II statute for serving employers.
State and local staff across WIOA programs indicated that the categories of employer services
described in the performance accountability guidance for the pilot measures39 were adequate for
the purposes of performance reporting but were not without limitations. These limitations include
a lack of specificity about reporting guidance to share with local program staff and contracted
partners, different goals for serving employers across core programs, and that the service
definitions do not consider variation in service delivery across programs or the length of
interaction or depth of interaction with an employer. These limitations may affect how well the
definitions of business services used for reporting correspond to the services provided to
employers across WIOA’s six core programs.
38 Excerpts from our interview data can be found throughout Chapters 3 and 4, with direct quotations formatted in
blue. 39 “Training and Employment Guidance Letter No. 10-16, Change 1,” US Department of Labor, August 23, 2017,
https://wdr.doleta.gov/directives/corr_doc.cfm?DOCN=3255.
2 6
These findings are informed by state performance data, interviews with state and local staff, and data
collected from open response fields on the program director survey. They may indicate that the Employer
Penetration Rate and Repeat Business Customers measures (which rely on counts of services provided to
employer establishments) are not operating in practice as shared outcome measures of the workforce
system’s effectiveness in serving employers (box 6). One reason for this could be incomplete reporting;
that is, Title II and IV data may either have not been collected by states or were not reported in a states’
annual performance report.40
Title II and IV program directors also have different goals for serving and engaging employers, as reflected
in site visit interviews conducted for this report and explored later in this chapter. Each of these findings
provide context for assessing the validity, reliability, and practicality of the ESE measures in Chapter 4.
3.1 Types of Services Provided As described, two of the three National Pilot Measures (Employer Penetration Rate and Repeat Business
Customer) require states to report on services provided by the core programs to employer establishments
across eight categories of core program services that may be counted when calculating these measures
(table 3.1). Because states are required to report on at least two of the three National Pilot Measures, all
states reporting data on the measures are using these categories of services to collect information about
the services provided to employers.
Although adult education providers under Title II maintain important employer partnerships that
respond to the skills needs of those employers, they do not have a mandate under WIOA to serve
employers as defined in TEGL 10-16, Change 1 (table 3.1).41
Definitions of “Core Program Services” Provided to Employers under Employer Penetration Rate and Repeat Business Customers Rate
Each type of employer service counted for the purposes of the Employer Penetration Rate measure and
Repeat Business Customers measure is defined in TEGL 10-16, Change 1, and adapted for table 3.1.
40 Potential reasons for incomplete reporting include (1) different interpretation of statutory requirements to report
data (e.g., Title II of WIOA does not include employer services in its definition of required local activities) and (2) administrative challenges in reporting data on a shared outcome measure across programs.
41 Except for some training services that are only allowed in integrated education and training programs, Title II funds cannot be used to support the provision of employer services. The conclusions made in this section about services provided by Title II agency personnel are informed from the program director survey and site visit data collected for this study. Through our data collection, we found evidence that Title II programs are contributing to the ESE performance data as part of their interpretation of federal guidance regarding the ESE measures.
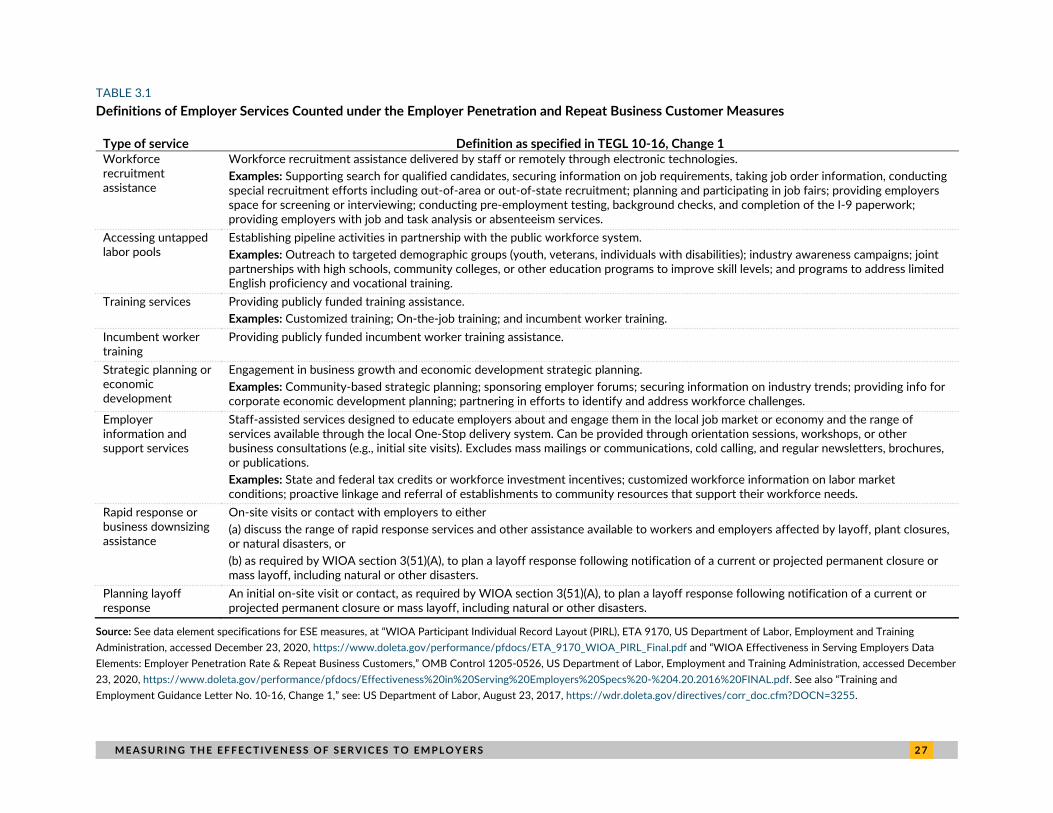
M E A S U R I N G T H E E F F E C T I V E N E S S O F S E R V I C E S T O E M P L O Y E R S 2 7
TABLE 3.1 Definitions of Employer Services Counted under the Employer Penetration and Repeat Business Customer Measures
Type of service Definition as specified in TEGL 10-16, Change 1 Workforce recruitment assistance
Workforce recruitment assistance delivered by staff or remotely through electronic technologies. Examples: Supporting search for qualified candidates, securing information on job requirements, taking job order information, conducting special recruitment efforts including out-of-area or out-of-state recruitment; planning and participating in job fairs; providing employers space for screening or interviewing; conducting pre-employment testing, background checks, and completion of the I-9 paperwork; providing employers with job and task analysis or absenteeism services.
Accessing untapped labor pools
Establishing pipeline activities in partnership with the public workforce system. Examples: Outreach to targeted demographic groups (youth, veterans, individuals with disabilities); industry awareness campaigns; joint partnerships with high schools, community colleges, or other education programs to improve skill levels; and programs to address limited English proficiency and vocational training.
Training services Providing publicly funded training assistance. Examples: Customized training; On-the-job training; and incumbent worker training.
Incumbent worker training
Providing publicly funded incumbent worker training assistance.
Strategic planning or economic development
Engagement in business growth and economic development strategic planning. Examples: Community-based strategic planning; sponsoring employer forums; securing information on industry trends; providing info for corporate economic development planning; partnering in efforts to identify and address workforce challenges.
Employer information and support services
Staff-assisted services designed to educate employers about and engage them in the local job market or economy and the range of services available through the local One-Stop delivery system. Can be provided through orientation sessions, workshops, or other business consultations (e.g., initial site visits). Excludes mass mailings or communications, cold calling, and regular newsletters, brochures, or publications. Examples: State and federal tax credits or workforce investment incentives; customized workforce information on labor market conditions; proactive linkage and referral of establishments to community resources that support their workforce needs.
Rapid response or business downsizing assistance
On-site visits or contact with employers to either (a) discuss the range of rapid response services and other assistance available to workers and employers affected by layoff, plant closures, or natural disasters, or (b) as required by WIOA section 3(51)(A), to plan a layoff response following notification of a current or projected permanent closure or mass layoff, including natural or other disasters.
Planning layoff response
An initial on-site visit or contact, as required by WIOA section 3(51)(A), to plan a layoff response following notification of a current or projected permanent closure or mass layoff, including natural or other disasters.
Source: See data element specifications for ESE measures, at “WIOA Participant Individual Record Layout (PIRL), ETA 9170, US Department of Labor, Employment and Training Administration, accessed December 23, 2020, https://www.doleta.gov/performance/pfdocs/ETA_9170_WIOA_PIRL_Final.pdf and “WIOA Effectiveness in Serving Employers Data Elements: Employer Penetration Rate & Repeat Business Customers,” OMB Control 1205-0526, US Department of Labor, Employment and Training Administration, accessed December 23, 2020, https://www.doleta.gov/performance/pfdocs/Effectiveness%20in%20Serving%20Employers%20Specs%20-%204.20.2016%20FINAL.pdf. See also “Training and Employment Guidance Letter No. 10-16, Change 1,” see: US Department of Labor, August 23, 2017, https://wdr.doleta.gov/directives/corr_doc.cfm?DOCN=3255.
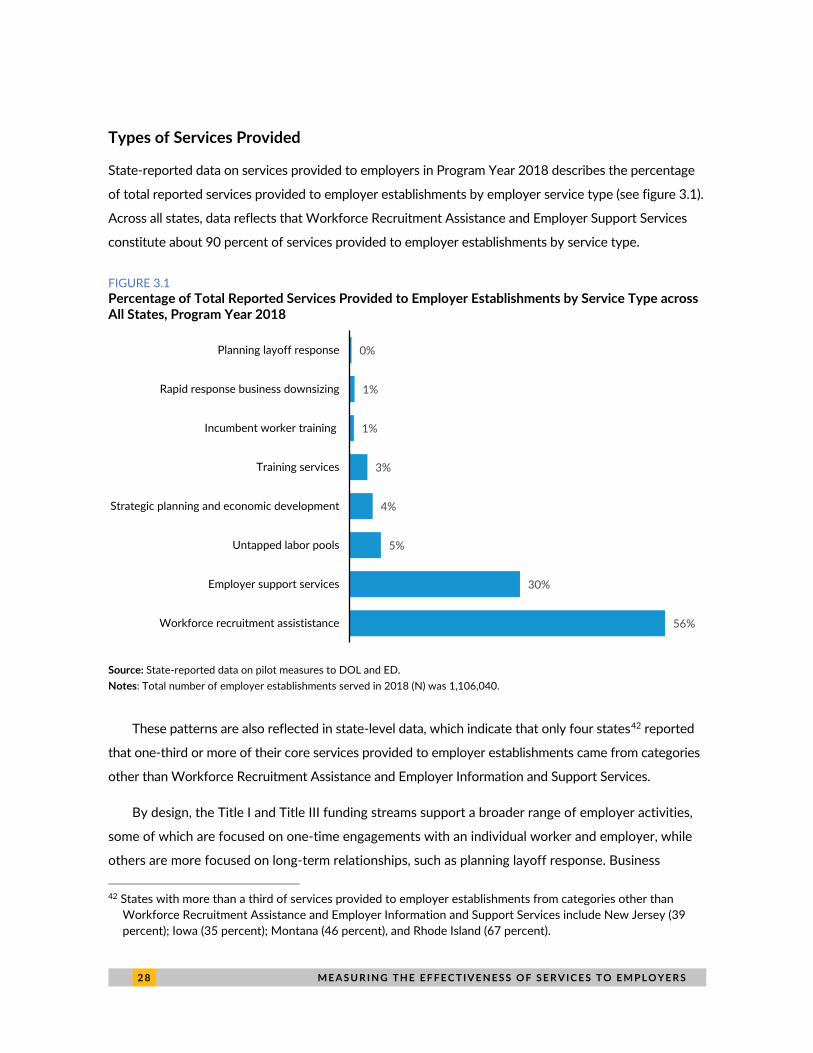
2 8 M E A S U R I N G T H E E F F E C T I V E N E S S O F S E R V I C E S T O E M P L O Y E R S
Types of Services Provided
State-reported data on services provided to employers in Program Year 2018 describes the percentage
of total reported services provided to employer establishments by employer service type (see figure 3.1).
Across all states, data reflects that Workforce Recruitment Assistance and Employer Support Services
constitute about 90 percent of services provided to employer establishments by service type.
FIGURE 3.1 Percentage of Total Reported Services Provided to Employer Establishments by Service Type across All States, Program Year 2018
Source: State-reported data on pilot measures to DOL and ED. Notes: Total number of employer establishments served in 2018 (N) was 1,106,040.
These patterns are also reflected in state-level data, which indicate that only four states42 reported
that one-third or more of their core services provided to employer establishments came from categories
other than Workforce Recruitment Assistance and Employer Information and Support Services.
By design, the Title I and Title III funding streams support a broader range of employer activities,
some of which are focused on one-time engagements with an individual worker and employer, while
others are more focused on long-term relationships, such as planning layoff response. Business
42 States with more than a third of services provided to employer establishments from categories other than
Workforce Recruitment Assistance and Employer Information and Support Services include New Jersey (39 percent); Iowa (35 percent); Montana (46 percent), and Rhode Island (67 percent).
56%
30%
5%
4%
3%
1%
1%
0%
Workforce recruitment assististance
Employer support services
Untapped labor pools
Strategic planning and economic development
Training services
Incumbent worker training
Rapid response business downsizing
Planning layoff response
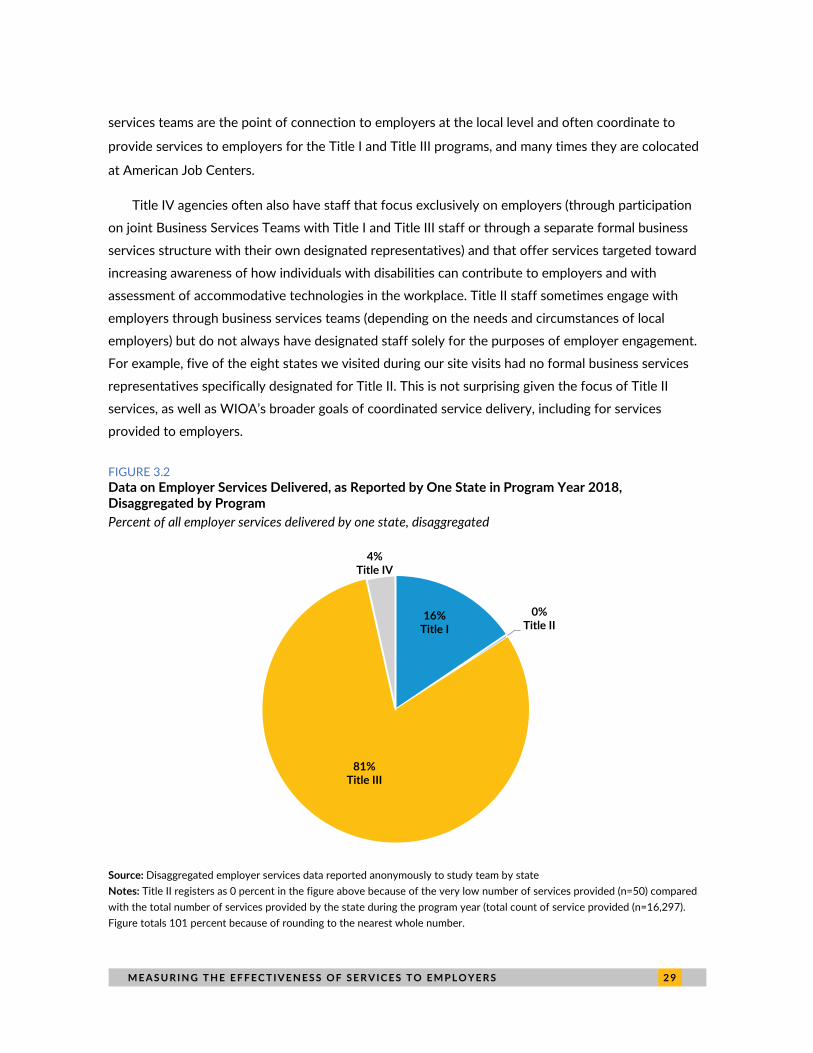
M E A S U R I N G T H E E F F E C T I V E N E S S O F S E R V I C E S T O E M P L O Y E R S 2 9
services teams are the point of connection to employers at the local level and often coordinate to
provide services to employers for the Title I and Title III programs, and many times they are colocated
at American Job Centers.
Title IV agencies often also have staff that focus exclusively on employers (through participation
on joint Business Services Teams with Title I and Title III staff or through a separate formal business
services structure with their own designated representatives) and that offer services targeted toward
increasing awareness of how individuals with disabilities can contribute to employers and with
assessment of accommodative technologies in the workplace. Title II staff sometimes engage with
employers through business services teams (depending on the needs and circumstances of local
employers) but do not always have designated staff solely for the purposes of employer engagement.
For example, five of the eight states we visited during our site visits had no formal business services
representatives specifically designated for Title II. This is not surprising given the focus of Title II
services, as well as WIOA’s broader goals of coordinated service delivery, including for services
provided to employers.
FIGURE 3.2 Data on Employer Services Delivered, as Reported by One State in Program Year 2018, Disaggregated by Program Percent of all employer services delivered by one state, disaggregated
Source: Disaggregated employer services data reported anonymously to study team by state Notes: Title II registers as 0 percent in the figure above because of the very low number of services provided (n=50) compared with the total number of services provided by the state during the program year (total count of service provided (n=16,297). Figure totals 101 percent because of rounding to the nearest whole number.
16%Title I
0%Title II
81%Title III
4%Title IV
3 0 M E A S U R I N G T H E E F F E C T I V E N E S S O F S E R V I C E S T O E M P L O Y E R S
States are currently not required to report disaggregated data on employer establishments served
by title or program. In one state that agreed to anonymously share employer services data reported
through its WIOA annual report for Program Year 2018 and disaggregated by title, the state reported
that 97 percent of the employer services provided were provided via Title I (16 percent) and Title III
programs (81 percent; figure 3.2).
Although these data are only indicative of one state, they reflect a larger point brought up by
many state and local administrators. Title II and Title IV programs tend to more narrowly focus on
intensive engagement with fewer employers (and in practice, contribute less to the overall count of
employer services provided). This is consistent with the authorizing statute that does not require the
provision of employer services under WIOA for Title II. Further, as a shared measure designed to
promote coordination across titles and limit competition, Title II programs may not always contribute
to annually reported data.
3.2 Variation in Service Delivery across Core Programs and Alignment with Performance Specifications We found considerable variation in services provided to employers across WIOA’s core programs; this
variation is tied to the service population and strategic priorities of each program. Understanding
variation in employer service delivery across core programs lends insight into the appropriateness of
the pilot measures and how they are reported.
The Title II program serves adults who are basic-skills deficient, do not have a high school diploma,
or who are English-language learners. The purpose of Adult Education and Family Literacy Act is to
improve basic skills necessary for employment and self-sufficiency, help adults complete high school
and transition to postsecondary education or employment, and help English-language learners improve
English proficiency. As discussed, in the statutory language authorizing adult education under WIOA,
the statute limits the use of funds to educational services defined in the statute.43 Some Title II
administrators we spoke with during the site visits described different goals for serving employers as it
relates to their primary mission of serving adult learners.
Title II and Title IV programs structure delivery of business services differently from Title I and
Title III programs, and they deliver different types of business services for different purposes and to
43 “Workforce Innovation and Opportunity Act,” Pub. L. No. 113-128, 128 Stat. 1425 (2014).
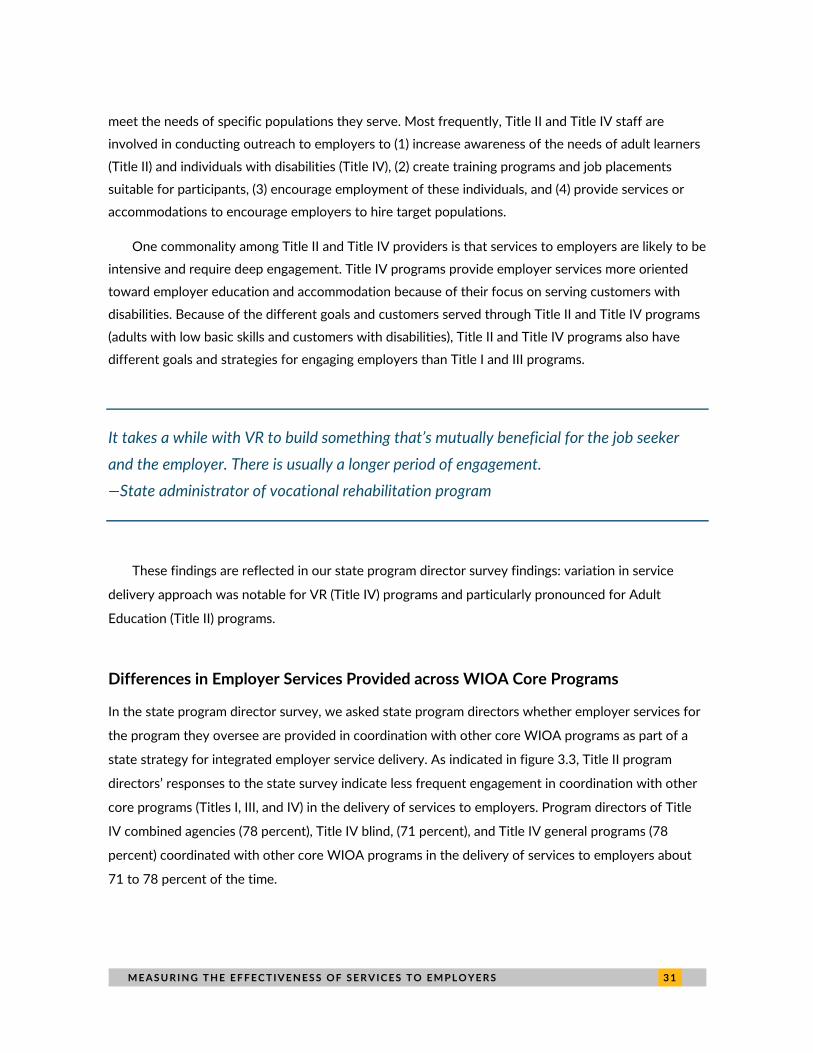
M E A S U R I N G T H E E F F E C T I V E N E S S O F S E R V I C E S T O E M P L O Y E R S 3 1
meet the needs of specific populations they serve. Most frequently, Title II and Title IV staff are
involved in conducting outreach to employers to (1) increase awareness of the needs of adult learners
(Title II) and individuals with disabilities (Title IV), (2) create training programs and job placements
suitable for participants, (3) encourage employment of these individuals, and (4) provide services or
accommodations to encourage employers to hire target populations.
One commonality among Title II and Title IV providers is that services to employers are likely to be
intensive and require deep engagement. Title IV programs provide employer services more oriented
toward employer education and accommodation because of their focus on serving customers with
disabilities. Because of the different goals and customers served through Title II and Title IV programs
(adults with low basic skills and customers with disabilities), Title II and Title IV programs also have
different goals and strategies for engaging employers than Title I and III programs.
It takes a while with VR to build something that’s mutually beneficial for the job seeker and the employer. There is usually a longer period of engagement. —State administrator of vocational rehabilitation program
These findings are reflected in our state program director survey findings: variation in service
delivery approach was notable for VR (Title IV) programs and particularly pronounced for Adult
Education (Title II) programs.
Differences in Employer Services Provided across WIOA Core Programs
In the state program director survey, we asked state program directors whether employer services for
the program they oversee are provided in coordination with other core WIOA programs as part of a
state strategy for integrated employer service delivery. As indicated in figure 3.3, Title II program
directors’ responses to the state survey indicate less frequent engagement in coordination with other
core programs (Titles I, III, and IV) in the delivery of services to employers. Program directors of Title
IV combined agencies (78 percent), Title IV blind, (71 percent), and Title IV general programs (78
percent) coordinated with other core WIOA programs in the delivery of services to employers about
71 to 78 percent of the time.
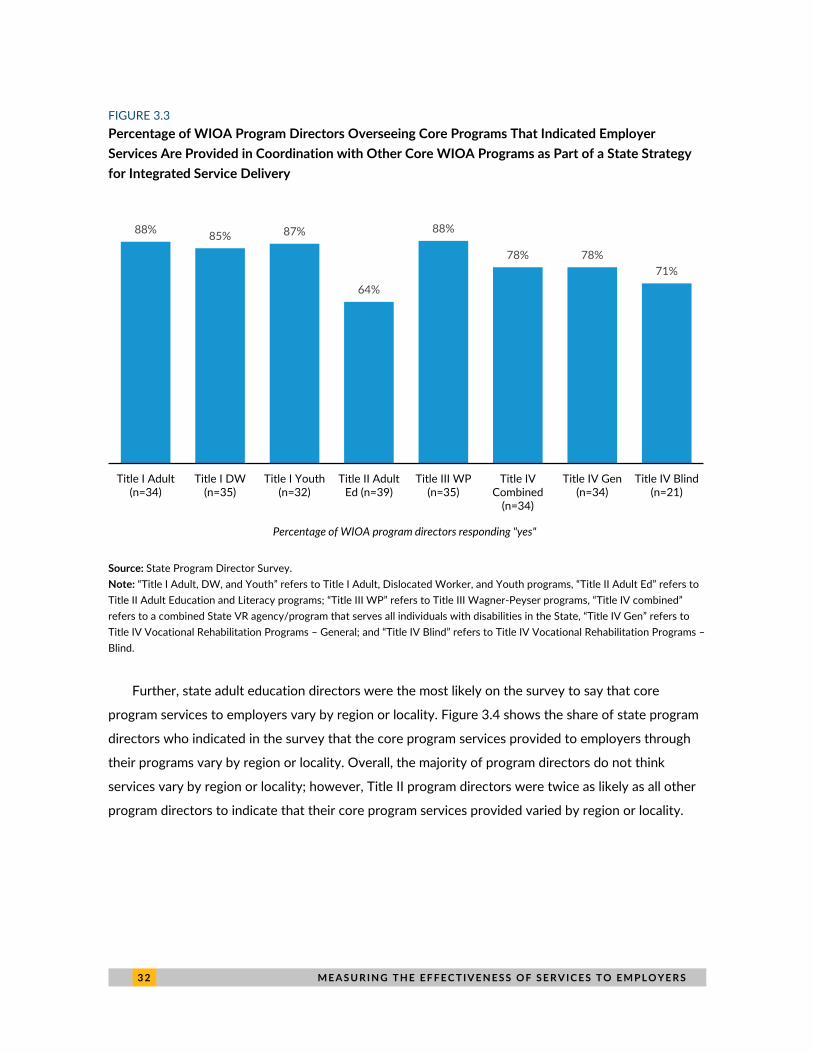
3 2 M E A S U R I N G T H E E F F E C T I V E N E S S O F S E R V I C E S T O E M P L O Y E R S
FIGURE 3.3 Percentage of WIOA Program Directors Overseeing Core Programs That Indicated Employer Services Are Provided in Coordination with Other Core WIOA Programs as Part of a State Strategy for Integrated Service Delivery
Source: State Program Director Survey. Note: “Title I Adult, DW, and Youth” refers to Title I Adult, Dislocated Worker, and Youth programs, “Title II Adult Ed” refers to Title II Adult Education and Literacy programs; “Title III WP” refers to Title III Wagner-Peyser programs, “Title IV combined” refers to a combined State VR agency/program that serves all individuals with disabilities in the State, “Title IV Gen” refers to Title IV Vocational Rehabilitation Programs – General; and “Title IV Blind” refers to Title IV Vocational Rehabilitation Programs – Blind.
Further, state adult education directors were the most likely on the survey to say that core
program services to employers vary by region or locality. Figure 3.4 shows the share of state program
directors who indicated in the survey that the core program services provided to employers through
their programs vary by region or locality. Overall, the majority of program directors do not think
services vary by region or locality; however, Title II program directors were twice as likely as all other
program directors to indicate that their core program services provided varied by region or locality.
88% 85% 87%
64%
88%
78% 78%71%
Title I Adult(n=34)
Title I DW(n=35)
Title I Youth(n=32)
Title II AdultEd (n=39)
Title III WP(n=35)
Title IVCombined
(n=34)
Title IV Gen(n=34)
Title IV Blind(n=21)
Percentage of WIOA program directors responding "yes"
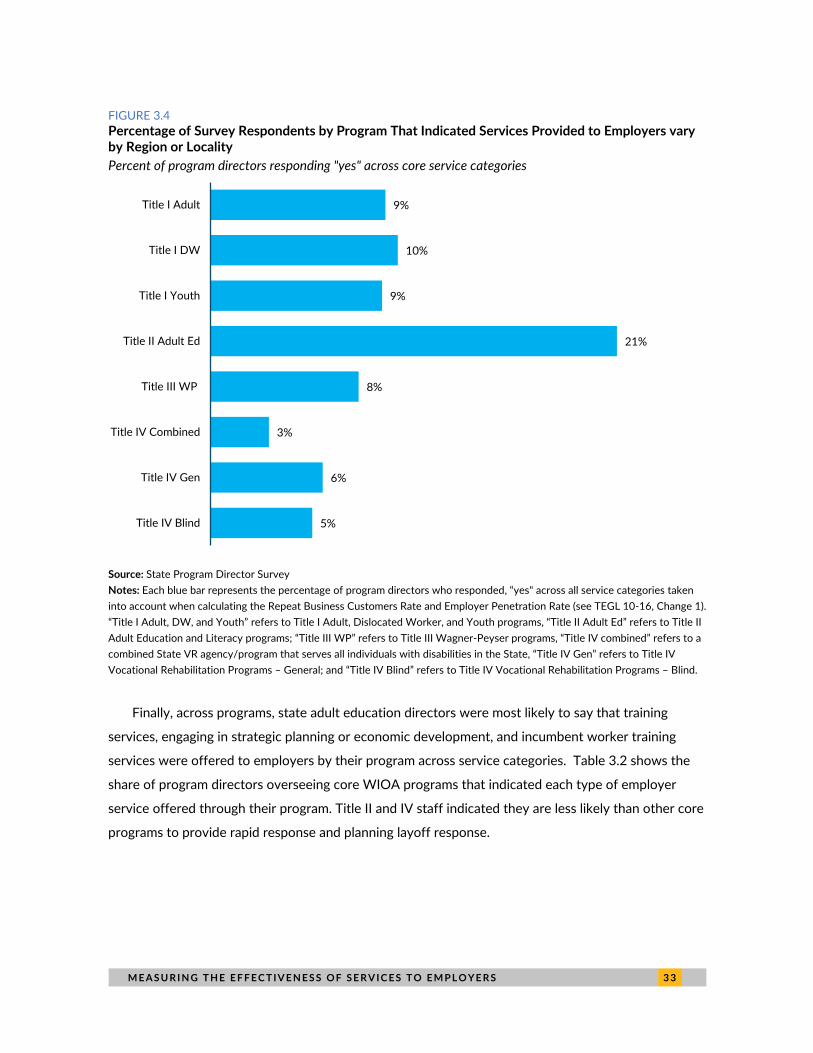
M E A S U R I N G T H E E F F E C T I V E N E S S O F S E R V I C E S T O E M P L O Y E R S 3 3
FIGURE 3.4 Percentage of Survey Respondents by Program That Indicated Services Provided to Employers vary by Region or Locality Percent of program directors responding "yes" across core service categories
Source: State Program Director Survey Notes: Each blue bar represents the percentage of program directors who responded, “yes" across all service categories taken into account when calculating the Repeat Business Customers Rate and Employer Penetration Rate (see TEGL 10-16, Change 1). “Title I Adult, DW, and Youth” refers to Title I Adult, Dislocated Worker, and Youth programs, “Title II Adult Ed” refers to Title II Adult Education and Literacy programs; “Title III WP” refers to Title III Wagner-Peyser programs, “Title IV combined” refers to a combined State VR agency/program that serves all individuals with disabilities in the State, “Title IV Gen” refers to Title IV Vocational Rehabilitation Programs – General; and “Title IV Blind” refers to Title IV Vocational Rehabilitation Programs – Blind.
Finally, across programs, state adult education directors were most likely to say that training
services, engaging in strategic planning or economic development, and incumbent worker training
services were offered to employers by their program across service categories. Table 3.2 shows the
share of program directors overseeing core WIOA programs that indicated each type of employer
service offered through their program. Title II and IV staff indicated they are less likely than other core
programs to provide rapid response and planning layoff response.
5%
6%
3%
8%
21%
9%
10%
9%
Title IV Blind
Title IV Gen
Title IV Combined
Title III WP
Title II Adult Ed
Title I Youth
Title I DW
Title I Adult
3 4 M E A S U R I N G T H E E F F E C T I V E N E S S O F S E R V I C E S T O E M P L O Y E R S
TABLE 3.2
Core Program Services Offered to Employers through Core WIOA Programs Percent of state program directors that indicated each of the following services is offered
Title I Adult (n=34)
Title I DW
(n=35)
Title I Youth (n=32)
Title II Adult Ed (n=39)
Title III WP
(n=35)
Title IV Combined
(n=34)
Title IV Gen
(n=34)
Title IV Blind
(n=21) Workforce recruitment assistance
82% 80% 81% 49% 80% 95% 95% 87%
Accessing untapped labor pools 85% 83% 81% 54% 80% 95% 95% 93%
Training services 85% 86% 84% 77% 60% 84% 84% 87% Engagement in Strategic planning or economic development
82% 77% 75% 62% 80% 74% 74% 60%
Employer Information and Support Services
85% 83% 84% 44% 86% 89% 89% 80%
Incumbent worker training services 74% 71% 66% 59% 51% 32% 32% 67%
Rapid response or business downsizing assistance
82% 80% 72% 33% 80% 32% 32% 13%
Planning layoff response 76% 77% 66% 26% 71% 16% 16% 7%
Source: State Program Director Survey. Notes: N = number of total program directors responding to survey question. Because some individuals oversee multiple programs, program directors may appear across multiple categories. “Title I Adult, DW, and Youth” refers to Title I Adult, Dislocated Worker, and Youth programs, “Title II Adult Ed” refers to Title II Adult Education and Literacy programs; “Title III WP” refers to Title III Wagner-Peyser programs, “Title IV combined” refers to a combined State VR agency/program that serves all individuals with disabilities in the State, “Title IV Gen” refers to Title IV Vocational Rehabilitation Programs – General; and “Title IV Blind” refers to Title IV Vocational Rehabilitation Programs – Blind.
Alignment of Performance Specifications to Services Provided to Employers
In both the survey and interviews, most respondents indicated that the core program service
definitions used to calculate the Employer Penetration Rate and Repeat Business Customers ESE
measures were adequate for the purposes of performance reporting in that they could be functionally
used to capture most (if not all) of the services provided to employers across states. However, because
of the variation in service delivery described previously, some staff we spoke with described
limitations. These limitations included a lack of specificity about reporting guidance to share with
program staff and contracted partners, different goals for serving employers across core programs,
and the inability of the current classification scheme to capture variation in the types of services
provided, length of interaction, or depth of engagement with an employer.
M E A S U R I N G T H E E F F E C T I V E N E S S O F S E R V I C E S T O E M P L O Y E R S 3 5
SPECIFICITY ABOUT REPORTING GUIDANCE TO SHARE WITH PROGRAM STAFF AND
CONTRACTED PARTNERS IS LACKING
State and local administrators and data staff also noted that state policies and procedures are needed
for all core program partners at the local level about how to delineate and uniformly collect
information for the purposes of reporting on the ESE measures across core programs. Technical
assistance organizations have also advised that this sort of guidance would be particularly helpful for
vocational rehabilitation administrators, to help facilitate how to catalog and track services provided to
employers through the Title IV program (WINTAC 2019). Further, given that the ESE indicator is
intended to be a shared outcome across programs, mechanisms to set up and track service provision
need to be established across core programs where they do not already exist to ensure data are not
missing or not being reported.
MAKING SERVICE DEFINITIONS OPERATIONAL ACROSS CORE PROGRAMS TO BETTER
REFLECT PROGRAMS’ DIFFERENT GOALS FOR SERVING EMPLOYERS
Some core programs, in particular Title II and IV agencies, may not see the services they provide
reflected in the categories used to calculate the measures. One adult education agency administrator
described this as follows: “I think these measures make sense, but I don’t think Title II providers always
see themselves within these definitions.”
To adapt to this challenge and better capture the variation in services provided, some states have
developed crosswalks to more efficiently categorize their services across localities and contracted
providers. The Workforce Innovation Technical Assistance Center recently published “Effectiveness in
Serving Employers: A Crosswalk for WIOA Title IV Employer Services” after the Rehabilitation
Services Administration and its federal partners agreed that the crosswalk may be a useful technical
assistance resource for vocational rehabilitation agencies (WINTAC 2019). Because those agencies
collaborate with their state partners across all titles of WIOA, use of the crosswalk may help ensure
each core program’s efforts to engage with businesses and employers are collected and reported as
federal partners pilot this WIOA performance indicator. Two states we spoke with during our virtual
site visits had developed crosswalks for their Title IV program staff to categorize services provided to
employers aligned with programs’ unique needs.
CURRENT CORE PROGRAM SERVICES TO EMPLOYERS DO NOT CAPTURE LENGTH OR DEPTH
OF INTERACTION WITH AN EMPLOYER
Some administrators and local staff we spoke with lamented that the intensity of the services they
provide and length of engagement with employers is not captured fully by simple counts of services
3 6 M E A S U R I N G T H E E F F E C T I V E N E S S O F S E R V I C E S T O E M P L O Y E R S
provided to establishments, as is the case with the current measures. One vocational rehabilitation
program director we spoke with suggested that to better measure the intensity of employer
engagement with the services provided by their program, point values could be assigned to services
based on the intensity of the services provided. We heard during the site visits that this issue is
particularly relevant for Title II and IV programs who tend to work with employer partners to develop
customized trainings and programs over a long period that are designed with the needs of adult
learners and people with disabilities (respectively) in mind.
If I call a business and provide some cursory services, how much have I truly moved the needle? How much have I changed reality for a business from just a call? —State administrator
Our findings about how states, local areas, and programs provide services to employers across the
core programs of WIOA connects to our assessment of the pilot and alternative ESE measures in
several ways. First, understanding how employer services are administered and delivered can provide
insight into potential challenges in the administration of services across agencies, which could have
implications for reporting on the measures. Second, because employer services vary considerably by
program and are concentrated in two key categories most likely to be provided by Title I and Title III
staff, there may be limitations to the practical use of the performance measures because they do not
always align with Title II and, to a lesser extent, Title IV program services.
M E A S U R I N G T H E E F F E C T I V E N E S S O F S E R V I C E S T O E M P L O Y E R S 3 7
Chapter 4: Implementation of Pilot Measures In this chapter, we address research question two: “What does the implementation of the pilot
measures across states, core WIOA programs, and local areas tell us about the validity, reliability,
practicality, and unintended consequences of adopting these measures?” We rely on analysis of
submitted performance data on the measures to understand what measures are being implemented
across states and how they are being reported to DOL and ED. Data from the survey of state program
directors and from interviews with state and local program directors and staff provide insights to
inform the assessment of the pilot measures. Data on the administration of WIOA core programs
further informs our analysis of the measures, specifically on issues of reliability.
The following are the key findings for Chapter 4:
Pilot ESE measures: States more commonly were piloting the Repeat Business Customer and
Employer Penetration Rate measures. In Program Year 2018, 14 states were piloting all three
measures. Compliance with performance reporting improved over time.
Validity: Respondents indicated that the pilot measures broadly reflected goals of services
provided to employers, but they did not capture the intensity of services or the goals and
activities of individual programs, especially Title II programs and were limited in capturing
quality and outcomes. Employer Penetration Rate was viewed as least aligned with the goals
of the Title II program and is perceived as emphasizing quantity over quality.
Reliability: Although respondents noted the value of the measures in improving the collection
of data on employers, the reliability of the measures was threatened by administration of
programs by multiple agencies, challenges in aggregating and reporting data across programs
and local areas, multiple reporting systems, and duplicate data entry.
Practicality: States selected measures based on the availability of the data making the
measures practical to implement, but state administrators expressed concerns about their
ease of use. Interview respondents said the measures had limited practical use beyond federal
reporting because of issues with validity and timeliness.
Unintended consequences: There was no direct evidence of unintended consequences, but
interviews surfaced concerns about potential risks associated with individual measures,
especially Employer Penetration Rate. State and local program administrators expressed
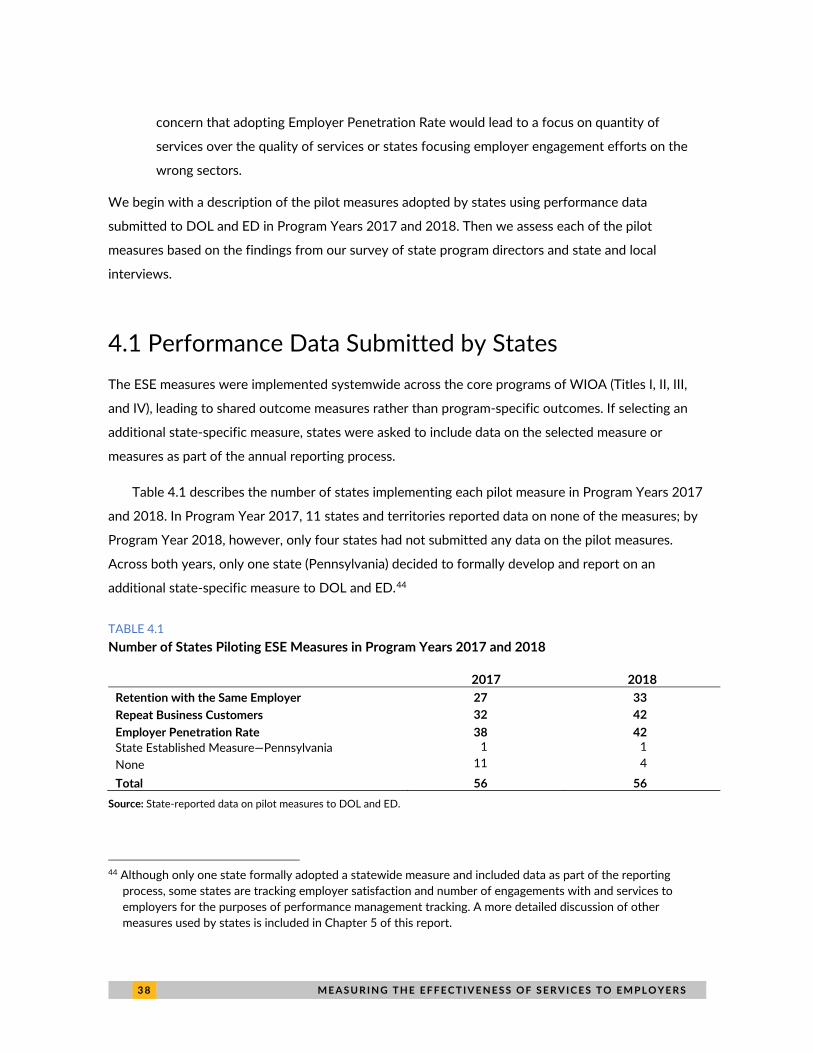
3 8 M E A S U R I N G T H E E F F E C T I V E N E S S O F S E R V I C E S T O E M P L O Y E R S
concern that adopting Employer Penetration Rate would lead to a focus on quantity of
services over the quality of services or states focusing employer engagement efforts on the
wrong sectors.
We begin with a description of the pilot measures adopted by states using performance data
submitted to DOL and ED in Program Years 2017 and 2018. Then we assess each of the pilot
measures based on the findings from our survey of state program directors and state and local
interviews.
4.1 Performance Data Submitted by States The ESE measures were implemented systemwide across the core programs of WIOA (Titles I, II, III,
and IV), leading to shared outcome measures rather than program-specific outcomes. If selecting an
additional state-specific measure, states were asked to include data on the selected measure or
measures as part of the annual reporting process.
Table 4.1 describes the number of states implementing each pilot measure in Program Years 2017
and 2018. In Program Year 2017, 11 states and territories reported data on none of the measures; by
Program Year 2018, however, only four states had not submitted any data on the pilot measures.
Across both years, only one state (Pennsylvania) decided to formally develop and report on an
additional state-specific measure to DOL and ED.44
TABLE 4.1 Number of States Piloting ESE Measures in Program Years 2017 and 2018
2017 2018 Retention with the Same Employer 27 33 Repeat Business Customers 32 42 Employer Penetration Rate 38 42 State Established Measure—Pennsylvania 1 1 None 11 4
Total 56 56 Source: State-reported data on pilot measures to DOL and ED.
44 Although only one state formally adopted a statewide measure and included data as part of the reporting
process, some states are tracking employer satisfaction and number of engagements with and services to employers for the purposes of performance management tracking. A more detailed discussion of other measures used by states is included in Chapter 5 of this report.
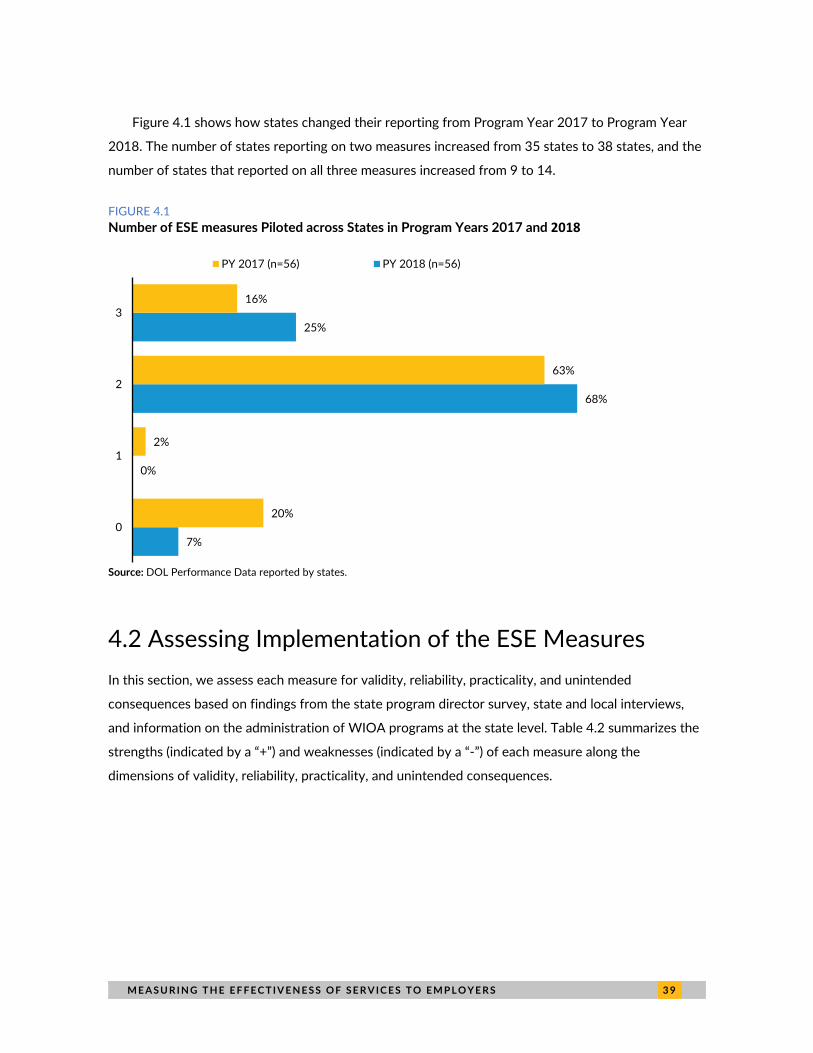
M E A S U R I N G T H E E F F E C T I V E N E S S O F S E R V I C E S T O E M P L O Y E R S 3 9
Figure 4.1 shows how states changed their reporting from Program Year 2017 to Program Year
2018. The number of states reporting on two measures increased from 35 states to 38 states, and the
number of states that reported on all three measures increased from 9 to 14.
FIGURE 4.1 Number of ESE measures Piloted across States in Program Years 2017 and 2018
Source: DOL Performance Data reported by states.
4.2 Assessing Implementation of the ESE Measures In this section, we assess each measure for validity, reliability, practicality, and unintended
consequences based on findings from the state program director survey, state and local interviews,
and information on the administration of WIOA programs at the state level. Table 4.2 summarizes the
strengths (indicated by a “+”) and weaknesses (indicated by a “-”) of each measure along the
dimensions of validity, reliability, practicality, and unintended consequences.
7%
0%
68%
25%
20%
2%
63%
16%
0
1
2
3
PY 2017 (n=56) PY 2018 (n=56)
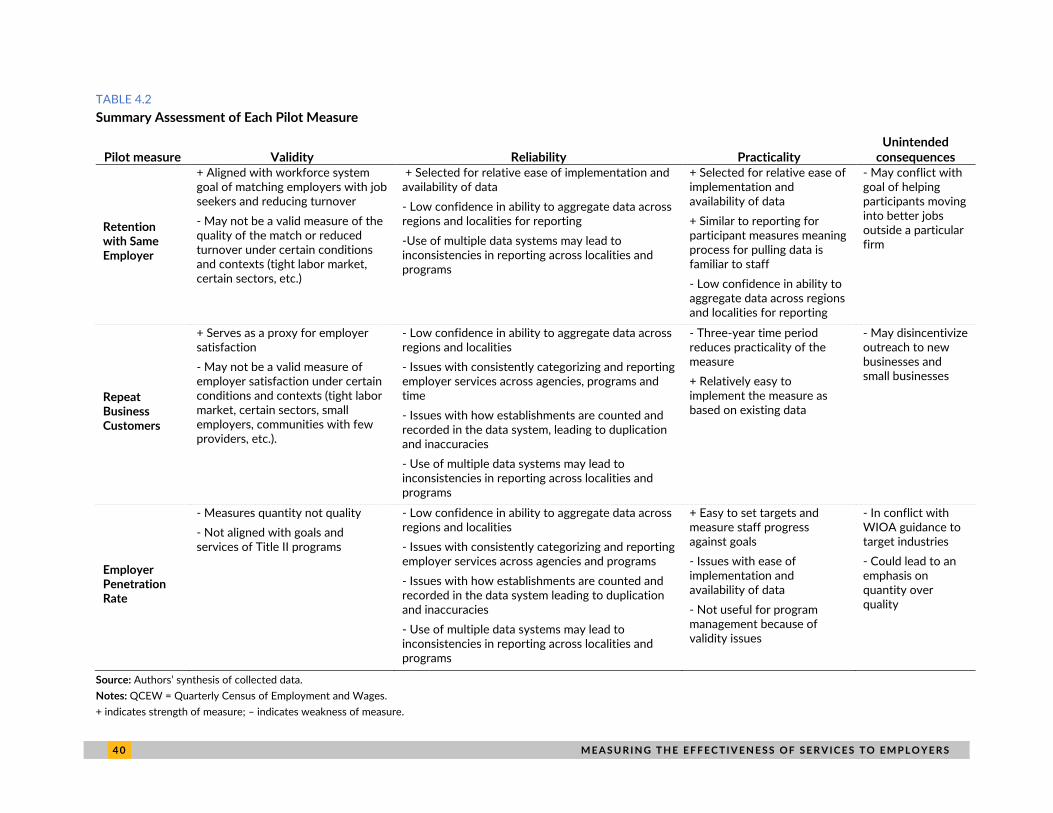
4 0 M E A S U R I N G T H E E F F E C T I V E N E S S O F S E R V I C E S T O E M P L O Y E R S
TABLE 4.2
Summary Assessment of Each Pilot Measure
Pilot measure Validity Reliability Practicality Unintended
consequences
Retention with Same Employer
+ Aligned with workforce system goal of matching employers with job seekers and reducing turnover - May not be a valid measure of the quality of the match or reduced turnover under certain conditions and contexts (tight labor market, certain sectors, etc.)
+ Selected for relative ease of implementation and availability of data - Low confidence in ability to aggregate data across regions and localities for reporting -Use of multiple data systems may lead to inconsistencies in reporting across localities and programs
+ Selected for relative ease of implementation and availability of data + Similar to reporting for participant measures meaning process for pulling data is familiar to staff - Low confidence in ability to aggregate data across regions and localities for reporting
- May conflict with goal of helping participants moving into better jobs outside a particular firm
Repeat Business Customers
+ Serves as a proxy for employer satisfaction - May not be a valid measure of employer satisfaction under certain conditions and contexts (tight labor market, certain sectors, small employers, communities with few providers, etc.).
- Low confidence in ability to aggregate data across regions and localities - Issues with consistently categorizing and reporting employer services across agencies, programs and time - Issues with how establishments are counted and recorded in the data system, leading to duplication and inaccuracies - Use of multiple data systems may lead to inconsistencies in reporting across localities and programs
- Three-year time period reduces practicality of the measure + Relatively easy to implement the measure as based on existing data
- May disincentivize outreach to new businesses and small businesses
Employer Penetration Rate
- Measures quantity not quality - Not aligned with goals and services of Title II programs
- Low confidence in ability to aggregate data across regions and localities - Issues with consistently categorizing and reporting employer services across agencies and programs - Issues with how establishments are counted and recorded in the data system leading to duplication and inaccuracies - Use of multiple data systems may lead to inconsistencies in reporting across localities and programs
+ Easy to set targets and measure staff progress against goals - Issues with ease of implementation and availability of data - Not useful for program management because of validity issues
- In conflict with WIOA guidance to target industries - Could lead to an emphasis on quantity over quality
Source: Authors’ synthesis of collected data. Notes: QCEW = Quarterly Census of Employment and Wages. + indicates strength of measure; – indicates weakness of measure.
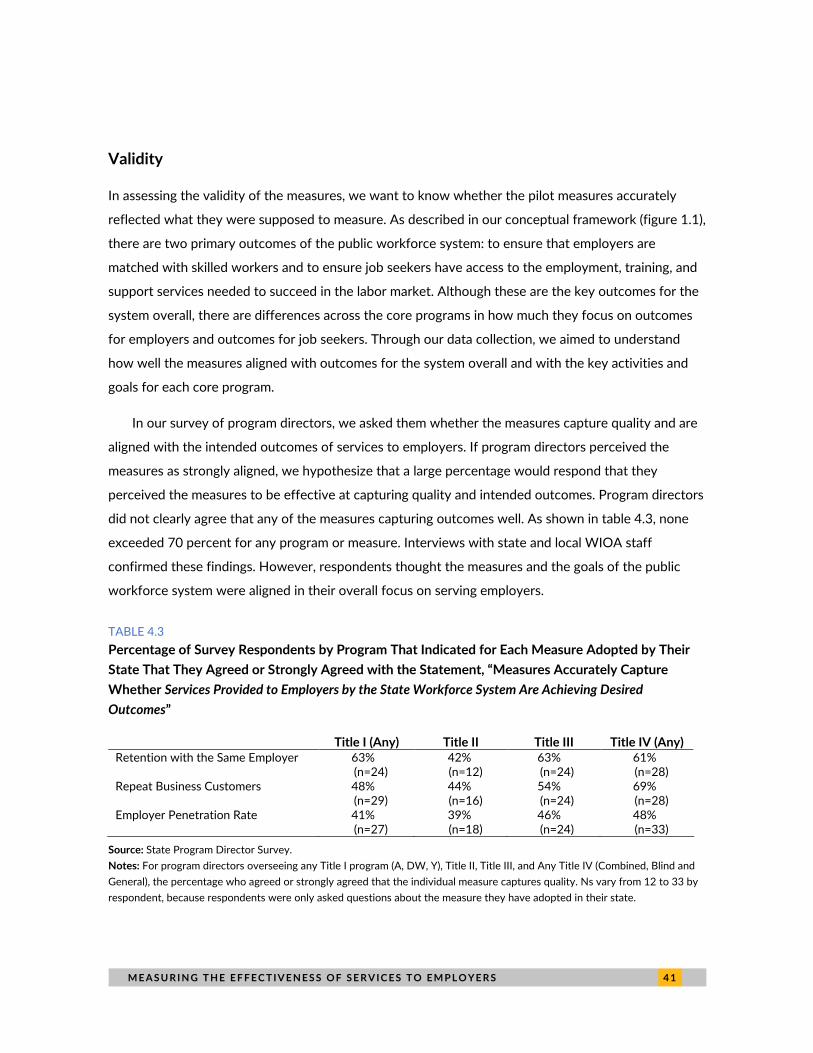
M E A S U R I N G T H E E F F E C T I V E N E S S O F S E R V I C E S T O E M P L O Y E R S 4 1
Validity
In assessing the validity of the measures, we want to know whether the pilot measures accurately
reflected what they were supposed to measure. As described in our conceptual framework (figure 1.1),
there are two primary outcomes of the public workforce system: to ensure that employers are
matched with skilled workers and to ensure job seekers have access to the employment, training, and
support services needed to succeed in the labor market. Although these are the key outcomes for the
system overall, there are differences across the core programs in how much they focus on outcomes
for employers and outcomes for job seekers. Through our data collection, we aimed to understand
how well the measures aligned with outcomes for the system overall and with the key activities and
goals for each core program.
In our survey of program directors, we asked them whether the measures capture quality and are
aligned with the intended outcomes of services to employers. If program directors perceived the
measures as strongly aligned, we hypothesize that a large percentage would respond that they
perceived the measures to be effective at capturing quality and intended outcomes. Program directors
did not clearly agree that any of the measures capturing outcomes well. As shown in table 4.3, none
exceeded 70 percent for any program or measure. Interviews with state and local WIOA staff
confirmed these findings. However, respondents thought the measures and the goals of the public
workforce system were aligned in their overall focus on serving employers.
TABLE 4.3
Percentage of Survey Respondents by Program That Indicated for Each Measure Adopted by Their State That They Agreed or Strongly Agreed with the Statement, “Measures Accurately Capture Whether Services Provided to Employers by the State Workforce System Are Achieving Desired Outcomes”
Title I (Any) Title II Title III Title IV (Any) Retention with the Same Employer 63%
(n=24) 42% (n=12)
63% (n=24)
61% (n=28)
Repeat Business Customers 48% (n=29)
44% (n=16)
54% (n=24)
69% (n=28)
Employer Penetration Rate 41% (n=27)
39% (n=18)
46% (n=24)
48% (n=33)
Source: State Program Director Survey. Notes: For program directors overseeing any Title I program (A, DW, Y), Title II, Title III, and Any Title IV (Combined, Blind and General), the percentage who agreed or strongly agreed that the individual measure captures quality. Ns vary from 12 to 33 by respondent, because respondents were only asked questions about the measure they have adopted in their state.
4 2 M E A S U R I N G T H E E F F E C T I V E N E S S O F S E R V I C E S T O E M P L O Y E R S
EMPLOYER PENETRATION RATE MEASURE PERCEIVED AS LEAST ALIGNED WITH OUTCOMES Across WIOA programs, a smaller percentage of program directors reported that the Employer
Penetration Rate captured the intended outcomes for employers than for the other two measures,
ranging from a low of 39 percent of Title II program directors to 48 percent for Title IV program
directors. Retention with the Same Employer was rated slightly higher than the Repeat Business
Customers measure, with more than 60 percent of program directors of Title I, III, and IV programs
indicating that the Retention with the Same Employer was aligned with outcomes.
RETENTION WITH THE SAME EMPLOYER MEASURE PROVIDED AN INDICATOR OF THE
QUALITY OF THE MATCH BETWEEN A JOBSEEKER AND EMPLOYER, BUT PERFORMANCE MAY
BE DRIVEN BY LABOR MARKET AND SECTOR DYNAMICS Respondents noted a variety of contextual factors that could be related to state or local performance
on the Retention with the Same Employer measure. For example, one respondent identified that
warehouse jobs are a major source of employment in his or her location in the state. The high turnover
that characterizes these jobs could be because of the nature of jobs in that sector and not necessarily
a reflection of the employer not being served effectively. As will be discussed in Chapter 6, one way to
account for these contextual factors and make the measures more meaningful is through a statistical
adjustment model.
REPEAT BUSINESS CUSTOMERS MEASURE MAY REFLECT EMPLOYER SATISFACTION BUT NOT
ACCOUNT FOR DIFFERENCES BETWEEN SMALL AND LARGE EMPLOYERS OR OTHER
CONTEXTUAL FACTORS LIKE THE AVAILABILITY OF SERVICES IN A GEOGRAPHIC AREA Some respondents suggested that large employers might be more likely to need to hire workers and
thus more likely to be repeat business customers. Small employers, on the other hand, could be very
satisfied with the services they received but not have hiring needs within the period of the measure.
Furthermore, some geographic areas may have fewer options for service providers, so the decision to
use a WIOA-funded employer service might not have to do with satisfaction with the past services but
rather a lack of available options. Again, as will be discussed in chapter 6, these findings speak to the
importance of developing a statistical adjustment model for use with the performance measures.
Repeat customer measure may not be the best measure because an employer may be happy with services, but not need additional services. An employer may also be unhappy with services received but have to continue to work with [service provider] because there is nowhere else to get those services. —Local program administrator
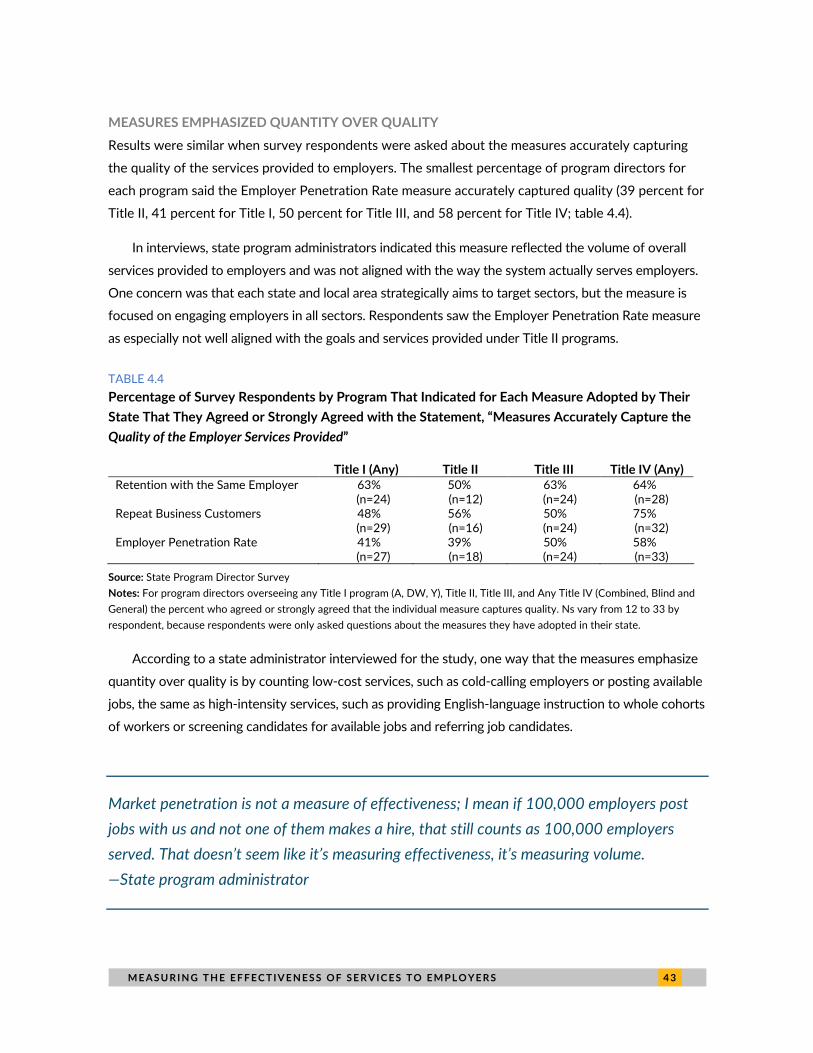
M E A S U R I N G T H E E F F E C T I V E N E S S O F S E R V I C E S T O E M P L O Y E R S 4 3
MEASURES EMPHASIZED QUANTITY OVER QUALITY Results were similar when survey respondents were asked about the measures accurately capturing
the quality of the services provided to employers. The smallest percentage of program directors for
each program said the Employer Penetration Rate measure accurately captured quality (39 percent for
Title II, 41 percent for Title I, 50 percent for Title III, and 58 percent for Title IV; table 4.4).
In interviews, state program administrators indicated this measure reflected the volume of overall
services provided to employers and was not aligned with the way the system actually serves employers.
One concern was that each state and local area strategically aims to target sectors, but the measure is
focused on engaging employers in all sectors. Respondents saw the Employer Penetration Rate measure
as especially not well aligned with the goals and services provided under Title II programs.
TABLE 4.4
Percentage of Survey Respondents by Program That Indicated for Each Measure Adopted by Their State That They Agreed or Strongly Agreed with the Statement, “Measures Accurately Capture the Quality of the Employer Services Provided”
Title I (Any) Title II Title III Title IV (Any) Retention with the Same Employer 63%
(n=24) 50% (n=12)
63% (n=24)
64% (n=28)
Repeat Business Customers 48% (n=29)
56% (n=16)
50% (n=24)
75% (n=32)
Employer Penetration Rate 41% (n=27)
39% (n=18)
50% (n=24)
58% (n=33)
Source: State Program Director Survey Notes: For program directors overseeing any Title I program (A, DW, Y), Title II, Title III, and Any Title IV (Combined, Blind and General) the percent who agreed or strongly agreed that the individual measure captures quality. Ns vary from 12 to 33 by respondent, because respondents were only asked questions about the measures they have adopted in their state.
According to a state administrator interviewed for the study, one way that the measures emphasize
quantity over quality is by counting low-cost services, such as cold-calling employers or posting available
jobs, the same as high-intensity services, such as providing English-language instruction to whole cohorts
of workers or screening candidates for available jobs and referring job candidates.
Market penetration is not a measure of effectiveness; I mean if 100,000 employers post jobs with us and not one of them makes a hire, that still counts as 100,000 employers served. That doesn’t seem like it’s measuring effectiveness, it’s measuring volume. —State program administrator
4 4 M E A S U R I N G T H E E F F E C T I V E N E S S O F S E R V I C E S T O E M P L O Y E R S
TITLE II PROGRAM DIRECTORS WERE LESS LIKELY TO VIEW MEASURES AS CAPTURING
QUALITY AND OUTCOMES
There appears to be a larger issue with the measures effectively capturing intended outcomes; the
share of Title II directors indicating alignment with outcomes hovers around 40 percent for each of the
three measures table 4.4). The rates were slightly higher for the Retention with the Same Employer
measure (42 percent) and Repeat Business Customers measure (44 percent) but similar for the
Employer Penetration Rate measure (39 percent). As noted in Chapter 3, interview respondents said
that Title II programs do not really engage with employers (to the extent that Title I and III programs
do) and are focused on outcomes for job seekers. A few described working with employers to provide
adult basic education services to incumbent workers.
Interview respondents described both Title II and Title IV program services as intensive, whether
to job seekers or to employers. Some respondents felt there were issues with giving the same weight
to high-touch, high-cost services (such as adult education programs to improve English-language
literacy or training in how to work with people with disabilities) as light-touch, low-cost employer
services (such as posting an available job or cold calling an employer). Title II and Title IV programs
have strategic goals and provide services to employers that go beyond job placement. For example,
Title IV providers might work with a whole company to provide sensitivity training or to ensure that a
workplace meets accessibility standards, and these activities are counted the same as posting a job for
an employer.
I would hope any new regulations align more with what VR [Title IV] is doing and not just what the American Job Centers are doing with businesses and focus on detailed services and relationship building. —Title IV State Administrator
A few respondents indicated that none of the pilot measures alone did a good job of assessing the
services provided to employers but suggested that a combination of the measures would be better for
gauging whether the public workforce system is effective in meeting employer needs. In one state
where two measures were adopted, measures were selected based on availability of data, the desire to
perform well on the measures, and an interest in choosing measures that work well together.
M E A S U R I N G T H E E F F E C T I V E N E S S O F S E R V I C E S T O E M P L O Y E R S 4 5
Reliability
Reliability of data relating to pilot measures depends on the ability of states to collect data
consistently and accurately across time, agencies, different WIOA programs, and different levels of
government. Consistency and accuracy ensure that comparisons made across states and organizations
are possible. Clear definitions of terms in the performance measures are also key to the reliability of
data collection (Poister 2015). In Chapter 3, we discussed issues with the definitions of terms, noting
that states adapted definitions to meet the federal requirements but that the definitions had
limitations. In this section, we explore other aspects of the perceived reliability of the measures
through analysis of state data, the state program director survey, and information provided during
interviews with state agency and local program staff.
PILOT MEASURES HELPED STATES PUT IN PLACE AND IMPROVE SYSTEMS FOR
COLLECTING DATA
Interview respondents noted that they viewed the new reporting requirements as being positive in
terms of improving data collection on employer services. In some instances, they also noted that their
state was still putting in place processes for collecting data. This suggests that the reliability of the
data connected to the measures will improve over time.
MULTIAGENCY ADMINISTRATION OF PROGRAMS CREATED THREATS TO RELIABLE
DATA COLLECTION
A factor that potentially affects ability of states to aggregate data and report reliably the state’s results
on the pilot measures is the extent to which it is necessary to pull data on employer service provision
and results across multiple state agencies and data systems. Figure 4.2 shows that relatively few states
have a single state agency that administers the four titles of WIOA and that most have three or more
agencies that administer the core WIOA programs. Administering the core WIOA programs across
several state agencies requires coordinating collection and reporting across several state
administrators and often several state data systems. The evidence from both the survey of program
directors and the more detailed interviews conducted in select states with state and local officials
suggest that multiagency administration of WIOA Titles I to IV—and the need to coordinate reporting
and aggregate data across multiple agencies and data systems—is an underlying factor and challenge
to reliably reporting state results on the piloted measures.
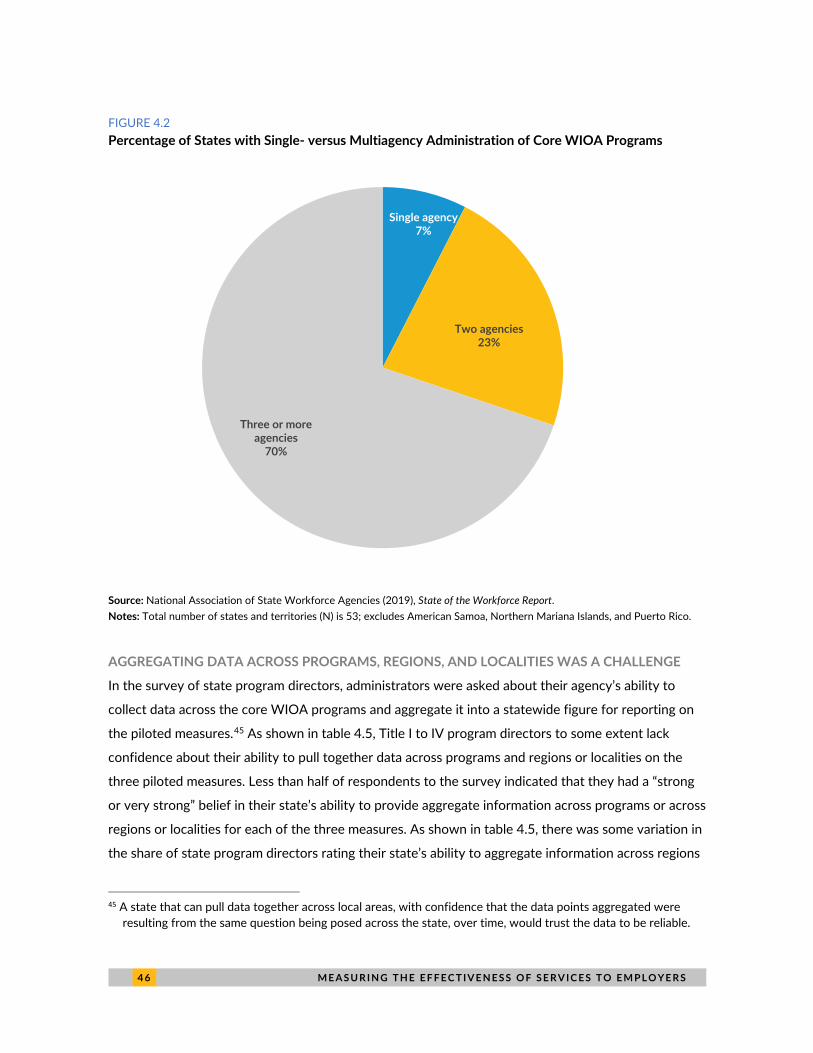
4 6 M E A S U R I N G T H E E F F E C T I V E N E S S O F S E R V I C E S T O E M P L O Y E R S
FIGURE 4.2 Percentage of States with Single- versus Multiagency Administration of Core WIOA Programs
Source: National Association of State Workforce Agencies (2019), State of the Workforce Report. Notes: Total number of states and territories (N) is 53; excludes American Samoa, Northern Mariana Islands, and Puerto Rico.
AGGREGATING DATA ACROSS PROGRAMS, REGIONS, AND LOCALITIES WAS A CHALLENGE
In the survey of state program directors, administrators were asked about their agency’s ability to
collect data across the core WIOA programs and aggregate it into a statewide figure for reporting on
the piloted measures.45 As shown in table 4.5, Title I to IV program directors to some extent lack
confidence about their ability to pull together data across programs and regions or localities on the
three piloted measures. Less than half of respondents to the survey indicated that they had a “strong
or very strong” belief in their state’s ability to provide aggregate information across programs or across
regions or localities for each of the three measures. As shown in table 4.5, there was some variation in
the share of state program directors rating their state’s ability to aggregate information across regions
45 A state that can pull data together across local areas, with confidence that the data points aggregated were
resulting from the same question being posed across the state, over time, would trust the data to be reliable.
Single agency 7%
Two agencies23%
Three or more agencies
70%
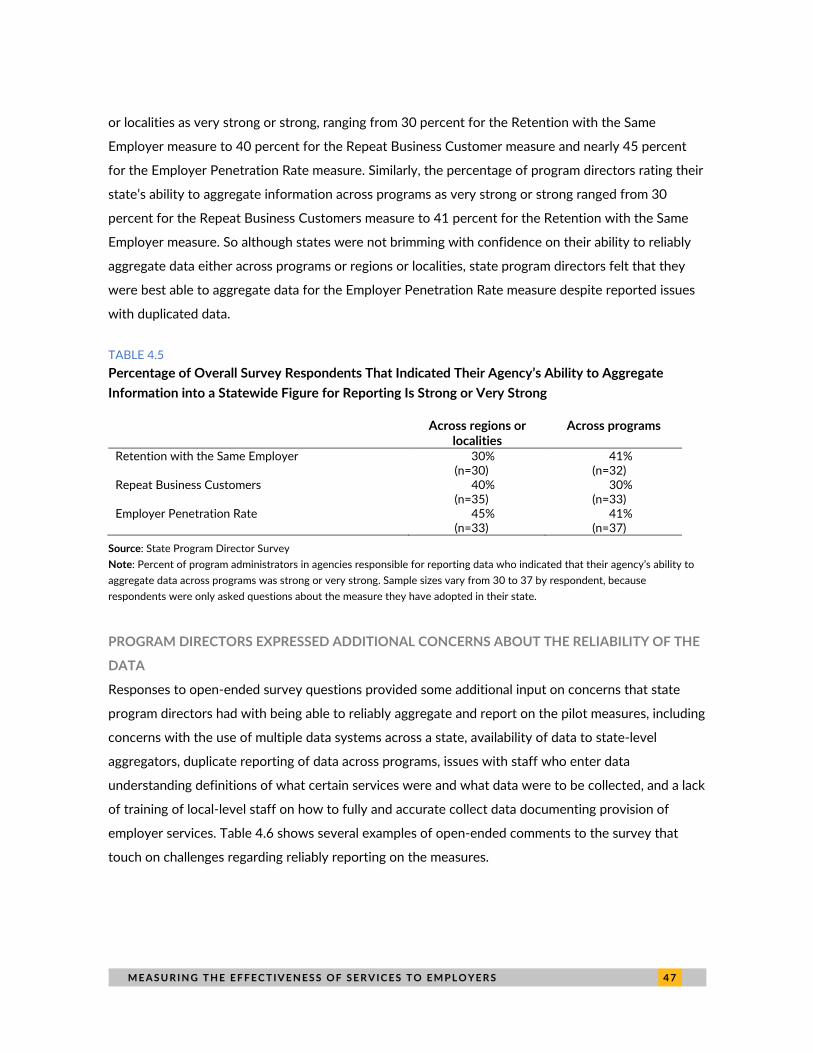
M E A S U R I N G T H E E F F E C T I V E N E S S O F S E R V I C E S T O E M P L O Y E R S 4 7
or localities as very strong or strong, ranging from 30 percent for the Retention with the Same
Employer measure to 40 percent for the Repeat Business Customer measure and nearly 45 percent
for the Employer Penetration Rate measure. Similarly, the percentage of program directors rating their
state’s ability to aggregate information across programs as very strong or strong ranged from 30
percent for the Repeat Business Customers measure to 41 percent for the Retention with the Same
Employer measure. So although states were not brimming with confidence on their ability to reliably
aggregate data either across programs or regions or localities, state program directors felt that they
were best able to aggregate data for the Employer Penetration Rate measure despite reported issues
with duplicated data.
TABLE 4.5
Percentage of Overall Survey Respondents That Indicated Their Agency’s Ability to Aggregate Information into a Statewide Figure for Reporting Is Strong or Very Strong
Across regions or localities
Across programs
Retention with the Same Employer 30% (n=30)
41% (n=32)
Repeat Business Customers 40% (n=35)
30% (n=33)
Employer Penetration Rate 45% (n=33)
41% (n=37)
Source: State Program Director Survey Note: Percent of program administrators in agencies responsible for reporting data who indicated that their agency’s ability to aggregate data across programs was strong or very strong. Sample sizes vary from 30 to 37 by respondent, because respondents were only asked questions about the measure they have adopted in their state.
PROGRAM DIRECTORS EXPRESSED ADDITIONAL CONCERNS ABOUT THE RELIABILITY OF THE
DATA
Responses to open-ended survey questions provided some additional input on concerns that state
program directors had with being able to reliably aggregate and report on the pilot measures, including
concerns with the use of multiple data systems across a state, availability of data to state-level
aggregators, duplicate reporting of data across programs, issues with staff who enter data
understanding definitions of what certain services were and what data were to be collected, and a lack
of training of local-level staff on how to fully and accurate collect data documenting provision of
employer services. Table 4.6 shows several examples of open-ended comments to the survey that
touch on challenges regarding reliably reporting on the measures.
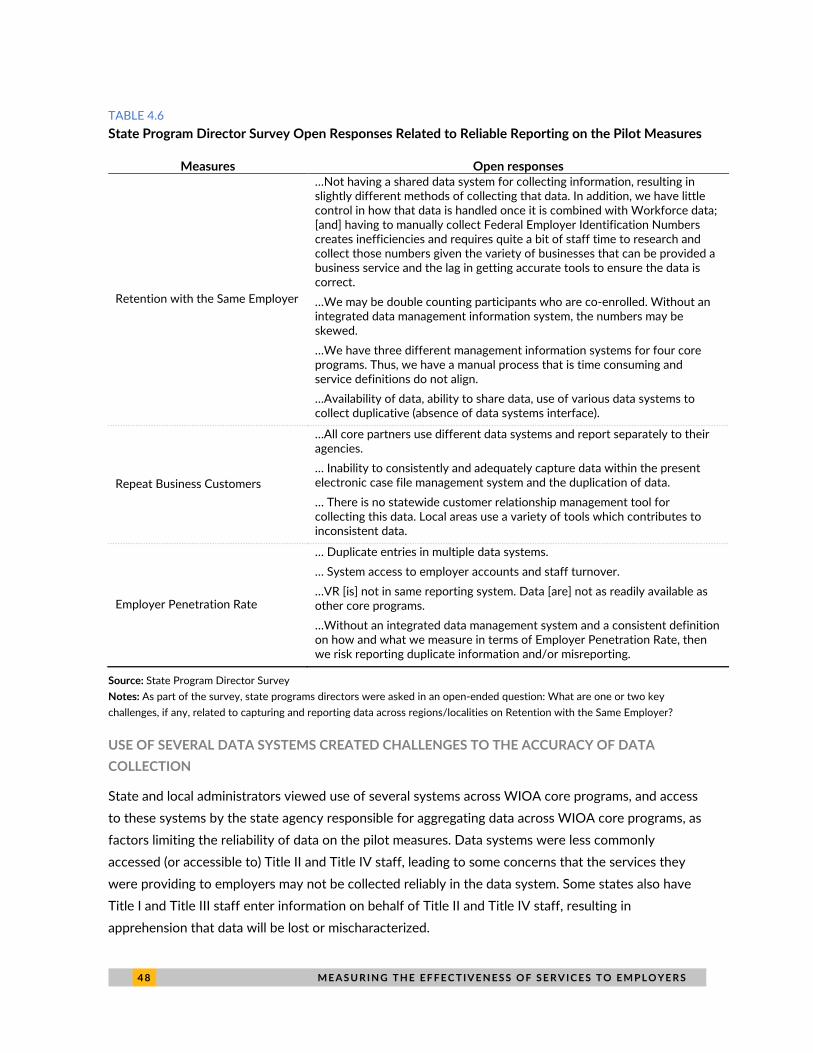
4 8 M E A S U R I N G T H E E F F E C T I V E N E S S O F S E R V I C E S T O E M P L O Y E R S
TABLE 4.6 State Program Director Survey Open Responses Related to Reliable Reporting on the Pilot Measures
Measures Open responses
Retention with the Same Employer
…Not having a shared data system for collecting information, resulting in slightly different methods of collecting that data. In addition, we have little control in how that data is handled once it is combined with Workforce data; [and] having to manually collect Federal Employer Identification Numbers creates inefficiencies and requires quite a bit of staff time to research and collect those numbers given the variety of businesses that can be provided a business service and the lag in getting accurate tools to ensure the data is correct. …We may be double counting participants who are co-enrolled. Without an integrated data management information system, the numbers may be skewed. …We have three different management information systems for four core programs. Thus, we have a manual process that is time consuming and service definitions do not align. …Availability of data, ability to share data, use of various data systems to collect duplicative (absence of data systems interface).
Repeat Business Customers
…All core partners use different data systems and report separately to their agencies. … Inability to consistently and adequately capture data within the present electronic case file management system and the duplication of data. … There is no statewide customer relationship management tool for collecting this data. Local areas use a variety of tools which contributes to inconsistent data.
Employer Penetration Rate
… Duplicate entries in multiple data systems. … System access to employer accounts and staff turnover. …VR [is] not in same reporting system. Data [are] not as readily available as other core programs. …Without an integrated data management system and a consistent definition on how and what we measure in terms of Employer Penetration Rate, then we risk reporting duplicate information and/or misreporting.
Source: State Program Director Survey Notes: As part of the survey, state programs directors were asked in an open-ended question: What are one or two key challenges, if any, related to capturing and reporting data across regions/localities on Retention with the Same Employer?
USE OF SEVERAL DATA SYSTEMS CREATED CHALLENGES TO THE ACCURACY OF DATA COLLECTION
State and local administrators viewed use of several systems across WIOA core programs, and access to these systems by the state agency responsible for aggregating data across WIOA core programs, as factors limiting the reliability of data on the pilot measures. Data systems were less commonly accessed (or accessible to) Title II and Title IV staff, leading to some concerns that the services they were providing to employers may not be collected reliably in the data system. Some states also have Title I and Title III staff enter information on behalf of Title II and Title IV staff, resulting in apprehension that data will be lost or mischaracterized.
M E A S U R I N G T H E E F F E C T I V E N E S S O F S E R V I C E S T O E M P L O Y E R S 4 9
Because adult education staff are not entering data into the [state workforce development] system, not all interactions with employers are being captured. —Title II supervisor
DUPLICATE DATA ENTRY ON SERVICES PROVIDED TO EMPLOYERS AFFECTED ACCURACY OF
THE REPEAT BUSINESS CUSTOMERS AND EMPLOYER PENETRATION RATE MEASURES
Some states were also concerned with the reliability of representation of employers in state data
systems. Some states noted during interviews that employers may be duplicated, or not counted as
separate entities, in their data systems (this is especially prevalent among franchised businesses and
businesses that operate across state lines). Because of these issues, state and local administrators
were especially concerned that the numerator (total number of businesses served in the service area)
used in assessing Employer Penetration Rate would be incorrect.
Practicality
The third dimension we are using to assess the measures is practicality. As discussed in Chapter 2, we
are assessing the practicality of the measures based on whether they are both simple to administer
and practical to use. Both concepts are important in identifying performance measures because good
performance measures will be practical to adopt and to use in the management of programs. Measures
should produce information that is timely and can be used to drive strategy and practice. In several
ways, practicality overlaps with other concepts. Measures that are easy to adopt may be so for the
same reasons measures are reliable, such as because systems are in place to allow for accurate data
collection. Measures that align with the intended outcomes and goals of programs will be more likely
to be used in the management of programs.
To get at the practicality of the measures, in the program director survey, we asked about the
reasons behind selecting the measures for their state, including perceptions about the ease of
implementation as well as the availability of data to be able to report on the measure. Because these
questions were asked of a subset of respondents whose agencies were involved in reporting on the
measures, we provide results overall for each measure as opposed to by program as shown in figure 4.3.
5 0 M E A S U R I N G T H E E F F E C T I V E N E S S O F S E R V I C E S T O E M P L O Y E R S
THE AVAILABILITY OF DATA WAS A KEY REASON STATES SELECTED THE MEASURES
Across the three pilot measures, respondents indicated that the availability of data was a key driver in
the selection of the measures. More program directors (70 percent) indicated that the availability of
data was the reason they selected the Retention with the Same Employer measure than program
directors who gave this reason for selection of the Repeat Business Customer Measure (68 percent).
The lowest percentage of program directors (60 percent) gave this as a reason for selecting the
Employer Penetration Rate measure. States must measure participant retention in a job in the second
and fourth quarters after exit for the participant performance measures, so they are familiar with the
data used for the Retention with the Same Employer measure.
PROGRAM DIRECTORS PERCEIVED THE RETENTION WITH THE SAME EMPLOYER MEASURE TO
BE EASIER TO USE THAN THE OTHER MEASURES
Data for a particular measure can be practical because data are readily available, but those data might
not be easy to use for program management purposes. Ease of use was less often given as a reason for
selection of the measures than availability of data. Again, respondents less commonly viewed
Employer Penetration Rate as easy to use. Only 47 percent of respondents saw Repeat Business
Customers as being easy to use. Both Employer Penetration Rate and Repeat Business Customers
require the collection of data on services provided to employers, which was new to some states or in
others required changes to how these data were collected in the past.
In interviews, state program administrators generally described the measures as practical to
implement (i.e., each state was able to put in place an approach to tracking data for the purpose of
reporting on the measures); barriers to practicality came from the challenges that emerged in
collecting and reporting data across programs, echoing findings on reliability.
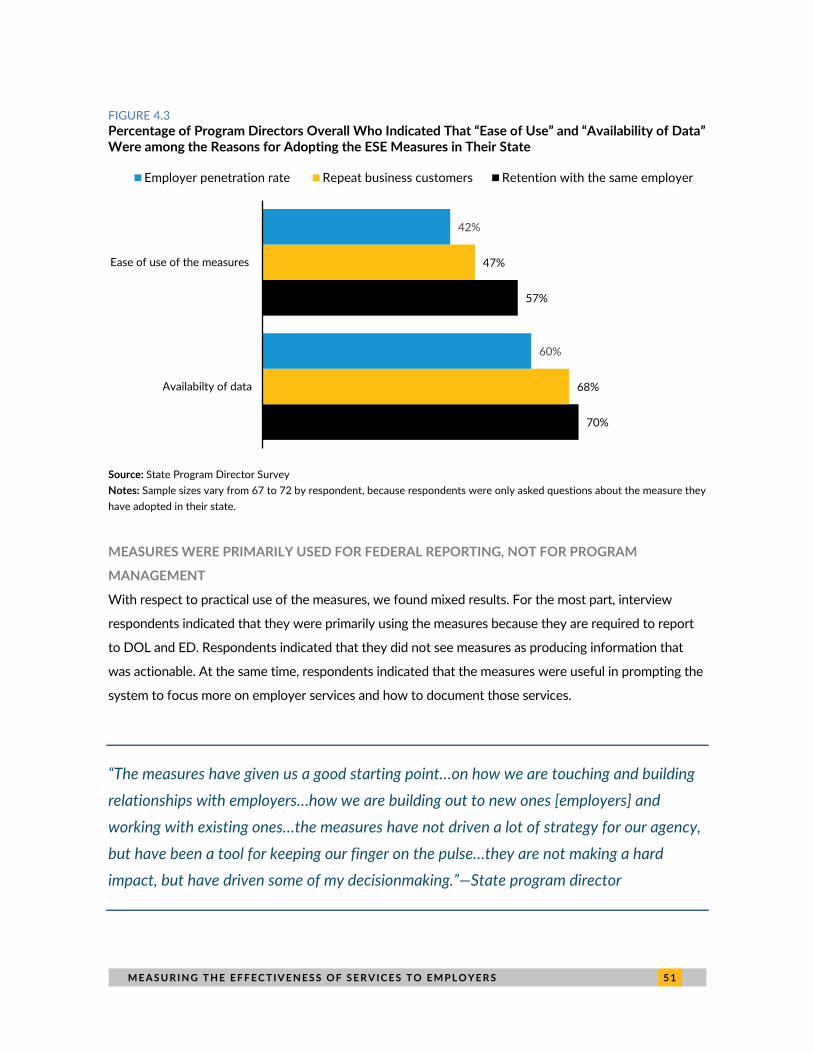
M E A S U R I N G T H E E F F E C T I V E N E S S O F S E R V I C E S T O E M P L O Y E R S 5 1
FIGURE 4.3 Percentage of Program Directors Overall Who Indicated That “Ease of Use” and “Availability of Data” Were among the Reasons for Adopting the ESE Measures in Their State
Source: State Program Director Survey Notes: Sample sizes vary from 67 to 72 by respondent, because respondents were only asked questions about the measure they have adopted in their state.
MEASURES WERE PRIMARILY USED FOR FEDERAL REPORTING, NOT FOR PROGRAM
MANAGEMENT
With respect to practical use of the measures, we found mixed results. For the most part, interview
respondents indicated that they were primarily using the measures because they are required to report
to DOL and ED. Respondents indicated that they did not see measures as producing information that
was actionable. At the same time, respondents indicated that the measures were useful in prompting the
system to focus more on employer services and how to document those services.
“The measures have given us a good starting point…on how we are touching and building relationships with employers…how we are building out to new ones [employers] and working with existing ones…the measures have not driven a lot of strategy for our agency, but have been a tool for keeping our finger on the pulse…they are not making a hard impact, but have driven some of my decisionmaking.”—State program director
70%
57%
68%
47%
60%
42%
Availabilty of data
Ease of use of the measures
Employer penetration rate Repeat business customers Retention with the same employer
5 2 M E A S U R I N G T H E E F F E C T I V E N E S S O F S E R V I C E S T O E M P L O Y E R S
EMPLOYER PENETRATION RATE MEASURE WAS USEFUL IN TRACKING OUTREACH TO
EMPLOYERS
Although most respondents indicated that they did not like the Employer Penetration Rate measure
because it does not capture the goals and outcomes for employers, in several states it was being used
to track efforts to market services to employers. In one state where local respondents were not aware
that states were reporting on the ESE measures, there were still specific targets with respect to
outreach to employers that were developed in coordination with local economic development
agencies. Data were entered for tracking progress toward established local metrics. Program
administrators liked how the measure was easy for staff to understand and clearly track progress
toward results. However, one issue observed with the Employer Penetration Rate measure was that it
was hard to know what a good rate looked like, but it could still be used as a tool to benchmark
progress.
What is a reasonable percentage for market penetration rate? Our rate is about 10 percent—is that reasonable? Is that acceptable?—State program administrator
A KEY ISSUE WAS THE TIMELINESS OF THE MEASURES
Across the states, respondents indicated that data on services provided to employers was entered in
an ongoing way as services were provided, but there were lags in the availability of data on employer
establishments for the Repeat Business Customers and Employer Penetration Rate measures and
delays in reporting that made the measures less meaningful for program management. The Repeat
Business Customers measure was further criticized because performance is measured over a three-
year period, making it less meaningful for driving changes in services provided to employers.
The only thing I would add in general about performance measures, they need to be timely. When performance measures are so delayed from action that occurred, it loses its usefulness. It’s almost by the time you figure out an issue, it’s too late to course correct. —State administrator
M E A S U R I N G T H E E F F E C T I V E N E S S O F S E R V I C E S T O E M P L O Y E R S 5 3
In three of four states where we conducted virtual visits to local areas, respondents had no
knowledge of the measures. There was some indication that states were waiting to fully implement
the measures until they become official measures and the measures have teeth. One respondent
called this a “hold-harmless” period and suggested they are waiting to see what kind of information
they are getting rather than using that information to drive strategy.
Unintended Consequences
As discussed, a key concern of implementing performance measures for workforce development
programs is whether such measures have unintended short- or long-term consequences on how
program services are delivered and, ultimately, adverse effects on employers or workers served by
such programs. As posed by Poister (2010) and Barnow (2011), are there negative consequences or
behaviors that result, such as the displacement of goals or conflict with other goals? Overall, based on
the survey of state programs, telephone interviews with state and local workforce officials, and
discussions with employers, no evidence has yet emerged on actual, specific unintended
consequences of the pilot ESE measures. But state and local workforce officials identified some
potential unintended consequences of each of the measures that could emerge, particularly if specific
sanctions are attached in the future to each of the ESE measures. As one state official observed
generally across the three piloted measures, “We have to be very vigilant for what we call perverse
incentives for performance measures or instances where doing something looks good on the measure
but it’s not really good for the customer.”
RESPONSES INDICATED GREATER CONCERN WITH THE EMPLOYER PENETRATION RATE
MEASURE COMPARED TO THE OTHER MEASURES
While the survey did not directly address the question of unintended consequences, there was one
question that probed states as to why they had not selected each of the three pilot ESE measures.
One of the 10 possible response categories for states not selecting a possible measure (such as
Employer Penetration Rate) was: “We were concerned implementing this measure would create
harmful incentives/disincentives.” A small number of program directors indicated that they were
concerned about unintended consequences in their selection of the measures: 0 out of 18 (0 percent)
for Repeat Business Customer, 1 out of 24 (4.2 percent) for Retention with the Same Employer, and 3
out of 19 (15.8 percent) for Employer Penetration Rate.
5 4 M E A S U R I N G T H E E F F E C T I V E N E S S O F S E R V I C E S T O E M P L O Y E R S
EMPLOYER PENETRATION RATE MEASURE COULD LEAD TO EMPHASIS ON QUANTITY OVER
QUALITY
Of the three measures, the most frequently mentioned concern during interviews with officials in
eight states centered on potential unintended consequences of too much emphasis by state or local
workforce officials being placed on the Employer Penetration Rate measure. While there was general
consensus that the Employer Penetration Rate was useful in terms of encouraging states and localities
to reach out to a wide range of employers in their region, if too much emphasis was placed on this
particular measure Title I to IV programs might overly emphasize quantity over quality in the provision
of employer services.
“I don’t want to incentivize the wrong things, I think if we look at the numerator and denominator for the [Employer Penetration Rate] measure, if that measure incentivizes people to give the same or different services to people. . . and serve a lot more employers. I do not want to give one-off services [to employers] to get a good high score for penetration rate and not give in-depth, quality services that employers need.” —State Workforce Board Director
EMPLOYER PENETRATION RATE MEASURE CONFLICTS WITH THE GOAL OF FOCUSING ON
INDUSTRY SECTORS
An additional concern with the Employer Penetration Rate measure was that it could push local
workforce areas and their business service staff to not adequately address the industry sectors that
were of greatest importance within the region or local area. The underlying concern was that if pushed
too hard on this particular measure to achieve a targeted outcome, local staff could potentially initiate
unnecessary and unproductive contacts with employers, especially focused on less intensive employer
services such as taking job orders to bulk up the Employer Penetration Rate (i.e., numbers of
employers served). Several state and local officials underscored the potential for unintended
consequences of the Employer Penetration Rate measure if it was overly emphasized or used as a sole
measure of employer service delivery.
M E A S U R I N G T H E E F F E C T I V E N E S S O F S E R V I C E S T O E M P L O Y E R S 5 5
REPEAT BUSINESS CUSTOMERS MEASURE MAY DISINCENTIVIZE OUTREACH TO NEW BUSINESSES AND SMALL BUSINESSES The principal underlying concern about the Repeat Business Customer measure among state and local
workforce officials was that the measure provides a disincentive for states and local workforce
programs to reach out to new businesses who do not already have existing partnerships with the
workforce system. Secondly, there was some concern businesses served might not need additional
services within the time period used under the measure, and in particular, this could be an issue for
smaller businesses that may need only a one-time or occasional service. These concerns were
reflected in the following comments from state and local workforce officials about the Repeat
Business Customer measure:
“When you ask about repeat business customers, small businesses may only need something from
you once in three to four years, not in three to four quarters. So, by definition the Repeat Business
Customers measure is targeted to big employers and is a disincentive for locals to serve small
employers because they likelihood they’ll come back is slim.”
RETENTION WITH THE SAME EMPLOYER MEASURE MAY DISINCENTIVIZE EFFORTS TO HELP PARTICIPANTS MOVE INTO HIGHER-PAYING JOBS Finally, during interviews with state and local officials, several noted that there is the potential for the
Retention with the Same Employer measure to create a disincentive to help participants move to a
better-paying or higher-skill job with a different employer. In this way, the goals for the employer
might be in conflict with the goals for the job seeker; under WIOA states and local areas must provide
follow-up services to job seekers after they exit programs to support retention and advancement.46
“[We] aim to train people up so that they have freedom of movement and wage increases…the retention with the same employer measure [ESE measure] might not incentivize that—if somebody gets a better job, that will be captured as a failure, even though for us that would be a success.”—State administrator
46 TEGL 19-16, p.3 explains that follow-up services are required: “Follow-up Services” States and local areas must
provide follow-up services for adults and dislocated worker participants who are placed in unsubsidized employment, for up to 12 months after the first day of employment. States and local areas must establish policies that define what are considered to be appropriate follow-up services, as well as policies for identifying when to provide follow-up services to participants. One type of follow-up service highlighted in WIOA is to provide individuals counseling about the work place. Follow-up services do not extend the date of exit in performance reporting; for more information on performance reporting, see “Training and Employment Guidance Letter No. 10-16, Change 1,” US Department of Labor, August 23, 2017, https://wdr.doleta.gov/directives/corr_doc.cfm?DOCN=3255
5 6 M E A S U R I N G T H E E F F E C T I V E N E S S O F S E R V I C E S T O E M P L O Y E R S
Summary Findings from our interviews with state and local workforce staff suggest that the pilot measures have
been helpful in getting the system to focus on the provision and tracking of services to employers. But
for each measure, we identified threats to validity, reliability, and practicality and found potential
unintended consequences. In summary, the pilot measures each have strengths and weaknesses that
should be considered in the selection of national measures in the future. Given the issues raised, it is
important to consider whether there are any alternative measures or data sources that could be better
than the pilot measures in assessing the effectiveness of services to employers. We explore this in
greater detail in the next chapter.
M E A S U R I N G T H E E F F E C T I V E N E S S O F S E R V I C E S T O E M P L O Y E R S 5 7
Chapter 5: Alternative Measures and Data Sources One of the goals of the study is to identify alternatives to the pilot measures adopted at the federal
level as well as other sources of data that could be used for assessing the effectiveness of services to
employers. This chapter discusses potential answers to research question 3 (discussed in Chapter 1):
What alternative measures or alternative data sources might be used to understand engagement with
and effectiveness of services to employers? It considers alternative measures and data sources
identified through our review of the literature, state program director survey, interviews with state
and local program administrators and staff, and other expert consultations. Key findings are as follows:
Few alternatives to the pilot measures emerged from federal programs, states, and other sources.
Where alternatives were identified, they were mostly either not appropriate as a shared
national measure or too complicated to administer, although one measure of the Business
Placement Rate may warrant further examination.
No clearly superior data sources were identified, but US Census Bureau data and private data
sources could be further studied.
5.1 Alternative Measures We identified alternative measures that have been adopted or proposed across different contexts.
First, we discuss ESE measures in use in federal programs. Second, we present measures currently
used in states and local areas for WIOA programs. Finally, we discuss measures proposed or used by
national intermediaries and initiatives outside of the public workforce system.47
47 A reviewer of this report suggested that the literature on economics of the firm and compensation theory might
provide useful insights for the performance measures for employer services. We concur, and although exploration of that literature is beyond the scope of this study, we offer a few observations here. First, the relatively new field of personnel economics offers suggestions on how to align the goals of individuals or organizations with the management unit funding the work. This is the principal-agent problem, and the economics and business literature suggest ways to better align the goals. For example, Lazear and Oyer (2007) suggest ways that incentive systems can crate distortions, how to deal with outcomes that are difficult or impossible to measure directly, and how to provide incentives in a team setting. Although we believe the personnel economics literature can provide useful insights for developing measures for serving employers in the public workforce system, it is important to keep in mind that the goal in a business setting (typically profit maximization) is often different than in a public setting, where the goals are more diffuse and include issues such as equity and fairness.
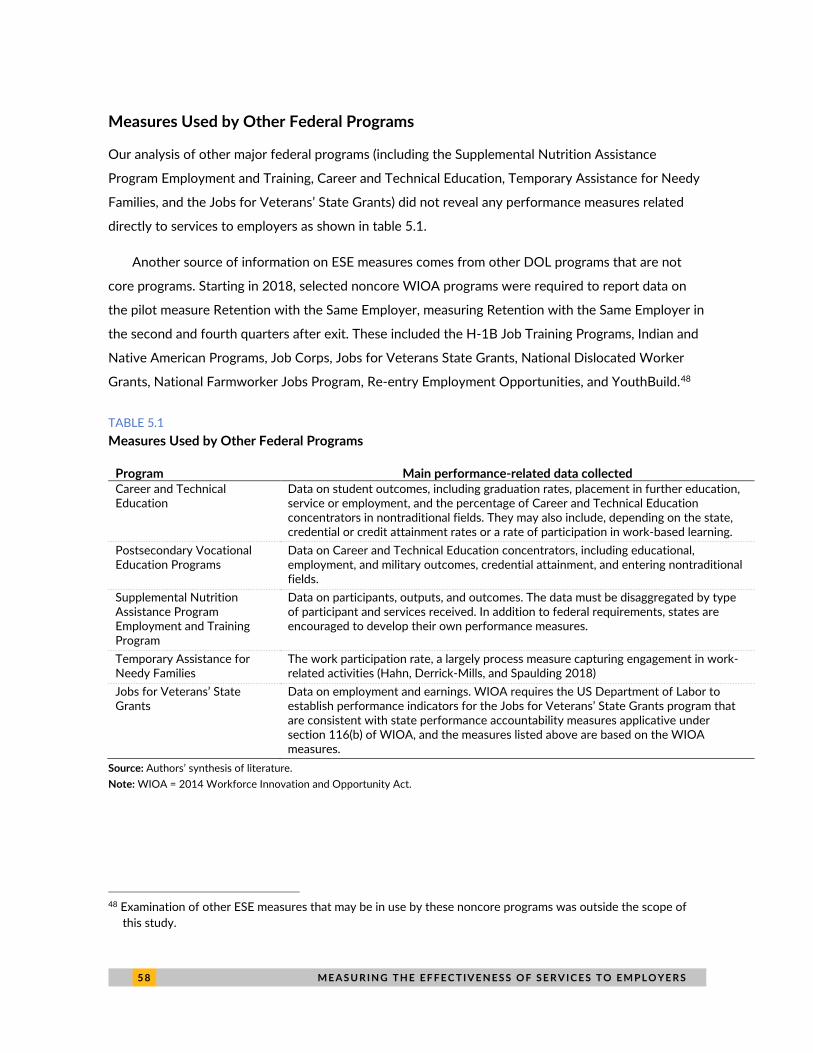
5 8 M E A S U R I N G T H E E F F E C T I V E N E S S O F S E R V I C E S T O E M P L O Y E R S
Measures Used by Other Federal Programs
Our analysis of other major federal programs (including the Supplemental Nutrition Assistance
Program Employment and Training, Career and Technical Education, Temporary Assistance for Needy
Families, and the Jobs for Veterans’ State Grants) did not reveal any performance measures related
directly to services to employers as shown in table 5.1.
Another source of information on ESE measures comes from other DOL programs that are not
core programs. Starting in 2018, selected noncore WIOA programs were required to report data on
the pilot measure Retention with the Same Employer, measuring Retention with the Same Employer in
the second and fourth quarters after exit. These included the H-1B Job Training Programs, Indian and
Native American Programs, Job Corps, Jobs for Veterans State Grants, National Dislocated Worker
Grants, National Farmworker Jobs Program, Re-entry Employment Opportunities, and YouthBuild.48
TABLE 5.1 Measures Used by Other Federal Programs
Program Main performance-related data collected Career and Technical Education
Data on student outcomes, including graduation rates, placement in further education, service or employment, and the percentage of Career and Technical Education concentrators in nontraditional fields. They may also include, depending on the state, credential or credit attainment rates or a rate of participation in work-based learning.
Postsecondary Vocational Education Programs
Data on Career and Technical Education concentrators, including educational, employment, and military outcomes, credential attainment, and entering nontraditional fields.
Supplemental Nutrition Assistance Program Employment and Training Program
Data on participants, outputs, and outcomes. The data must be disaggregated by type of participant and services received. In addition to federal requirements, states are encouraged to develop their own performance measures.
Temporary Assistance for Needy Families
The work participation rate, a largely process measure capturing engagement in work-related activities (Hahn, Derrick-Mills, and Spaulding 2018)
Jobs for Veterans’ State Grants
Data on employment and earnings. WIOA requires the US Department of Labor to establish performance indicators for the Jobs for Veterans’ State Grants program that are consistent with state performance accountability measures applicative under section 116(b) of WIOA, and the measures listed above are based on the WIOA measures.
Source: Authors’ synthesis of literature. Note: WIOA = 2014 Workforce Innovation and Opportunity Act.
48 Examination of other ESE measures that may be in use by these noncore programs was outside the scope of
this study.
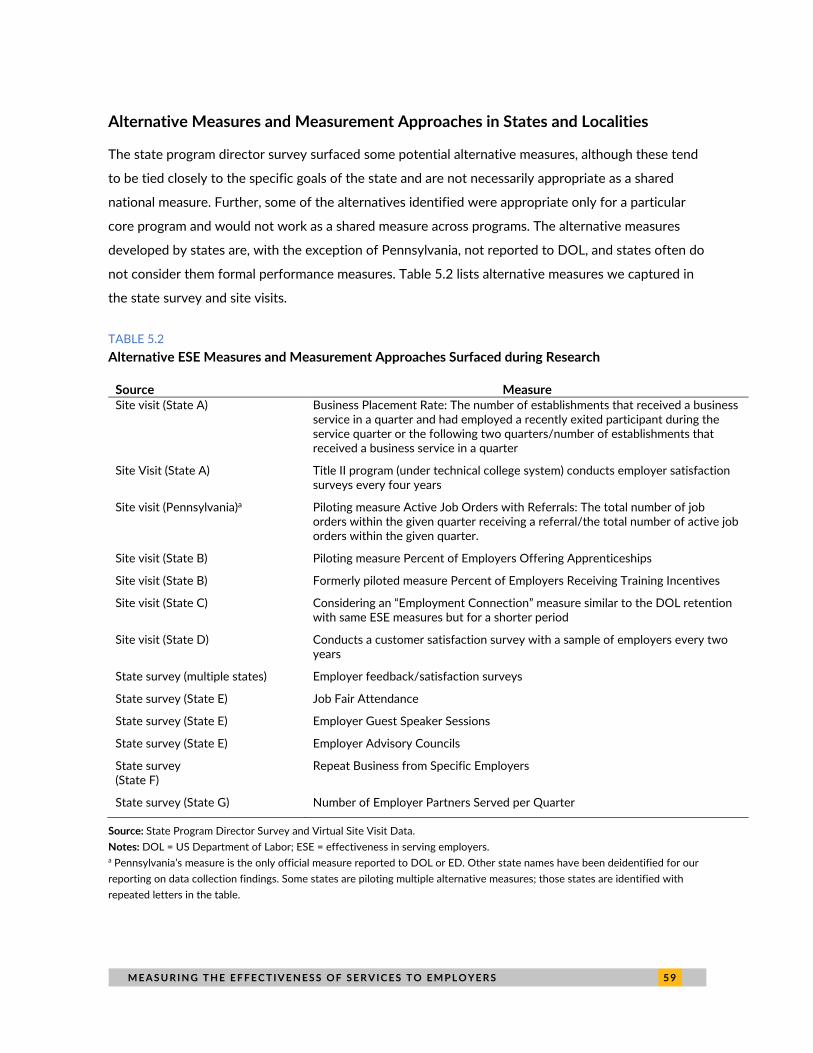
M E A S U R I N G T H E E F F E C T I V E N E S S O F S E R V I C E S T O E M P L O Y E R S 5 9
Alternative Measures and Measurement Approaches in States and Localities
The state program director survey surfaced some potential alternative measures, although these tend
to be tied closely to the specific goals of the state and are not necessarily appropriate as a shared
national measure. Further, some of the alternatives identified were appropriate only for a particular
core program and would not work as a shared measure across programs. The alternative measures
developed by states are, with the exception of Pennsylvania, not reported to DOL, and states often do
not consider them formal performance measures. Table 5.2 lists alternative measures we captured in
the state survey and site visits.
TABLE 5.2 Alternative ESE Measures and Measurement Approaches Surfaced during Research
Source Measure Site visit (State A) Business Placement Rate: The number of establishments that received a business
service in a quarter and had employed a recently exited participant during the service quarter or the following two quarters/number of establishments that received a business service in a quarter
Site Visit (State A) Title II program (under technical college system) conducts employer satisfaction surveys every four years
Site visit (Pennsylvania)a Piloting measure Active Job Orders with Referrals: The total number of job orders within the given quarter receiving a referral/the total number of active job orders within the given quarter.
Site visit (State B) Piloting measure Percent of Employers Offering Apprenticeships
Site visit (State B) Formerly piloted measure Percent of Employers Receiving Training Incentives
Site visit (State C) Considering an “Employment Connection” measure similar to the DOL retention with same ESE measures but for a shorter period
Site visit (State D) Conducts a customer satisfaction survey with a sample of employers every two years
State survey (multiple states) Employer feedback/satisfaction surveys
State survey (State E) Job Fair Attendance
State survey (State E) Employer Guest Speaker Sessions
State survey (State E) Employer Advisory Councils
State survey (State F)
Repeat Business from Specific Employers
State survey (State G) Number of Employer Partners Served per Quarter
Source: State Program Director Survey and Virtual Site Visit Data. Notes: DOL = US Department of Labor; ESE = effectiveness in serving employers. a Pennsylvania’s measure is the only official measure reported to DOL or ED. Other state names have been deidentified for our reporting on data collection findings. Some states are piloting multiple alternative measures; those states are identified with repeated letters in the table.
6 0 M E A S U R I N G T H E E F F E C T I V E N E S S O F S E R V I C E S T O E M P L O Y E R S
Two measures listed in table 5.1 merit consideration for the national level. The Pennsylvania
measure, active job orders with referrals, captures to what extent job orders (employer services) lead
to referrals. However, it may not be as useful as a measure that captures outcomes, such as a hire. The
Business Placement Rate measure described in table 5.1 is notable because it may capture how often a
given workforce service led to a hire. This potentially captures effectiveness.
As discussed, a primary mechanism for assessing the effectiveness of services to employers before
WIOA was a customer satisfaction survey. In our interviews with states and local areas, we found that
such surveys continue to be used in some states. Many virtual site visit respondents emphasized that
employer satisfaction surveys (or other ways of gauging employer satisfaction like employer forums or
calling select employers to get feedback) are a useful way of capturing whether the public workforce
system is meeting its goals with respect to employers. However, challenges exist in measuring
employer satisfaction, including typically low response rates and high cost. Moreover, simple
satisfaction questions (such as the ones previously used) do not provide information on how
satisfaction could be increased.
Future work could examine these and other measures that states are using or considering
adopting. This possibility is discussed in further detail in Chapter 6.
Other Approaches to Measuring Employer Services
Table 5.3 summarizes three measures identified from the literature proposed for public workforce
system or in use by organizations outside it. Although the proposed measures are interesting, they
largely capture process rather than outcomes, or they would be complex to implement at the federal
level.
These measures have some good features. Notably, they focus on the intensity of effort by the
workforce system or employers. In our interviews with state and local program administrators and
staff, we heard concerns about the pilot measures assigning equal weight to all services for the
Employer Penetration Rate measure. The approach proposed by the Aspen Institute would account for
these differences but might be complicated to administer at the federal level, especially in relation to
penalties for low performance. However, the measures in table 5.3 might be useful to states to help
them assess their mix of activities and services for employers and potentially to protect against any
unintended consequences that emphasize quantity over quality.
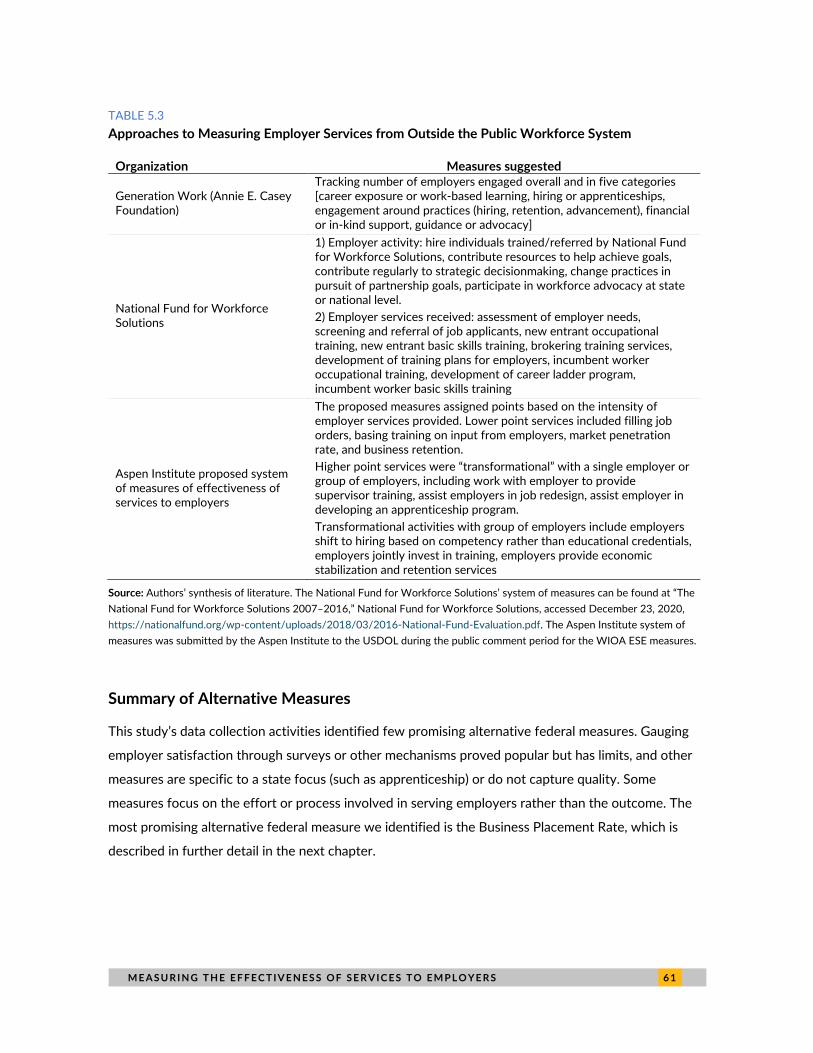
M E A S U R I N G T H E E F F E C T I V E N E S S O F S E R V I C E S T O E M P L O Y E R S 6 1
TABLE 5.3 Approaches to Measuring Employer Services from Outside the Public Workforce System
Organization Measures suggested
Generation Work (Annie E. Casey Foundation)
Tracking number of employers engaged overall and in five categories [career exposure or work-based learning, hiring or apprenticeships, engagement around practices (hiring, retention, advancement), financial or in-kind support, guidance or advocacy]
National Fund for Workforce Solutions
1) Employer activity: hire individuals trained/referred by National Fund for Workforce Solutions, contribute resources to help achieve goals, contribute regularly to strategic decisionmaking, change practices in pursuit of partnership goals, participate in workforce advocacy at state or national level. 2) Employer services received: assessment of employer needs, screening and referral of job applicants, new entrant occupational training, new entrant basic skills training, brokering training services, development of training plans for employers, incumbent worker occupational training, development of career ladder program, incumbent worker basic skills training
Aspen Institute proposed system of measures of effectiveness of services to employers
The proposed measures assigned points based on the intensity of employer services provided. Lower point services included filling job orders, basing training on input from employers, market penetration rate, and business retention. Higher point services were “transformational” with a single employer or group of employers, including work with employer to provide supervisor training, assist employers in job redesign, assist employer in developing an apprenticeship program. Transformational activities with group of employers include employers shift to hiring based on competency rather than educational credentials, employers jointly invest in training, employers provide economic stabilization and retention services
Source: Authors’ synthesis of literature. The National Fund for Workforce Solutions’ system of measures can be found at “The National Fund for Workforce Solutions 2007–2016,” National Fund for Workforce Solutions, accessed December 23, 2020, https://nationalfund.org/wp-content/uploads/2018/03/2016-National-Fund-Evaluation.pdf. The Aspen Institute system of measures was submitted by the Aspen Institute to the USDOL during the public comment period for the WIOA ESE measures.
Summary of Alternative Measures
This study’s data collection activities identified few promising alternative federal measures. Gauging
employer satisfaction through surveys or other mechanisms proved popular but has limits, and other
measures are specific to a state focus (such as apprenticeship) or do not capture quality. Some
measures focus on the effort or process involved in serving employers rather than the outcome. The
most promising alternative federal measure we identified is the Business Placement Rate, which is
described in further detail in the next chapter.
6 2 M E A S U R I N G T H E E F F E C T I V E N E S S O F S E R V I C E S T O E M P L O Y E R S
5.2 Alternative Data Sources Currently, the pilot measures rely on two data sources; the Quarterly Census of Employment and
Wages (QCEW), a US Bureau of Labor Statistics (BLS) database that covers 95 percent of US jobs by
detailed industry, and employer-reported unemployment insurance (UI) wage records.49 The study
team conducted an analysis of possible alternative data sources, including the Census Bureau Listing
of Employers and private databases, as well as the National Directory of New Hires (NDNH).
The QCEW is a quarterly count of employment and wages reported by employers. The QCEW
covers jobs available at the county, Metropolitan Statistical Area, state, and national level. The primary
source for the QCEW is administrative data from state UI programs. These data are supplemented by
data from two BLS surveys: The Annual Refiling Survey and the Multiple Worksite Report. Before
publication, BLS and state workforce agencies review and enhance the QCEW data, correcting errors,
and confirming and annotating unusual movements.50
The Census Bureau Listing of Employers is different than the QCEW, and it is not clear which is
more accurate. Research by BLS and the Census Bureau indicates that although the aggregate total
employment is similar, differences increase when individual states and industries are analyzed;
Fairman, Krizan, and Rucker (2008) summarize this research. The BLS data is gathered monthly and
quarterly, while the Census data is mainly gathered every five years (years ending in 2 and 7). A study
based on 2001 data found that the BLS list has more establishments, while the Census list has more
employment and wages (Fairman, Krizan, and Rucker 2008). The BLS list is based on data provided
primarily by state workforce agencies, and the Census data are primarily provided by the Internal
Revenue Service, but the US Census Bureau also receives data from BLS and the Social Security
Administration. Additional analysis to assess and compare discrepancies between the BLS and Census
lists could shed light on potential reasons why the databases provide somewhat different counts, but
the greater frequency of the BLS data makes it appear superior at this time.
Many firms offer lists of employers for a fee, including Dun & Bradstreet, Experian, InfoUSA,
Equifax, TransUnion, Ansonia, and PayNet. To use a private vendor, DOL and ED would work with the
vendor or vendors to specify the criteria for listing firms and what additional firm information would
be included with the list (which affects the price). The additional information could be useful for state
49 “Training and Employment Guidance Letter No. 10-16, Change 1,” US Department of Labor, August 23, 2017,
https://wdr.doleta.gov/directives/corr_doc.cfm?DOCN=3255. 50 “Quarterly Census of Employment and Wages: Overview, US Bureau of Labor Statistics, last modified May 7,
2020, https://www.bls.gov/opub/hom/cew/home.htm.
M E A S U R I N G T H E E F F E C T I V E N E S S O F S E R V I C E S T O E M P L O Y E R S 6 3
and Local Workforce Development Boards to target firms for specific services and for developing
statistical adjustment models for the measures, and at least one state we interviewed is using privately
collected employer data for targeting services. However, our analysis suggests that these datasets are
not likely to be more accurate than the QCEW. Three researchers who have used data from one
vendor expressed concern to us about the timeliness of the data as well as the cost; several users
pointed out that private vendors’ data often reflects employment from five or more years ago and that
the listings do not accurately capture when firms go out of business.51
One state suggested a different modification to the data used in the performance measurement
system that would apply to the participant measures as well as two of the ESE measures. The current
DOL and ED performance system relies on UI wage record data for information on employment and
earnings. This state suggested that it would be preferable to use the NDNH data. NDNH data come
from state wage record data, but instead of only providing quarterly employment and earnings data,
NDNH provides monthly earnings data and the date when employment commenced. NDNH data
could be promising, but use of the data is highly restricted, and the data are currently only available for
the eight previous quarters. Thus, NDNH is worth further exploration as a substitute for UI wage
record data, but it is not currently a superior source of data for the performance measures.
In sum, we did not find a strong rationale to consider replacing the QCEW. However, it would be
useful to explore other databases, especially the Census Bureau Listing of Employers. If such an
analysis were conducted, it would be useful to assess how similar the pilot measure results are using
census and QCEW data. There also may be merit in testing the NDNH data rather than the UI wage
record data for both participant and ESE measures to gauge whether the NDNH data would be
superior if more accessible.
51 This information was obtained from discussions with researchers who have used these data sources and was
not obtained from the survey of state directors or interviews with state officials.
6 4 M E A S U R I N G T H E E F F E C T I V E N E S S O F S E R V I C E S T O E M P L O Y E R S
Chapter 6: Options and Considerations for Next Steps This chapter discusses options for developing measures of the effectiveness of the core programs in
serving employers. Here we address the fourth research question: What are the options,
considerations, and next steps for identifying and defining measures of effectiveness in serving
employers? The research team was asked to conduct a comparative assessment of the measures,
explore options for statistical adjustment moving forward, and identify areas for potential further
research and study. We first discuss considerations for selecting a single measure or more than one
measure, and we then provide criteria for selecting among the three pilot measures. In the final section
of the chapter, we provide conclusions and next steps.
Figure 1.1 provided the conceptual framework for the WIOA core programs, with the inputs,
activities, outputs, and outcomes identified. The pilot ESE measures are proxies for outputs and
outcomes of the programs; the Employer Penetration Rate measure focuses on the number of
employers served, which is an output of the program, while the Retention with the Same Employer
and Repeat Business Customers measures reflect intermediate program outcomes, as measured by
employment retention with employers and repeat business by employers, respectively. To inform
decisions on how many measures to use and which measure or measures to use, we use the concepts
of validity, reliability, practicality, and unintended consequences that have been used throughout the
report to assess the pilot measures. We further discuss options for future work and research to
support successful implementation of the adopted measures.
6.1 Options and Considerations for Measure Adoption
Considerations for Choosing One or More than One Measure
Section 116 of the WIOA statute requires the establishment of performance measures for the core
WIOA programs. Section 116 spells out specific requirements for the performance measures based on
participant outcomes relating to employment and earnings after participation, attainment of
credentials, and measurable skill gains. Workforce development programs have had a great deal of
experience defining and measuring program performance based on the experiences of participants,
but they have had much less experience measuring performance in serving employers. Thus, rather
M E A S U R I N G T H E E F F E C T I V E N E S S O F S E R V I C E S T O E M P L O Y E R S 6 5
than stipulate specific performance measures for effectiveness in serving employers, the statute
required the Secretary of Labor and the Secretary of Education to develop and establish one or more
measures of the effectiveness of services to employers. As discussed previously, three measures have
been piloted, and a decision must be made on which measure or measures should be adopted.
An important decision to be made is whether a single ESE measure should be adopted or if two or
more measures should be adopted. There are factors that favor selecting a single measure, and there
are other factors that support selecting several measures. We provide analogies to the participant
measures to make the considerations more familiar. Factors that support selecting a single measure
are as follows:
One measure would require less record keeping and reduced burden in collecting data and
measuring performance. Using several performance measures means that states and local
areas must maintain more data, and audits and quality control efforts will necessitate review
of more data sources. The pilot measures make use of administrative records on which
employers are served as well as state unemployment insurance wage records and Bureau of
Labor Statistics QCEW data. Selecting a single measure would simplify the process and
possibly reduce the number of data sources required.
One measure would provide clarity on how state performance is assessed. If a single ESE
measure is selected, states will know how they will be measured, whereas if several measures
are selected, there could be some conflict or confusion (although states currently deal with
multiple participant measures).
The statute requires only one measure. Section 116b(2)(iv) of WIOA indicates that there
should be “1 or more primary indicators of performance that indicate the effectiveness of the
core programs in serving employers.” There is no conference report for WIOA, so the record
does not indicate whether Congress had a preference for a single measure.
Currently, many noncore DOL programs use a single performance measure for employer
services. These programs are H-1B Job Training Programs, Indian and Native American
Programs, Job Corps, Jobs for Veterans State Grants, National Dislocated Worker Grants,
National Farmworker Jobs Program, Re-entry Employment Opportunities, and YouthBuild.
These programs use only Retention with the Same Employer, and using the same measure for
the core programs would facilitate comparing performance across programs.
6 6 M E A S U R I N G T H E E F F E C T I V E N E S S O F S E R V I C E S T O E M P L O Y E R S
There are also reasons why adopting more than one measure might be preferable:
The pilot measures (and alternative measures) capture different aspects of performance. The
three pilot measures capture different aspects of how effectively WIOA programs are serving
employers. The Employer Penetration Rate measure addresses the issue of what share of
employers are being served, the Repeat Business Customers measure is a proxy for whether
employers are satisfied enough to return for more service in subsequent years, and the
Retention with the Same Employer measure addresses the quality of the employer-worker
match by focusing on whether workers remain with employers. Although these measures all
provide potential indicators of success in dealing with employers, they capture different
aspects of success. If only one of the measures is adopted, the system will ignore aspects of
how well employers are served. It is likely that similar thinking was used when Congress
mandated multiple measures for success in serving participants (e.g., employment, earnings,
skill gains, and attainment of credentials).
Several measures are likely to reduce unintended consequences. In addition to creating
incentives for states to behave in a desirable way, performance measures sometimes provide
incentives that are not desired. For example, if the WIOA participant performance measures
only included measures related to employment but not earnings, states would have an
incentive to ignore earnings gains in their placement activities; having both employment and
earnings measures helps mitigate the unintended consequences. In our analysis of the
strengths and weaknesses of the pilot ESE measures below, we describe some of the
unintended consequences that could result from the pilot measures. By having several
measures, states are likely to focus their efforts on all the measures, and this would likely
reduce the unintended consequences. For example, if the Employer Penetration Rate were the
only measure, states might focus only on increasing the share of employers served, but the
presence of one or both of the other two pilot measures would encourage states to also strive
for encouraging employers to use WIOA services in the future and create good matches so
that workers remain longer with employers served.
WIOA uses several measures for the participant performance measures. The statute appears to
recognize the value of having several measures, because there are several performance measures
in WIOA. Although the statute does not provide the rationale for having several participant
measures, the various measures capture different aspects of outcomes for participants.
Because there are pros and cons of each strategy, there is no overwhelming case for having either one
measure or several measures. Our assessment is that having more than one measure is a better
strategy because it would capture more aspects of performance and reduce unintended
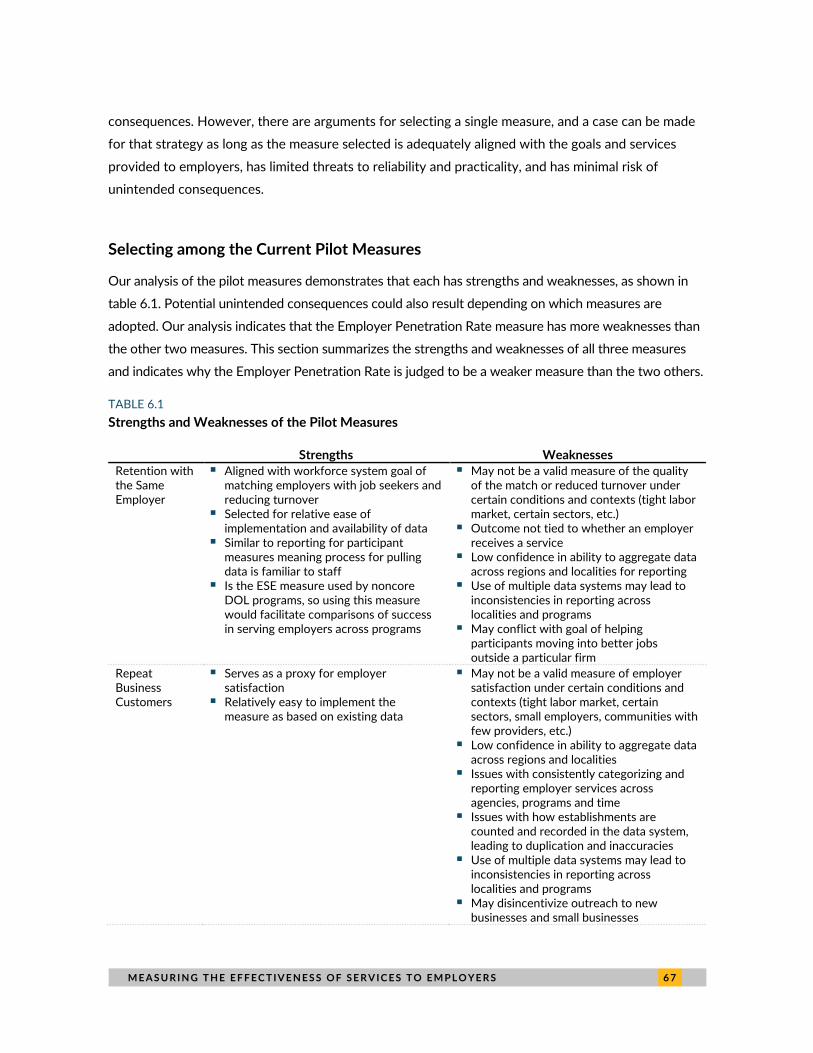
M E A S U R I N G T H E E F F E C T I V E N E S S O F S E R V I C E S T O E M P L O Y E R S 6 7
consequences. However, there are arguments for selecting a single measure, and a case can be made
for that strategy as long as the measure selected is adequately aligned with the goals and services
provided to employers, has limited threats to reliability and practicality, and has minimal risk of
unintended consequences.
Selecting among the Current Pilot Measures
Our analysis of the pilot measures demonstrates that each has strengths and weaknesses, as shown in
table 6.1. Potential unintended consequences could also result depending on which measures are
adopted. Our analysis indicates that the Employer Penetration Rate measure has more weaknesses than
the other two measures. This section summarizes the strengths and weaknesses of all three measures
and indicates why the Employer Penetration Rate is judged to be a weaker measure than the two others.
TABLE 6.1 Strengths and Weaknesses of the Pilot Measures
Strengths Weaknesses Retention with the Same Employer
Aligned with workforce system goal of matching employers with job seekers and reducing turnover
Selected for relative ease of implementation and availability of data
Similar to reporting for participant measures meaning process for pulling data is familiar to staff
Is the ESE measure used by noncore DOL programs, so using this measure would facilitate comparisons of success in serving employers across programs
May not be a valid measure of the quality of the match or reduced turnover under certain conditions and contexts (tight labor market, certain sectors, etc.)
Outcome not tied to whether an employer receives a service
Low confidence in ability to aggregate data across regions and localities for reporting
Use of multiple data systems may lead to inconsistencies in reporting across localities and programs
May conflict with goal of helping participants moving into better jobs outside a particular firm
Repeat Business Customers
Serves as a proxy for employer satisfaction
Relatively easy to implement the measure as based on existing data
May not be a valid measure of employer satisfaction under certain conditions and contexts (tight labor market, certain sectors, small employers, communities with few providers, etc.)
Low confidence in ability to aggregate data across regions and localities
Issues with consistently categorizing and reporting employer services across agencies, programs and time
Issues with how establishments are counted and recorded in the data system, leading to duplication and inaccuracies
Use of multiple data systems may lead to inconsistencies in reporting across localities and programs
May disincentivize outreach to new businesses and small businesses
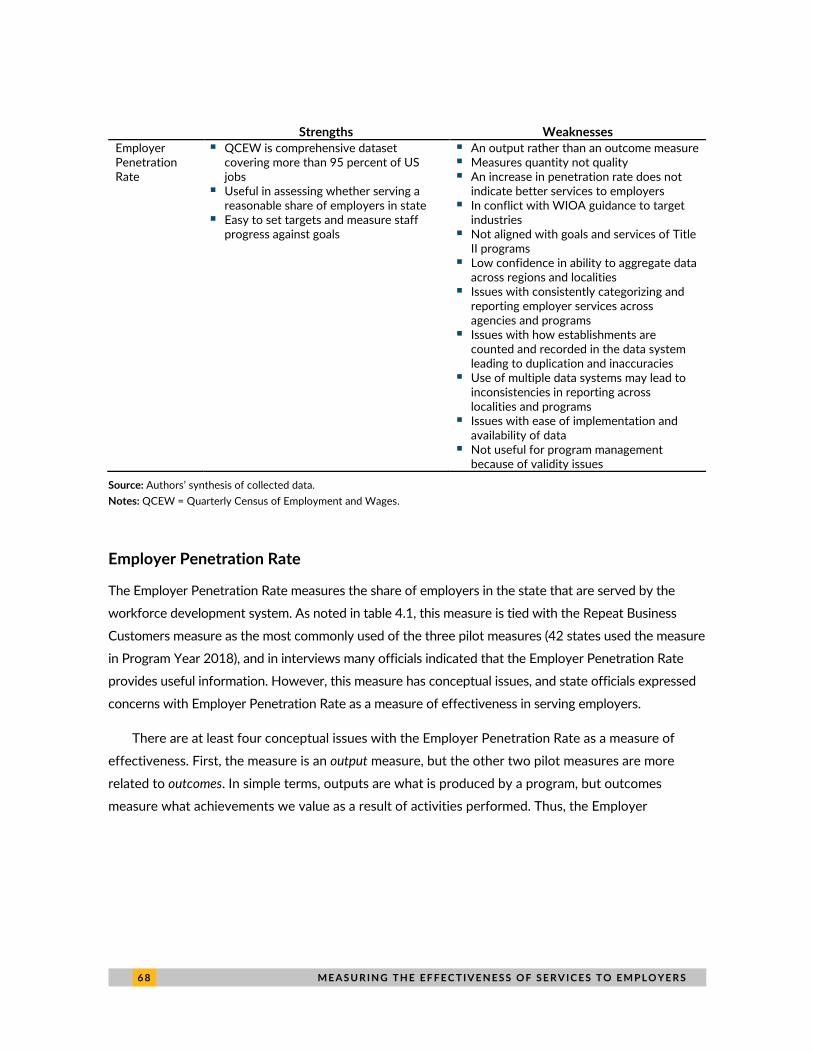
6 8 M E A S U R I N G T H E E F F E C T I V E N E S S O F S E R V I C E S T O E M P L O Y E R S
Strengths Weaknesses Employer Penetration Rate
QCEW is comprehensive dataset covering more than 95 percent of US jobs
Useful in assessing whether serving a reasonable share of employers in state
Easy to set targets and measure staff progress against goals
An output rather than an outcome measure Measures quantity not quality An increase in penetration rate does not
indicate better services to employers In conflict with WIOA guidance to target
industries Not aligned with goals and services of Title
II programs Low confidence in ability to aggregate data
across regions and localities Issues with consistently categorizing and
reporting employer services across agencies and programs
Issues with how establishments are counted and recorded in the data system leading to duplication and inaccuracies
Use of multiple data systems may lead to inconsistencies in reporting across localities and programs
Issues with ease of implementation and availability of data
Not useful for program management because of validity issues
Source: Authors’ synthesis of collected data. Notes: QCEW = Quarterly Census of Employment and Wages.
Employer Penetration Rate
The Employer Penetration Rate measures the share of employers in the state that are served by the
workforce development system. As noted in table 4.1, this measure is tied with the Repeat Business
Customers measure as the most commonly used of the three pilot measures (42 states used the measure
in Program Year 2018), and in interviews many officials indicated that the Employer Penetration Rate
provides useful information. However, this measure has conceptual issues, and state officials expressed
concerns with Employer Penetration Rate as a measure of effectiveness in serving employers.
There are at least four conceptual issues with the Employer Penetration Rate as a measure of
effectiveness. First, the measure is an output measure, but the other two pilot measures are more
related to outcomes. In simple terms, outputs are what is produced by a program, but outcomes
measure what achievements we value as a result of activities performed. Thus, the Employer
M E A S U R I N G T H E E F F E C T I V E N E S S O F S E R V I C E S T O E M P L O Y E R S 6 9
Penetration Rate measures services provided, but the other two pilot measures more directly capture
what results from the program.52
Second, the Employer Penetration Rate formula does not reflect WIOA guidance to focus on
targeted industries. WIOA places an emphasis on designing services to meet the needs of a targeted
set of in-demand industries, as reflected in rules regarding the composition of state workforce boards
and what must be included in state plans as well as the emphasis on industry partnerships in the law.53
As a result, many states focus on particular industries or sectors for their workforce development
activities, such as health and hospitality. Sectors are generally selected based on suitability for the
population served, demand by employers, and wages paid. The Employer Penetration Rate measure
provides incentives to provide services to employers regardless of industry type, but states may prefer
to focus on sectors they target.
Third, as an output measure, the Employer Penetration Rate is a measure of quantity rather than
quality of services provided. In the state program director survey, the Employer Penetration Rate
measure was rated the lowest in capturing quality of services provided among respondents by each of
the four titles. Finally, an increase in the Employer Penetration Rate means that more employers were
served, but it does not indicate better services to employers.
As noted, the state program directors survey also identified some problems with Employer
Penetration Rate as a performance measure relative to the other two pilot measures. Among those
responding to the survey, the Employer Penetration Rate measure was ranked last in terms of ease of
implementation, with 41 percent indicating the measure is easy to implement compared with 47
percent and 56 percent for the Repeat Business Customers measure and the Retention with the Same
Employer measure, respectively. The Employer Penetration Rate measure also ranked behind the
other two pilot measures on availability of data, with 59 percent responding that the data are readily
available compared with 68 percent and 71 percent for the Repeat Business Customers measure and
the Retention with the Same Employer measure, respectively. Finally, Title II state officials noted in
interviews that the Employer Penetration Rate does not reflect the way that they provide adult
education services, which are often resource and time intensive and are difficult to provide to a large
number of employers given current funding constraints.
52 The Repeat Business Customers measure is likely related to how satisfied employers are with the services
provided, and the Retention with the Same Employer measure is likely an indication of satisfaction by the workers and the employers with the match.
53 See Barnow and Spaulding (2015) for a discussion of these provisions.
7 0 M E A S U R I N G T H E E F F E C T I V E N E S S O F S E R V I C E S T O E M P L O Y E R S
In summary, the Employer Penetration Rate has conceptual issues and data issues that suggest it is
not as useful a pilot measure as the other two. But these points do not imply the Employer
Penetration Rate does not provide useful data. State officials that were interviewed stated that the
Employer Penetration Rate measure provides information useful to them in managing their program—
it can help them see if they are serving a reasonable share of employers in the state; even if the
measure is not selected, technical assistance can be provided on how the Penetration Rate can be
useful for management purposes. In the next section we suggest some ways that the Employer
Penetration Rate measure can be made more useful by providing data on sectors of most interest to
each state and by disaggregating the data by WIOA title.
Repeat Business Customers
As noted in TEGL 10-16, Change 1,54 the Repeat Business Customers measure is a proxy for employer
satisfaction: “This approach is useful in determining whether employers who receive services from the
core programs are satisfied with those services and become repeat customers. This approach also
assesses the workforce system’s ability to develop and maintain strong relationships with employers
over extended periods of time.”
In the program director survey, the measure was ranked highly in some respects, but it was not
ranked highly in others. As shown in table 4.3, when asked if they were able to aggregate information
into a statewide measure across programs, only 30 percent of respondents stated that their ability to
aggregate the data across programs was strong or very strong; for the other two measures, 41 percent
of respondents said their ability was strong or very strong. In terms of their ability to aggregate across
regions or localities, 40 percent of respondents noted they felt strong or very strongly able to do so
compared with 30 percent for the Retention with the Same Employer measure and 46 percent for the
Employer Penetration Rate measure. As shown in figure 4.3, the Repeat Business Customers measure
was ranked between the two other pilot measures for ease of measure implementation (47 percent
compared with 41 percent for the Employer Penetration Rate measure and 56 percent for the
Retention with the Same ESE measures). The Repeat Business Customers measure was also ranked
between the two other pilot measures for availability of data (68 percent compared with 59 percent
for the Employer Penetration Rate measure and 71 percent for the Retention with the Same Employer
measure).
54 See page 26 of “Training and Employment Guidance Letter No. 10-16, Change 1,” US Department of Labor,
August 23, 2017, https://wdr.doleta.gov/directives/corr_doc.cfm?DOCN=3255.
M E A S U R I N G T H E E F F E C T I V E N E S S O F S E R V I C E S T O E M P L O Y E R S 7 1
In interviews with state officials, the respondents noted that the Repeat Business Customers
measure was generally a sign of employer satisfaction but that employers can only make use of WIOA
services when there is demand for these services, such as when employers have job openings, when
they require rapid response services when undergoing layoffs, or when they would like incumbent
worker training. Thus, repeat business is likely to be affected by factors such as economic conditions,
employment growth in the industry, and turnover in the industry in addition to satisfaction with
services provided. Also, federal contractors must generally list their openings with the state
employment service, and some firms are required to work with the Employment Service and state
veterans programs to comply with equal employment opportunity provisions, so repeat business may
reflect the firm’s source of revenue rather than the quality of services received. These factors can be
at least partially mitigated if a statistical adjustment model is used. Also, the three-year period in the
Repeat Business Customers measure reduces the practicality of the measure because the reports are
less timely than measures using a shorter period, particularly the Employer Penetration Rate
measure.55
Retention with the Same Employer
The Retention with the Same Employer measure is also related to an outcome. TEGL 10-16, Change 1
states: “This approach is useful in determining whether the core programs are serving employers
effectively by improving the skills of their workforce and decreasing employee turnover.”56 Like the
Repeat Business Customers measure, this pilot measure is likely to be related to the quality of services
provided by the workforce system. Although it captures different aspects of the quality of service than
the Repeat Business Customers measure, namely whether a placed worker is a good fit for the job or
core programs are contributing to reduced turnover, it has similar attributes.
In the program director survey, respondents gave mixed responses on whether they were able to
aggregate information across programs and across areas as shown in table 4.4. For the former, the
Retention with the Same Employer measure tied with the Employer Penetration Rate measure as the
ESE measure where the most respondents indicated they strongly or very strongly agreed that they
could aggregate data across programs (41 percent for the Retention with the Same Employer measure
and the Employer Penetration Rate measure, and 30 percent for the Repeat Business Customers
55 If not used as a performance measure, this data could be made available to states to help them better
understand their patterns in serving employers. 56 “Training and Employment Guidance Letter No. 10-16, Change 1,” US Department of Labor, August 23, 2017,
https://wdr.doleta.gov/directives/corr_doc.cfm?DOCN=3255
7 2 M E A S U R I N G T H E E F F E C T I V E N E S S O F S E R V I C E S T O E M P L O Y E R S
measure). However, for ability to aggregate across regions and local areas, the measure ranked lowest
(30 percent responded strong or very strong compared with 40 percent for the Employer Penetration
Rate and Repeat Business Customers measures). The measure scored better than the other two pilot
measures in terms of ease of measure implementation and availability of data when asked why they
were using particular measures (figure 4.3). Fifty-seven percent of the respondents indicated that ease
of measure implementation was a factor in selecting the Retention with the Same Employer measure,
while the corresponding figures for the other two pilot measures were 42 percent for the Employer
Penetration Rate measure and 47 percent for the Repeat Business Customers measure. Seventy
percent of the respondents to the program director survey indicated that availability of data was a
factor in why they selected that measure, and the corresponding figures for the other two pilot
measures were 60 percent for the Employer Penetration Rate measure and 68 percent for the Repeat
Business Customers measure.
A factor suggesting adoption of the Retention with the Same Employer measure is that other
noncore programs are required to report on this measure. If adopted, there would be a single measure
in place across WIOA core and many noncore programs.
Like the Repeat Business Customers measure, the Retention with the Same Employer Measure is
subject to variation by economic conditions, industry, and sector. There was some concern that there
might be unintended consequences of the measure creating disincentives for the workforce system to
support job seekers in moving into better jobs outside a particular firm, which may be a common
pathway to advancement in some sectors. A statistical adjustment model would likely help control for
these factors and make the measures more appropriate. Furthermore, an option to consider would be
to exclude participants from the measure any participants who change employers and earn as much as
or more than in their previous job.
Finally, in analyzing the Retention with the Same Employer measure, we found one aspect of the
measure worthy of consideration. Unlike the Employer Penetration Rate measure and the Repeat
Business Customers measure, the Retention with the Same Employer measure does not account for
whether participants who retained employment work for an employer who received business services
from any of the WIOA core programs. Thus, states receive credit in serving employers for workers
who remain with the same employer even if the participants were employed by firms that received no
employer services. A potential revision to this definition to consider would involve adding the italicized
material:
M E A S U R I N G T H E E F F E C T I V E N E S S O F S E R V I C E S T O E M P L O Y E R S 7 3
“The number of participants with wage records who exit during the reporting period and were
employed by the same employer during the second quarter after exit and the fourth quarter
after exit provided that the employer received business services from a WIOA core program
divided by the number of participants with wage records who exit and were employed during
the second quarter after exit by an employer that received business services.”
A concern expressed by reviewers of this report was that making this change would limit the
denominator in calculating the Retention with the Same Employer measure. However, given that the
measures are aimed at measuring the effectiveness of employer services, the authors believe whether
an employer has received a service related to the outcome is important and warrants consideration as
measures are refined moving forward.
Consideration of Alternative Measures
Chapter 4 of this report included a discussion of alternate performance measures that have been
proposed or implemented for measuring effectiveness in serving employers. We found few examples
of alternatives being implemented in states or at the federal level or that are proposed or underway in
other initiatives and programs. Only one of the alternative measures we have seen appears worthy of
further examination, and it is not clearly superior to the current pilot ESE measures. This measure is
discussed in box 7.
BOX 7 Business Placement Rate
The number of establishments that received a business service in a quarter and had employed a recently exited participant during the service quarter or the following two quarters, divided by the number of establishments that received a business service in a quarter.
Source: Virtual site visit interview with state administrators.
This measure offers one advantage to the Retention with the Same Employer measure. The Retention
with the Same Employer measure does not require that businesses receive a service to be counted,
but the Business Placement Rate only counts employment associated with receipt of a business
service. A weakness of the Business Placement Rate measure is that it favors certain types of
employer services that result in a hire, like recruitment services.
7 4 M E A S U R I N G T H E E F F E C T I V E N E S S O F S E R V I C E S T O E M P L O Y E R S
6.2 Supporting Successful Implementation of the Measures In this section, we describe strategies for supporting successful adoption of the measures by making
them more reliable, increasing their practicality and addressing any potential unintended
consequences.
Support States in Improving Reliability and Increasing Practical Use of the Measures
The pilot measures require states to look at data that have not been used to measure performance
previously and to combine the data across titles and geographic areas. The number of states that did
not report any performance data on the ESE measures declined from 11 states in Program Year 2017
to 4 in Program Year 2018. It is therefore not surprising that the survey of program directors revealed
issues with the reliability and practicality of the measures. Earlier in the chapter we reported some of
the results from the survey, so the issues are not presented again in detail here. Regarding reliability,
the survey results indicate that less than half the respondents stated that for all three pilot measures,
the ability to aggregate data across programs or across local areas was strong or very strong.
Interviews in eight states indicated that problems stemmed primarily from efforts to weed out
duplicate entries and from the fact that the WIOA titles frequently used separate and often
incompatible management information systems. The survey results were more positive on data
availability. However, the survey responses also indicate that there were some challenges with the
reliability of data collected for the measures, which suggests that more could be done to strengthen
the data collection efforts for the ESE measure or measures.
One approach that will help improve the data collection and the reliability of data for the ESE
measures is to implement a rigorous quality control effort. This would be a useful first step in
determining if the states’ concerns about the ESE measures data is justified and in ascertaining how
serious any data problems are. The quality control could be implemented by reviewing the states (and
local areas if they are involved in data collection and analysis) to find any errors in the underlying data
and in the aggregation across local areas and across programs. Note that we are suggesting reviews to
understand the nature of the problems rather than audits to formally correct state data submissions—
the goal is to understand and correct the data problems rather than to simply correct errors. Once the
quality control efforts reveal the types of errors that appear and the frequency of their appearance,
DOL and ED could implement technical assistance, guidance, and training efforts. DOL and ED have
long histories of providing technical assistance to states to increase compliance and to make programs
M E A S U R I N G T H E E F F E C T I V E N E S S O F S E R V I C E S T O E M P L O Y E R S 7 5
more effective and efficient, so this would not be a new activity. Finally, DOL and ED might help
states develop dashboards to present ESE measures data, possibly disaggregated by local area and
title, as discussed later in this section. DOL has funded exploratory efforts to develop dashboards to
help participants select training programs and providers, and although this effort would be focused on
state and local officials rather than potential participants, many of the principles are similar.
Make Measures More Relevant and Useful for All WIOA Titles and Local Areas
DOL and ED might consider supplementing reporting of the ESE measure as a shared measure with
additional reporting by title. Discussions with state adult education officials (Title II) and vocational
rehabilitation officials (Title IV) revealed that these programs viewed their mission in serving
employers very differently from the way Title I and Title III programs viewed employer services. One
benefit of a shared measure is that it allows for a collaborative and holistic approach to employer
services. However, to make results more actionable, separate reporting by title would be beneficial,
although it would require regulatory change.
The reporting system currently calls for the data on employer services to be highly aggregated
when reported. While conducting the state and local virtual site visits, we found that in some states,
respondents we interviewed in local areas were unaware that the ESE measures were being piloted.
Although Title I and Title III were always included in compiling the statewide ESE measures data,
states did not always appear to involve the Title II and Title IV programs in compiling the statewide
data, possibly because these titles are likely to play a small role in providing some of the employer
services that are included in the list; for example, Title II and Title IV programs do not compile lists of
job openings. One state we visited had disaggregated the employer services data by title and found
that 97 percent of the employer services provided were for Title I (16 percent) and Title III
(81percent). Again, this does not necessarily mean that Title II and Title IV do not provide services to
employers, but they may not provide many of the services that are counted for the performance
measure, or the services they provided may not have been counted in the shared federal reporting by
states. Finally, in some states, all the data were collected by a single person in the Title III program, so
the individual programs did not see the data on performance on the employer services measures.
Although DOL and ED may wish to use the employer data to analyze state performance for all
four titles combined as a means of promoting a collaborative approach to employer services, it likely
would be useful to have the data reported by title or to at least encourage states to report the data by
title. Reporting the data by title would permit each program to assess the mix of employer services
7 6 M E A S U R I N G T H E E F F E C T I V E N E S S O F S E R V I C E S T O E M P L O Y E R S
they are providing. Likewise, reporting the data by local area would permit the state to identify areas
that were providing varying amounts of employer services and determine whether adjustments would
be useful. In other words, reporting the data disaggregated by title and local area would make the
performance data more actionable.
It would be important to understand the costs of this additional reporting relative to the benefits.
Depending on the measure selected, the information might not be useful by title. For example, the
Employer Penetration Rate is likely not a useful measure for Title II programs, which are more likely to
provide high-intensity services to a smaller number of employers.
Dealing with Unintended Consequences
The performance accountability provisions of WIOA include financial penalties for states that do not
meet performance standards. It is therefore important that the ESE measures be judged reasonably
valid, reliable, and practical before sanctions are imposed. Once one or more ESE measures is selected,
it will be useful to implement quality control and technical assistance as discussed so that states are
better situated to meet performance expectations. Further, interviews with states pointed to the value
of a statistical adjustment model (required under WIOA) to account for differences in economic
conditions, participant characteristics, and employer characteristics, performance measures are likely
to be inequitable. For example, employers are likely to need fewer services in states experiencing poor
economic conditions than in states with a booming economy. Moreover, states may behave differently
once the ESE measures are no longer pilot measures and poor performance results in reduced funding,
so standards set before then could be based on inaccurate assumptions.
6.3 Potential Options for Future Study This study provided the opportunity to better understand how employer services are defined and
measured in states and local areas and across the core programs of WIOA. In addition, our study was
aimed at identifying options for future study to support the implementation of services to employers
and measures of effectiveness moving forward. Findings from our research highlight several options
for future study.
M E A S U R I N G T H E E F F E C T I V E N E S S O F S E R V I C E S T O E M P L O Y E R S 7 7
Further Analyze Selected Measure or Measures to Strengthen Them, Support Their Adoption, and Establish Satisfactory Levels of Performance
Findings from this study are aimed at informing adoption of one or more measures of effectiveness in
serving employers. Once DOL and ED select one or more of the pilot measures, additional research
could further examine the validity and reliability of those measures as well as their unintended
consequences. This could include a survey of states, state program directors, or local administrators to
understand implementation. Depending on what measures are adopted, new lessons could emerge on
how to define measures, support new adopters, and establish satisfactory levels of performance.
Another method of assessing newly adopted measures would be to examine the relationship
between measures. This includes looking at state performance on participant measures in relation to
the ESE measures.
Examine Alternative Measures and Approaches That Could Supplement Adopted Measures and Improve Performance Measurement
As noted, limited options for alternative measures emerged from states, the federal government, and
other sources. However, there were a few ideas that could be further examined. From the states, a
future study could examine the alternative measure Business Placement Rate. This could be explored
as a supplemental measure while DOL and ED move forward with the adoption of one of the pilot
measures.
An alternative approach to measurement mentioned by some survey and interview respondents
and one of our subject matter experts was the use of employer satisfaction surveys.57 Although there
are several challenges with using surveys for federal accountability, some respondents commented
that asking employers was the best way to know whether you were effectively serving them. Although
we were able to gather limited information about the use of the American Customer Satisfaction Index
survey in the past, it is possible that a survey instrument could be developed that more directly gets at
the goals and services of the workforce system. The federal government could support development,
testing, and validation of a survey instrument that could be used alongside another reported measure
or measures to provide additional information to DOL and ED, to states, and to local areas on how
57 One subject matter expert who reviewed the report suggested that direct, systematically collected feedback from employers through regularly surveying employers served by the workforce system would make the measurement process considerably more useful both for accountability and service improvement purposes. We took this recommendation into account, but there was not much enthusiasm in data collected for this study expressed by state program directors for a national survey of employers. Rather, we primarily heard that states are using employer surveys to understand the efficacy of specific services and employer events relevant to their local areas.
7 8 M E A S U R I N G T H E E F F E C T I V E N E S S O F S E R V I C E S T O E M P L O Y E R S
effectively the system is serving employers. Surveys could be done less often than annually (for
example, every three or five years) to lessen the burden on the workforce system and on employers
but also provide useful information for improving the effectiveness of services to employers.
Explore Alternative Data from the Census Bureau, Private Vendors, and the States as Potential Sources for Validating Results and Supporting State Data Collection Efforts
Although no alternative sources of data emerged as superior to those currently being used for
reporting on the pilot measures, further exploration of alternative data sources could be useful as the
federal government seeks to further refine, develop, and assess selected measures. A more systematic
analysis could compare the QCEW and Census Bureau data, building on efforts that these agencies
have undertaken in the past. We found that several states were using private data sources, which can
be costly, to drive strategic planning with respect to services to employers. A comparative analysis of
these alternative sources could yield information that would be useful to states as they determine how
to use scarce resources to gather information that is useful for developing state strategy or
implementing programs. Further, the NDNH, which is based on state unemployment insurance data
and records of newly hired workers, appears to have some features that make it appealing, but it also
has drawbacks; a further look at this database might be fruitful.
Develop Adjustment Models and Baseline Standards to Meet Federal Requirements and Improve Usefulness of Adopted Measures
Once performance measures are selected, there is a need to develop baseline standards against which
to assess performance. As discussed, it will be important to account for state differences through the
development of adjustment models, both because it is required by law and because there is evidence
that it will improve the adopted measures. Exploration of options for statistical adjustment was one
task under this study.
The WIOA participant performance measures use regression analysis to adjust performance
standards for specific states to hold them harmless for variations in economic conditions and
participant characteristics. The models are estimated separately for WIOA Adult, Youth, and
Dislocated Worker programs and for the Wagner-Peyser program. Because we believe a majority of
employer services are provided by Wagner-Peyser programs, we suggest that variables included in the
Wagner-Peyser performance measure statistical adjustment model be considered for the employer
M E A S U R I N G T H E E F F E C T I V E N E S S O F S E R V I C E S T O E M P L O Y E R S 7 9
services measures statistical adjustment models. Currently, variables in the Wagner-Peyser program
statistical model include sex, age group, race group, educational attainment, disability status, veteran
status, English-learner status, single-parent status, low-income status, homeless status, offender
status, displaced homemaker status, prior earnings status, long-term unemployed status, UI claimant
status, UI claimant exhaustee status, received supportive services status, received needs-based
payments status, received other assistance status, received Temporary Assistance for Needy Families
status, days in program, industry shares, and unemployment rate.58 In addition to exploring the
variables used in the participant performance measure statistical adjustment models, we suggest
exploring the use of measures of establishment size and industry for participating employers.
Developing statistical adjustment models is a complex, multiyear process. Sutter (2016) provides a
comprehensive review of DOL’s assessment of the best strategies for statistical adjustment models for
the participant measures used for WIOA. The paper develops and tests several strategies for
participant measure statistical adjustment models and concludes with a recommended strategy. Even
if building off the statistical model for Wagner-Peyser, the adjustment model for the ESE measures or
measures will require substantial new work for several reasons. First, the outcomes for services to
employers are different from the outcomes for participants, and different modeling strategies may be
appropriate. Second, the independent variables that provide the bases for adjustment could be
different for services to employers, so conceptual and empirical work will be required on which
variables to include in the models. Third, the ongoing pandemic and severe economic recession along
with the fact that the pilot measures have no consequences currently might imply that adjustment
models may not be stable; thus, it is worth considering postponing the implementation of the
statistical adjustment model for several years.
58 The variables included in the 2020 Wagner-Peyser models for employment in the second quarter after exit
were obtained at Kevin Reuss, “Statistical Adjustment Models, Development of PY 2020–2021 WIOA Models,” US Department of Labor, Employment and Training Administration, February 14, 2020, https://www.dol.gov/sites/dolgov/files/ETA/Performance/pdfs/Model-Selection-PY-20-21.html#removing_original_model_variables.
8 0 M E A S U R I N G T H E E F F E C T I V E N E S S O F S E R V I C E S T O E M P L O Y E R S
Concluding Remarks Measuring performance in federal programs is important for ensuring accountability, quality, and
sound use of taxpayer dollars. The public workforce system has been a leader in establishing
performance measures with respect to the services provided to and outcomes of participants in
federal programs. With the adoption of new metrics concerning the effectiveness of services to
employers, DOL and ED can provide further leadership on this issue. This study was commissioned
and prepared to assist with this effort. We found that states put in place systems for measuring the
effectiveness of employer services and aligning data collection with requirements for the ESE pilot.
Established measures and definitions had some limitations, but they were useful for launching and
improving data collection related to services provided to employers. Despite limitations related to the
validity, reliability, practicality, and unintended consequences, states largely did not develop
alternative measures for assessing those employer services or their effectiveness.
Plans to develop statistical adjustment models—as required under law—will be important for
improving the quality of the ESE measure or measures adopted. Future research also can support
continued implementation of any adopted ESE measure or measures in WIOA programs and by other
agencies and programs that provide services to employers. The goal for supporting successful
implementation of the ESE measures is ultimately to improve the effectiveness of services to
employers, a primary customer of the public workforce system, which in turn will also help the
workforce compete in a global economy.
I N D E X O F K E Y T E R M S 8 1
Index of Key Terms This index helps readers find information in the report about workforce development legislation and
activities, workforce system partners, performance measurement, and the effectiveness in serving
employers measures.59
A
American Job Center: x, 16–17
American Customer Satisfaction Index: x, 21–22
C
Common Measures: x, 23
Comprehensive Training and Employment Act: x, 15, 21
Council of State Administrators of Vocational Education: x, 14
D
DirectEmployers Association: x, 14
ESE measures: x, xi, xv–xvi, 1–2, 25, 41,
Employer Penetration Rate: xi, xv, xviii, 1, 8, 25, 27–28, 41–43, 53–55, 69
G
Government Performance and Results Act: xi, 4, 21
N
National Association of State Directors of Adult Education: xi, 14,
National Association of State Workforce Agencies: xi, 14, 47,
P
performance accountability: xi, xv, 2, 23, 77
performance measure: xi, xxii, 1, 3–7, 21–25
practicality: xi, 6, 38, 41, 50,
59 This index highlights the most robust/relevant use of terms throughout the report, rather than describing every
incidence where a term is used.
8 2 I N D E X O F K E Y T E R M S
R
reliability: xii, 5, 38, 41, 46
Repeat Business Customers: xii, xv, xviii, 1, 25, 41, 43, 50, 56, 68
Retention with the Same Employer: xii, xv, xix, 1, 25, 41, 43, 51, 56, 68
S
statistical adjustment model: xii, xviii, xix, xxi, xxii, 7, 43, 64, 72, 79, 81
U
unintended consequences: xii, xxi, 6, 41, 54, 67, 77
US Department of Education (ED): xii, xv, 1, 24, 81
US Department of Labor (DOL): xii, xv, 1, 24, 81
V
validity: xiii, 4, 42
W
Workforce Investment Act: xiii, 16, 19,
Workforce Innovation and Opportunity Act (WIOA): xiii, 16, 19,
R E F E R E N C E S 8 3
References Barnow, Burt S., 2000. “Exploring the Relationship between Performance Management and Program Impact: A
Case Study of the Job Training Partnership Act.” Journal of Policy Analysis and Management 19 (1): 118–41.
———. 2011. “Lessons from the WIA Performance Measures.” In The Workforce Investment Act: Implementation Experiences and Evaluation Findings, edited by Douglas J. Besharov and Phoebe H. Cottingham, 209–31. Kalamazoo, MI: W.E. Upjohn Institute for Employment Research.
Barnow, Burt S., and Jeffrey A. Smith. 2004. “Performance Management of U.S. Job Training Programs.” In Job Training Policy in the United States, edited by Christopher J. O’Leary, Robert A. Straits, and Stephen A. Wandner. Kalamazoo, MI: W.E. Upjohn Institute for Employment Research. http://research.upjohn.org/up_press/142/.
———. 2009. “What We Know About the Impacts of Workforce Investment Programs.” In Strategies for Improving Economic Mobility of Workers: Bridging Research and Practice, edited by Maude Toussaint-Comeau and Bruce D. Meyer, 163–76. Kalamazoo, MI: W.E. Upjohn Institute for Employment Research. https://doi.org/10.17848/9781441631992.ch10.
Barnow, Burt S., and Shayne Spaulding. 2015. “Employer Involvement in Workforce Programs: What Do We Know?” In Transforming Workforce Development Policies for the 21st Century, edited by Carl Van Horn, Tammy Edwards, and Todd Greene, 231–63. Kalamazoo, MI: W.E. Upjohn Institute for Employment Research. https://www.kansascityfed.org/~/media/files/publicat/community/workforce/transformingworkforcedevelopment/book/transformingworkforcedevelopmentpolicies.pdf.
Bradley, David H. 2013. “The Workforce Investment Act and the AJC Delivery System.” Washington, DC: Congressional Research Service. https://fas.org/sgp/crs/misc/R41135.pdf.
———. 2015. “The Workforce Innovation and Opportunity Act and the One-Stop Delivery System.” Washington, DC: Congressional Research Service. https://fas.org/sgp/crs/misc/R44252.pdf.
Dunham, Kate, Melissa Mack, Jeff Salzman, and Andrew Wiegand. 2006. “Evaluation of the WIA Performance Measurement System, Final Report.” Oakland, CA: Social Policy Research Associates.
Eyster, Lauren, Teresa Derrick-Mills, John Trutko, Jessica Compton, Alexandra Stanczyk, and Demetra Smith Nightingale. 2013. “Implementation Evaluation of the Community-Based Job Training Grant (CBJTG) Program.” Washington, DC: Urban Institute. https://www.urban.org/research/publication/implementation-evaluation-community-based-job-training-grant-cbjtg-program.
Eyster, Lauren, Christin Durham. and Theresa Anderson. 2016. “Federal Investments in Job Training at Community Colleges.” Washington, DC: Urban Institute. https://www.urban.org/research/publication/federal-investments-job-training-community-colleges.
Fairman, Kristin, Lucia Foster, C. J. Krizan, and Ian Rucker. 2008. “An Analysis of Key Differences in Micro Data: Results from the Business List Comparison Project.” CES-WP-08-28. Washington, DC: US Census Bureau, Center for Economic Studies. https://www.bls.gov/osmr/research-papers/2008/pdf/st080020.pdf.
Guttman, Robert. 1983. “Job Training Partnership Act: new help for the unemployed.” Monthly Labor Review 106 (3): 3-10.
Hahn, Heather, Teresa Derrick-Mills, and Shayne Spaulding. 2018. Measuring Employment Outcomes in TANF. Report #2018-74. Washington, DC: US Department of Health and Human Services, Administration for Children and Families, Office of Planning, Research and Evaluation.
Hatry, Harry P. 2013. “Sorting the Relationships among Performance Measurement, Program Evaluation, and Performance Management.” New Directions for Evaluation 2013 (137): 19–32.
8 4 R E F E R E N C E S
Kentucky Workforce Investment Board. 2014. “Training Today for Jobs Tomorrow: Commonwealth of Kentucky Workforce Investment Act Program Year 2013 Annual Report.” Frankfort: Kentucky Workforce Investment Board https://www.doleta.gov/Performance/Results/AnnualReports/PY2013/KY-PY13_WIA_AnnualReport.pdf.
Lazear, Edward P., and Paul Oyer. 2007. “Personnel Economics.” Working paper 13480. Cambridge, MA: National Bureau of Economic Research.
National Association of State Workforce Agencies. 2019. State of the Workforce Report 2019. Washington, DC: National Association of State Workforce Agencies. https://www.naswa.org/system/files/2019-09/naswastateoftheworkforce2019fullreport.pdf.
Newcomer, Kathryn E., Harry P. Hatry, and Joseph S. Wholey. 2015. Handbook of Practical Program Evaluation. San Francisco: Jossey-Bass.
Nightingale, Demetra Smith, Lauren Eyster, John Trutko, Carolyn O’Brien, and Kate Chambers. 2008. “Implementation Analysis of High Growth Job Training Initiative (HGJTI) Programs.” Washington, DC: Urban Institute. https://wdr.doleta.gov/research/FullText_Documents/2008-10%20HGJTI%20Implementation%20Report%20FINAL.pdf.
NSC (National Skills Coalition). 2011. “Training Policy in Brief: Workforce Investment Act, Title I.” Washington, DC: NSC. https://m.nationalskillscoalition.org/resources/publications/file/NSC_TPIB_WIA_TitleI.pdf.
OMB (Office of Management and Budget, Executive Office of the President). 2020. “Preparation, Submission, and Execution of the Budget.” Circular No. A-11. Washington, DC: OMB. https://www.whitehouse.gov/wp-content/uploads/2018/06/a11.pdf
Poister, Theodore H. 2003. Measuring Performance in Public and Non-Profit Organizations. San Francisco: Jossey-Bass.
———. 2010. “The Future of Strategic Planning in the Public Sector: Linking Strategic Management and Performance.” Public Administration Review 70: s246–54.
———. 2015. “Performance Measurement: Monitoring Program Outcomes.” In Handbook of Practical Program Evaluation, edited by Joseph S. Wholey, Harry P. Hatry, and Kathryn E. Newcomer, 100–124. San Francisco: Jossey-Bass. https://www.wiley.com/en-us/Handbook+of+Practical+Program+Evaluation%2C+4th+Edition-p-9781118893609.
San Diego Workforce Partnership. 2015. “Customer Satisfaction Survey Results.” San Diego, CA: San Diego Workforce Partnership. https://workforce.org/sites/default/files/customer_satisfaction_survey_results.pdf.
Scott, Molly, Lauren Eyster, Yipeng Su, David Blount, Alex Trutko, Adrienne Smith, and Karen Gardiner. 2018. The Employer Perspectives Study: Insights on How to Build and Maintain Strong Employer College Partnerships. Round 4 TAACCCT Evaluation. DOL-ETA-14-F-00013. Washington, DC: US Department of Labor, Chief Evaluation Office. https://www.dol.gov/sites/dolgov/files/OASP/legacy/files/Employer-Perspectives-StudyReport-Round-Final.pdf.
Shadish, William R., Thomas D. Cook, and Donald Thomas Campbell. 2002. Experimental and Quasi-Experimental Designs for Generalized Causal Inference. Boston: Houghton Mifflin.
Sutter, Ryan. 2016. “A Methodology for Statistical Adjustment under the Workforce Innovation and Opportunity Act (WIOA).” Unpublished manuscript. Washington, DC: US Department of Labor.
Winkler, Mary K., and Saunji D. Fyffe. 2016. “Strategies for Cultivating an Organizational Learning Culture.” Washington, DC: Urban Institute. http://www.urban.org/sites/default/files/publication/86191/strategies_for_cultivating_an_organizational_learning_culture_0.pdf.

R E F E R E N C E S 8 5
WINTAC (Workforce Innovation Technical Assistance Center). 2019. “Effectiveness in Serving Employers: A Crosswalk for WIOA Title IV Employer Services.” San Diego, CA: San Diego State University Interwork Institute. http://wintac-s3.s3-us-west-2.amazonaws.com/topic-areas/t05_CommonPerformance/t05_resources/ESE_Title-IV_Crosswalk_Final_03.24.19_CN0328.pdf
STATEMENT OF INDEPENDENCE
The Urban Institute strives to meet the highest standards of integrity and quality in its research and analyses and in the evidence-based policy recommendations offered by its researchers and experts. We believe that operating consistent with the values of independence, rigor, and transparency is essential to maintaining those standards. As an organization, the Urban Institute does not take positions on issues, but it does empower and support its experts in sharing their own evidence-based views and policy recommendations that have been shaped by scholarship. Funders do not determine our research findings or the insights and recommendations of our experts. Urban scholars and experts are expected to be objective and follow the evidence wherever it may lead.

500 L’Enfant Plaza SW Washington, DC 20024
www.urban.org