Research Report Maine Division of Vocational … Report Maine Division of Vocational ... Market...
198
75 Washington Avenue, Suite 206 Portland, Maine 04101 Phone: 207.767.6440 Fax: 207.767.8158 Email: [email protected] www.marketdecisions.com Research Report Maine Division of Vocational Rehabilitation 2011 Quality Assurance Survey Survey Report Prepared by: Brian Robertson, Ph.D. Jennifer MacBride December 2011
Transcript of Research Report Maine Division of Vocational … Report Maine Division of Vocational ... Market...

75 Washington Avenue, Suite 206 Portland, Maine 04101 Phone: 207.767.6440 Fax: 207.767.8158 Email: [email protected] www.marketdecisions.com
Research Report
Maine Division of Vocational Rehabilitation
2011 Quality Assurance Survey Survey Report Prepared by: Brian Robertson, Ph.D. Jennifer MacBride December 2011

i
TABLE OF CONTENTS
Page I. Survey Methodology..................................................................................................................1 II. Key Findings and Discussion ...................................................................................................8 III. Summary Report ...................................................................................................................37 Services Received by Clients ..........................................................................................38 Measures of Overall Satisfaction ....................................................................................45 Evaluation of Specific Aspects of the Agency and the Services Provided ..................70 Problems and Areas for Improvement ........................................................................135 Current Employment Status .........................................................................................160 Agency Specific Questions .............................................................................................168 Respondent Characteristics ..........................................................................................193

1
I. Survey Methodology Introduction Market Decisions conducted this project on behalf of the Maine Division of Vocational Rehabilitation. The Vocational Rehabilitation Agencies Quality Assurance Survey is designed to allow vocational rehabilitation clients the opportunity to provide feedback about the agencies through which they are currently receiving services or had received services in the past. The Survey Questionnaire The survey instrument used during the course of this research was developed for use during the New England Vocational Rehabilitation Agencies Quality Assurance Survey that was conducted in 2003. The same survey instrument was used during the administrations of the 2006 and 2008 Quality Assurance Survey. The current survey instrument used the same set of core survey questions to which the Division added a set of additional questions. The main research methodology for data collection was the use of a telephone survey. However, given that it was not possible to reach a percentage of the target population by telephone, a mail version of the survey was also developed to supplement the telephone survey. Sampling The target population for this research consisted of clients with case status codes between 12 and 28. The sample included active cases, cases closed successfully, and cases closed unsuccessfully. The sample included all cases that were active at any time during the year prior to the initiation of data collection. That is, cases that were active at any time from October 2010 through October 2011. The goal of this research was to provide an accurate assessment of the views of clients that could be used to assess satisfaction with services at the agency level and to assess satisfaction at the service region level. The sampling frame for the Maine Division of Vocational Rehabilitation included five sampling stratum defined by their five service regions. The sampling frame for this research was developed from a client list provided by each of the participating agencies in electronic format. Once received, the sample was divided into 5 separate strata files to facilitate sampling for the Maine Division of Vocational Rehabilitation. Based upon the past administrations of the survey, it was anticipated that approximately one-quarter to one-third of the telephone numbers included in the sampling frame would either be non-working numbers or would be telephone numbers at which the client could not be reached. In the first case, this included disconnected telephone numbers, non-working numbers, and those out of service. In the second, they represent wrong telephone numbers, business telephone numbers (at which the respondent did not work), and cases where the respondent could not be reached at this telephone number.

2
In cases where a number was incorrect or non-working and in cases where a telephone number was not provided, these sample records were identified and designated for inclusion in the mail survey. In Maine, approximately 21% of records were identified as non-working, incorrect or were cases where a telephone number was not provided in the sample record. These cases were sent a mail copy of the survey questionnaire. A total of 1,463 sample records were included in the Maine Division of Vocational Rehabilitation sample. Data Collection All telephone interviews were conducted in a central interviewing facility using our Computer Assisted Telephone Interviewing (CATI) software. All interviewers were supervised and monitored continuously. The telephone data collection phase was begun on November 10, 2011 and data collection was completed by December 8, 2011 (including all telephone interviews and returned mail surveys). A total of 705 clients of the Maine Division of Vocational Rehabilitation were interviewed by telephone or returned completed mail surveys. Survey Response Rates Among clients of the Maine Division of Vocational Rehabilitation, the survey response rate was 64%. The AAPOR (American Association for Public Opinion Research) Respondent Cooperation Rate was 88%, while the AAPOR Respondent Refusal Rate was 8%.
Maine Division of Vocational Rehabilitation
Overall Response Rate 64%
AAPOR Respondent Cooperation Rate 88%
AAPOR Respondent Refusal Rate 8%
AAPOR Standard Formulas -AAPOR rates AAPOR (the American Association for Public Opinion Research) has standardized formulas used by researchers for the calculation of response, cooperation, and refusal rates. The formulas allow other researchers to compare this research to other research projects, since the formulas used in the calculation of the rates are the same. The formulas clearly identify what is used in deriving the response rates based on rules that identify cases as eligible and ineligible. The AAPOR rates provide a sense of how well the interviewing process works once a respondent is contacted.

3
Cooperation rates – This represents the proportion of all cases interviewed out of all eligible units ever contacted. That is, what percent of identified respondents ended up completing the interview. This includes cases where a respondent refused to do the survey, began but did not complete the survey, and cases where a respondent wished to complete the survey at another time but did not end up completing the survey, respondents who did not speak English, and respondents who were infirm. Refusal rates – The refusal rates represent the proportion of all cases in which the respondent refuses to be interviewed, or breaks off an interview, out of all respondents that were contacted and spoken with. Data Weighting The data has been weighted to adjust for non-response and also to match client profiles based upon sex, age, service region, disability type, case status (open/closed), and race/ethnicity. Sampling Error The percentages reported for the Maine DVR sample are within plus or minus 3.4% that would be found if all clients of the Maine Division of Vocational Rehabilitation were interviewed. For example, if our survey showed that 50% of the respondents were satisfied with the services received, then the comparable figure for the population would be somewhere between 46.6% and 53.4% with a confidence level of 95%. A breakdown of the sampling error by service region is presented below, along with the number of surveys completed in each region.
Number of
Surveys Sampling Error
(+ or -) Maine Division of Vocational Rehabilitation 705 3.4%
Service Region 1 160 7.3%
Service Region 2 161 7.1%
Service Region 3 163 7.0%
Service Region 4 153 6.8%
Service Region 5 68 8.5% Presentation of Survey Results This summary report allows you to compare results from your agency to results from the earlier 2003, 2006 and 2008 studies. This will allow you to determine if there are differences in the level of satisfaction among your clients over the period from 2003 to 2011. The report provides a comparison by year for the agency as a whole as well as by service region. The summary report also includes a comparison of your results to those of the other participating agencies.

4
The summary report presents the data in three graphical forms along with a narrative description:
A bar chart with the results presented for the agency as a whole. In this chart, percentages for all response categories are provided. For example, “very satisfied, satisfied, neither satisfied nor dissatisfied, dissatisfied, and very dissatisfied.” The graph includes results from the current study.
A table that presents the results for your agency and your agency’s service regions in which all response categories are presented. This table provides data from the current study.
A line chart presenting survey results for the agency as a whole. This type of chart provides a comparison of the current 2011 results to the 2003, 2006, and 2008 studies.
A table presenting survey results for the agency as a whole as well as each region. This set of tables will provide the results for the agency as a whole and for each region for all four survey administrations. The tables will also note cases where there are significant differences; a) between the 2011 results for a region and the 2011 overall agency score, and; b) trending comparisons for the agency and region across all four administrations.
Note that in the charts, the percentages referenced will always be the percent of valid responses. The tables do not include the percentage of respondents who indicated that the item was not applicable, that were unsure of their answer or that refused to answer the survey question. Due to rounding when combining categories (such as satisfied and very satisfied), the combined percentage may not match the sum of the individual categories as portrayed in the tables or graphs. Comparing the Percentage of Respondents Indicating Satisfaction Across Groups The tables and charts provided in this report are designed to allow you to compare your results. There are three types of comparisons:
Comparisons of results year to year; trending results from the 2003, 2006 and 2008 studies as well as the current study. This will help you identify any changes in the results across all four years for your agency as a whole and within each of your service regions.
Comparison of your current 2011 results by region. This will help you identify whether there are differences between the 2011 results from each region and your overall agency score.
A table is provided that compares the results of your agency as a whole as well as the results for each region. The results are presented for all three survey administrations.

5
Comparing Regional Results and Results Year to Year To allow comparisons, a table is included that provides a summary of the results for each survey administration for your agency as a whole and for each of your service regions. This table is designed to simplify comparing year to year results and to also compare the results from each of your service regions to the overall agency score for 2011. Four columns provide the results for 2003, 2006, 2008, and 2011 for the agency as a whole and for each service region. The results are the percent positive responses to the question which for most is the percentage of respondents indicating they are very satisfied or satisfied. The table includes two additional columns labeled Sig Diff (Region) and Sig Diff (Year). It is in these columns you will find the results of analysis comparing regional results and year to year results. These comparisons are based on comparing the 95% confidence intervals associated with each measure. The percentage satisfied score provides the point estimate for the rating of a particular measure of satisfaction. Since the study only involved a sample of clients, there is an error associated with this percentage. The 95% confidence interval provides the range in which the “true” percentage from the total population of responsible parties would fall. Based on these intervals, we are 95% confident that the actual percentage from the entire population would fall within the specified range of values. The use of confidence intervals allows one to compare the percentage scores across groups of respondents; for example comparing results by service region. Simply comparing percentages across groups can be misleading. Though one percentage may be greater than another, this does not necessarily imply one group rated their satisfaction higher than the other group (since the percentage is technically only the midpoint in a statistical distribution). When comparing items, it is important to take into account the error range around the percentage to determine if, within the specified level of confidence, a difference exists. The table summarizes all comparisons, noting any significant differences in the last two columns. The first of these columns, “Sig Diff (Region)” summarizes significant differences between each of your service regions and your agency’s overall score for the question. This compares the results of the 2011 study. The column will either be blank or contain a plus sign “+” or a minus sign “-“ for each of your service regions:
A plus (+) indicates that the 2011 result for the specific region is statistically higher (at 95% confidence) than your overall agency score in 2011.
A minus (-) indicates that the 2011 result for the specific region is statistically lower (at 95% confidence) than your overall agency score in 2011.
Blank cells indicate no difference.

6
The second of these columns “Sig Diff (Year)” summarizes significant differences year to year. This provides a comparison of your agency as well as each of your service regions. This column compares results for 2003, 2006, 2008, and 2011. The column will either be blank, contain a plus sign “+” or a minus sign “-“, or the word “UP” or “DOWN”:
The word “UP” indicates that the survey results are trending upward, that is, your 2011 score is higher than similar results in prior years - 2003, 2006, and 2008. To trend upward, the 2011 results must be significantly higher than the first year of the trend (2003 or 2006) and also higher than all of the intervening years (2006 and 2008 or 2008).
The word “DOWN” indicates that the survey results are trending downward, that is, your 2011 score is lower than similar results in prior years - 2003, 2006, and 2008. That is, the percentage is decreasing over several years (i.e. 2003 to 2011 or 2006 to 2011). To trend downward, the 2011 results must be significantly lower than the first year of the trend (2003 or 2006) and also lower than all of the intervening years (2006 and 2008 or 2008).
A plus (+) indicates that the 2011 result is statistically higher (at 95% confidence) than similar results from 2008.
A minus (-) indicates that the 2011 result is statistically lower (at 95% confidence) than similar results in 2008.
Blank cells indicate no difference.
Example: Table of Regional and Year to Year Comparisons
SAMPLE SATISFACTION MEASURE (% very satisfied or satisfied)
2003 2006 2008 2011 Sig Diff (Region)
Sig Diff (Year)
AGENCY 81.8% 82.5% 82.2% 84.2% + Region 1 83.9% 79.1% 74.8% 73.8% - DOWN Region 2 88.3% 84.7% 89.9% 91.9% UP Region 3 87.4% 83.5% 83.5% 89.4% + Region 4 83.7% 87.4% 94.1% 94.1% + Region 5 90.9% 90.0% 90.7% 82.7% -
Legend
Sig Diff (Region) – a “+” indicates that the regional score is significantly higher than the agency score while a “-” indicates that the regional score is significantly lower than the agency score. Sig Diff (Year) – a “+” indicates that the 2011 score is significantly higher than the 2008 score while a “-“indicates that the 2011 score is significantly lower than the 2008 score. The word “UP” indicates that the year to year results are trending upward from 2003/2006 while the word “DOWN” indicates that the year to year results are trending downward from 2003/2006.

7
In the column labeled “Sig Diff (Region)” you can see a minus sign“-” across from Region 1 and a plus sign “+” across from Region 4. This indicates that:
The score for Region 1 is significantly lower than the agency score (73.8% compared to 84.2%).
The score for Region 4 is significantly higher than the agency score (94.1% compared to 84.2%).
In the column labeled “Sig Diff (YEAR)” you can see the word “DOWN” across from Region 1, the word “UP” across from Region 2, a plus sign“+” across from Region 3 and a minus sign “-” across from Region 5. This indicates that:
The score for Region 1 is trending downward comparing 2003 to 2011 (83.9%, 79.1%, 74.8%, and 73.8%).
The score for Region 2 is trending upward comparing 2006, 2008, and 2011 (84.3%, 89.9%, and 91.9%).
The 2011 score Region 3 is significantly higher than the score in 2008 (89.4% in 2011 compared to 83.5% in 2008).
The 2008 score Region 5 is significantly lower than the score in 2006 (82.7% in 2008 compared to 90.7% in 2008).

8
II. Key Findings and Discussion Key Findings Services Received by Clients
The most common services received are help in finding a job, vocational or employment counseling, and financial assistance.
The largest percentage indicated that help in finding a job and vocational or
employment counseling were the most helpful services they received. Measures of Overall Satisfaction
In 2011, 81% of clients were very satisfied or satisfied with the Maine Division of
Vocational Rehabilitation’s program.
In 2011, 83% of clients indicated that they were satisfied with the services they received.
In 2011, 80% of clients indicated that the services provided met their expectations.
In 2011, 80% of clients indicated that the services provided through the Maine
Division of Vocational Rehabilitation compared favorably to the services offered through their ideal program.
Among all clients, the Consumer Satisfaction Index was 75.7 in 2011.
In 2011, 92% percent of clients would tell their friends with similar disabilities to go
to the Maine Division of Vocational Rehabilitation for help. Evaluation of Specific Aspects of the Agency and the Services Provided
In 2011, 84% of clients were very satisfied or satisfied with their control and involvement in the vocational rehabilitation experience.
In 2011, 86% of clients were very satisfied or satisfied with their choice of a vocational goal.
In 2011, 83% of clients were very satisfied or satisfied with the choice of services
available.
9
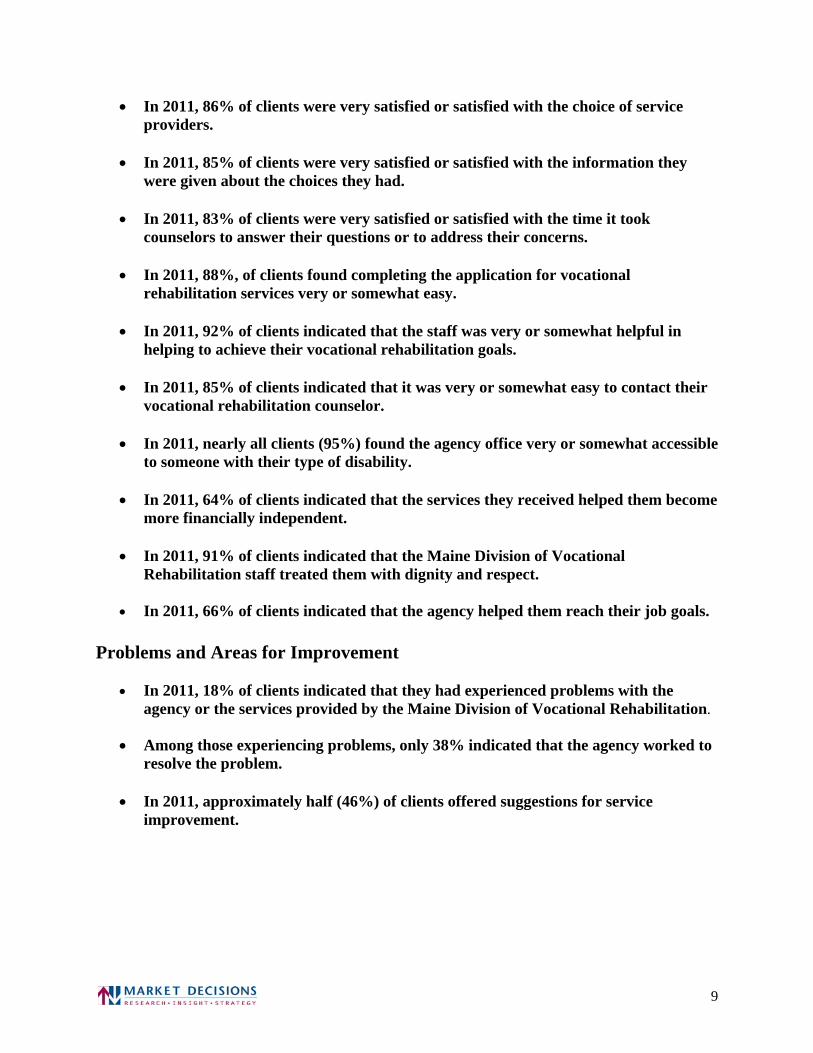
In 2011, 86% of clients were very satisfied or satisfied with the choice of service providers.
In 2011, 85% of clients were very satisfied or satisfied with the information they
were given about the choices they had.
In 2011, 83% of clients were very satisfied or satisfied with the time it took counselors to answer their questions or to address their concerns.
In 2011, 88%, of clients found completing the application for vocational
rehabilitation services very or somewhat easy.
In 2011, 92% of clients indicated that the staff was very or somewhat helpful in helping to achieve their vocational rehabilitation goals.
In 2011, 85% of clients indicated that it was very or somewhat easy to contact their
vocational rehabilitation counselor.
In 2011, nearly all clients (95%) found the agency office very or somewhat accessible to someone with their type of disability.
In 2011, 64% of clients indicated that the services they received helped them become
more financially independent.
In 2011, 91% of clients indicated that the Maine Division of Vocational Rehabilitation staff treated them with dignity and respect.
In 2011, 66% of clients indicated that the agency helped them reach their job goals.
Problems and Areas for Improvement
In 2011, 18% of clients indicated that they had experienced problems with the agency or the services provided by the Maine Division of Vocational Rehabilitation.
Among those experiencing problems, only 38% indicated that the agency worked to resolve the problem.
In 2011, approximately half (46%) of clients offered suggestions for service
improvement.

10
Current Employment Status
Forty-six percent of clients were working full or part time. Among those clients who were working, 81% were very satisfied or satisfied with
their job in 2011.
The types of careers sought by clients were varied. Agency Specific Questions
In 2011, 76% of clients indicated that they were informed that they could address problems with the Client Assistance Project.
88% of clients were informed of their rights and the steps they could take if they
had a problem with the Maine Division of Vocational Rehabilitation.
Only 5% of clients contacted the Client Assistance Program.
85% of clients indicated the Client Assistance Program was helpful (among those contacting the Program).
Two in five (40%) clients indicated they had more than one vocational rehabilitation
counselor.
Among those with more than one vocational rehabilitation counselor, 32% indicated it affected their ability to get services through the Maine Division of Vocational Rehabilitation.
Among those needing benefits counseling, 75% indicated they were able to access
benefits counseling through vocational rehabilitation while 25% indicated they were not able to access benefits counseling.
Among those using benefits counseling, 68% found this counseling very valuable
and 25% found it somewhat valuable.
56% of clients received job coaching or job development services.
Among those receiving job coaching or job development services, 85% were very satisfied or satisfied with these services.
23% of clients participated in the Career Exploration Workshop.
85% of clients indicated the Career Exploration Workshop was helpful (among
those participating in the Workshop).

11
Discussion As we have found in prior studies, the 2011 study continues to affirm that the clients of the Maine Division of Vocational Rehabilitation are satisfied with the services they are provided and the large majority has not experienced any problems or difficulties. The staff of the Division is viewed as helpful and interested in meeting the needs of their clients. The Division continues to be an important resource to its clients. Based upon the views and attitudes of the large majority of clients, the survey results did not identify any major systemic problems with the Maine Division of Vocational Rehabilitation or the services it provides. This was observed in our prior studies conducted in 2003, 2006, and 2008. The 2011 results show that on many measures there has been an increase in the level of satisfaction among its clients while on others there has been a decline. Across the entire Division, scores are down on 9 of 22 measures (as was also observed in 2008), though the declines are slight; mainly by a percentage point or two. But scores have also increased on six of the measures. Regionally, there are signs of improvement and also potential areas that require some examination. A majority of the satisfaction items show a decrease in Regions 4 and 5 and in many cases these scores have been trending downward since 2003 or 2006. However, in Regions 1, 2 and 5, a majority of the satisfaction items show an increase in scores; some trending upward from 2003 or 2006 but with most showing an increase since 2008. It is important to note that that the increase or decrease in scores observed for the Division as a whole and within each of the regions is not considered statistically significant for the large majority of the individual items in the survey. However, when one looks at the series of all 22 measures, they do seem to reflect a general trend in the views of clients towards the Division. Conclusions and Areas of Focus As noted, there is, in general, a high level of satisfaction among the clients of the Division. The overall level of satisfaction is roughly equivalent to that observed in 2008; 81% are satisfied overall, 83% satisfied with the service they receive, and 92% would recommend the Division. However, these three measures are slightly lower than in 2008 (though not significantly so) and 2 (overall satisfaction and likely to recommend) have been trending slightly downward since 2003. Overall satisfaction has increased in Regions 1, 2, and 5. For Regions 3 and 4, there appears to be a decline on overall satisfaction:
Overall Satisfaction with Services Region 2008 2011 2008 2011 3 85.4% 78.4% 86.5% 78.1% 4 84.1% 80.0% 86.4% 79.9%
12
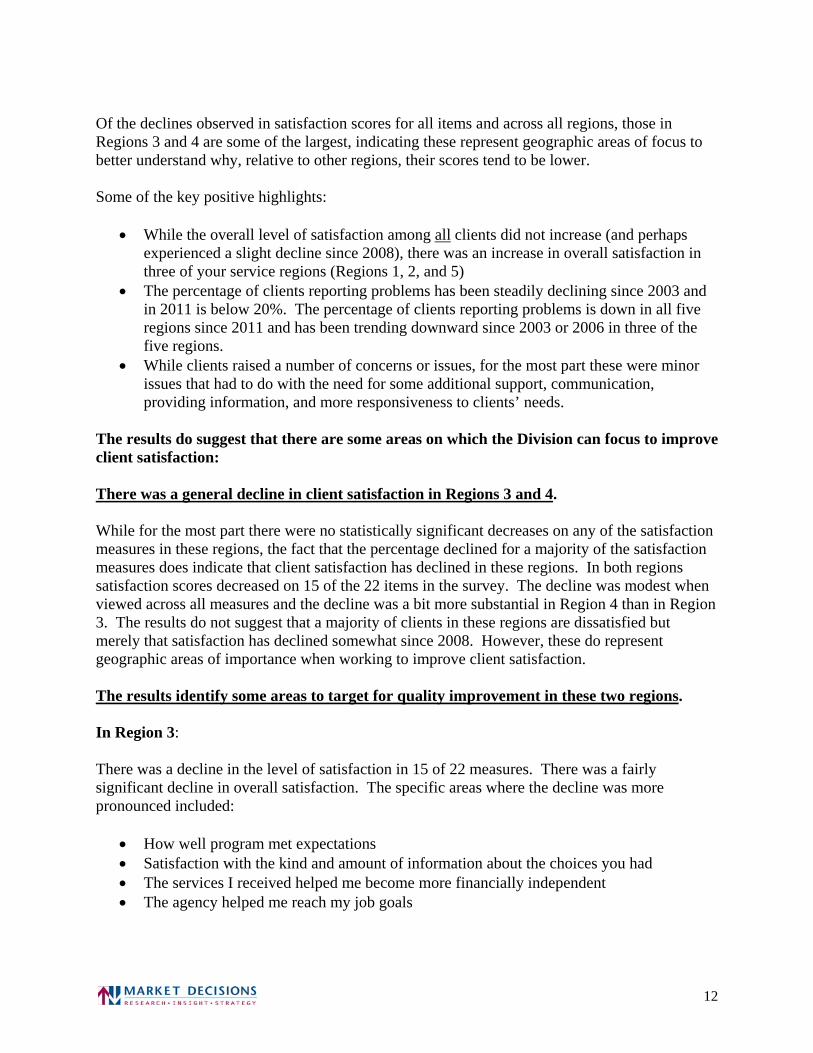
Of the declines observed in satisfaction scores for all items and across all regions, those in Regions 3 and 4 are some of the largest, indicating these represent geographic areas of focus to better understand why, relative to other regions, their scores tend to be lower. Some of the key positive highlights:
While the overall level of satisfaction among all clients did not increase (and perhaps experienced a slight decline since 2008), there was an increase in overall satisfaction in three of your service regions (Regions 1, 2, and 5)
The percentage of clients reporting problems has been steadily declining since 2003 and in 2011 is below 20%. The percentage of clients reporting problems is down in all five regions since 2011 and has been trending downward since 2003 or 2006 in three of the five regions.
While clients raised a number of concerns or issues, for the most part these were minor issues that had to do with the need for some additional support, communication, providing information, and more responsiveness to clients’ needs.
The results do suggest that there are some areas on which the Division can focus to improve client satisfaction: There was a general decline in client satisfaction in Regions 3 and 4. While for the most part there were no statistically significant decreases on any of the satisfaction measures in these regions, the fact that the percentage declined for a majority of the satisfaction measures does indicate that client satisfaction has declined in these regions. In both regions satisfaction scores decreased on 15 of the 22 items in the survey. The decline was modest when viewed across all measures and the decline was a bit more substantial in Region 4 than in Region 3. The results do not suggest that a majority of clients in these regions are dissatisfied but merely that satisfaction has declined somewhat since 2008. However, these do represent geographic areas of importance when working to improve client satisfaction. The results identify some areas to target for quality improvement in these two regions. In Region 3: There was a decline in the level of satisfaction in 15 of 22 measures. There was a fairly significant decline in overall satisfaction. The specific areas where the decline was more pronounced included:
How well program met expectations Satisfaction with the kind and amount of information about the choices you had The services I received helped me become more financially independent The agency helped me reach my job goals

13
The results seem to suggest that overall, clients were expecting more from the program. The main issues cited by clients in Region 3 include:
Communication - Difficulties in communicating with the staff, their counselor did not return calls or was not available, their counselor did not follow-up, time lags in getting services and appointments.
Support - The client felt that no services were provided or that the services provided were of little help, the client needed more support and guidance.
Employment - The client did not find employment and needed more assistance in finding a job, job search help or more job options.
Staff Issues - Would not listen dismissed concerns, did not understand needs or abilities, counselor was too busy, the client was pushed aside, staff needed to be more understanding, counselor left, switched to another counselor.
Clients had some problems getting in touch with staff or other staff issues while others indicated the need for additional support or guidance from staff or the need for more services. Other clients were dissatisfied because they could not find employment. The results also suggest that some clients in Region 3 feel they did not receive all the help they thought was needed and that there were difficulties in talking to staff to help them. In Region 4: There was a decline in the level of satisfaction in 15 of 22 measures. There was a modest decline in overall satisfaction, but two of the measures have been trending downward since 2006. The decline in satisfaction was a bit more pronounced in Region 4 when compared to Region 3. The specific areas were the decline was more pronounced included:
Satisfaction with how long it took your counselor to answer questions, concerns Satisfaction with job Satisfaction with control and involvement in vocational rehabilitation experience
In addition, while there was a decline in the number of clients indicating they experienced problems, there was a sharp decline in the percentage among those with problems indicating that the Division worked to resolve their problem. Clients mentioned similar issues or concerns as expressed among clients of Region 3, including:
Communication - Difficulties in communicating with the staff, their counselor did not return calls or was not available, their counselor did not follow-up, time lags in getting services and appointments.
Support - The client felt that no services were provided or that the services provided were of little help, the client needed more support and guidance.
Employment - The client did not find employment and needed more assistance in finding a job, job search help or more job options.
Paperwork - Difficulty in filling out forms, forms are too long, forms are too complicated, need to simplify forms, need help

14
Staff Issues - Would not listen dismissed concerns, did not understand needs or abilities, counselor was too busy, the client was pushed aside, staff needed to be more understanding, counselor left, switched to another counselor.
Please Note: While there was a decline in client satisfaction in Regions 3 and 4, the issues raised by clients in these two regions were also raised by clients in other regions. In looking to improve client satisfaction, it is important to look at the clients in these two regions and determine specific actions that can be taken to improve their level of satisfaction BUT this does not mean that efforts should not look to address the issues or concerns of clients in other regions. Some clients in Regions 4 and 5 feel that the Division is not doing enough to resolve problems or concerns they may have. For the Division as a whole, there has be a steady decline in the percentage of clients reporting they experienced problems as well as an increase in the percentage of clients reporting that the Division worked to resolve their problems. However, in Regions 4 and 5, the percentage indicating the agency worked to resolve their problems has decreased.
In Region 4, 16% report experiencing problems but only 22% of these clients indicate the Division worked to resolve their problems.
Problems cited include:
1. Effectiveness - Program did not meet expectations, no clear purpose or solutions offered, speed up the process of getting services, had to fight to get services.
2. Support - The client felt that no services were provided or that the services provided were of little help, the client needed more support and guidance.
3. Staff Issues - Would not listen dismissed concerns, did not understand needs or abilities, counselor was too busy, the client was pushed aside, staff needed to be more understanding, counselor left, switched to another counselor.
In Region 4, while only 8% report experiencing problems, none of these clients indicate the Division worked to resolve their problems.

15
Problems cited include:
1. Employment - The client did not find employment and needed more assistance in finding a job, job search help or more job options
2. Communication - Difficulties in communicating with the staff, their counselor did not return calls or was not available, their counselor did not follow-up, time lags in getting services and appointments
3. Effectiveness - Program did not meet expectations, no clear purpose or solutions offered, speed up the process of getting services, had to fight to get services
4. Staff Issues - Would not listen dismissed concerns, did not understand needs or abilities, counselor was too busy, the client was pushed aside, staff needed to be more understanding, counselor left, switched to another counselor.
5. Negative - Negative feedback, dissatisfied with program in general
Client difficulties in these regions (though these are not unique to these two regions) seem to focus on their perceptions of getting the services they need, that they need additional support, and some issues with staff including difficulties in contacting the staff or that the staff did not listen to their concerns. For the Division as a whole and for all regions, most client issues, concerns, or problems focus on difficulties communicating with staff, the need for additional support or services, the inability to find employment, some staff issues, and problems with paperwork. While the large majority of clients were satisfied with the Division, there are some specific concerns mentioned by clients. None of these were mentioned by a majority of clients, though they represent the specific targets that the Division can look to improve to increase client satisfaction. In general terms, they concern issues of communication, support from the Division or the need of additional services, that the Division did not find the client employment, issues or concerns with staff (largely that they had to change counselors or that their counselors did not listen), and problems they experienced in completing paperwork. In general, these are the same types of issues and concerns raised by clients since 2003. Specifically, some clients mentioned:
Difficulties in getting in touch with their counselor or other staff (did not return calls, were not available, delays in communicating with clients, had to wait for staff to get back in touch).
They needed more guidance or support from the Division or that the Division failed to provide services.
The lack of employment; that they did not receive employment or that the Division could not find employment for the client.
Staff issues (they had to switch counselors or switched counselors too frequently, their concerns were dismissed, their counselor did not listen to their concerns, their counselor did not understand their needs or abilities).
Problems with paperwork including difficulty in filling out forms, forms are too long, forms are too complicated, need to simplify forms, need help

16
When evaluating the broader perspective, many of the expressed problems are related to communication, as was observed in 2003, 2006, and 2008. However, there also appears to be a more fundamental issue that seems to be related to resources. There may simply not be the staff available to meet the needs (or perceived needs) of clients. Another factor in play may also be the general economic climate which is making more difficult for people to find employment. While many mention that the Division was not able to help them find employment, this is not a unique situation to this group; given the current economic climate, most people seeking jobs are finding it more difficult to find employment. Staff turnover and the need for clients to switch counselors is less of an issue in 2011 than observed in prior years. In 2003 there was barely a mention of problems associated with having more than one counselor or having to switch counselors frequently. In 2006, 13% of clients mentioned issues or concerns resulting from having more than one counselor in their verbatim comments. In 2008, this issue was still mentioned by 11% of respondents in their verbatim comments. In 2006, a series of direct questions was added to more directly assess the impact of having more than one counselor. In 2006, 46% indicated they had more than one counselor and 33% felt this affected their ability to get services. In 2008, the percentage having more than one counselor increased slightly to 48% with 39% indicating this affected their ability to get services. In 2011, both of these percentages decreased from the percentages observed in 2008. Only 40% of clients indicated that they had more than one vocational rehabilitation counselor. Among these clients, only 32% reported that this affected their ability to get services. These results seem to suggest that:
Clients are experiencing fewer instances where they have to interact with more than one counselor, and
Among those that have more than one counselor, a smaller percentage indicates this affects their ability to get services.
Differences Compared to the Results from Prior Surveys The 2011 survey relied on the same questions included in the 2003, 2006 and 2008 studies to allow a comparison in the results (trending analysis). The goal was to determine whether there has been an improvement in the services provided by the Maine Division of Vocational Rehabilitation from the perspective of Division clients. The tables below provide a quick summary of the changes observed in clients’ levels of satisfaction with the Maine Division of Vocational Rehabilitation from 2003 to 2011. The tables on pages 18, 19 and 21 are broken into four main sections:

17
Overall Measures of Satisfaction Specific Satisfaction Measures Problems Experienced by Clients Job Satisfaction
The tables provide a summary of 22 questions (including the consumer satisfaction index, which is calculated from three survey questions of improvement or decline in satisfaction). The tables indicate whether there was a difference in the percentage of respondents with a positive view of the Division on each specific question. In most cases this represents the percentage of clients reporting they were satisfied or very satisfied with the specific measure. The tables use a series of characters to denote trends observed in the results.
The letter “U” indicates an upward trend in positive response since 2003 or 2006 (U2003/U2006). That is, the percentage of positive response has increased from 2003 or 2006 to 2011.
The letter “D” indicates a downward trend in positive response since 2003 or 2006. That is, the percentage of positive response has decreased from 2003 or 2006 to 2011.
A plus sign “+” indicates there was an increase in the percentage of respondents offering a positive response from 2008 to 2011 without a trend extending back to prior years.
A minus sign “-” indicates there was a decrease in the percentage of respondents offering a positive response from 2008 to 2011 without a trend extending back to prior years.
These tables are designed to quickly summarize trends and it is important to understand that the summarized differences do not necessarily rise to the level of statistical significance. In fact, most of the observed changes were only a few percentage points. Thus, they should be not be viewed as meaning there has been a significant improvement or decline in the level of client satisfaction, but viewed as more of a qualitative sense of the trend in client satisfaction. That is, they should be read to determine if the perception of the Division and the services it provides among clients is moving in a positive or negative direction. They can be thought of as representing areas where the Division is viewed by clients as improving the services it offers or areas where clients view that the Division may need to improve its level of service. In all tables, results are provided for the Division as a whole as well as for each service region. Beginning on page 29, there is a summary of the issues or concerns raised by clients that will help clarify any specific areas for improvement. In evaluating the four overall satisfaction measures found in the survey, there was a decline in the percent positive response in three of the four items. Two of these items have trended downward since 2003.

18
By Region:
Region 1 – 3 measures with an increase (higher percentage satisfied) when compared to 2008 with one of these trending upward since 2003 and 1 measure with a decrease (lower percentage satisfied).
Region 2 – 3 measures with an increase when compared to 2008. Region 3 – 4 measures with a decrease when compared to 2008. Region 4 – 2 measures with a decrease trending downward from 2003. Region 5 – 4 measures with an increase when compared to 2008.
Summary of Changes in Satisfaction Measures from 2003 to 2011 (Overall Satisfaction)
ME DVR ME
Region 1 ME
Region 2 ME
Region 3 ME
Region 4 ME
Region 5
Overall Satisfaction Measures
Consumer Satisfaction Index + U2003 + - +
Overall Satisfaction D2003 + + - D2006 +
Satisfaction with services provided by the agency - + + - D2003 +
Would you recommend that friends go to agency for help D2003 - - +
Legend:
“U” indicates an upward trend in positive response since 2003 or 2006 (U2003/U2006). “D” indicates a downward trend in positive response since 2003 or 2006 (D2003/D2006. “+”indicates there was an increase in the percentage of respondents offering a
positive response from 2008 to 2011. “-” indicates there was a decrease in the percentage of respondents offering a
positive response from 2008 to 2011.

19
Summary of Changes in Satisfaction Measures from 2003 to 2011
(Specific Satisfaction Measures)
ME DVR ME Region 1
ME Region 2
ME Region 3
ME Region 4
ME Region 5
Specific Satisfaction Measures
Satisfaction with control and involvement in vocational rehabilitation experience + - +
Satisfaction with your choice of a vocational goal - - U2003 - - D2003
Satisfaction with the choice of services that were available D2003 - D2003 D2003 +
Satisfaction with the choice of service providers - U2006 +
Satisfaction with the kind and amount of information about the choices you had - + - - +
Satisfaction with how long it took your counselor to answer questions, concerns U2006 + - +
How easy was it for you to complete an application + - U2003 - +
How helpful were the staff in helping you achieve goals + + - - + -
How easy was it for you to contact your vocational rehabilitation counselor - U2003 - +
How accessible was the office for someone with your type of disability - - D2006 D2003 +
The services I received helped me become more financially independent D2006 + - - D2006 -
The staff treated me with dignity and respect D2003 - D2003 - D2006 +
The agency helped me reach my job goals - - D2006 D2003 D2006 -
How well program met expectations + + + - - +
How well program matches your ideal program + + + - - +
(Legend Presented Above)

20
In evaluating the fifteen specific area satisfaction measures, there were several instances where the percentage of positive responses increased from both 2006 and 2003 but there were also items where the percentage of positive response decreased. A summary is presented below.
ME
DVR
ME Region
1
ME Region
2
ME Region
3
ME Region
4
ME Region
5
Number of measures with trending upward since 2003 0 0 2 1 0 0
Number of measures with trending upward since 2006 0 1 0 1 0 0
Number of measures with an increase in positive response since 2008
3 5 5 0 2 10
Number of measures with a decrease in positive response since 2008
3 8 3 8 7 3
Number of measures with trending downward since 2006
1 0 2 0 3 0
Number of measures with trending downward since 2003
2 0 1 3 1 1
Regions with an increase in the largest number of items include Region 5 (10 items), Region 2 (7 items with 2 trending upward since 2003), and Region 1 (6 items with one trending up since 2006), Regions with a decrease in the largest number of items include Region 4 (11 items with 3 trending downward since 2006 and one since 2003), and Region 3 (11 items with 3 trending downward since 2003). In evaluating whether clients experienced problems with the Division or the services it provides, the percentage of clients reporting problems is trending downward (there was a decrease in the percentage of clients reporting problems – hence an upward or positive trend) since 2003 and there was also an increase trending from 2006 in the percentage of clients reporting that the Division worked to resolve any problems.

21
By Region:
Region 1 – A smaller percentage of clients experienced problems in 2011 compared to 2008 and a larger percentage of those experiencing problems indicated the Division worked to resolve any problems.
Region 2 – The percentage of clients reporting problems has been trending downward since 2006 and the percentage of those experiencing problems indicated the Division worked to resolve any problems has been trending upward since 2003.
Region 3 – The percentage of clients reporting problems has been trending downward since 2003 and a larger percentage of those experiencing problems indicated the Division worked to resolve any problems since 2008.
Region 4 – A smaller percentage of clients experienced problems in 2011 compared to 2008, however, a smaller percentage of those experiencing problems indicated the Division worked to resolve any problems.
Region 5 – The percentage of clients reporting problems has been trending downward since 2003, however, a smaller percentage of those experiencing problems indicated the Division worked to resolve any problems.
Summary of Changes in Satisfaction Measures from 2003 to 2008 (Problems Experienced by Clients and Job Satisfaction)
ME
DVR ME
Region 1 ME
Region 2 ME
Region 3 ME
Region 4 ME
Region 5
Problems Experienced by Client
Experience any problems U2003 + U2006 U2003 + U2003
Did agency work to resolve problems U2006 + U2003 + - -
Job Satisfaction
Satisfaction with job + - + D2006 +
(Legend Presented Above)

22
Finally, in evaluating job satisfaction, there was an increase in the percentage of employed clients that were satisfied in 2011 when comparing 2008 to 2006 for the Division as a whole. By Region:
Region 1 – There was increase in the percentage of employed clients that were satisfied when comparing 2011 to 2008.
Region 2 – There was decrease in the percentage of employed clients that were satisfied when comparing 2011 to 2008.
Region 3 – There was increase in the percentage of employed clients that were satisfied when comparing 2011 to 2008.
Region 4 – There was decrease in the percentage of employed clients that were satisfied is trending downward since 2006.
Region 5 – There was increase in the percentage of employed clients that were satisfied when comparing 2011 to 2008.
The summary table below provides a more global view of client satisfaction. It provides a summary of the total number of questions where the level of satisfaction increased and the total number of questions where the level of satisfaction decreased. This table provides a global perspective on the satisfaction and can be viewed as providing an overall assessment of client satisfaction with the Division and client satisfaction within each service region. In reading the table, if a large number of items show an increase in satisfaction, either from 2006 or trending upward from 2003, this can be interpreted as an improvement in the level of satisfaction among clients of the Division and the services it provides (overall and within each region). Conversely, if a large number of items show a decrease in satisfaction from 2006, or trend less positive since 2003, this can be interpreted as a decline in the level of satisfaction among clients of the Division and the services it provides (overall and within each region).

23
Summary of the Number of Questions Showing an Increase in Satisfaction among Clients
and Questions Showing a Decrease in Satisfaction among Clients (of 22 total)
ME
DVR
ME Region
1
ME Region
2
ME Region
3
ME Region
4
ME Region
5
Number of measures with trending upward since 2003 1 1 3 2 0 1
Number of measures with trending upward since 2006 1 1 1 1 0 0
Number of measures with an increase in positive response since 2008
3 10 8 2 3 15
Total Measures Showing an Increase Since 2008 5 12 12 5 3 16
Number of measures with a decrease in positive response since 2008
4 9 1 11 8 4
Number of measures with trending downward since 2006
1 0 2 0 5 0
Number of measures with trending downward since 2003
4 0 3 3 2 1
Total Measures Showing a Decrease Since 2008 9 9 6 14 15 5

24
Looking at results for the Division as a whole, five questions indicate an increase in satisfaction while nine questions indicated a decrease in satisfaction. This indicates that the overall level of satisfaction among all customers is comparable to that observed in 2008. By Region: Region 1 - 12 questions show an increase in satisfaction while 9 questions show a decrease in satisfaction. This suggests that the level of satisfaction in this region is comparable to that observed in 2008. Region 2 - 12 questions show an increase in satisfaction while 6 questions show a decrease in satisfaction. This suggests that the level of satisfaction in this region is up somewhat since 2008. Region 3 - 5 questions show an increase in satisfaction while 14 questions show a decrease in satisfaction. This suggests that the level of satisfaction in this region has decreased since 2008. Region 4 - 3 questions show an increase in satisfaction while 15 questions show a decrease in satisfaction. This suggests again that the level of satisfaction in this region has decreased since 2008. Region 5 - 16 questions show an increase in satisfaction while 5 questions show a decrease in satisfaction. This suggests that the level of satisfaction in this region has increased since 2008. In summary, one can interpret the results as indicating a comparable level of satisfaction in 2011 as compared to 2008 among all clients of the Division though with some region variation; a higher level of satisfaction in Regions 2 and 5 (compared to 2008), and lower satisfaction in Regions 3 and 4 (compared to 2008). Specific Areas for Improvement Efforts General Areas of Focus The survey instrument used in this research not only allowed respondents to rate the services they received through the Maine Division of Vocational Rehabilitation, but also provided the opportunity to offer feedback when the client was not satisfied. The survey also allowed clients to identify any problems they experienced and offer suggestions for service improvement. As noted, the results do not suggest that significant problems exist in the Division or with the services it provides. Rather, the results suggest areas of minor concern that can be addressed to improve upon an already high level of satisfaction. This section provides a summary of the verbatim responses provided by clients throughout the survey. The first table classifies comments by main topic area. The table on page 29 categorizes verbatim responses into 23 main topic areas. The numbers in the table represent the TOTAL number of times a comment was made that fell within the general area.

25
Please note that:
472 of the 705 clients surveyed in this study offered verbatim comments about issues, problems or concerns (including those who offered positive comments).
Each topic area contains a number of specific categorized comments (there were in fact over 300 specific categories for comments) – that is, a general topic area may include a number of responses from these 300 specific categories.
Each client had the opportunity to provide a comment to each survey question if they were not satisfied (there are 22 items that evaluate client satisfaction).
The counts represent the total number of times a comment was mentioned (but duplicate mentions of a specific comment by the same client were not counted). Again, note that a respondent could have mentioned several (different) comments that applied to a general area so the numbers do not represent the NUMBER of respondents making a comment that pertains to a general topic area. Rather, this is simply a count of how many times a comment was made among all respondents. These general topic areas represent the key areas where respondents have identified concerns or problems. The table counts provide a way to evaluate the relative weight of each general topic area in relation to one another. That is, how significant a general area was in the minds of all respondents when expressing comments, concerns or problems. The table can help to identify the areas where efforts at quality improvement would serve to improve the level of satisfaction among all your clients. A key is provided on page 31 that lists the specific types of comments that are included in these general topic areas (the bold word or phrase corresponds to the appropriate term in the key). Overall, the main areas of concern among clients were (in descending order of the number of comments mentioned for the general area):
1. Issues with Communication with the Division and Division Staff 2. Need for more Support (more guidance from staff, more services to achieve goals) 3. Employment Issues 4. Issues with Staff (switching counselors, help, understanding) 5. Issues with Forms and other Paperwork (forms too difficult, needing help to complete
forms) 6. Effectiveness of the Division in Providing Services and Meeting Expectations
These are in general the same types of concerns raised in 2008. The general areas for which clients made comments or expressed concern or problems fall mainly into six categories.

26
Communications Issues concern the ability of the client to contact their counselor or other staff. This included comments that reflect the difficulty of the client to reach their counselor by telephone, the lack of follow-up by their counselor and time lags between contact and getting services or appointments. Support reflects more general statements about the lack of needed services from the client’s perspective or the belief that the Division did not provide needed assistance. Comments include that the services provided were of little help because of the lack of continued support and that the client simply needed more support or guidance. Employment Concerns reflect that clients did not find employment through the Division, that the client felt the need for more assistance in finding a job, and that the client would like more options when choosing a job. Comments about Staff Issues reflect concern over their ability to work with staff. This includes that staff dismissed or did not listen to their concerns or needs and that the staff needed to be more understanding. Also included in this area are the feelings that staff were too busy and overworked. Finally, many clients also indicated there were difficulties because of the turnover in the counselor staff, that they had more than one counselor while receiving services. Issues with Forms or other Paperwork reflect that clients felt that the forms they were required to complete were either too complicated or that they needed assistance from Division staff to complete them properly. Effectiveness reflects mainly that the services provided by the Division did not necessarily meet the expectations of clients. This is largely more general views about the Division and how it provides assistance to clients. Client comments include that the program did not meet their expectations, services were of little or no help, that the client had to fight to get services, or that there was a general need to speed up the process of providing services to clients. By Region, the main areas of concern among clients were (again in order of mention): Region 1:
1. Issues with Communication with the Division and Division Staff 2. Need for more Support (more guidance from staff, more services to achieve goals) 3. Employment Issues
Region 2:
1. Issues with Communication with the Division and Division Staff 2. Need for more Support (more guidance from staff, more services to achieve goals) 3. Employment Issues 4. Issues with Staff (switching counselors, help, understanding) 5. Effectiveness of the Division in Providing Services and Meeting Expectations

27
Region 3:
1. Issues with Communication with the Division and Division Staff 2. Need for more Support (more guidance from staff, more services to achieve goals) 3. Employment Issues 4. Issues with Staff (switching counselors, help, understanding)
Region 4:
1. Issues with Communication with the Division and Division Staff 2. Need for more Support (more guidance from staff, more services to achieve goals) 3. Employment Issues 4. Issues with Forms and other Paperwork (forms too difficult, needing help to complete
forms) 5. Issues with Staff (switching counselors, help, understanding) 6. Effectiveness of the Division in Providing Services and Meeting Expectations
Region 5:
1. Issues with Communication with the Division and Division Staff 2. Issues with Forms and other Paperwork (forms too difficult, needing help to complete
forms) 3. Need for more Support (more guidance from staff, more services to achieve goals)

28
General Topic Areas of Respondent Comments, Problems, and Concerns Number of Comments, Issues, Problems or Concerns Mentioned by General Topic Area
ME
DVR Region
1 Region
2 Region
3 Region
4 Region
5
Issues with Communication with the Division and Division Staff
209 47 63 52 33 14
Need for more Support (more guidance from staff, more services to achieve goals)
154 29 39 43 33 10
Employment Issues 134 24 35 37 29 9
Issues with Staff (switching counselors, help, understanding)
100 19 29 26 21 5
Paperwork (forms difficult, needing help with paperwork)
85 17 21 12 22 13
Effectiveness of the Division in Providing Services and Meeting Expectations
83 17 23 19 20 4
Client Disabilities 83 15 23 19 20 6
General Satisfaction 76 23 12 22 12 7
General Dissatisfaction 59 7 19 17 14 2
Need for More Information, More Detailed Information
44 9 10 12 10 3
Transportation Issues (lack of, distance to offices)
43 14 13 8 7 1
Location and Hours 40 10 14 8 4 4
Need to Expand Services or Funding for the Division
28 7 8 5 6 2
Testing - need for more testing, less testing
23 3 4 8 6 2
Need for More Education and Training 20 4 7 5 4

29
General Topic Areas of Respondent Comments, Problems, and Concerns Number of Comments, Issues, Problems or Concerns Mentioned by General Topic Area
(continued)
ME
DVR Region
1 Region
2 Region
3 Region
4 Region
5
Client Involvement in and Control of Vocational Rehabilitation Process
18 5 6 3 2 2
Client Financial Issues (not meeting financial needs)
16 3 4 4 5
Accessibility issues (access to offices) 15 6 4 4 1
Need for Additional Services (outside vendors, services for hearing impaired)
7 1 2 2 2
Client Issues (client responsibility for problems)
1 1
Eligibility (did not qualify, denied services)
1 1
Discrimination - Experience discrimination by agency or employer, feels discriminated against
1 1
Safety - safety issues and concerns 1 1

30
KEY
Area Definitions:
Communication - Difficulties in communicating with the staff, their counselor did not return calls or was not available, their counselor did not follow-up, time lags in getting services and appointments.
Support - The client felt that no services were provided or that the services provided
were of little help, the client needed more support and guidance.
Employment - The client did not find employment and needed more assistance in finding a job, job search help or more job options.
Staff Issues - Their counselor would not listen or dismissed concerns, their counselor
did not understand their needs or abilities, their counselor was too busy - the client felt pushed aside, staff needed to be more understanding of their needs and situation, staff is overworked, their counselor left and/or they were switched to another counselor.
Paperwork – Difficulty in filling out forms, forms are too long, forms are too
complicated, need to simplify forms.
Effectiveness - Program did not meet expectations, no clear purpose or solutions offered, speed up the process of getting services, had to fight to get services.
Client Disabilities – Trouble reading, poor eyesight, difficulties understanding or
comprehending, difficulties due to disability.
Information - The client was unaware of available services, the client needed more information about available services, and the client needed more information about employment choices.
Transportation – Distance to offices or services, need transportation, parking,
vehicle assistance.
Location and Hours - Need for more locations, more convenient hours, office locations change.
Expanded Services – Division needs more funding for services, need to offer more
services, networking with other agencies and businesses.
Testing - Need for more testing, less testing.
Education and Training – More job training and more options, more training and educational opportunities, did not receive needed training.

31
Client Involvement – More client involvement in process, client had no control over
process, client was told what to do, felt pushed into a job.
Client Financial Issues – Did not receive financial assistance, not financially independent, client had to pay for services, client did not receive assistance in paying for services.
Accessibility – Mobility inside offices, difficulty getting into small offices, lighting,
elevators and stairs, difficulty with entries and exits, directions to offices.
Additional Services – Services for the severely disabled, problems with services contracted by the Division, no services available in area.
Client Issues – Lack of success was fault of client, counselor and Division tried to
help.
Eligibility – Person did not qualify for services, person was denied services.
Discrimination – Experience discrimination by agency or employer, feels discriminated against.
Delays – Client concerned about their safety.

32
Specific Issues for Focus of Quality Improvement Initiative The discussion above outlines the general areas where clients have noted concerns or problems and provide some insight to guide efforts to improve service to clients. These can be thought of as the global areas of focus, the general areas where clients have noted difficulties. The table beginning on page 34 provides specific areas that represent targets where quality improvement efforts can increase the level of satisfaction among your clients. In this table, the percentages reflect the percentage of all clients that made a comment about a specific issue, concern or problem. That is, the percentages reflect the percent of the total client population with a specific concern, issue, or problem. The table provides the percentages for the Division as a whole as well as for each of the five service regions. These percentages are tabulated across all of the satisfaction measures included in the survey. That is, if a client mentioned the issue, concern, or problem at any time during the survey. Overall, the specific issues among clients were:
17% of clients mentioned the need for more guidance or support from the Division while in the program.
12% of clients expressed concerns because they did not receive employment or that the Division did not find them a job.
12% of clients indicated that their counselor did not return calls or did not follow up. 9% of clients felt that they did not receive any services or that the services they did
receive were of little or no help. 9% of clients indicated that their counselor did not return calls or mail for days or weeks. 7% of clients indicated it was difficult to reach their counselor. 6% of clients indicated it was difficult to reach staff at the Division (in general). 6% of clients indicated they did not receive enough information about services or were
unaware of available services. 6% indicated they had difficulties because of switching counselors. 5% of clients expressed frustration about having to call counselors several times, having
to leave a number of messages, and waiting for counselors to call.

33
Specific Areas for Quality Improvement (% of all clients mentioning issue, concern, or problem)
ME
DVR Region
1 Region
2 Region
3 Region
4 Region
5
SUPPORT - Need more guidance, support 17% 14% 15% 23% 20% 12%
WORK- Did not receive employment, Could not find me a job
12% 9% 16% 15% 11% 7%
COMM - Counselor did not return calls, No follow up
12% 11% 19% 14% 5% 9%
SUPPORT - No services provided, not much help
9% 7% 10% 12% 8% 3%
COMM - Calls, mail not returned for days, weeks, wait
7% 6% 11% 7% 7% 3%
COMM - Hard to reach counselor 7% 7% 9% 7% 3% 4%
COMM - Hard to reach staff 6% 3% 10% 10% 5% 1%
INFO - Not enough, unaware of available services
6% 6% 6% 6% 6% 4%
STAFF - Changing counselors, switching too much
6% 5% 7% 8% 4% 1%
NEGATIVE - Program did nothing or little to help
5% 2% 9% 6% 6% 1%
COMM - Phone tag - leave a message and counselor called back
5% 4% 5% 4% 7% 6%
COMM - Leave multiple messages before getting a call back
5% 6% 8% 6% 0% 3%
HELP - Someone else helped, counselor did paperwork
4% 4% 4% 4% 5% 9%
WORK -No job yet-still working on achieving goals
4% 3% 4% 8% 3% 1%
COMM - Time lags to get services, appointments
4% 3% 7% 5% 2% 1%
HELP - Trouble filling out forms, needed help
4% 4% 4% 2% 7% 3%
STAFF - Staff attitude, disrespect, unprofessional
4% 2% 6% 3% 6% 1%

34
Specific Areas for Quality Improvement
(% of all clients mentioning issue, concern, or problem) (continued)
ME
DVR Region
1 Region
2 Region
3 Region
4 Region
5 EFFECTIVE - Agency was not very productive, effective
4% 1% 4% 7% 3% 4%
TRANS - Distance, bus routes, train station 4% 3% 7% 4% 3% 1%
EXPAND - More info needed, need to broaden programs
4% 4% 5% 3% 3% 3%
CONDITION - Trouble understanding, terms, language, confused
3% 4% 4% 3% 4% 1%
POSITIVE - Commendable efforts, services provided
3% 5% 2% 4% 4% 1%
STAFF - Counselor would not listen, dismissed concerns
3% 3% 4% 1% 5% 4%
TIME - Lots of paperwork, too long, make it shorter
3% 4% 6% 3% 1% 0%
TEST - Didn't receive needed, desired testing 3% 2% 2% 5% 4% 3%
CONDITION - Trouble reading, writing, education
3% 1% 5% 3% 5% 0%
COMM - They are too busy, They have large caseloads
3% 1% 5% 4% 1% 4%
CONDITION - Trouble because of disability 3% 3% 3% 4% 2% 1%
SUPPORT - Did not achieve goal, working on, need guidance
3% 1% 6% 2% 1% 3%
TRANS - Transportation in general 3% 4% 4% 2% 3% 0%
COMM - Voicemail, leave message, Never answer phone
3% 3% 3% 2% 3% 0%
NEGATIVE - Dissatisfied with services and counselor
3% 3% 4% 4% 1% 0%
HARD - Hard, Somewhat difficult, complicated
3% 1% 3% 2% 2% 7%

35
Specific Areas for Quality Improvement
(% of all clients mentioning issue, concern, or problem) (continued)
ME
DVR Region
1 Region
2 Region
3 Region
4 Region
5 TIME - Long period of waiting, remember filling it out
3% 3% 3% 2% 1% 6%
CONTROL - No control over experience, told me what to do
2% 3% 3% 2% 1% 3%
EFFECTIVE - No help, very little help 2% 3% 4% 1% 2% 0%
STAFF - Listen to client, understand needs, wants, ability
2% 2% 2% 4% 3% 1%
WORK - Help client get a job, more job services, job options
2% 2% 2% 4% 2% 0%
CONDITION - Some questions had to be explained, complicated
2% 1% 4% 1% 2% 4%
FINANCE - Did not receive needed financial help
2% 2% 2% 2% 3% 0%
FINANCE - No change financially 2% 1% 2% 4% 1% 3%
EDUCATION - Did not receive needed education, training
2% 2% 4% 1% 2% 0%
POSITIVE - They tried to help, received some help
2% 4% 1% 1% 1% 3%
EFFECTIVE - Broken promises, no follow thru
2% 1% 4% 2% 1% 0%
WORK - Completed testing, training but still no job
2% 1% 4% 2% 2% 0%
EFFECTIVE - Not meet expectations, help with goals
2% 1% 2% 2% 2% 0%
HARD - Directions, questions could have been clearer
2% 3% 2% 1% 2% 1%
STAFF - Counselor too busy, pushed aside 2% 3% 2% 1% 2% 0%
EFFECTIVE - Training did not match with interest, ability
2% 3% 2% 1% 1% 0%

36
Specific Areas for Quality Improvement
(% of all clients mentioning issue, concern, or problem) (continued)
ME
DVR Region
1 Region
2 Region
3 Region
4 Region
5 STAFF - Counselor was not helpful, supportive
2% 2% 2% 2% 1% 0%
WORK - Dissatisfied with job, not what they wanted
2% 1% 2% 1% 1% 3%
WORK - No job, didn't receive much job search help
2% 1% 3% 1% 2% 0%
COMM - Person never available (meetings, out of office)
1% 1% 2% 2% 0% 1%
POSITIVE - Easy able to reach counselor with no problems
1% 2% 1% 1% 2% 0%
STAFF - Counselor, staff did not treat me with respect, rude
1% 1% 1% 3% 1% 0%
SUPPORT - More services needed to help with career goals
1% 3% 2% 2% 0% 0%
NEGATIVE - Not accessible at all 1% 1% 1% 2% 1% 1%
WORK - Cannot find better paying job, not earning much
1% 1% 1% 1% 1% 4%
HARD - Having to find info, too much info 1% 2% 2% 1% 1% 0%
NEGATIVE - Dissatisfied (general) 1% 0% 2% 1% 1% 0%
OFFICE - Location, directions to building or office
1% 1% 2% 1% 1% 0%
POSITIVE - Some parts are easy, some are hard
1% 1% 0% 2% 1% 1%
STAFF - Counselors make more effort, client does work
1% 0% 1% 2% 1% 1%
WORK - Had to find job, services on own 1% 1% 2% 1% 2% 0%
EFFECTIVE - Used own resources to get job, training
1% 1% 2% 1% 1% 0%

37
III. Summary Report

38
Services Received by Clients
The most common services received are help in finding a job, vocational or employment counseling, and financial assistance.
The largest percentage indicated that help in finding a job and vocational or
employment counseling were the most helpful services they received.

39
The most common services received are help in finding a job, vocational or employment counseling, and financial assistance.
Q02: What services did you receive from ME DVR?
ME
DVR Region
1 Region
2 Region
3 Region
4 Region
5
Help in finding a job 43% 46% 39% 49% 37% 36%
Vocational or employment counseling 36% 35% 36% 37% 34% 33%
Financial Assistance 28% 25% 32% 33% 26% 22%
College education or training 21% 20% 24% 20% 19% 21%
Counseling 19% 21% 19% 17% 18% 12%
Other education and training 14% 14% 18% 14% 12% 10%
General information 14% 17% 12% 12% 13% 17%
Business or vocational training 13% 13% 16% 11% 12% 9%
Situational Assessment or Job Trial 10% 11% 9% 14% 4% 13%
Adaptive equipment 10% 10% 4% 10% 15% 25%
Transportation 10% 8% 10% 14% 8% 6%
Testing or evaluations 8% 5% 10% 8% 7% 13%
Received information on services offered 6% 5% 5% 7% 8% 6%
Medical treatment or services 4% 5% 1% 9% 3% 5%
Repairs to house/ equipment 3% 4% 0% 3% 5% 10%
Home based employment 3% 2% 5% 4% 2% 1%
Low vision aids 3% 3% 1% 4% 2% 2%
Personal or living skills 2% 4% 1% 2% 4% 2%
Group support 2% 2% 3% 3% 1%
Vehicle Modifications 2% 2% 5% 1% 1%
Rehabilitation teaching or training 2% 2% 1% 1% 2% 3%
Complaint 2% 2% 1% 3% 1% 2%
Social adjustment counseling 1% 3% 1% 1% 1%
Home modifications 1% 2% 1% 2%
Mobility instruction training 1% 1% 0% 2% 1% 3%
Results by region for 2011
Note: columns listed as “0%” indicated instances where less than 0.5% gave this response. Blanks represent cases where no client gave this response.
40
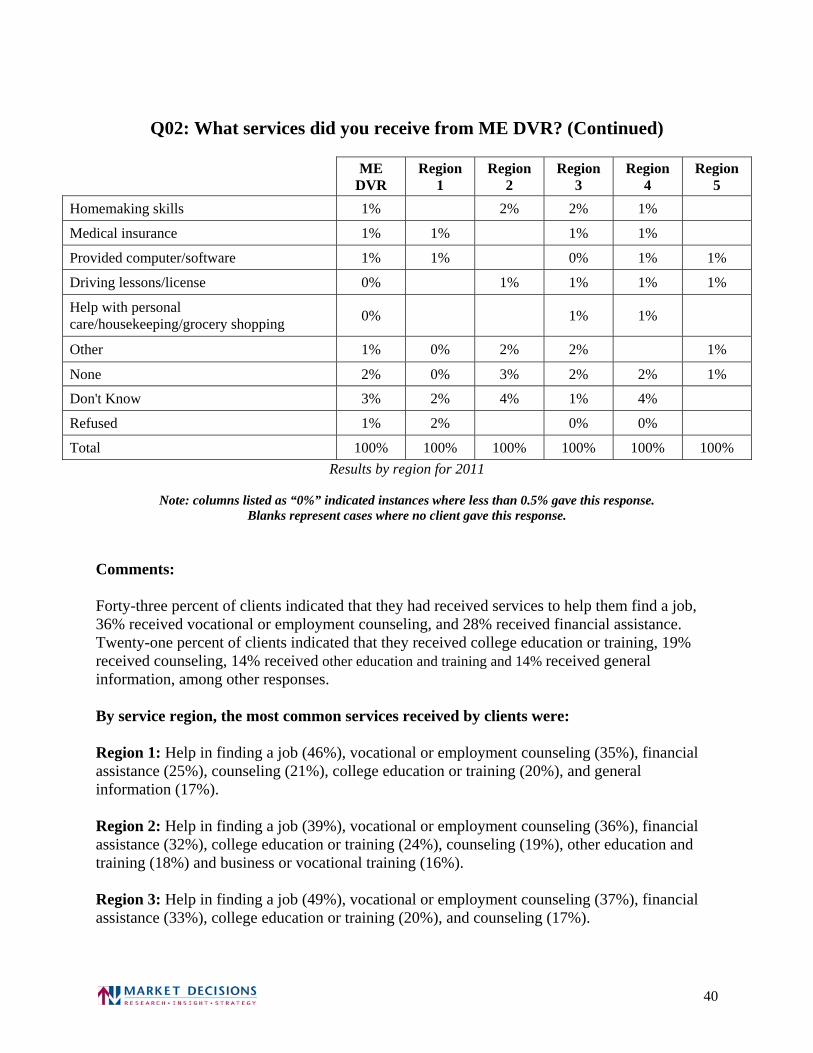
Q02: What services did you receive from ME DVR? (Continued)
ME
DVR Region
1 Region
2 Region
3 Region
4 Region
5
Homemaking skills 1% 2% 2% 1%
Medical insurance 1% 1% 1% 1%
Provided computer/software 1% 1% 0% 1% 1%
Driving lessons/license 0% 1% 1% 1% 1%
Help with personal care/housekeeping/grocery shopping
0% 1% 1%
Other 1% 0% 2% 2% 1%
None 2% 0% 3% 2% 2% 1%
Don't Know 3% 2% 4% 1% 4%
Refused 1% 2% 0% 0%
Total 100% 100% 100% 100% 100% 100%
Results by region for 2011
Note: columns listed as “0%” indicated instances where less than 0.5% gave this response. Blanks represent cases where no client gave this response.
Comments: Forty-three percent of clients indicated that they had received services to help them find a job, 36% received vocational or employment counseling, and 28% received financial assistance. Twenty-one percent of clients indicated that they received college education or training, 19% received counseling, 14% received other education and training and 14% received general information, among other responses. By service region, the most common services received by clients were: Region 1: Help in finding a job (46%), vocational or employment counseling (35%), financial assistance (25%), counseling (21%), college education or training (20%), and general information (17%). Region 2: Help in finding a job (39%), vocational or employment counseling (36%), financial assistance (32%), college education or training (24%), counseling (19%), other education and training (18%) and business or vocational training (16%). Region 3: Help in finding a job (49%), vocational or employment counseling (37%), financial assistance (33%), college education or training (20%), and counseling (17%).

41
Region 4: Help in finding a job (37%), vocational or employment counseling (34%), financial assistance (26%), college education or training (19%), and counseling (18%). Region 5: Help in finding a job (36%), vocational or employment counseling (33%), adaptive equipment (25%), financial assistance (22%), college education or training (21%), and general information (17%).

42
The largest percentage indicated that help in finding a job and vocational or employment counseling were the most helpful services they received.
Q03: What were the most helpful services provided to you by the ME DVR program?
ME
DVR Region
1 Region
2 Region
3 Region
4 Region
5
Help in finding a job 23% 27% 17% 30% 16% 14%
Vocational or employment counseling 22% 24% 24% 18% 19% 15%
Financial Assistance 17% 12% 26% 14% 18% 19%
Counseling 12% 10% 16% 13% 12% 6%
College education or training 9% 8% 11% 9% 11% 16%
Adaptive equipment 6% 7% 1% 5% 11% 20%
Other education and training 6% 8% 2% 6% 6% 3%
Situational Assessment or Job Trial 5% 6% 5% 7% 6%
Transportation 5% 2% 5% 10% 5% 5%
Business or vocational training 5% 4% 4% 6% 4% 6%
General information 3% 2% 2% 3% 5% 10%
Group support 3% 2% 4% 2% 2% 1%
Repairs to house/ equipment 2% 1% 0% 3% 4% 8%
Testing or evaluations 2% 1% 2% 2% 2% 8%
Medical treatment or services 2% 1% 3% 4% 2%
Personal or living skills 1% 2% 0% 1% 2% 2%
Rehabilitation teaching or training 1% 1% 1% 1% 2% 2%
Received information on services offered 1% 1% 1% 3% 1%
Home based employment 1% 2% 1%
Homemaking skills 1% 2% 1% 1%
Low vision aids 1% 1% 1% 2%
Complaint 1% 2% 0%
Vehicle Modifications 1% 0% 0% 2% 1%
Results by region for 2011
Note: columns listed as “0%” indicated instances where less than 0.5% gave this response. Blanks represent cases where no client gave this response.

43
Q03: What were the most helpful services provided to you by the ME DVR program? (Continued)
ME
DVR Region
1 Region
2 Region
3 Region
4 Region
5
Medical insurance 1% 1% 1% 2%
Satisfied with Services/Counselor 1% 1% 1% 1%
Social adjustment counseling 0% 1% 1% 1%
Driving lessons/license 0% 1% 1%
Help with personal care/housekeeping/grocery shopping
0% 1% 1%
Mobility instruction training 0% 1%
Home modifications 0% 1%
Provided computer/software 0% 1% 2%
Household/monthly bills 0% 1%
Other 2% 2% 3% 2% 1% 1%
None 4% 3% 3% 4% 7% 5%
Don't Know 7% 7% 8% 5% 8% 1%
Refused 1% 2% 0% 0% 1%
Total 100% 100% 100% 100% 100% 100%
Results by region for 2011
Note: columns listed as “0%” indicated instances where less than 0.5% gave this response. Blanks represent cases where no client gave this response.
Comments: When asked which of the services they received were the most helpful, 23% of clients indicated that help in finding a job was the most helpful service provided by the agency and 22% mentioned vocational or employment counseling. Seventeen percent of clients felt that financial assistance was the most helpful service they received, 12% mentioned counseling, and 9% said college education or training, among other responses. By service region, the services considered most helpful were: Region 1: Help in finding a job (27%), vocational or employment counseling (24%), financial assistance (12%), and counseling (10%). Region 2: Financial assistance (26%), vocational or employment counseling (24%), help in finding a job (17%), counseling (16%), and college education or training (11%).

44
Region 3: Help in finding a job (30%), vocational or employment counseling (18%), financial assistance (14%), counseling (13%), and transportation (10%). Region 4: Vocational or employment counseling (19%), financial assistance (18%), help in finding a job (16%), counseling (12%), college education or training (11%), and adaptive equipment (11%). Region 5: Adaptive equipment (20%), financial assistance (19%), college education or training (16%), vocational or employment counseling (15%), help in finding a job (14%), and general information (10%).
45
Measures of Overall Satisfaction In 2011, 81% of clients were very satisfied or satisfied with the Maine Division of
Vocational Rehabilitation’s program.
In 2011, 83% of clients indicated that they were satisfied with the services they received.
In 2011, 80% of clients indicated that the services provided met their expectations.
In 2011, 80% of clients indicated that the services provided through the Maine
Division of Vocational Rehabilitation compared favorably to the services offered through their ideal program.
Among all clients, the Consumer Satisfaction Index was 75.7 in 2011.
In 2011, 92% percent of clients would tell their friends with similar disabilities to go
to the Maine Division of Vocational Rehabilitation for help.

46
In 2011, 81% of clients were very satisfied or satisfied with the Maine Division of Vocational Rehabilitation’s program.
ME
DVR Region
1 Region
2 Region
3 Region
4 Region
5
Very dissatisfied 4% 4% 5% 6% 2% 6%
Dissatisfied 6% 5% 8% 6% 6% 3% Neither satisfied nor dissatisfied
9% 9% 6% 10% 12% 9%
Satisfied 45% 43% 48% 46% 42% 31%
Very satisfied 36% 40% 32% 32% 38% 51%
Total 100% 100% 100% 100% 100% 100% Results by region for 2011
4% 6% 9%
45%36%
0%
20%
40%
60%
80%
100%
Very dissatisfied
Dissatisfied Neither satisfied nor dissatisfied
Satisfied Very satisfied
Q01: Overall, how satisfied are you with the ME DVR program?
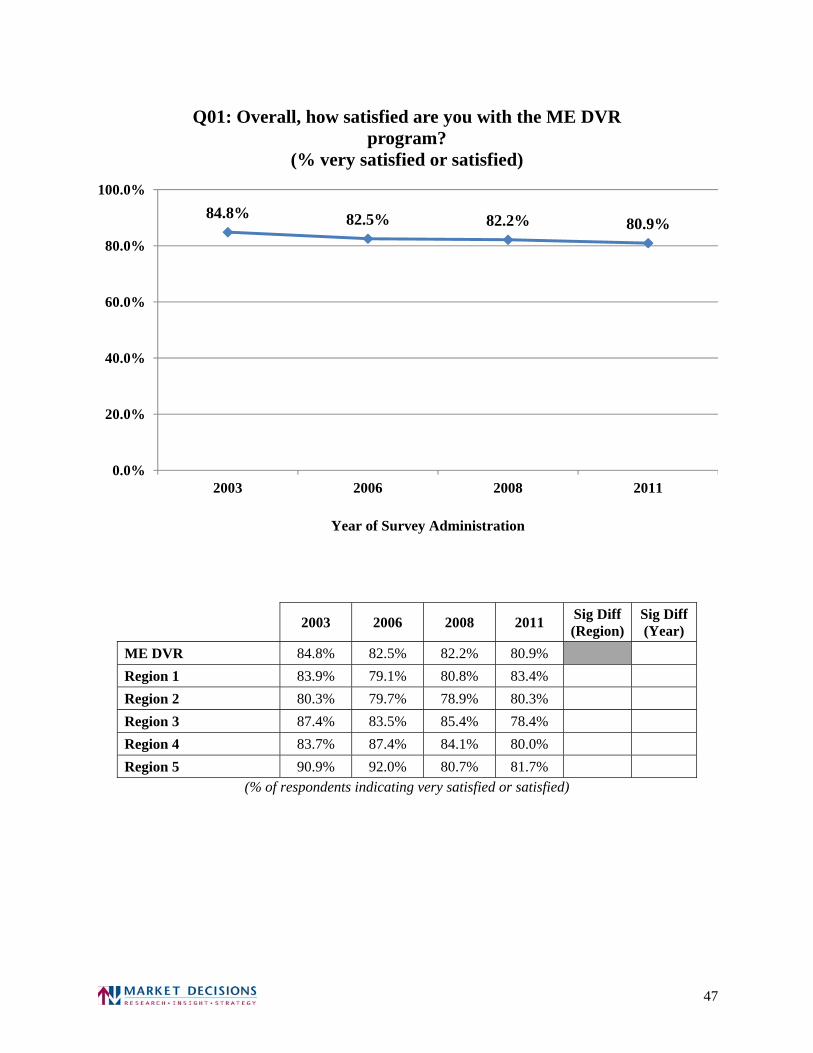
47
2003 2006 2008 2011 Sig Diff (Region)
Sig Diff (Year)
ME DVR 84.8% 82.5% 82.2% 80.9%
Region 1 83.9% 79.1% 80.8% 83.4%
Region 2 80.3% 79.7% 78.9% 80.3%
Region 3 87.4% 83.5% 85.4% 78.4%
Region 4 83.7% 87.4% 84.1% 80.0%
Region 5 90.9% 92.0% 80.7% 81.7% (% of respondents indicating very satisfied or satisfied)
84.8% 82.5% 82.2% 80.9%
0.0%
20.0%
40.0%
60.0%
80.0%
100.0%
2003 2006 2008 2011
Year of Survey Administration
Q01: Overall, how satisfied are you with the ME DVR program?
(% very satisfied or satisfied)

48
Comments: Eighty-one percent of clients were very satisfied or satisfied with the Maine Division of Vocational Rehabilitation’s program, comparable to the percentage in 2008. In 2011, 36% of clients indicated that they were very satisfied with the agency’s program, while 45% were satisfied. Nine percent of clients indicated that they were neither satisfied nor dissatisfied with the agency’s program, while only 10% indicated some level of dissatisfaction (6% dissatisfied and 4% very dissatisfied). Significant Differences by Group:
92% of those with cases closed successfully are satisfied Among the 10% of clients that were not satisfied in 2011:
36% indicated they needed more guidance or support 20% indicated the agency was not very productive or effective 18% indicated services were not provided or much help 16% indicated their counselor did not return calls or follow-up 13% indicated the staff attitude was disrespectful or unprofessional 12% indicated they did not receive employment and the agency could not find them a job
By service region, the main reasons clients were not satisfied were: Region 1:
42% indicated they needed more guidance or support 17% indicated they did not receive employment and the agency could not find them a job 15% indicated services were not provided or much help 14% indicated their counselor did not return calls or follow-up 11% indicated the staff attitude was disrespectful or unprofessional
Region 2:
29% indicated their counselor did not return calls or follow-up 28% indicated the agency was not very productive or effective 19% indicated the staff attitude was disrespectful or unprofessional 17% indicated they needed more guidance or support 17% indicated they used their own resources to get a job or training

49
Region 3:
51% indicated they needed more guidance or support 38% indicated services were not provided or much help 33% indicated the agency was not very productive or effective 14% indicated they did not receive employment and the agency could not find them a job 11% indicated it was hard to reach staff
Region 4:
34% indicated they needed more guidance or support 27% indicated the staff attitude was disrespectful or unprofessional 9% indicated the agency was not very productive or effective 9% indicated they had to change counselors too often
Region 5:
30% indicated the agency was not very productive or effective 29% indicated their counselor did not return calls or follow-up 23% indicated that services and jobs are not accessible or available in their area 17% indicated services were not provided or much help
Q01: Overall, how satisfied are you with the ME DVR program?
Reasons Not Satisfied
ME
DVR Region
1 Region
2 Region
3 Region
4 Region
5
SUPPORT - Need more guidance, support 36% 42% 17% 51% 34% 9%
EFFECTIVE - Agency was not very productive, effective
20% 6% 28% 33% 9% 30%
SUPPORT - No services provided, not much help
18% 15% 8% 38% 6% 17%
COMM - Counselor did not return calls, No follow up
15% 14% 29% 9% 6% 29%
STAFF - Staff attitude, disrespect, unprofessional
13% 11% 19% 4% 27%
WORK - Did not receive employment, Could not find me a job
12% 17% 9% 14% 11%
Results by region for 2011
Note: columns listed as “0%” indicated instances where less than 0.5% gave this response. Blanks represent cases where no client gave this response.

50
Q01: Overall, how satisfied are you with the ME DVR program? Reasons Not Satisfied (continued)
ME
DVR Region
1 Region
2 Region
3 Region
4 Region
5
COMM - Hard to reach staff 8% 6% 9% 11% 6% 8%
EDUCATION - Did not receive needed education, training
6% 8% 12% 3%
EFFECTIVE - Used own resources to get job, training
6% 4% 17% 2%
EXPAND - More info needed, need to broaden programs
4% 7% 7% 2%
STAFF - Changing counselors, switching too much
3% 4% 4% 9%
INFO - Not enough, unaware of available services
3% 8% 5%
SERVICES - Services, jobs not accessible, available in area
3% 4% 2% 2% 23%
COMM - Time lags to get services, appointments
2% 2% 2% 4%
POSITIVE - Commendable efforts, services provided
1% 3% 3%
WORK - Completed testing, training but still no job
1% 3%
EFFECTIVE - Counselor had different goals, direction in mind
1% 3%
Other 11% 17% 6% 9% 3% 50%
None 4% 5% 5% 3%
DK-REF 5% 1% 5% 19%
Total 100% 100% 100% 100% 100% 100%
Results by region for 2011
Note: columns listed as “0%” indicated instances where less than 0.5% gave this response. Blanks represent cases where no client gave this response.

51
In 2011, 83% of clients indicated that they were satisfied with the services they received.
4% 2% 3% 3%7% 5%
10%17% 15%
35%
0%
20%
40%
60%
80%
100%
Not at all
satisfied
2.00 3.00 4.00 5.00 6.00 7.00 8.00 9.00 Very satisfied
Q17: Please rate your satisfaction on a scale from one to ten where 1 is very dissatisfied and 10 means you are very satisfied. How satisfied would you say you are with the
services provided by ME DVR?

52
Q17: Please rate your satisfaction on a scale from one to ten where 1 is very dissatisfied and 10 means you are very satisfied. How satisfied would you say you are with the services
provided by ME DVR?
ME
DVR Region
1 Region
2 Region
3 Region
4 Region
5
Not at all satisfied 4% 3% 5% 1% 6% 6%
2 2% 3% 1% 3%
3 3% 1% 3% 6% 3%
4 3% 3% 3% 2% 4%
5 7% 7% 4% 10% 8% 1%
6 5% 5% 7% 5% 2% 6%
7 10% 10% 13% 8% 6% 11%
8 17% 16% 19% 17% 15% 16%
9 15% 15% 14% 18% 14% 3%
Very satisfied 35% 37% 31% 29% 42% 56%
Total 100% 100% 100% 100% 100% 100%
Results by region for 2011

53
2003 2006 2008 2011 Sig Diff (Region)
Sig Diff (Year)
ME DVR 82.5% 82.0% 82.0% 82.5%
Region 1 80.4% 80.2% 79.7% 83.9%
Region 2 76.3% 78.1% 76.6% 84.7%
Region 3 84.2% 81.0% 86.5% 78.1%
Region 4 86.5% 88.9% 86.4% 79.9%
Region 5 88.3% 91.4% 83.3% 92.6% + (% of respondents rating 6 to 10 on ten-point satisfaction scale)
85.8%82.0% 82.0% 82.5%
0.0%
20.0%
40.0%
60.0%
80.0%
100.0%
2003 2006 2008 2011
Year of Survey Administration
Q17: Please rate your satisfaction on a scale from one to ten where 1 is very dissatisfied and 10 means you are very satisfied. How satisfied would you say you are with the
services provided by ME DVR?(% rating 6 through 10 on 10-point scale)

54
Comments: Clients were asked to evaluate their satisfaction with the services provided by the Maine Division of Vocational Rehabilitation. This evaluation was on a ten-point scale where 1 is very dissatisfied and 10 is very satisfied. Overall, 83% of clients were satisfied with the services provided by the Division, comparable to 2008. Significant Differences by Group:
93% of those with cases closed successfully are satisfied 96% of those whose disability is classified as mental retardation are satisfied
Among the 19% of clients not satisfied (giving a rating of one to five):
20% indicated services were not provided or much help 19% indicated they needed more guidance or support 14% indicated the program did nothing or little to help 13% indicated they did not receive employment and the agency could not find them a job 9% indicated the agency did not meet expectations or help achieve goals
By service region, the main reasons clients were not satisfied were: Region 1:
19% indicated they needed more guidance or support 12% indicated they did not receive employment and the agency could not find them a job 11% indicated services were not provided or much help
Region 2:
40% indicated the program did nothing or little to help 26% indicated services were not provided or much help 17% indicated they did not receive employment and the agency could not find them a job 14% indicated the agency did not meet expectations or help achieve goals 13% indicated there were broken promises and no follow-through
Region 3:
25% indicated they needed more guidance or support 24% indicated services were not provided or much help 13% indicated they did not receive employment and the agency could not find them a job 12% indicated the program did nothing or little to help 11% indicated it was hard to reach staff

55
Region 4:
24% indicated they needed more guidance or support 22% indicated services were not provided or much help 14% indicated the program did nothing or little to help 10% indicated the agency did not meet expectations or help achieve goals 9% indicated they did not receive employment and the agency could not find them a job
Region 5:
27% indicated they did not receive employment and the agency could not find them a job Q17: Please rate your satisfaction on a scale from one to ten where 1 is very dissatisfied and
10 means you are very satisfied. How satisfied would you say you are with the services provided by ME DVR? Reasons Not Satisfied
ME
DVR Region
1 Region
2 Region
3 Region
4 Region
5
SUPPORT - No services provided, not much help
20% 11% 26% 24% 22%
SUPPORT - Need more guidance, support
19% 19% 9% 25% 24%
NEGATIVE - Program did nothing or little to help
14% 40% 12% 14%
WORK - Did not receive employment, Could not find me a job
13% 12% 17% 13% 9% 27%
EFFECTIVE - Not meet expectations, help with goals
9% 4% 14% 9% 10%
COMM - Hard to reach staff 6% 5% 3% 11% 6%
EFFECTIVE - Broken promises, no follow thru
5% 13% 5% 3%
WORK - Help client get a job, more job services, job options
4% 6% 2% 6%
COMM - Counselor did not return calls, No follow up
3% 3% 5% 7%
Results by region for 2011
Note: columns listed as “0%” indicated instances where less than 0.5% gave this response. Blanks represent cases where no client gave this response.

56
Q17: Please rate your satisfaction on a scale from one to ten where 1 is very dissatisfied and 10 means you are very satisfied. How satisfied would you say you are with the services
provided by ME DVR? Reasons Not Satisfied (continued)
ME
DVR Region
1 Region
2 Region
3 Region
4 Region
5
STAFF - Changing counselors, switching too much
3% 5% 2% 3%
POSITIVE - Commendable efforts, services provided
3% 2% 6% 3%
EXPAND - More info needed, need to broaden programs
2% 6% 3%
SUPPORT - Did not achieve goal, working on, need guidance
2% 9%
STAFF - Counselors make more effort, client does work
2% 11%
STAFF - Counselor, agency broke promises
1% 4%
STAFF - Some good, some bad counselors
1% 7%
STAFF - Counselor too busy, pushed aside
1% 4%
WORK - Completed testing, training but still no job
1% 4%
INFO - Not enough, unaware of available services
1% 3%
EFFECTIVE - Counselor had different goals, direction in mind
1% 2%
SERVICES - Services for visually impaired, low vision aids
1% 3%
Other 35% 32% 33% 48% 21% 73%
None 3% 8% 3%
DK-REF 7% 15% 6% 6%
Total 100% 100% 100% 100% 100% 100% Results by region for 2011
Note: columns listed as “0%” indicated instances where less than 0.5% gave this response. Blanks represent
cases where no client gave this response.

57
In 2011, 80% of clients indicated that the services provided met their expectations.
5% 2% 3% 3%7% 6%
10%
18%13%
34%
0%
20%
40%
60%
80%
100%
Met none of expectations
2.00 3.00 4.00 5.00 6.00 7.00 8.00 9.00 Met expectations completely
Q18: Considering all of the expectations you may have had about the services provided by ME DVR, to what extent
have these services met your expectations?

58
Q18: Considering all of the expectations you may have had about the services provided by ME DVR, to what extent have these services met your expectations?
ME
DVR Region
1 Region
2 Region
3 Region
4 Region
5
Met none of expectations 5% 4% 7% 4% 4% 2%
2 2% 1% 1% 6% 2% 3%
3 3% 2% 4% 6% 1%
4 3% 1% 3% 4% 4% 1%
5 7% 6% 9% 9% 6% 3%
6 6% 7% 5% 4% 7% 6%
7 10% 11% 9% 9% 10% 10%
8 18% 16% 24% 17% 14% 16%
9 13% 15% 11% 13% 13% 6%
Met expectations completely 34% 37% 28% 30% 38% 53%
Total 100% 100% 100% 100% 100% 100% Results by region for 2011
Note: columns listed as “0%” indicated instances where less than 0.5% gave this response. Blanks represent
cases where no client gave this response.

59
2003 2006 2008 2011 Sig Diff (Region)
Sig Diff (Year)
ME DVR 78.5% 79.6% 78.5% 80.1%
Region 1 74.8% 75.4% 75.5% 85.8%
Region 2 74.4% 78.2% 70.5% 76.4%
Region 3 81.3% 80.5% 84.0% 72.2%
Region 4 80.8% 84.1% 85.4% 82.0%
Region 5 86.5% 88.1% 84.0% 90.8% + (% of respondents rating 6 to 10 on ten-point expectations scale)
83.2%79.6% 78.5% 80.1%
0.0%
20.0%
40.0%
60.0%
80.0%
100.0%
2003 2006 2008 2011
Year of Survey Administration
Q18: Considering all of the expectations you may have had about the services provided by ME DVR, to what extent have
these services met your expectations?

60
Comments: Clients were asked to evaluate how well the services provided met their expectations. This evaluation was on a ten-point scale where 1 indicates that the services did not at all meet their expectations and 10 indicates that the services met their expectations completely. Overall, 80% of clients indicate that the services provided met their expectations, comparable to 2008. Significant Differences by Group:
91% of those with cases closed successfully indicate program met expectations

61
In 2011, 80% of clients indicated that the services provided through the Maine Division of Vocational Rehabilitation compared favorably to the services offered through their ideal program.
5% 3% 2% 2%8% 5%
11%
18%
10%
35%
0%
20%
40%
60%
80%
100%
Not at all ideal
2.00 3.00 4.00 5.00 6.00 7.00 8.00 9.00 Completely ideal
Q19: Now I want you to think of the ideal program for people in your circumstances. How well do you think the
services you received from ME DVR compared to the services that would be offered by your IDEAL program?

62
Q19: Now I want you to think of the ideal program for people in your circumstances. How well do you think the services you received from ME DVR compared to the services that would be offered
by your IDEAL program?
ME
DVR Region
1 Region
2 Region
3 Region
4 Region
5
Not at all ideal 5% 5% 7% 4% 3% 2%
2 3% 1% 4% 5% 1%
3 2% 1% 1% 3% 2% 3%
4 2% 3% 2% 3% % 2%
5 8% 8% 6% 9% 12% 6%
6 5% 6% 6% 3% 6% 9%
7 11% 9% 11% 13% 12% 9%
8 18% 17% 20% 21% 18% 11%
9 10% 10% 10% 10% 12% 4%
Completely ideal 35% 39% 32% 29% 34% 54%
Total 100% 100% 100% 100% 100% 100% Results by region for 2011
Note: columns listed as “0%” indicated instances where less than 0.5% gave this response. Blanks represent
cases where no client gave this response.

63
2003 2006 2008 2011 Sig Diff (Region)
Sig Diff (Year)
ME DVR 79.7% 78.9% 76.5% 80.1%
Region 1 74.3% 80.8% 70.6% 81.6%
Region 2 75.8% 76.8% 73.5% 79.1%
Region 3 83.7% 73.7% 79.7% 76.2%
Region 4 81.6% 86.3% 86.3% 82.0%
Region 5 86.4% 83.5% 78.9% 86.9% (% of respondents rating 6 to 10 on ten-point ideal program scale)
82.9%78.9% 76.5%
80.1%
0.0%
20.0%
40.0%
60.0%
80.0%
100.0%
2003 2006 2008 2011
Year of Survey Administration
Q19: Now I want you to think of the ideal program for people in your circumstances. How well do you think the services you received from ME DVR compared to the services that
would be offered by your IDEAL program?

64
Comments: Clients were asked to evaluate how well the services provided compared to the services that would be offered through their ideal program. This evaluation was on a ten-point scale where 1 indicates that the services were not at all ideal (did not compare favorably to their ideal program) and 10 indicates that the services were completely ideal (compared very favorably to their ideal program). Overall, 80% of clients indicate that the services provided compared to those offered by their ideal program, comparable to 2008. Significant Differences by Group:
Only 65% of clients aged 25 to 34 indicate program matches their ideal program
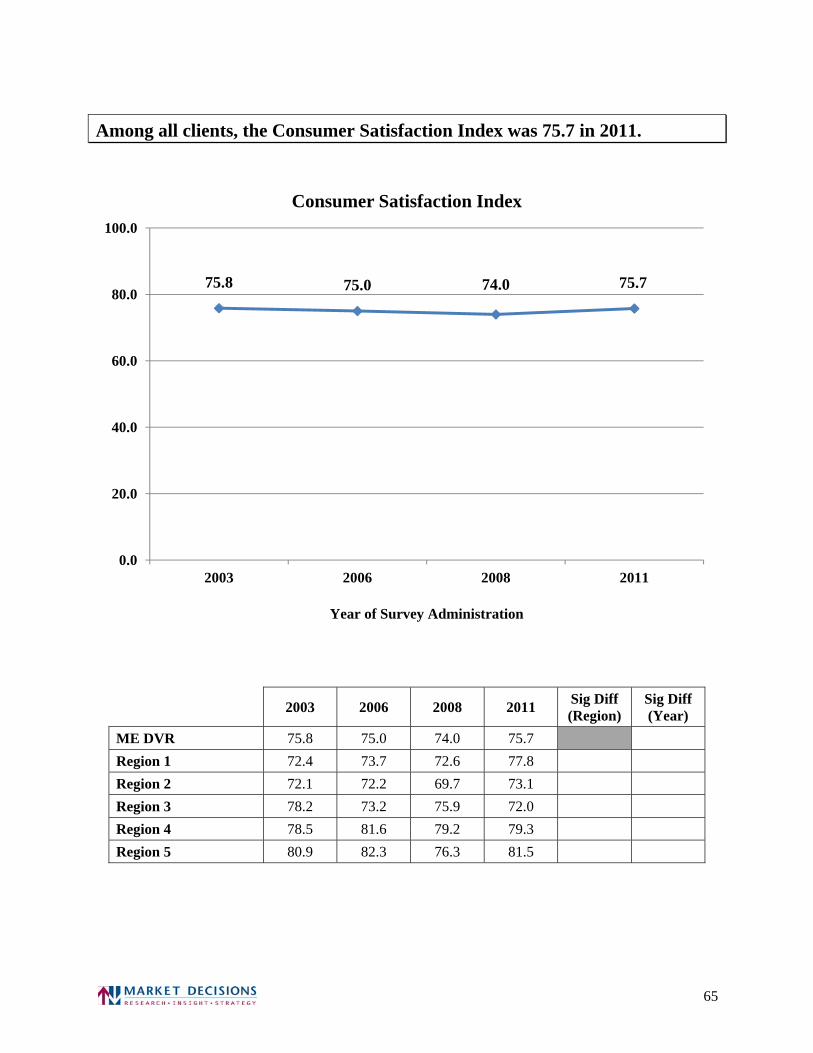
65
Among all clients, the Consumer Satisfaction Index was 75.7 in 2011.
2003 2006 2008 2011 Sig Diff (Region)
Sig Diff (Year)
ME DVR 75.8 75.0 74.0 75.7
Region 1 72.4 73.7 72.6 77.8
Region 2 72.1 72.2 69.7 73.1
Region 3 78.2 73.2 75.9 72.0
Region 4 78.5 81.6 79.2 79.3
Region 5 80.9 82.3 76.3 81.5
75.8 75.0 74.0 75.7
0.0
20.0
40.0
60.0
80.0
100.0
2003 2006 2008 2011
Year of Survey Administration
Consumer Satisfaction Index

66
Comments: The consumer satisfaction index provides an outcome measure of clients’ satisfaction with the agency and the services the agency provides. The index is calculated using three survey questions:
1. Q17: Please rate your satisfaction on a scale from one to ten where 1 is very dissatisfied and 10 means you are very satisfied. How satisfied would you say you are with the services provided by the Maine Division of Vocational Rehabilitation?
2. Q18: Considering all of the expectations you may have had about the services provided
by the Maine Division of Vocational Rehabilitation, to what extent have these services met your expectations?
3. Q19: Now I want you to think of the ideal program for people in your circumstances.
How well do you think the services you received from the Maine Division of Vocational Rehabilitation compared to the services that would be offered by your IDEAL program?
The index is calculated using the following formula:
CSI= (((Q17-1)/9)*100*.334)+ (((Q18-1)/9)*100*.333) + (((Q19-1)/9)*100*.334). This calculation results in an index score with values that can range from 0 to 100. Among all clients, the consumer satisfaction index was 75.7. This is comparable to the index score of 74.0 from 2008.

67
In 2011, 92% percent of clients would tell their friends with similar disabilities to go to the Maine Division of Vocational Rehabilitation for help.
ME
DVR Region
1 Region
2 Region
3 Region
4 Region
5
Yes 92% 91% 93% 92% 93% 99%
No 8% 9% 7% 8% 7% 1%
Total 100% 100% 100% 100% 100% 100% Results by region for 2011
92%
8%
0%
20%
40%
60%
80%
100%
Yes No
Q20: All things considered, would you tell your friends with disabilities to go to ME DVR program for help?

68
2003 2006 2008 2011 Sig Diff (Region)
Sig Diff (Year)
ME DVR 94.4% 93.8% 93.7% 92.1%
Region 1 91.5% 95.3% 94.7% 90.8%
Region 2 94.5% 91.4% 92.9% 92.6%
Region 3 97.9% 92.6% 93.9% 91.7%
Region 4 91.4% 95.2% 92.2% 93.1%
Region 5 97.4% 98.4% 96.7% 99.1% + (% of clients indicating yes)
94.4% 93.8% 93.7% 92.1%
0.0%
20.0%
40.0%
60.0%
80.0%
100.0%
2003 2006 2008 2011
Year of Survey Administration
Q20: All things considered, would you tell your friends with disabilities to go to ME DVR program for help?
(% yes)
69
Comments: In 2011, 92% of clients indicated that they would tell their friends with similar disabilities to go to the Maine Division of Vocational Rehabilitation for help. This is comparable to the percentage in 2008. Significant Differences by Group:
99% of those with cases closed successfully would recommend program

70
Evaluation of Specific Aspects of the Agency and the Services Provided
In 2011, 84% of clients were very satisfied or satisfied with their control and involvement in the vocational rehabilitation experience.
In 2011, 86% of clients were very satisfied or satisfied with their choice of a vocational goal.
In 2011, 83% of clients were very satisfied or satisfied with the choice of services
available.
In 2011, 86% of clients were very satisfied or satisfied with the choice of service providers.
In 2011, 85% of clients were very satisfied or satisfied with the information they
were given about the choices they had.
In 2011, 83% of clients were very satisfied or satisfied with the time it took counselors to answer their questions or to address their concerns.
In 2011, 88%, of clients found completing the application for vocational
rehabilitation services very or somewhat easy.
In 2011, 92% of clients indicated that the staff was very or somewhat helpful in helping to achieve their vocational rehabilitation goals.
In 2011, 85% of clients indicated that it was very or somewhat easy to contact their
vocational rehabilitation counselor.
In 2011, nearly all clients (95%) found the agency office very or somewhat accessible to someone with their type of disability.
In 2011, 64% of clients indicated that the services they received helped them become
more financially independent.
In 2011, 91% of clients indicated that the Maine Division of Vocational Rehabilitation staff treated them with dignity and respect.
In 2011, 66% of clients indicated that the agency helped them reach their job goals.

71
In 2011, 84% of clients were very satisfied or satisfied with their control and involvement in the vocational rehabilitation experience.
ME
DVR Region
1 Region
2 Region
3 Region
4 Region
5
Very dissatisfied 3% 2% 4% 4% 2% 8%
Dissatisfied 6% 6% 6% 7% 7% Neither satisfied nor dissatisfied
6% 8% 4% 5% 10%
Satisfied 42% 41% 51% 36% 40% 30%
Very satisfied 42% 43% 35% 47% 41% 63%
Total 100% 100% 100% 100% 100% 100% Results by region for 2011
3% 6% 6%
42% 42%
0%
20%
40%
60%
80%
100%
Very dissatisfied
Dissatisfied Neither satisfied nor dissatisfied
Satisfied Very satisfied
Q04: How satisfied were you with your control and involvement in your vocational rehabilitation experience?

72
2003 2006 2008 2011 Sig Diff (Region)
Sig Diff (Year)
ME DVR 85.2% 85.3% 84.0% 84.2%
Region 1 83.8% 87.9% 84.2% 84.0%
Region 2 76.2% 82.6% 81.9% 85.9%
Region 3 88.4% 81.8% 84.5% 83.6%
Region 4 87.3% 88.4% 86.4% 81.1%
Region 5 92.5% 92.4% 83.8% 92.3% (% of respondents indicating very satisfied or satisfied)
85.2% 85.3% 84.0% 84.2%
0.0%
20.0%
40.0%
60.0%
80.0%
100.0%
2003 2006 2008 2011
Year of Survey Administration
Q04: How satisfied were you with your control and involvement in your vocational rehabilitation experience?
(% very satisfied or satisfied)

73
Comments: In 2011, 84% of clients were very satisfied or satisfied with their control and involvement in their vocational rehabilitation experience. This is comparable to the percentage in 2008. In 2011, 42% of clients indicated that they were very satisfied with their control and involvement, while 42% were satisfied. Six percent of clients indicated that they were neither satisfied nor dissatisfied with their control and involvement, while only 9% indicated some level of dissatisfaction (6% dissatisfied and 3% very dissatisfied). Significant Differences by Group:
95% of those with cases closed successfully are satisfied 97% of those whose disability is classified as neurological are satisfied 97% of those whose disability is classified as mental retardation are satisfied
Only 52% of those whose disability is classified as deafness are satisfied
Among the 9% of clients that were not satisfied with their control and involvement in the vocational rehabilitation experience:
22% indicated they needed more guidance or support 12% indicated they had no control over the experience and were told what to do 12% indicated services were not provided or much help 11% indicated staff did not listen to client or understand their needs, wants, and abilities
By service region, the main reasons clients were not satisfied were: Region 1:
17% indicated they needed more guidance or support 14% indicated services were not provided or much help 12% indicated they had no control over experience and were told what to do
Region 2:
19% indicated they had no control over experience and were told what to do 17% indicated there was a time lag to get services and appointments 16% indicated they needed more guidance or support 14% indicated staff did not listen to client or understand their needs, wants, and abilities

74
Region 3:
41% indicated they needed more guidance or support 15% indicated they did not receive employment and the agency could not find them a job 14% indicated staff did not listen to client or understand their needs, wants, and abilities 12% indicated their counselor did not return calls or follow-up
Region 4:
20% indicated services were not provided or much help 18% indicated they needed more guidance or support 13% indicated their counselor would not listen or dismissed concerns 12% indicated they had no control over experience and were told what to do 11% indicated the staff attitude was disrespectful or unprofessional
Region 5:
26% indicated they did not receive employment and the agency could not find them a job 23% indicated the staff attitude was disrespectful or unprofessional 23% indicated staff did not listen to client or understand their needs, wants, and abilities 12% indicated their counselor would not listen or dismissed concerns
Q04: How satisfied were you with your control and involvement in your vocational rehabilitation experience?
Reasons Not Satisfied
ME
DVR Region
1 Region
2 Region
3 Region
4 Region
5
SUPPORT - Need more guidance, support 22% 17% 16% 41% 18%
CONTROL - No control over experience, told me what to do
12% 12% 19% 8% 12%
SUPPORT - No services provided, not much help
12% 14% 10% 7% 20%
STAFF - Listen to client, understand needs, wants, ability
11% 7% 14% 14% 9% 23%
COMM - Counselor did not return calls, No follow up
8% 8% 10% 12% 4%
Results by region for 2011
Note: columns listed as “0%” indicated instances where less than 0.5% gave this response. Blanks represent cases where no client gave this response.
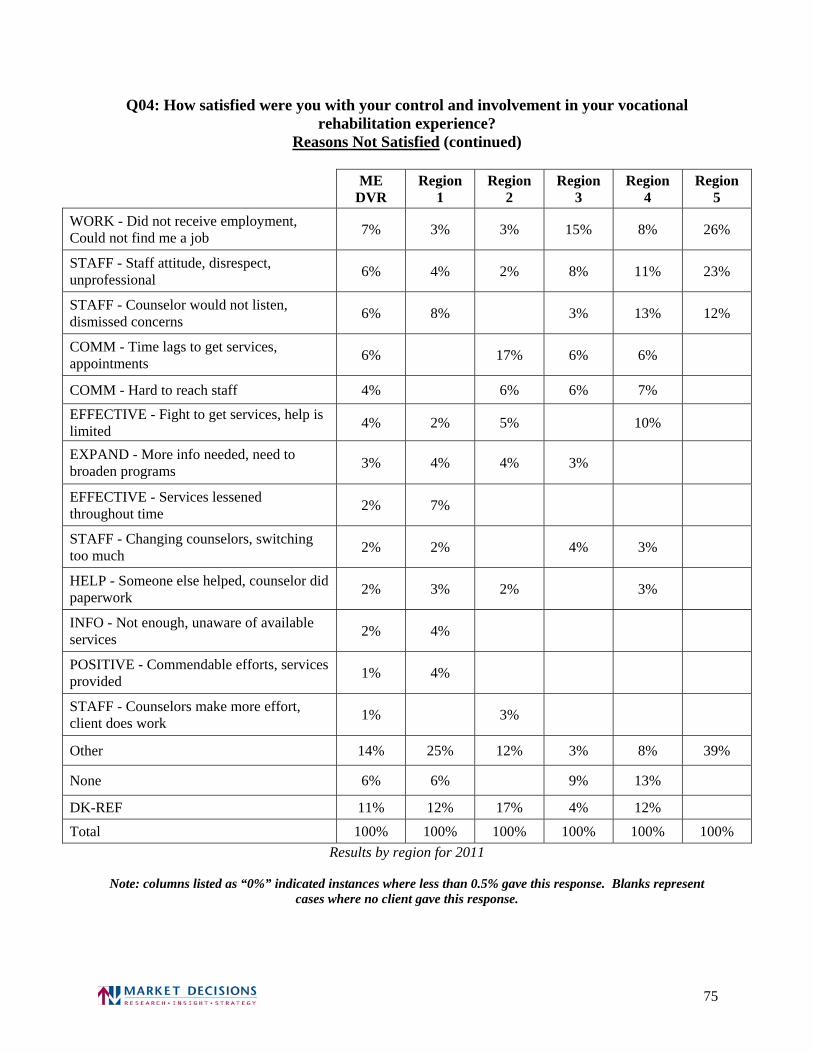
75
Q04: How satisfied were you with your control and involvement in your vocational rehabilitation experience?
Reasons Not Satisfied (continued)
ME
DVR Region
1 Region
2 Region
3 Region
4 Region
5
WORK - Did not receive employment, Could not find me a job
7% 3% 3% 15% 8% 26%
STAFF - Staff attitude, disrespect, unprofessional
6% 4% 2% 8% 11% 23%
STAFF - Counselor would not listen, dismissed concerns
6% 8% 3% 13% 12%
COMM - Time lags to get services, appointments
6% 17% 6% 6%
COMM - Hard to reach staff 4% 6% 6% 7%
EFFECTIVE - Fight to get services, help is limited
4% 2% 5% 10%
EXPAND - More info needed, need to broaden programs
3% 4% 4% 3%
EFFECTIVE - Services lessened throughout time
2% 7%
STAFF - Changing counselors, switching too much
2% 2% 4% 3%
HELP - Someone else helped, counselor did paperwork
2% 3% 2% 3%
INFO - Not enough, unaware of available services
2% 4%
POSITIVE - Commendable efforts, services provided
1% 4%
STAFF - Counselors make more effort, client does work
1% 3%
Other 14% 25% 12% 3% 8% 39%
None 6% 6% 9% 13%
DK-REF 11% 12% 17% 4% 12%
Total 100% 100% 100% 100% 100% 100%
Results by region for 2011
Note: columns listed as “0%” indicated instances where less than 0.5% gave this response. Blanks represent cases where no client gave this response.

76
In 2011, 86% of clients were very satisfied or satisfied with their choice of a vocational goal.
ME
DVR Region
1 Region
2 Region
3 Region
4 Region
5
Very dissatisfied 3% 2% 2% 4% 1% 7%
Dissatisfied 6% 6% 6% 8% 3% 2% Neither satisfied nor dissatisfied
6% 7% 4% 4% 8% 4%
Satisfied 45% 46% 55% 38% 41% 34%
Very satisfied 41% 39% 33% 46% 47% 53%
Total 100% 100% 100% 100% 100% 100% Results by region for 2011
3%6% 6%
45%41%
0%
20%
40%
60%
80%
100%
Very dissatisfied
Dissatisfied Neither satisfied nor dissatisfied
Satisfied Very satisfied
Q05: How satisfied were you with your choice of a vocational goal?

77
2003 2006 2008 2011 Sig Diff (Region)
Sig Diff (Year)
ME DVR 85.7% 86.6% 88.8% 86.0%
Region 1 84.9% 87.1% 91.7% 85.1%
Region 2 78.1% 81.7% 87.4% 88.4%
Region 3 91.9% 86.9% 87.1% 84.2%
Region 4 79.7% 91.0% 89.0% 87.6%
Region 5 92.4% 88.3% 88.2% 86.3% (% of respondents indicating very satisfied or satisfied)
85.7% 86.6% 88.8% 86.0%
0.0%
20.0%
40.0%
60.0%
80.0%
100.0%
2003 2006 2008 2011
Year of Survey Administration
Q05: How satisfied were you with your choice of a vocational goal?
(% very satisfied or satisfied)

78
Comments: In 2008, 86% of clients were very satisfied or satisfied with their choice of a vocational goal. This is comparable to the percentage in 2008. In 2011, 41% of clients indicated that they were very satisfied with the choice of a vocational goal, while 45% were satisfied. Six percent of clients indicated that they were neither satisfied nor dissatisfied with the choice of a vocational goal, while only 9% indicated some level of dissatisfaction (6% dissatisfied and 3% very dissatisfied). Significant Differences by Group:
96% of those whose disability is classified as mental retardation are satisfied Among the 9% of clients that were not satisfied with their choice of a vocational goal:
19% indicated they needed more guidance or support 13% indicated more services are needed to help with career goals 12% indicated services were not provided or much help
By service region, the main reasons clients were not satisfied were: Region 1:
18% indicated more services are needed to help with career goals 16% indicated they needed more guidance or support 8% indicated their counselor would not listen or dismissed concerns 6% indicated they did not receive employment and the agency could not find them a job
Region 2:
12% indicated more services are needed to help with career goals 12% indicated they did not receive needed education or training 12% indicated they had difficulty with the paperwork and forms 10% indicated the training did not match with their interest or ability
Region 3:
34% indicated they needed more guidance or support 33% indicated services were not provided or much help 14% indicated more services are needed to help with career goals

79
Region 4:
17% indicated they needed more guidance or support 11% indicated they did not receive employment and the agency could not find them a job 6% indicated they completed testing and training, but still have no job 5% indicated they did not receive needed education or training
Region 5:
20% indicated they had no control over the experience and were told what to do 14% indicated services were not provided or much help 14% indicated their counselor would not listen or dismissed concerns
Q05: How satisfied were you with your choice of a vocational goal? Reasons Not Satisfied
ME
DVR Region
1 Region
2 Region
3 Region
4 Region
5
SUPPORT - Need more guidance, support 19% 16% 7% 34% 17%
SUPPORT - More services needed to help with career goals
13% 18% 12% 14%
SUPPORT - No services provided, not much help
12% 5% 5% 33% 14%
WORK - Did not receive employment, Could not find me a job
6% 6% 3% 5% 11%
CONTROL - No control over experience, told me what to do
5% 5% 4% 6% 20%
EDUCATION - Did not receive needed education, training
5% 12% 7% 5%
STAFF - Counselor would not listen, dismissed concerns
4% 8% 5% 14%
EFFECTIVE - Training did not match with interest, ability
4% 5% 10%
FORMS - Paper work, difficulty with forms, etc.
2% 12%
INFO - Not enough, unaware of available services
2% 4% 4%
POSITIVE - They are helping me 2% 5%
Results by region for 2011
Note: columns listed as “0%” indicated instances where less than 0.5% gave this response. Blanks represent cases where no client gave this response.

80
Q05: How satisfied were you with your choice of a vocational goal?
Reasons Not Satisfied (continued)
ME
DVR Region
1 Region
2 Region
3 Region
4 Region
5
WORK - Completed testing, training but still no job
2% 5% 6%
POSITIVE - Commendable efforts, services provided
1% 4%
EFFECTIVE - No goal set 1% 7%
STAFF - Did not listen to my needs 1% 4%
EFFECTIVE - Didn't establish any job goals
1% 6%
SERVICES - Services for hearing impaired 1% 3%
SERVICES - Services for visually impaired, low vision aids
1% 3%
NEGATIVE - Dissatisfied with services and counselor
1% 3%
EFFECTIVE - Counselor had different goals, direction in mind
1% 3%
EDUCATION - Need training 1% 6%
CONTROL - Felt pushed to do job, not what was wanted
1% 3%
EFFECTIVE - No help, very little help 1% 5%
Other 59% 64% 72% 41% 61% 73%
None 6% 7% 12% 14%
DK-REF 3% 2% 18%
Total 100% 100% 100% 100% 100% 100%
Results by region for 2011
Note: columns listed as “0%” indicated instances where less than 0.5% gave this response. Blanks represent cases where no client gave this response.

81
In 2011, 83% of clients were very satisfied or satisfied with the choice of services available.
ME
DVR Region
1 Region
2 Region
3 Region
4 Region
5
Very dissatisfied 2% 2% 2% 3% 2% 2%
Dissatisfied 7% 7% 7% 7% 7%
Neither satisfied nor dissatisfied 8% 7% 5% 11% 8% 8%
Satisfied 47% 47% 57% 41% 45% 34%
Very satisfied 36% 37% 27% 39% 39% 56%
Total 100% 100% 100% 100% 100% 100% Results by region for 2011
2%7% 8%
47%
36%
0%
20%
40%
60%
80%
100%
Very dissatisfied
Dissatisfied Neither satisfied nor dissatisfied
Satisfied Very satisfied
Q06: How satisfied were you with the choice of services that were available?

82
2003 2006 2008 2011 Sig Diff (Region)
Sig Diff (Year)
ME DVR 85.7% 85.4% 84.8% 83.1%
Region 1 84.0% 85.4% 85.5% 83.4%
Region 2 80.0% 84.6% 85.6% 84.8%
Region 3 87.0% 84.3% 83.3% 79.4%
Region 4 88.6% 87.2% 84.5% 83.5%
Region 5 93.8% 90.5% 86.2% 89.8% (% of respondents indicating very satisfied or satisfied)
85.7% 85.4% 84.8% 83.1%
0.0%
20.0%
40.0%
60.0%
80.0%
100.0%
2003 2006 2008 2011
Year of Survey Administration
Q06: How satisfied were you with the choice of services that were available?
(% very satisfied or satisfied)
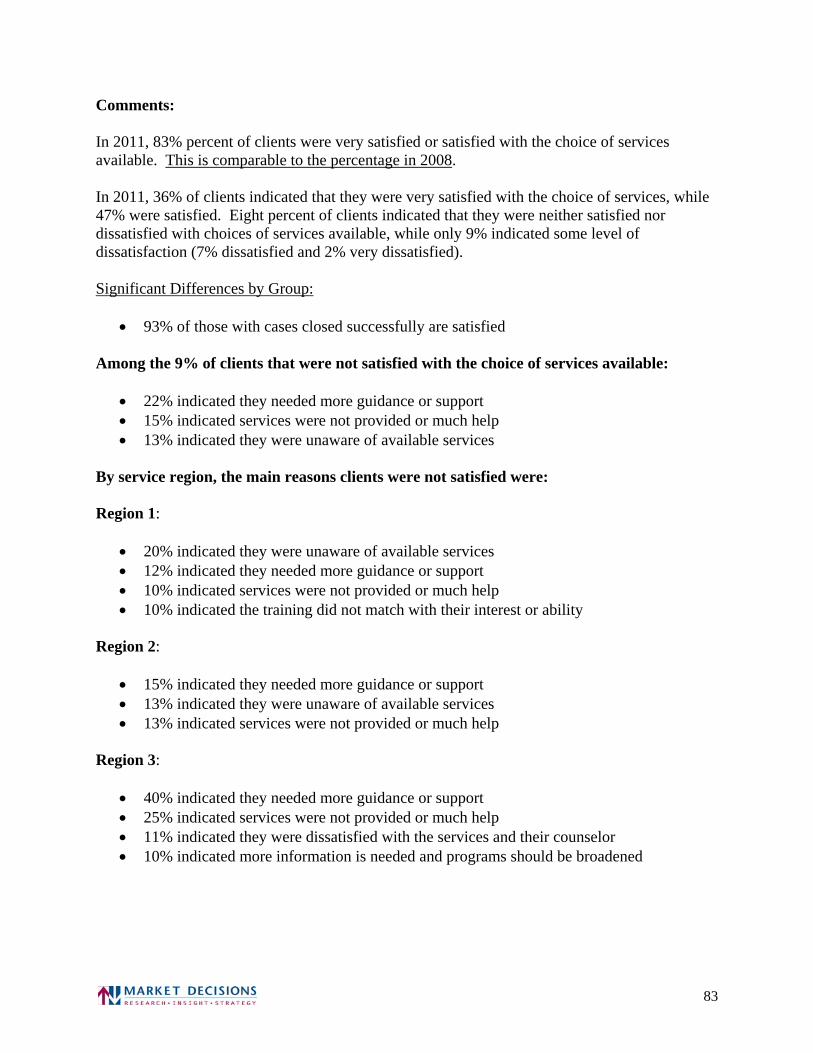
83
Comments: In 2011, 83% percent of clients were very satisfied or satisfied with the choice of services available. This is comparable to the percentage in 2008. In 2011, 36% of clients indicated that they were very satisfied with the choice of services, while 47% were satisfied. Eight percent of clients indicated that they were neither satisfied nor dissatisfied with choices of services available, while only 9% indicated some level of dissatisfaction (7% dissatisfied and 2% very dissatisfied). Significant Differences by Group:
93% of those with cases closed successfully are satisfied Among the 9% of clients that were not satisfied with the choice of services available:
22% indicated they needed more guidance or support 15% indicated services were not provided or much help 13% indicated they were unaware of available services
By service region, the main reasons clients were not satisfied were: Region 1:
20% indicated they were unaware of available services 12% indicated they needed more guidance or support 10% indicated services were not provided or much help 10% indicated the training did not match with their interest or ability
Region 2:
15% indicated they needed more guidance or support 13% indicated they were unaware of available services 13% indicated services were not provided or much help
Region 3:
40% indicated they needed more guidance or support 25% indicated services were not provided or much help 11% indicated they were dissatisfied with the services and their counselor 10% indicated more information is needed and programs should be broadened

84
Region 4: 23% indicated they needed more guidance or support 17% indicated they were unaware of available services 15% indicated that they were denied services or stopped services due to lack of funding 13% indicated services were not provided or much help 10% indicated they did not receive needed education or training
Region 5:
16% indicated they were unaware of available services 13% indicated they needed more guidance or support 11% indicated more information is needed and programs should be broadened 9% indicated they had no control over the experience and were told what to do
Q06: How satisfied were you with the choice of services that were available?
Reasons Not Satisfied
ME
DVR Region
1 Region
2 Region
3 Region
4 Region
5
SUPPORT - Need more guidance, support 22% 12% 15% 40% 23% 13%
SUPPORT - No services provided, not much help
15% 10% 13% 25% 13%
INFO - Not enough, unaware of available services
13% 20% 13% 3% 17% 16%
NEGATIVE - Dissatisfied with services and counselor
7% 8% 8% 11%
EFFECTIVE - Training did not match with interest, ability
6% 10% 6% 4%
EXPAND - More info needed, need to broaden programs
6% 4% 7% 10% 11%
WORK - Did not receive employment, Could not find me a job
5% 5% 4% 9%
EDUCATION - Did not receive needed education, training
4% 3% 6% 10%
EFFECTIVE - Agency was not very productive, effective
2% 4% 8%
Results by region for 2011
Note: columns listed as “0%” indicated instances where less than 0.5% gave this response. Blanks represent cases where no client gave this response.

85
Q06: How satisfied were you with the choice of services that were available?
Reasons Not Satisfied (continued)
ME
DVR Region
1 Region
2 Region
3 Region
4 Region
5
EXPAND - Denied, stopped services due to lack of funding
2% 15%
EFFECTIVE - Client felt misunderstood 2% 5%
COMM - Counselor did not return calls, No follow up
2% 8%
STAFF - Changing counselors, switching too much
1% 9%
WORK - Completed testing, training but still no job
1% 8%
EFFECTIVE - Did not receive much help with goal
1% 3%
COMM - Hard to reach staff 1% 3%
TRANS - Transportation issue 1% 3%
EFFECTIVE - Did most of job hunting, research on own
1% 5%
CONTROL - No control over experience, told me what to do
0% 9%
Other 45% 43% 64% 32% 43% 61%
None 6% 10% 9%
DK-REF 3% 3% 1% 6%
Total 100% 100% 100% 100% 100% 100%
Results by region for 2011
Note: columns listed as “0%” indicated instances where less than 0.5% gave this response. Blanks represent cases where no client gave this response.

86
In 2011, 86% of clients were very satisfied or satisfied with the choice of service providers.
ME
DVR Region
1 Region
2 Region
3 Region
4 Region
5
Very dissatisfied 3% 1% 3% 4% 3% 5%
Dissatisfied 6% 6% 9% 5% 5%
Neither satisfied nor dissatisfied 6% 5% 5% 6% 6% 7%
Satisfied 40% 37% 48% 41% 38% 31%
Very satisfied 45% 51% 35% 44% 49% 57%
Total 100% 100% 100% 100% 100% 100% Results by region for 2011
3%6% 6%
40%45%
0%
20%
40%
60%
80%
100%
Very dissatisfied
Dissatisfied Neither satisfied nor dissatisfied
Satisfied Very satisfied
Q07: How satisfied were you with the choice of service providers?

87
2003 2006 2008 2011 Sig Diff (Region)
Sig Diff (Year)
ME DVR 85.5% 83.1% 85.5% 85.8%
Region 1 81.9% 80.9% 89.8% 87.6%
Region 2 78.7% 85.5% 83.6% 83.4%
Region 3 91.2% 80.6% 82.6% 84.8%
Region 4 84.6% 87.2% 86.1% 86.3%
Region 5 92.5% 88.0% 84.8% 87.4% (% of respondents indicating very satisfied or satisfied)
85.5% 83.1% 85.5% 85.8%
0.0%
20.0%
40.0%
60.0%
80.0%
100.0%
2003 2006 2008 2011
Year of Survey Administration
Q07: How satisfied were you with the choice of service providers?
(% very satisfied or satisfied)

88
Comments: In 2011, 86% of clients were very satisfied or satisfied with the choice of service providers. This is comparable to the percentage in 2008. In 2011, 45% of clients indicated that they were very satisfied with the choice of service providers, while 40% were satisfied. Six percent of clients indicated that they were neither satisfied nor dissatisfied with choices of service providers available, while only 9% indicated some level of dissatisfaction (6% dissatisfied and 3% very dissatisfied). Significant Differences by Group:
95% of those with cases closed successfully are satisfied 95% of those whose disability is classified as mental retardation are satisfied
Among the 9% of clients that were not satisfied with the choice of service providers:
23% indicated they needed more guidance or support 13% indicated services were not provided or much help 9% indicated they were dissatisfied with services and their counselor 8% indicated they were unaware of available services
By service region, the main reasons clients were not satisfied were: Region 1:
9% indicated they had to fight to get services and that help is limited 8% indicated they needed more guidance or support 8% indicated they had to switch counselors too often 8% indicated that despite dissatisfaction, the agency made commendable efforts
Region 2:
18% indicated they were unaware of available services 12% indicated they needed more guidance or support 12% indicated their counselor did not return calls or follow-up
Region 3:
48% indicated they needed more guidance or support 39% indicated services were not provided or much help 12% indicated they were dissatisfied with services and their counselor 12% indicated the staff attitude was disrespectful or unprofessional

89
Region 4:
30% indicated they needed more guidance or support 15% indicated the counselor would not listen or dismissed concerns 13% indicated they were dissatisfied with services and their counselor
Region 5:
40% indicated they needed more guidance or support 26% indicated services were not provided or much help 26% indicated they had to switch counselors too often 18% indicated that despite dissatisfaction, the agency made commendable efforts 17% indicated they did not receive employment and the agency could not find them a job 14% indicated the counselor would not listen or dismissed concerns
Q07: How satisfied were you with the choice of service providers? Reasons Not Satisfied
ME
DVR Region
1 Region
2 Region
3 Region
4 Region
5
SUPPORT - Need more guidance, support 23% 8% 12% 48% 30% 40%
SUPPORT - No services provided, not much help
13% 6% 39% 5% 26%
NEGATIVE - Dissatisfied with services and counselor
9% 7% 9% 12% 13%
INFO - Not enough, unaware of available services
8% 18% 9% 4%
STAFF - Staff attitude, disrespect, unprofessional
5% 9% 12%
STAFF - Counselor would not listen, dismissed concerns
5% 6% 3% 15% 14%
STAFF - Changing counselors, switching too much
5% 8% 5% 26%
POSITIVE - Commendable efforts, services provided
5% 8% 4% 5% 18%
Results by region for 2011
Note: columns listed as “0%” indicated instances where less than 0.5% gave this response. Blanks represent cases where no client gave this response.

90
Q07: How satisfied were you with the choice of service providers?
Reasons Not Satisfied (continued)
ME
DVR Region
1 Region
2 Region
3 Region
4 Region
5
COMM - Hard to reach staff 4% 6% 5% 5%
EFFECTIVE - Fight to get services, help is limited
3% 9% 5%
COMM - Counselor did not return calls, No follow up
3% 12%
EXPAND - More info needed, need to broaden programs
3% 5% 4%
STAFF - More counselors, staff, counselors are overworked
2% 9%
STAFF - Counselor too busy, pushed aside 2% 5% 5%
WORK - Did not receive employment, Could not find me a job
2% 6% 17%
WORK - Completed testing, training but still no job
1% 4%
STAFF - No cooperation, no help 1% 4%
Other 44% 58% 40% 30% 39% 57%
None 6% 7% 9% 4%
DK-REF 2% 1% 9%
Total 100% 100% 100% 100% 100% 100%
Results by region for 2011
Note: columns listed as “0%” indicated instances where less than 0.5% gave this response. Blanks represent cases where no client gave this response.

91
In 2011, 85% of clients were very satisfied or satisfied with the information they were given about the choices they had.
ME
DVR Region
1 Region
2 Region
3 Region
4 Region
5
Very dissatisfied 3% 3% 4% 3% 3% 2%
Dissatisfied 5% 6% 6% 7% 3% 3%
Neither satisfied nor dissatisfied 6% 3% 4% 12% 9% 4%
Satisfied 48% 49% 54% 45% 39% 41%
Very satisfied 37% 39% 32% 34% 46% 50%
Total 100% 100% 100% 100% 100% 100% Results by region for 2011
3% 5% 6%
48%
37%
0%
20%
40%
60%
80%
100%
Very dissatisfied
Dissatisfied Neither satisfied nor dissatisfied
Satisfied Very satisfied
Q08: How satisfied were you with the kind and amount of information you were given about the choices you had?

92
2003 2006 2008 2011 Sig Diff (Region)
Sig Diff (Year)
ME DVR 82.8% 83.2% 85.2% 85.2%
Region 1 82.4% 81.1% 89.1% 88.0%
Region 2 74.5% 81.1% 77.6% 86.2%
Region 3 83.6% 84.2% 87.3% 78.9%
Region 4 87.8% 86.7% 86.9% 85.1%
Region 5 90.6% 86.1% 81.6% 91.0% (% of respondents indicating very satisfied or satisfied)
82.8% 83.2% 85.2% 85.2%
0.0%
20.0%
40.0%
60.0%
80.0%
100.0%
2003 2006 2008 2011
Year of Survey Administration
Q08: How satisfied were you with the kind and amount of information you were given about the choices you had?
(% very satisfied or satisfied)

93
Comments: In 2011, 85% of clients were very satisfied or satisfied with the information they were provided about their choices. This is comparable to the percentage in 2008. In 2011, 37% of clients indicated that they were very satisfied with the information provided, while 48% were satisfied. Six percent of clients indicated that they were neither satisfied nor dissatisfied with the information provided, while only 8% indicated some level of dissatisfaction (5% dissatisfied and 3% very dissatisfied). Significant Differences by Group:
96% of clients age 65 and older are satisfied 96% of those whose disability is classified as mental retardation are satisfied
Among the 8% of clients that were not satisfied with the information they were provided about their choices:
24% indicated they needed more guidance or support 12% indicated they were unaware of available services 9% indicated services were not provided or much help 9% indicated more information is needed and programs should be broadened
By service region, the main reasons clients were not satisfied were: Region 1:
16% indicated they needed more guidance or support 11% indicated they were unaware of employment choices 10% indicated they were unaware of available services 10% indicated more information is needed and programs should be broadened
Region 2:
19% indicated they needed more guidance or support 16% indicated they were unaware of available services 11% indicated more information is needed and programs should be broadened 8% indicated services were not provided or much help
Region 3:
34% indicated they needed more guidance or support 13% indicated services were not provided or much help 8% indicated they were unaware of employment choices 8% indicated staff did not listen to client or understand their needs, wants, and abilities

94
Region 4:
31% indicated they needed more guidance or support 22% indicated they were unaware of available services 14% indicated staff did not listen to client or understand their needs, wants, and abilities 13% indicated services were not provided or much help 13% indicated more information is needed and programs should be broadened 13% indicated the staff was hard to reach
Region 5:
19% indicated they were unaware of available services 10% indicated they needed more guidance or support 10% indicated more information is needed and programs should be broadened
Q08: How satisfied were you with the kind and amount of information you were given about the choices you had?
Reasons Not Satisfied
ME
DVR Region
1 Region
2 Region
3 Region
4 Region
5
SUPPORT - Need more guidance, support 24% 16% 19% 34% 31% 10%
INFO - Not enough, unaware of available services
12% 10% 16% 7% 22% 19%
SUPPORT - No services provided, not much help
9% 6% 8% 13% 13%
EXPAND - More info needed, need to broaden programs
9% 10% 11% 4% 13% 10%
INFO - Not enough, unaware of employment choices
7% 11% 3% 8% 5%
STAFF - Listen to client, understand needs, wants, ability
6% 5% 8% 14%
COMM - Hard to reach staff 3% 2% 13%
STAFF - Changing counselors, switching too much
3% 5% 3% 4%
STAFF - Counselor was not helpful, supportive
2% 8%
Results by region for 2011
Note: columns listed as “0%” indicated instances where less than 0.5% gave this response. Blanks represent cases where no client gave this response.

95
Q08: How satisfied were you with the kind and amount of information you were given
about the choices you had? Reasons Not Satisfied (continued)
ME
DVR Region
1 Region
2 Region
3 Region
4 Region
5
WORK - Did not receive employment, Could not find me a job
2% 3% 4%
NEGATIVE - Dissatisfied with services and counselor
2% 3% 5%
EFFECTIVE - Training did not match with interest, ability
2% 3% 11%
POSITIVE - Commendable efforts, services provided
2% 3% 3%
EFFECTIVE - No help, very little help 2% 6%
EFFECTIVE - Did most of job hunting, research on own
2% 5%
EFFECTIVE - Broken promises, no follow thru
1% 5%
COMM - Counselor did not return calls, No follow up
1% 5%
STAFF - Some good, some bad counselors 1% 3%
Other 51% 68% 58% 36% 37% 81%
None 3% 3% 5%
DK-REF 2% 3% 3% 5%
Total 100% 100% 100% 100% 100% 100%
Results by region for 2011
Note: columns listed as “0%” indicated instances where less than 0.5% gave this response. Blanks represent cases where no client gave this response.

96
In 2011, 83% of clients were very satisfied or satisfied with the time it took counselors to answer their questions or to address their concerns.
ME
DVR Region
1 Region
2 Region
3 Region
4 Region
5
Very dissatisfied 4% 4% 7% 4% 2% 1%
Dissatisfied 7% 5% 9% 8% 9% 1%
Neither satisfied nor dissatisfied 5% 6% 4% 5% 7% 7%
Satisfied 39% 38% 49% 34% 33% 34%
Very satisfied 44% 46% 31% 50% 50% 56%
Total 100% 100% 100% 100% 100% 100% Results by region for 2011
4%7% 5%
39%44%
0%
20%
40%
60%
80%
100%
Very dissatisfied
Dissatisfied Neither satisfied nor dissatisfied
Satisfied Very satisfied
Q09: How satisfied were you with how long it took your counselor to answer your questions or address your
concerns?

97
2003 2006 2008 2011 Sig Diff (Region)
Sig Diff (Year)
ME DVR 85.9% 84.6% 82.6% 83.3%
Region 1 84.4% 83.1% 82.9% 84.7%
Region 2 78.0% 79.1% 75.2% 80.0%
Region 3 89.1% 85.5% 82.7% 83.5%
Region 4 87.2% 90.8% 92.3% 82.6%
Region 5 93.1% 88.9% 86.9% 90.9% (% of respondents indicating very satisfied or satisfied)
85.9% 84.6% 82.6% 83.3%
0.0%
20.0%
40.0%
60.0%
80.0%
100.0%
2003 2006 2008 2011
Year of Survey Administration
Q09: How satisfied were you with how long it took your counselor to answer your questions or address your
concerns?(% very satisfied or satisfied)

98
Comments: In 2011, 83% percent of clients were very satisfied or satisfied with how long it took their counselor to answer their questions or address their concerns. This is comparable to the percentage in 2008. In 2011, 44% of clients indicated that they were very satisfied with how long it took their counselor to answer questions or address concerns, while 39% were satisfied. Five percent of clients indicated that they were neither satisfied nor dissatisfied with how long it took their counselor to answer questions or address concerns, while only 11% indicated some level of dissatisfaction (7% dissatisfied and 4% very dissatisfied). Significant Differences by Group:
94% of those with cases closed successfully are satisfied
Only 62% of those whose disability is classified as orthopedic are satisfied Among the 11% of clients that were not satisfied with how long it took their counselor to answer their questions or to address their concerns:
24% indicated their counselor did not return calls or follow-up 19% indicated they needed more guidance or support 15% indicated there was a time lag to get services and appointments 11% indicated the staff was hard to reach 10% indicated services were not provided or much help
By service region, the main reasons clients were not satisfied were: Region 1:
21% indicated they needed more guidance or support 18% indicated there was a time lag to get services and appointments 13% indicated their counselor did not return calls or follow-up 12% indicated their counselor was too busy and they felt pushed aside
Region 2:
33% indicated their counselor did not return calls or follow-up 22% indicated they needed more guidance or support 15% indicated the staff was hard to reach 12% indicated there was a time lag to get services and appointments 11% indicated their counselor would not listen or dismissed concerns 10% indicated their counselor was too busy and they felt pushed aside

99
Region 3:
37% indicated their counselor did not return calls or follow-up 23% indicated they needed more guidance or support 20% indicated there was a time lag to get services and appointments 17% indicated services were not provided or much help 16% indicated the staff was hard to reach 13% indicated they had to switch counselors too often
Region 4:
31% indicated their counselor would not listen or dismissed concerns 15% indicated their counselor did not return calls or follow-up 15% indicated the staff was hard to reach 13% indicated services were not provided or much help 12% indicated their counselor was too busy and they felt pushed aside
Region 5:
11% indicated there was a time lag to get services and appointments 10% indicated their counselor did not return calls or follow-up
Q09: How satisfied were you with how long it took your counselor to answer your questions
or address your concerns? Reasons Not Satisfied
ME
DVR Region
1 Region
2 Region
3 Region
4 Region
5
COMM - Counselor did not return calls, No follow up
24% 13% 33% 37% 15% 10%
SUPPORT - Need more guidance, support 19% 21% 22% 23% 4%
COMM - Time lags to get services, appointments
15% 18% 12% 20% 4% 11%
COMM - Hard to reach staff 11% 3% 15% 16% 15%
SUPPORT - No services provided, not much help
10% 7% 8% 17% 13%
Results by region for 2011
Note: columns listed as “0%” indicated instances where less than 0.5% gave this response. Blanks represent cases where no client gave this response.

100
Q09: How satisfied were you with how long it took your counselor to answer your questions or address your concerns?
Reasons Not Satisfied (continued)
ME
DVR Region
1 Region
2 Region
3 Region
4 Region
5
STAFF - Counselor too busy, pushed aside 9% 12% 10% 3% 12%
STAFF - Counselor would not listen, dismissed concerns
8% 11% 31%
STAFF - Changing counselors, switching too much
6% 3% 7% 13%
EFFECTIVE - Broken promises, no follow thru
3% 4% 3% 4%
NEGATIVE - Dissatisfied with services and counselor
3% 3% 4% 3%
EXPAND - More info needed, need to broaden programs
3% 4% 5%
COMM - Hard to reach, hard to get a hold of
2% 7%
POSITIVE - Commendable efforts, services provided
2% 7%
STAFF - Counselors make more effort, client does work
2% 8%
NOT ELIGIBLE - Denied assistance 1% 4%
NEGATIVE - Program did nothing or little to help
1% 4%
EFFECTIVE - No clear purpose, solutions, answers
1% 3%
STAFF - Some good, some bad counselors 1% 2%
WORK - Completed testing, training but still no job
1% 1% 15%
WORK - Did not receive employment, Could not find me a job
1% 3%
Other 1% 2% 13%
None 1% 3%
DK-REF 1% 4%
Total 40% 54% 31% 32% 36% 56%
Results by region for 2011 Note: columns listed as “0%” indicated instances where less than 0.5% gave this response. Blanks represent
cases where no client gave this response.

101
In 2011, 88%, of clients found completing the application for vocational rehabilitation services very or somewhat easy.
ME
DVR Region
1 Region
2 Region
3 Region
4 Region
5
Very difficult 3% 4% 2% 4% 1% 1%
Somewhat difficult 9% 8% 15% 2% 11% 4%
Somewhat easy 25% 19% 31% 27% 25% 23%
Very easy 64% 69% 51% 67% 63% 71%
Total 100% 100% 100% 100% 100% 100% Results by region for 2011
3%9%
25%
64%
0%
20%
40%
60%
80%
100%
Very difficult Somewhat difficult Somewhat easy Very easy
Q10: How easy was it for you to complete an application for vocational rehabilitation services?

102
2003 2006 2008 2011 Sig Diff (Region)
Sig Diff (Year)
ME DVR 89.7% 88.6% 89.0% 88.2%
Region 1 90.2% 88.4% 86.9% 88.0%
Region 2 89.0% 84.7% 90.4% 82.6%
Region 3 89.0% 89.3% 89.5% 93.4%
Region 4 88.9% 91.2% 90.6% 88.0%
Region 5 96.2% 93.5% 85.6% 94.3% (% of respondents indicating very easy or somewhat easy)
89.7% 88.6% 89.0% 88.2%
0.0%
20.0%
40.0%
60.0%
80.0%
100.0%
2003 2006 2008 2011
Year of Survey Administration
Q10: How easy was it for you to complete an application for vocational rehabilitation services?
(% very or somewhat easy)

103
Comments: In 2011, 88% of clients found the process of completing the application for vocational rehabilitation services very or somewhat easy. This is comparable to the percentage in 2008. In 2011, 64% of clients indicated that completing the application was very easy, while 25% indicated it was somewhat easy. Only 12% indicated that completing the application for vocational rehabilitation services was difficult (9% somewhat difficult and 3% very difficult). Significant Differences by Group:
95% of clients aged 55 to 64 indicate is was easy 97% of those whose disability is classified traumatic brain injury indicate is was easy
Among the 12% of clients that indicated that completing the application for vocational rehabilitation services was somewhat or very difficult:
14% had trouble filling out the forms and required help 13% had trouble understanding terms or the language 13% indicated there was too much paperwork 10% had trouble reading and/or writing
By service region, the main reasons cited for why completing the application for vocational rehabilitation services was difficult were: Region 1:
14% had trouble filling out the forms and required help 14% indicated there was too much paperwork 13% had trouble understanding terms or the language 10% indicated someone else helped with the forms or the counselor did the paperwork
Region 2:
18% indicated there was too much paperwork 16% indicated that some questions had to be explained 14% had trouble filling out the forms and required help 11% had trouble understanding terms or the language
Region 3:
15% had trouble understanding terms or the language 15% had trouble because of their disability 11% indicated there was too much paperwork 10% had trouble reading and/or writing
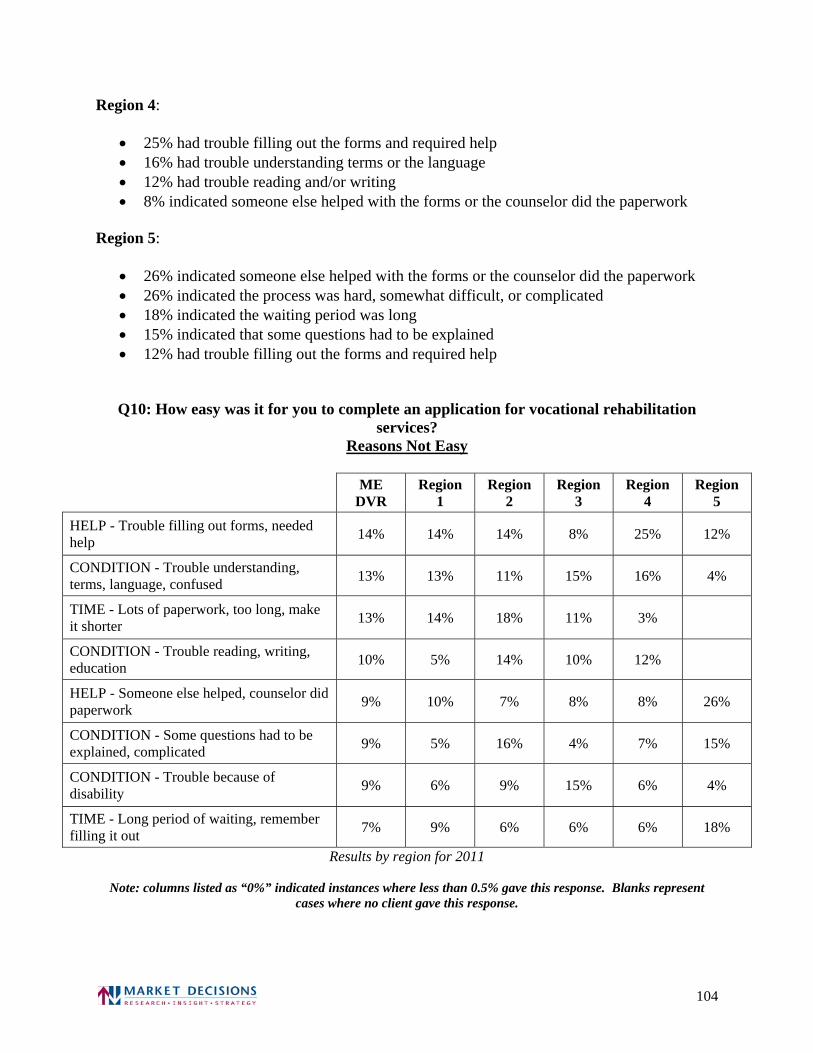
104
Region 4:
25% had trouble filling out the forms and required help 16% had trouble understanding terms or the language 12% had trouble reading and/or writing 8% indicated someone else helped with the forms or the counselor did the paperwork
Region 5:
26% indicated someone else helped with the forms or the counselor did the paperwork 26% indicated the process was hard, somewhat difficult, or complicated 18% indicated the waiting period was long 15% indicated that some questions had to be explained 12% had trouble filling out the forms and required help
Q10: How easy was it for you to complete an application for vocational rehabilitation services?
Reasons Not Easy
ME
DVR Region
1 Region
2 Region
3 Region
4 Region
5
HELP - Trouble filling out forms, needed help
14% 14% 14% 8% 25% 12%
CONDITION - Trouble understanding, terms, language, confused
13% 13% 11% 15% 16% 4%
TIME - Lots of paperwork, too long, make it shorter
13% 14% 18% 11% 3%
CONDITION - Trouble reading, writing, education
10% 5% 14% 10% 12%
HELP - Someone else helped, counselor did paperwork
9% 10% 7% 8% 8% 26%
CONDITION - Some questions had to be explained, complicated
9% 5% 16% 4% 7% 15%
CONDITION - Trouble because of disability
9% 6% 9% 15% 6% 4%
TIME - Long period of waiting, remember filling it out
7% 9% 6% 6% 6% 18%
Results by region for 2011
Note: columns listed as “0%” indicated instances where less than 0.5% gave this response. Blanks represent cases where no client gave this response.

105
Q10: How easy was it for you to complete an application for vocational rehabilitation
services? Reasons Not Easy (continued)
ME
DVR Region
1 Region
2 Region
3 Region
4 Region
5
HARD - Directions, questions could have been clearer
6% 8% 6% 2% 7% 6%
HARD - Hard, Somewhat difficult, complicated
6% 5% 6% 6% 5% 26%
HARD - Having to find info, too much info 4% 8% 3% 2% 2%
CONDITION - Eyesight 2% 4% 4%
STAFF - No cooperation, no help 2% 2% 7%
Other 7% 3% 11% 8% 7%
None 10% 12% 4% 21% 3% 5%
DK-REF 9% 10% 9% 7% 7% 5%
Total 100% 100% 100% 100% 100% 100% Results by region for 2011
Note: columns listed as “0%” indicated instances where less than 0.5% gave this response. Blanks represent
cases where no client gave this response.

106
In 2011, 92% of clients indicated that the staff was very or somewhat helpful in helping to achieve their vocational rehabilitation goals.
ME
DVR Region
1 Region
2 Region
3 Region
4 Region
5
Not at all helpful 4% 3% 5% 6% 3% 4%
Not very helpful 4% 3% 7% 3% 5%
Somewhat helpful 19% 16% 27% 17% 18% 19%
Very helpful 72% 77% 62% 74% 75% 77%
Total 100% 100% 100% 100% 100% 100% Results by region for 2011
4% 4%
19%
72%
0%
20%
40%
60%
80%
100%
Not at all helpful Not very helpful Somewhat helpful Very helpful
Q11: How helpful were the staff of ME DVR in helping you achieve your vocational rehabilitation goals?

107
2003 2006 2008 2011 Sig Diff (Region)
Sig Diff (Year)
ME DVR 91.6% 92.2% 89.7% 91.5%
Region 1 88.8% 92.7% 86.6% 93.5%
Region 2 90.4% 90.0% 89.3% 88.3%
Region 3 94.3% 91.2% 91.9% 90.8%
Region 4 90.3% 93.9% 90.5% 92.5%
Region 5 97.4% 98.6% 97.2% 95.9% (% of respondents indicating very helpful or somewhat helpful)
91.6% 92.2% 89.7% 91.5%
0.0%
20.0%
40.0%
60.0%
80.0%
100.0%
2003 2006 2008 2011
Year of Survey Administration
Q11: How helpful were the staff of ME DVR in helping you achieve your vocational rehabilitation goals?
(% very or somewhat helpful)

108
Comments: In 2011, 92% of clients indicated that the staff was very or somewhat helpful in helping them achieve their vocational rehabilitation goals. This is comparable to the percentage in 2008. In 2011, 72% of clients indicated that the staff was very helpful, while 19% indicated that the staff was somewhat helpful in helping them achieve their goals. Only 8% indicated that the staff was not helpful in helping them achieve their vocational rehabilitation goals (4% not very helpful and 4% not at all helpful). Significant Differences by Group:
98% of those with cases closed successfully indicate staff was helpful 98% of those whose disability is classified as mental retardation indicate staff was helpful
Among the 8% of clients that indicated that the staff was not helpful in helping them to achieve their vocational rehabilitation goals:
23% indicated they needed more guidance or support 10% indicated they did not achieve goal, need additional guidance 10% indicated they received little or no help 9% indicated services were not provided or much help 9% indicated they had to switch counselors too often
By service region, the main reasons cited for why the staff was not helpful in helping to achieve their vocational rehabilitation goals were: Region 1:
21% indicated they needed more guidance or support 18% indicated the agency tried to help 14% indicated they received little or no help 11% indicated services were not provided or much help
Region 2:
17% indicated they did not achieve goal, need additional guidance 14% indicated they received little or no help 13% indicated they needed more guidance or support 11% indicated the staff was hard to reach 10% indicated they had to switch counselors too often 10% indicated their counselor did not return calls or follow-up

109
Region 3:
36% indicated they needed more guidance or support 19% indicated services were not provided or much help 15% indicated they had to switch counselors too often 12% indicated their counselor did not return calls or follow-up 10% indicated the staff was hard to reach
Region 4:
31% indicated they needed more guidance or support 11% indicated they are dissatisfied, in general 10% indicated that despite dissatisfaction, the agency made commendable efforts 9% indicated they were unaware of available services
Region 5:
34% indicated they needed more guidance or support 21% indicated the agency tried to help 19% indicated they did not receive employment and the agency could not find them a job 12% indicated they did not achieve goal, need additional guidance 7% indicated someone else helped with the forms or the counselor did the paperwork
Q11: How helpful were the staff of ME DVR in helping you achieve your vocational rehabilitation goals? Reasons Not Helpful
ME
DVR Region
1 Region
2 Region
3 Region
4 Region
5
SUPPORT - Need more guidance, support 23% 21% 13% 36% 31% 34%
SUPPORT - Did not achieve goal, working on, need guidance
10% 5% 17% 8% 7% 12%
EFFECTIVE - No help, very little help 10% 14% 14% 4% 5%
SUPPORT - No services provided, not much help
9% 11% 6% 19% 2%
STAFF - Changing counselors, switching too much
9% 6% 10% 15% 3%
Results by region for 2011
Note: columns listed as “0%” indicated instances where less than 0.5% gave this response. Blanks represent cases where no client gave this response.

110
Q11: How helpful were the staff of ME DVR in helping you achieve your vocational rehabilitation goals?
Reasons Not Helpful (continued)
ME
DVR Region
1 Region
2 Region
3 Region
4 Region
5
COMM - Counselor did not return calls, No follow up
8% 6% 10% 12% 5%
POSITIVE - They tried to help, received some help
8% 18% 2% 4% 6% 21%
COMM - Hard to reach staff 7% 11% 10% 5%
WORK - No job, didn't receive much job search help
6% 6% 8% 3% 7%
WORK - Did not receive employment, Could not find me a job
6% 4% 8% 6% 3% 19%
NEGATIVE - Dissatisfied (general) 6% 7% 9% 11%
POSITIVE - Commendable efforts, services provided
5% 3% 7% 2% 10%
EXPAND - More info needed, need to broaden programs
5% 9% 5% 2% 2%
INFO - Not enough, unaware of available services
3% 8% 9%
INFO - Not enough information provided 2% 3% 2% 6%
HELP - Someone else helped, counselor did paperwork
2% 2% 1% 2% 3% 7%
EFFECTIVE - Did most of job hunting, research on own
2% 4% 3%
WORK - Completed testing, training but still no job
1% 1% 2%
EFFECTIVE - Broken promises, no follow thru
0% 1%
INFO - Clear, detailed information about services offered
0% 2%
Other 22% 25% 23% 15% 21% 39%
None 5% 10% 7%
DK-REF 6% 4% 7% 5% 12% 4%
Results by region for 2011
Note: columns listed as “0%” indicated instances where less than 0.5% gave this response. Blanks represent cases where no client gave this response.

111
In 2011, 85% of clients indicated that it was very or somewhat easy to contact their vocational rehabilitation counselor.
ME
DVR Region
1 Region
2 Region
3 Region
4 Region
5
Very difficult 6% 6% 8% 6% 2% 1%
Somewhat difficult 9% 8% 11% 13% 4% 5%
Somewhat easy 17% 17% 17% 15% 20% 9%
Very easy 68% 69% 64% 66% 74% 85%
Total 100% 100% 100% 100% 100% 100% Results by region for 2011
6%9%
17%
68%
0%
20%
40%
60%
80%
100%
Very difficult Somewhat difficult Somewhat easy Very easy
Q12: How easy was it for you to contact your vocational rehabilitation counselor?

112
2003 2006 2008 2011 Sig Diff (Region)
Sig Diff (Year)
ME DVR 86.0% 85.1% 86.0% 85.2% Region 1 86.6% 88.6% 88.4% 86.4% Region 2 76.5% 78.2% 79.6% 81.1% Region 3 88.4% 81.8% 84.4% 80.9% Region 4 86.6% 91.4% 92.7% 94.2% + Region 5 94.2% 91.7% 93.2% 93.7% +
(% of respondents indicating very easy or somewhat easy)
86.0% 85.1% 86.0% 85.2%
0.0%
20.0%
40.0%
60.0%
80.0%
100.0%
2003 2006 2008 2011
Year of Survey Administration
Q12: How easy was it for you to contact your vocational rehabilitation counselor?
(% very or somewhat easy)

113
Comments: In 2011, 85% of clients indicated that it was somewhat or very easy to contact their vocational rehabilitation counselor. This is comparable to the percentage in 2008. In 2011, 68% of clients indicated that it was very easy to contact their vocational rehabilitation counselor, while 17% indicated that it was somewhat easy to contact their vocational rehabilitation counselor. Only 15% indicated that it was difficult to contact their vocational rehabilitation counselor (9% somewhat difficult and 6% very difficult). Significant Differences by Group:
94% of those with cases closed successfully indicate it was easy Among the 15% of clients that indicated that it was difficult to reach their vocational rehabilitation counselor:
23% indicated that calls were never returned for days or weeks 20% indicated their counselor was hard to reach 18% indicated their counselor did not return calls or follow-up 17% indicated they left multiple messages before receiving a call back 14% indicated they and their counselor made many calls before getting in touch
By service region, the main reasons cited for difficulties in reaching their vocational rehabilitation counselor are: Region 1:
21% indicated their counselor was hard to reach 21% indicated they left multiple messages before receiving a call back 20% indicated that calls were never returned for days or weeks 15% indicated their counselor did not return calls or follow-up
Region 2
25% indicated their counselor was hard to reach 24% indicated that calls were never returned for days or weeks 21% indicated their counselor did not return calls or follow-up 20% indicated the staff is too busy with large caseloads

114
Region 3:
24% indicated that calls were never returned for days or weeks 21% indicated their counselor did not return calls or follow-up 18% indicated their counselor was hard to reach 18% indicated they left multiple messages before receiving a call back
Region 4:
30% indicated they and their counselor made many calls before getting in touch 29% indicated that calls were never returned for days or weeks 15% indicated their counselor was hard to reach 14% indicated their counselor never answered the phone; client always had to leave
message on voicemail
Region 5:
44% indicated they and their counselor made many calls before getting in touch 31% indicated the staff is too busy with large caseloads 24% indicated their counselor was hard to reach 20% indicated they left multiple messages before receiving a call back
Q12: How easy was it for you to contact your vocational rehabilitation counselor? Reasons Not Easy
ME
DVR Region
1 Region
2 Region
3 Region
4 Region
5
COMM - Calls, mail not returned for days, weeks, wait
23% 20% 24% 24% 29% 12%
COMM - Hard to reach counselor 20% 21% 25% 18% 15% 24%
COMM - Counselor did not return calls, No follow up
18% 15% 21% 21% 11% 8%
COMM - Leave multiple messages before getting a call back
17% 21% 18% 18% 20%
COMM - Phone tag - leave a message and counselor called back
14% 11% 11% 11% 30% 44%
COMM - They are too busy, They have large caseloads
10% 4% 20% 9% 4% 31%
Results by region for 2011
Note: columns listed as “0%” indicated instances where less than 0.5% gave this response. Blanks represent cases where no client gave this response.

115
Q12: How easy was it for you to contact your vocational rehabilitation counselor? Reasons Not Easy (continued)
ME
DVR Region
1 Region
2 Region
3 Region
4 Region
5
COMM - Voicemail, leave message, Never answer phone
8% 10% 7% 6% 14%
COMM - Person never available (meetings, out of office)
6% 3% 8% 12% 6%
POSITIVE - Easy able to reach counselor with no problems
5% 5% 3% 4% 9%
COMM - Should be answering phones, Want to speak to person
3% 8% 3% 4%
POSITIVE - Some parts are easy, some are hard
3% 3% 5% 5% 7%
STAFF - Changing counselors, switching too much
3% 5% 2% 3%
CLIENT - Lack of success my fault, did not contact
1% 2%
STAFF - Some good, some bad counselors 0% 1%
Other 10% 14% 7% 10% 10%
None 3% 2% 2% 7%
DK-REF 1% 4%
Total 100% 100% 100% 100% 100% 100%
Results by region for 2011
Note: columns listed as “0%” indicated instances where less than 0.5% gave this response. Blanks represent cases where no client gave this response.

116
In 2011, nearly all clients (95%) found the agency office very or somewhat accessible to someone with their type of disability.
ME
DVR Region
1 Region
2 Region
3 Region
4 Region
5
Not at all accessible 1% 1% 2% 1% 1%
Not very accessible 4% 5% 4% 3% 3%
Somewhat accessible 13% 15% 14% 11% 9% 7%
Very accessible 83% 79% 81% 85% 87% 93%
Total 100% 100% 100% 100% 100% 100% Results by region for 2011
1% 4%
13%
83%
0%
20%
40%
60%
80%
100%
Not at all accessible Not very accessible Somewhat accessible Very accessible
Q13: How accessible was the ME DVR office for someone with your type of disability?

117
2003 2006 2008 2011 Sig Diff (Region)
Sig Diff (Year)
ME DVR 97.9% 96.8% 97.6% 95.2%
Region 1 97.6% 95.2% 97.2% 94.4%
Region 2 95.8% 99.4% 99.0% 94.5% DOWN
Region 3 99.5% 97.5% 97.2% 96.0%
Region 4 96.5% 94.7% 96.8% 96.1%
Region 5 100.0% 98.8% 98.0% 100.0% + (% of respondents indicating very accessible or somewhat accessible)
97.9% 96.8% 97.6% 95.2%
0.0%
20.0%
40.0%
60.0%
80.0%
100.0%
2003 2006 2008 2011
Year of Survey Administration
Q13: How accessible was the ME DVR office for someone with your type of disability?
(% very or somewhat accessible)

118
Comments: In 2011, 95% of clients indicated that the office was very or somewhat accessible to someone with their type of disability. This is comparable to the percentage in 2008. In 2011, 83% of clients indicated that the office was very accessible, while 13% indicated that it was somewhat accessible. Only 5% indicated that the office was not accessible to someone with their type of disability (4% indicated very inaccessible and 1% not at all accessible). Among the 5% of clients that indicated that the office was not accessible:
25% indicated difficulty with the distance, and available bus routes or train stations 20% mentioned general transportation issues in getting to and from the office 7% indicated the offices were not at all accessible 7% indicated difficulty with directions to the building or office
Q13: How accessible was the ME DVR office for someone with your type of disability? Reasons Not Accessible
ME
DVR Region
1 Region
2 Region
3 Region
4 Region
5
TRANS - Distance, bus routes, train station 25% 13% 39% 30% 28% 12%
TRANS - Transportation in general 20% 19% 20% 18% 33%
NEGATIVE - Not accessible at all 7% 5% 7% 12% 10% 19%
OFFICE - Location, directions to building or office
7% 7% 11% 4% 5%
TRANS - Parking, handicap parking, parking
5% 10% 5%
CONDITION - No materials, braille, interpreters, large print
5% 3% 3% 11% 8% 20%
STAFF - No cooperation, no help 5% 9% 3% 3%
POSITIVE - Fine, somewhat accessible 4% 6% 3% 3% 4%
OFFICE - Mobility in building, small, hard getting around
4% 8% 3%
OFFICE -Access, and exit with doors, difficulty
4% 5% 8%
Results by region for 2011
Note: columns listed as “0%” indicated instances where less than 0.5% gave this response. Blanks represent cases where no client gave this response.

119
Q13: How accessible was the ME DVR office for someone with your type of disability?
Reasons Not Accessible (continued)
ME
DVR Region
1 Region
2 Region
3 Region
4 Region
5
OFFICE - Elevators and stairs 2% 3% 4%
POSITIVE - They come to me , we meet somewhere else
1% 11% 14%
TRANS - Lots of walking 1% 5%
POSITIVE - Very accessible, great, no complaints
1% 4%
SUPPORT - Needed more support, guidance, help
1% 2%
SAFETY - Concerned with safety, dark and dingy
0% 4%
Other 11% 11% 12% 12% 4%
None 10% 3% 20% 13% 5%
DK-REF 13% 15% 17% 6% 10% 35%
Total 100% 100% 100% 100% 100% 100%
Results by region for 2011
Note: columns listed as “0%” indicated instances where less than 0.5% gave this response. Blanks represent cases where no client gave this response.

120
In 2011, 64% of clients indicated that the services they received helped them become more financially independent.
ME
DVR Region
1 Region
2 Region
3 Region
4 Region
5
Strongly disagree 13% 11% 12% 17% 13% 12%
Somewhat disagree 6% 4% 5% 7% 9% 11%
Neither agree nor disagree 17% 20% 20% 12% 15% 15%
Somewhat agree 28% 27% 34% 23% 27% 30%
Strongly agree 36% 38% 29% 40% 37% 33%
Total 100% 100% 100% 100% 100% 100% Results by region for 2011
13%6%
17%
28%
36%
0%
20%
40%
60%
80%
100%
Strongly disagree
Somewhat disagree
Neither agree nor disagree
Somewhat agree
Strongly agree
Q14: Next I am going to read a list of statements and I would like to know how strongly you agree or disagree. The
vocational rehabilitation services I received helped me become more financially independent.

121
2003 2006 2008 2011 Sig Diff (Region)
Sig Diff (Year)
ME DVR 67.7% 68.9% 67.1% 63.8%
Region 1 63.7% 68.0% 62.3% 64.5%
Region 2 57.7% 66.7% 67.0% 63.1%
Region 3 73.9% 70.0% 71.4% 63.6%
Region 4 68.2% 71.0% 65.3% 63.9%
Region 5 77.7% 70.5% 76.4% 62.7% (% of respondents indicating strongly agree or somewhat agree)
67.7% 68.9% 67.1% 63.8%
0.0%
20.0%
40.0%
60.0%
80.0%
100.0%
2003 2006 2008 2011
Year of Survey Administration
Q14: Next I am going to read a list of statements and I would like to know how strongly you agree or disagree. The vocational rehabilitation services I received helped me
become more financially independent.(% stronly or somewhat agree)

122
Comments: Clients were asked how strongly they agreed or disagreed with the statement “The services I received helped me become more financially independent.” In 2011, 64% of clients somewhat or strongly agreed that the services they received had helped them become more financially independent. This is comparable to the percentage in 2008. In 2011, 36% strongly agreed with this statement while 28% somewhat agreed that the services provided by vocational rehabilitation helped them to become more financially independent. Seventeen percent of respondents neither agreed nor disagreed with the statements. Nineteen percent of clients disagreed that the services provided by vocational rehabilitation helped them to become more financially independent (with 13% strongly disagreeing and 6% somewhat disagreeing with the statement). Significant Differences by Group:
81% of those with cases closed successfully agree 82% of those whose disability is classified as mental retardation agree
Only 26% of those whose disability is classified as deafness agree Only 38% of those whose disability is classified as orthopedic agree
Among the 19% of clients that did not agree that the services they received helped them become more financially independent:
41% indicated they did not receive employment and the agency could not find them a job 23% indicated they did not receive needed testing 15% indicated they did not receive needed financial help 14% indicated they experienced no financial changes 11% indicated services were not provided or much help
By service region, the main reasons clients did not agree that services helped them become more financially independent were: Region 1:
43% indicated they did not receive employment and the agency could not find them a job 23% indicated they did not receive needed financial help 19% indicated they did not receive needed testing 14% indicated services were not provided or much help

123
Region 2:
50% indicated they did not receive employment and the agency could not find them a job 12% indicated they experienced no financial changes 11% indicated they did not receive needed financial help 11% indicated they did not receive needed testing 11% indicated they cannot find a better paying job or that they’re not earning much
money Region 3:
41% indicated they did not receive employment and the agency could not find them a job 35% indicated they did not receive needed testing 26% indicated they experienced no financial changes 17% indicated they needed more guidance or support
Region 4:
27% indicated they did not receive needed testing 26% indicated they did not receive employment and the agency could not find them a job 22% indicated services were not provided or much help 17% indicated they did not receive needed financial help
Region 5:
42% indicated they did not receive employment and the agency could not find them a job 31% indicated they cannot find a better paying job or that they’re not earning much
money 19% indicated they experienced no financial changes

124
Q14: Next I am going to read a list of statements and I would like to know how strongly
you agree or disagree. The vocational rehabilitation services I received helped me become more financially independent.
Reasons Disagree
ME
DVR Region
1 Region
2 Region
3 Region
4 Region
5
WORK - Did not receive employment, Could not find me a job
41% 43% 50% 41% 26% 42%
TEST - Didn't receive needed, desired testing
23% 19% 11% 35% 27% 12%
FINANCE - Did not receive needed financial help
15% 23% 11% 11% 17%
FINANCE - No change financially 14% 7% 12% 26% 6% 19%
SUPPORT - No services provided, not much help
11% 14% 9% 2% 22%
SUPPORT - Need more guidance, support 9% 5% 3% 17% 11% 9%
WORK - Cannot find better paying job, not earning much
7% 5% 11% 5% 3% 31%
WORK - Unable or too difficult to work due to disability
5% 3% 5% 7% 8% 10%
WORK - Completed testing, training but still no job
3% 4% 5% 7%
EFFECTIVE - Used own resources to get job, training
2% 6% 5%
INFO - Not enough, unaware of available services
2% 7%
COMM - Hard to reach staff 2% 3% 2% 4%
Results by region for 2011
Note: columns listed as “0%” indicated instances where less than 0.5% gave this response. Blanks represent
cases where no client gave this response.

125
Q14: Next I am going to read a list of statements and I would like to know how strongly
you agree or disagree. The vocational rehabilitation services I received helped me become more financially independent. Reasons Disagree (continued)
ME
DVR Region
1 Region
2 Region
3 Region
4 Region
5
EXPAND - More info needed, need to broaden programs
1% 4%
STAFF - Changing counselors, switching too much
1% 5%
COMM - Counselor did not return calls, No follow up
1% 4%
Other 2% 3% 6%
None 1% 4%
DK-REF 1% 2%
Total 100% 100% 100% 100% 100% 100%
Results by region for 2011
Note: columns listed as “0%” indicated instances where less than 0.5% gave this response. Blanks represent cases where no client gave this response.

126
In 2011, 91% of clients indicated that the Maine Division of Vocational Rehabilitation staff treated them with dignity and respect.
ME
DVR Region
1 Region
2 Region
3 Region
4 Region
5
Strongly disagree 3% 1% 5% 3% 5%
Somewhat disagree 3% 3% 3% 5% 1%
Neither agree nor disagree 3% 4% 3% 2% 2%
Somewhat agree 11% 9% 14% 12% 9% 9%
Strongly agree 80% 83% 75% 78% 83% 91%
Total 100% 100% 100% 100% 100% 100% Results by region for 2011
3% 3% 3%
11%
80%
0%
20%
40%
60%
80%
100%
Strongly disagree
Somewhat disagree
Neither agree nor disagree
Somewhat agree
Strongly agree
Q15: Next I am going to read a list of statements and I would like to know how strongly you agree or disagree. The
ME DVR staff treated me with dignity and respect.

127
2003 2006 2008 2011 Sig Diff (Region)
Sig Diff (Year)
ME DVR 96.7% 94.4% 93.1% 91.3% DOWN
Region 1 95.7% 95.2% 93.6% 92.2%
Region 2 96.1% 95.5% 92.1% 89.2%
Region 3 98.0% 90.9% 93.9% 90.7%
Region 4 95.9% 97.1% 93.1% 91.4%
Region 5 98.8% 98.9% 89.6% 100.0% + + (% of respondents indicating strongly agree or somewhat agree)
96.7% 94.4% 93.1% 91.3%
0.0%
20.0%
40.0%
60.0%
80.0%
100.0%
2003 2006 2008 2011
Year of Survey Administration
Q15: Next I am going to read a list of statements and I would like to know how strongly you agree or disagree. The ME
DVR staff treated me with dignity and respect.(% strongly or somewhat agree)

128
Comments: Clients were asked how strongly they agreed or disagreed with the statement “The staff treated me with dignity and respect.” In 2011, 91% of clients somewhat or strongly agreed that staff had treated them with dignity and respect. This continues the downward trend from 2003. In 2011, 80% of clients strongly agreed with this statement, while 11% somewhat agreed that the staff of vocational rehabilitation treated them with dignity and respect. Three percent of clients neither agreed nor disagreed with this statement. Six percent of clients disagreed that the staff of vocational rehabilitation treated them with dignity and respect (with 3% strongly disagreeing and 3% somewhat disagreeing). Significant Differences by Group:
97% of those with cases closed successfully agree Among the 6% of clients that felt that the staff had not treated them with dignity and respect:
35% indicated the counselor or other staff were rude and did not treat them with respect 32% indicated the counselor was not helpful or supportive 18% indicated the counselor did not listen to their needs 16% indicated they needed more guidance or support

129
Q15: Next I am going to read a list of statements and I would like to know how strongly
you agree or disagree. The ME DVR staff treated me with dignity and respect. Reasons Disagree
ME
DVR Region
1 Region
2 Region
3 Region
4 Region
5
STAFF - Counselor, staff did not treat me with respect, rude
35% 9% 19% 70% 37%
STAFF - Counselor was not helpful, supportive
32% 26% 29% 36% 36%
STAFF - Did not listen to my needs 18% 13% 36% 20%
SUPPORT - Need more guidance, support 16% 14% 29% 18%
SUPPORT - No services provided, not much help
10% 5% 29%
STAFF - Changing counselors, switching too much
9% 22% 12%
EFFECTIVE - Broken promises, no follow thru
5% 5% 20%
COMM - Counselor did not return calls, No follow up
5% 10% 10%
POSITIVE - Commendable efforts, services provided
4% 9% 7%
WORK - Did not receive employment, Could not find me a job
4% 18%
EDUCATON - Too educated for agency standards
4% 17%
EFFECTIVE - Never received help 2% 13%
COMM - Hard to reach counselor 2% 7%
Other 30% 24% 41% 10% 51%
None 4% 6% 6%
Total 100% 100% 100% 100% 100% Results by region for 2011
Note: columns listed as “0%” indicated instances where less than 0.5% gave this response. Blanks represent
cases where no client gave this response.

130
In 2011, 66% of clients indicated that the agency helped them reach their job goals.
ME
DVR Region
1 Region
2 Region
3 Region
4 Region
5
Strongly disagree 13% 8% 16% 17% 12% 11%
Somewhat disagree 7% 7% 7% 7% 7% 3%
Neither agree nor disagree 15% 17% 16% 9% 14% 12%
Somewhat agree 23% 27% 20% 23% 19% 23%
Strongly agree 43% 41% 40% 43% 48% 52%
Total 100% 100% 100% 100% 100% 100% Results by region for 2011
13%7%
15%23%
43%
0%
20%
40%
60%
80%
100%
Strongly disagree
Somewhat disagree
Neither agree nor disagree
Somewhat agree
Strongly agree
Q16: Next I am going to read a list of statements and I would like to know how strongly you agree or disagree. ME
DVR helped me reach my job goals.

131
2003 2006 2008 2011 Sig Diff (Region)
Sig Diff (Year)
ME DVR 72.4% 72.1% 71.4% 65.8%
Region 1 73.3% 71.8% 75.5% 68.2%
Region 2 62.6% 67.7% 66.8% 60.3%
Region 3 75.2% 71.7% 71.2% 66.1%
Region 4 71.5% 77.1% 69.4% 66.7%
Region 5 82.7% 77.2% 77.8% 74.8% (% of respondents indicating strongly agree or somewhat agree)
72.4% 72.1% 71.4%
65.8%
0.0%
20.0%
40.0%
60.0%
80.0%
100.0%
2003 2006 2008 2011
Year of Survey Administration
Q16: Next I am going to read a list of statements and I would like to know how strongly you agree or disagree. ME DVR
helped me reach my job goals.(% strongly or somewhat agree)

132
Comments: Clients were asked how strongly they agreed or disagreed with the statement “The agency helped me reach my job goals.” In 2011, 71% of clients somewhat or strongly agreed that the agency helped them reach their job goals. In 2011, 43% of clients strongly agreed with this statement, while 23% somewhat agreed that the agency helped them reach their job goal. Fifteen percent of clients neither agreed nor disagreed with this statement. Twenty percent of clients disagreed that that the agency helped them reach their job goal (with 13% strongly disagreeing and 7% somewhat disagreeing). Significant Differences by Group:
83% of those with cases closed successfully agree 82% of those whose disability is classified as hard of hearing agree
Among the 20% of clients that indicated that the agency did not help them reach their job goals:
28% indicated they did not receive employment and the agency could not find them a job 27% indicated they do not have a job yet and are still working on achieving goals 20% indicated services were not provided or much help 18% indicated the program did nothing or little to help 16% indicated they needed more guidance or support
By service region, the main reasons clients indicated that the agency did not help them reach their job goals were: Region 1:
35% indicated they did not receive employment and the agency could not find them a job 28% indicated they do not have a job yet and are still working on achieving goals
Region 2:
29% indicated they did not receive employment and the agency could not find them a job 19% indicated they do not have a job yet and are still working on achieving goals 19% indicated the program did nothing or little to help 16% indicated services were not provided or much help

133
Region 3:
38% indicated they do not have a job yet and are still working on achieving goals 35% indicated services were not provided or much help 31% indicated they needed more guidance or support 23% indicated they did not receive employment and the agency could not find them a job 20% indicated the program did nothing or little to help
Region 4:
29% indicated they did not receive employment and the agency could not find them a job 28% indicated the program did nothing or little to help 22% indicated they do not have a job yet and are still working on achieving goals 19% indicated they had to find a job on their own
Region 5:
28% indicated they did not receive employment and the agency could not find them a job 25% indicated they are dissatisfied with their job, not what they wanted

134
Q16: Next I am going to read a list of statements and I would like to know how strongly
you agree or disagree. ME DVR helped me reach my job goals. Reasons Disagree
ME
DVR Region
1 Region
2 Region
3 Region
4 Region
5
WORK - Did not receive employment, Could not find me a job
28% 35% 29% 23% 29% 28%
WORK - No job yet-still working on achieving goals
27% 28% 19% 38% 22% 8%
SUPPORT - No services provided, not much help
20% 11% 16% 35% 15%
NEGATIVE - Program did nothing or little to help
18% 11% 19% 20% 28%
SUPPORT - Need more guidance, support 16% 5% 12% 31% 16% 14%
WORK - Had to find job, services on own 8% 4% 12% 2% 19%
WORK - Dissatisfied with job, not what they wanted
8% 7% 8% 6% 7% 25%
WORK - Help client get a job, more job services, job options
5% 11% 8%
EDUCATION - Need more training available
5% 2% 15%
COMM - Counselor did not return calls, No follow up
3% 7% 7%
STAFF - Changing counselors, switching too much
3% 7% 4%
WORK - completed testing, training but still no job
2% 3% 2% 4%
EFFECTIVE - Counselor had different goals, direction in mind
1% 2%
Other 4% 3% 5% 4% 25%
None 1% 1% 14%
DK-REF 3% 11%
Total 100% 100% 100% 100% 100% 100%
Results by region for 2011
Note: columns listed as “0%” indicated instances where less than 0.5% gave this response. Blanks represent cases where no client gave this response.

135
Problems and Areas for Improvement
In 2011, 18% of clients indicated that they had experienced problems with the agency or the services provided by the Maine Division of Vocational Rehabilitation.
Among those experiencing problems, only 38% indicated that the agency worked to resolve the problem.
In 2011, approximately half (46%) of clients offered suggestions for service
improvement.

136
In 2011, 18% of clients indicated that they had experienced problems with the agency or the services provided by the Maine Division of Vocational Rehabilitation.
ME
DVR Region
1 Region
2 Region
3 Region
4 Region
5
Yes 18% 16% 21% 23% 16% 8%
No 82% 84% 79% 77% 84% 92%
Total 100% 100% 100% 100% 100% 100% Results by region for 2011
18%
82%
0%
20%
40%
60%
80%
100%
Yes No
Q22: Have you experienced any problems with ME DVR or the services they have provided to you?

137
2003 2006 2008 2011 Sig Diff (Region)
Sig Diff (Year)
ME DVR 29.2% 25.8% 23.9% 18.2% DOWN
Region 1 33.1% 22.4% 23.6% 15.8%
Region 2 31.1% 32.4% 25.0% 20.6%
Region 3 27.8% 27.9% 25.3% 22.6%
Region 4 25.2% 21.5% 21.4% 15.6%
Region 5 23.5% 18.4% 17.8% 8.2% - DOWN (% of clients indicating yes)
29.2%25.8% 23.9%
18.2%
0.0%
20.0%
40.0%
60.0%
80.0%
100.0%
2003 2006 2008 2011
Year of Survey Administration
Q22: Have you experienced any problems with ME DVR or the services they have provided to you?
(% experiencing problems)

138
Comments: In 2011, 18% of clients indicated that they had experience problems with the Maine Division of Vocational Rehabilitation or the services that the agency provided. This is trending downward since 2003. Significant Differences by Group:
Only 6% of those with cases closed successfully experienced problems Only 2% of those whose disability is classified as mental retardation experienced
problems Among the 18% of clients that had experienced problems:
15% indicated they needed more guidance or support 13% indicated services were not provided or much help 11% indicated the counselor did not return calls or follow-up
By service region, the main problems experiences were: Region 1:
14% indicated the counselor did not return calls or follow-up 9% indicated their counselor is unreliable and was late or didn’t show up for
appointments Region 2:
18% indicated the counselor did not return calls or follow-up 15% indicated services were not provided or much help 11% indicated they needed more guidance or support 11% indicated the program did nothing or little to help
Region 3:
24% indicated they needed more guidance or support 22% indicated services were not provided or much help 19% indicated the agency should help clients get jobs or more job services
Region 4:
25% indicated they needed more guidance or support 18% indicated services were not provided or much help 11% indicated their counselor was not helpful or supportive

139
Region 5:
23% indicated the counselor did not return calls or follow-up 22% indicated the program did nothing or little to help 22% indicated the process of obtaining services should be sped up 22% indicated that counselors should make more effort, clients currently do all the work
Q22: Have you experienced any problems with ME DVR or the services they have provided
to you? MAIN CATEGORIES of Problems Experienced
ME
DVR Region
1 Region
2 Region
3 Region
4 Region
5
Staff Issues - Would not listen, dismissed concerns, did not understand needs or abilities, counselor was too busy, the client was pushed aside, staff needed to be more understanding, counselor left, switched to another counselor
32% 40% 33% 26% 23% 22%
Effectiveness - Program did not meet expectations, no clear purpose or solutions offered, speed up the process of getting services, had to fight to get services
30% 42% 20% 25% 33% 22%
Communication - Difficulties in communicating with the staff, their counselor did not return calls or was not available, their counselor did not follow-up, time lags in getting services and appointments
20% 22% 24% 18% 13% 23%
Support - The client felt that no services were provided or that the services provided were of little help, the client needed more support and guidance
19% 9% 17% 26% 30%
Employment - The client did not find employment and needed more assistance in finding a job, job search help or more job options
12% 5% 12% 19% 10% 37%
Results by region for 2011
Note: columns listed as “0%” indicated instances where less than 0.5% gave this response. Blanks represent cases where no client gave this response.

140
Q22: Have you experienced any problems with ME DVR or the services they have provided to you?
MAIN CATEGORIES of Problems Experienced (continued)
ME
DVR Region
1 Region
2 Region
3 Region
4 Region
5
Negative - Negative feedback, dissatisfied with program in general
7% 6% 11% 5% 5% 22%
Client Involvement - More client involvement in process, client had no control over process, client was told what to do, felt pushed into a job
3% 2% 5% 2%
Client Financial Issues - Did not receive financial assistance, not financially independent, client had to pay for services, client did not receive assistance in paying for services
3% 3% 11% 18%
Discrimination - Experience discrimination by agency or employer, feels discriminated against
2% 4% 8%
Information - The client was unaware of available services, the client needed more information about available services, and the client needed more information about employment choices
2% 4% 2% 11%
Education and Training - More job training and more options, more training and educational opportunities, did not receive needed training
2% 12%
Client Issues - Lack of success was fault of client, counselor and Division tried to help
1% 4%
Results by region for 2011
Note: columns listed as “0%” indicated instances where less than 0.5% gave this response. Blanks represent
cases where no client gave this response.

141
Q22: Have you experienced any problems with ME DVR or the services they have provided to you?
MAIN CATEGORIES of Problems Experienced (continued)
ME
DVR Region
1 Region
2 Region
3 Region
4 Region
5
Additional Services - Services for the severely disabled, problems with services contracted by the Division, no services available in area
1% 4%
Positive - Positive feedback, satisfied with program, staff helpful, no complaints
1% 2%
Testing - Need for more testing, less testing 1% 2%
Expanded Services - Division needs more funding for services, need to offer more services, networking with other agencies and businesses
1% 2%
Other 4% 3% 5% 10%
None or Unsure 3% 3% 2% 6%
Total 100% 100% 100% 100% 100% 100%
Results by region for 2011
Note: columns listed as “0%” indicated instances where less than 0.5% gave this response. Blanks represent cases where no client gave this response.

142
Q22: Have you experienced any problems with ME DVR or the services they have provided to you?
SUB CATEGORIES of Problems Experienced
ME
DVR Region
1 Region
2 Region
3 Region
4 Region
5
SUPPORT - Need more guidance, support 15% 7% 11% 24% 25%
SUPPORT - No services provided, not much help
13% 2% 15% 22% 18%
COMM - Counselor did not return calls, No follow up
11% 14% 18% 3% 9% 23%
WORK - Help client get a job, more job services, job options
9% 10% 19% 6%
COMM - Hard to reach staff 6% 3% 9% 8% 4%
STAFF - Changing counselors, switching too much
6% 5% 9% 6%
STAFF - Counselor was not helpful, supportive
5% 2% 3% 8% 11%
NEGATIVE - Program did nothing or little to help
5% 11% 5% 5% 22%
COMM - Do not return calls, follow up, hard to contact
5% 2% 10% 2% 4%
EFFECTIVE - Don't close cases, cut clients off
4% 4% 8% 3%
STAFF - Counselors make more effort, client does work
3% 5% 5% 22%
EFFECTIVE - Tailor to individual needs- know each client
3% 3% 3% 4%
EFFECTIVE - Long time to get things going, process slow
3% 4% 5%
CONTROL - No control over experience, told me what to do
3% 2% 5% 2%
STAFF - Counselor is not reliable- late for appt., no shows
3% 9%
EFFECTIVE - Speed up process of obtaining services
2% 3% 2% 4% 22%
STAFF - More supervision of staff, management of services
2% 8%
Results by region for 2011
Note: columns listed as “0%” indicated instances where less than 0.5% gave this response. Blanks represent cases where no client gave this response.

143
Q22: Have you experienced any problems with ME DVR or the services they have provided to you?
SUB CATEGORIES of Problems Experienced (continued)
ME
DVR Region
1 Region
2 Region
3 Region
4 Region
5
EFFECTIVE - Client felt misunderstood 2% 8%
STAFF - Qualified staff, knowledge of disabilities, services
2% 5% 2%
EFFECTIVE - Clients needs were not met 2% 4% 3%
EFFECTIVE - Did most of job hunting, research on own
2% 6% 4%
DISCRIMINATION - Feels discriminated against
2% 4% 8%
STAFF - More counselors, staff, counselors are overworked
2% 2% 12%
INFO - Not enough, unaware of available services
2% 4% 2% 11%
EFFECTIVE - Training did not match with interest, ability
2% 4% 3%
STAFF - Office/counselor disorganized 2% 3% 5%
STAFF - Staff insensitive, don't care, don't want to help
2% 4% 3%
EFFECTIVE - Long, difficult process, stressful
2% 4% 2%
NEGATIVE - Program, services had negative effect on client
2% 6%
EFFECTIVE - Never received help 2% 6%
FINANCE - Financial help 2% 11% 18%
WORK- Did not receive employment, Could not find me a job
2% 2% 2% 4%
COMM - Hard to reach, hard to get a hold of
2% 5%
EFFECTIVE - No help, very little help 2% 13%
Results by region for 2011
Note: columns listed as “0%” indicated instances where less than 0.5% gave this response. Blanks represent cases where no client gave this response.
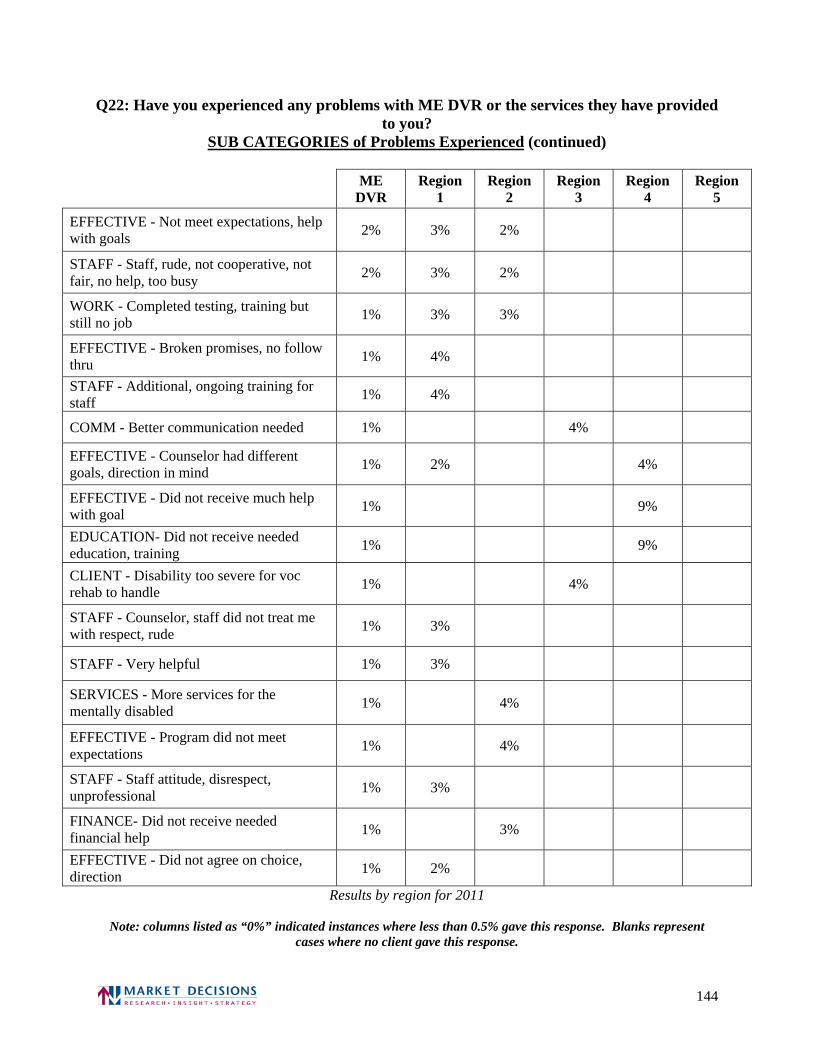
144
Q22: Have you experienced any problems with ME DVR or the services they have provided to you?
SUB CATEGORIES of Problems Experienced (continued)
ME
DVR Region
1 Region
2 Region
3 Region
4 Region
5
EFFECTIVE - Not meet expectations, help with goals
2% 3% 2%
STAFF - Staff, rude, not cooperative, not fair, no help, too busy
2% 3% 2%
WORK - Completed testing, training but still no job
1% 3% 3%
EFFECTIVE - Broken promises, no follow thru
1% 4%
STAFF - Additional, ongoing training for staff
1% 4%
COMM - Better communication needed 1% 4%
EFFECTIVE - Counselor had different goals, direction in mind
1% 2% 4%
EFFECTIVE - Did not receive much help with goal
1% 9%
EDUCATION- Did not receive needed education, training
1% 9%
CLIENT - Disability too severe for voc rehab to handle
1% 4%
STAFF - Counselor, staff did not treat me with respect, rude
1% 3%
STAFF - Very helpful 1% 3%
SERVICES - More services for the mentally disabled
1% 4%
EFFECTIVE - Program did not meet expectations
1% 4%
STAFF - Staff attitude, disrespect, unprofessional
1% 3%
FINANCE- Did not receive needed financial help
1% 3%
EFFECTIVE - Did not agree on choice, direction
1% 2%
Results by region for 2011
Note: columns listed as “0%” indicated instances where less than 0.5% gave this response. Blanks represent cases where no client gave this response.
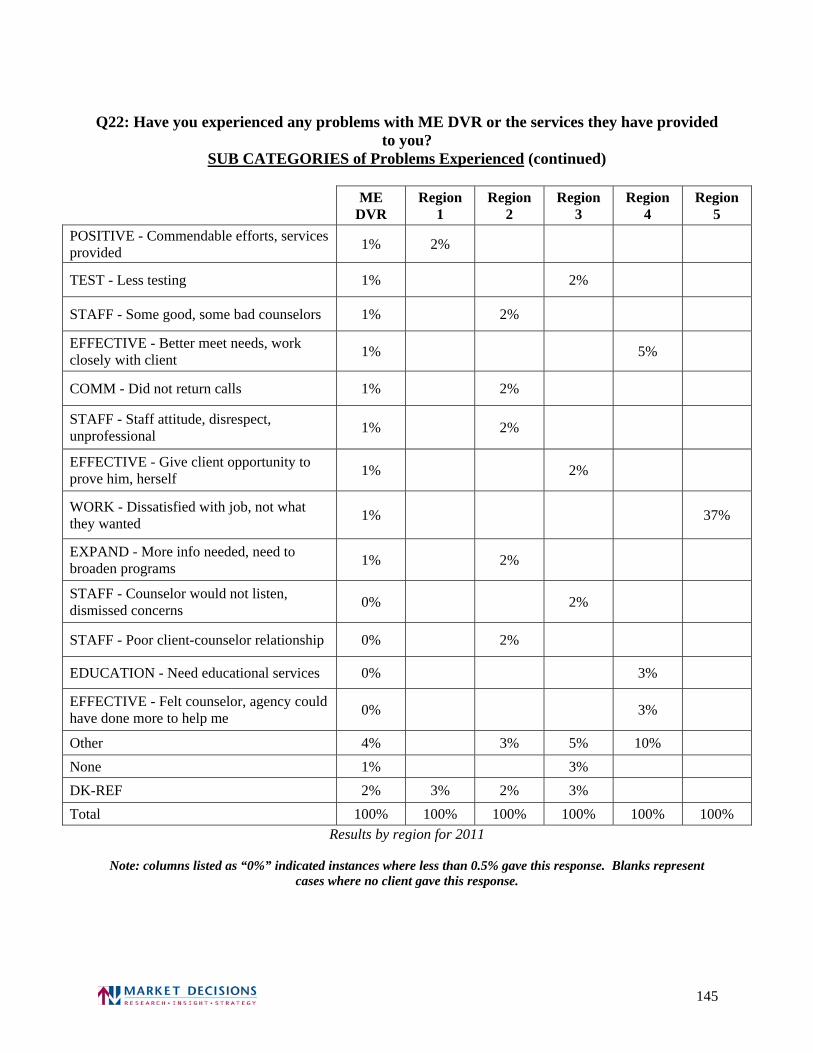
145
Q22: Have you experienced any problems with ME DVR or the services they have provided
to you? SUB CATEGORIES of Problems Experienced (continued)
ME
DVR Region
1 Region
2 Region
3 Region
4 Region
5
POSITIVE - Commendable efforts, services provided
1% 2%
TEST - Less testing 1% 2%
STAFF - Some good, some bad counselors 1% 2%
EFFECTIVE - Better meet needs, work closely with client
1% 5%
COMM - Did not return calls 1% 2%
STAFF - Staff attitude, disrespect, unprofessional
1% 2%
EFFECTIVE - Give client opportunity to prove him, herself
1% 2%
WORK - Dissatisfied with job, not what they wanted
1% 37%
EXPAND - More info needed, need to broaden programs
1% 2%
STAFF - Counselor would not listen, dismissed concerns
0% 2%
STAFF - Poor client-counselor relationship 0% 2%
EDUCATION - Need educational services 0% 3%
EFFECTIVE - Felt counselor, agency could have done more to help me
0% 3%
Other 4% 3% 5% 10%
None 1% 3%
DK-REF 2% 3% 2% 3%
Total 100% 100% 100% 100% 100% 100% Results by region for 2011
Note: columns listed as “0%” indicated instances where less than 0.5% gave this response. Blanks represent
cases where no client gave this response.

146
Among those experiencing problems, only 38% indicated that the agency worked to resolve the problem.
ME
DVR Region
1 Region
2 Region
3 Region
4 Region
5
Yes 38% 44% 37% 43% 21%
No 62% 56% 63% 57% 79% 100%
Total 100% 100% 100% 100% 100% 100% Results by region for 2011
38%
62%
0%
20%
40%
60%
80%
100%
Yes No
Q23: Did ME DVR work to resolve this problem?(% among those experiencing problems)

147
2003 2006 2008 2011 Sig Diff (Region)
Sig Diff (Year)
ME DVR 33.3% 30.5% 36.2% 38.1%
Region 1 31.2% 34.9% 30.8% 44.1%
Region 2 29.4% 29.8% 34.0% 36.7%
Region 3 40.7% 31.2% 41.9% 43.3%
Region 4 25.8% 23.8% 43.5% 21.3%
Region 5 38.1% 25.1% 24.8% 0.0% - DOWN (% of clients indicating yes)
33.3%30.5%
36.2% 38.1%
0.0%
20.0%
40.0%
60.0%
80.0%
100.0%
2003 2006 2008 2011
Year of Survey Administration
Q23: Did ME DVR work to resolve this problem?(% indicating yes among those experiencing problems)

148
Comments: In 2011, among those clients that had experienced problems, only 38% indicated that the agency had worked to resolve the problem, comparable to 2008.

149
In 2011, approximately half (46%) of clients offered suggestions for service improvement. Comments: At the end of the survey, clients were asked what the agency could do to improve the services offered to the client and to others. These are summarized in the table below. Forty percent of clients indicated that there was nothing else the agency could do and 13% were unsure of anything the agency could do to improve it services. Suggestions provided by clients on how to improve the services offered included the need for better follow-up with clients (2%), more counselors and staff (2%), and providing clear, detailed information about the services offered (2%) , among others.
Q24: What could the agency do to improve the services it offers to you and others? MAIN CATEGORIES of Suggestions
ME
DVR Region
1 Region
2 Region
3 Region
4 Region
5
Effectiveness - Program did not meet expectations, no clear purpose or solutions offered, speed up the process of getting services, had to fight to get services
11% 9% 12% 12% 10% 9%
Staff Issues - Would not listen, dismissed concerns, did not understand needs or abilities, counselor was too busy, the client was pushed aside, staff needed to be more understanding, counselor left, switched to another counselor
10% 8% 11% 15% 7% 9%
Communication - Difficulties in communicating with the staff, their counselor did not return calls or was not available, their counselor did not follow-up, time lags in getting services and appointments
8% 8% 11% 7% 4% 3%
Expanded Services - Division needs more funding for services, need to offer more services, networking with other agencies and businesses
7% 7% 6% 8% 5% 11%
Results by region for 2011
Note: columns listed as “0%” indicated instances where less than 0.5% gave this response. Blanks represent cases where no client gave this response.

150
Q24: What could the agency do to improve the services it offers to you and others?
MAIN CATEGORIES of Suggestions (continued)
ME
DVR Region
1 Region
2 Region
3 Region
4 Region
5
Positive - Positive feedback, satisfied with program, staff helpful, no complaints
3% 6% 0% 2% 5%
Information - The client was unaware of available services, the client needed more information about available services, and the client needed more information about employment choices
3% 4% 3% 2% 4% 5%
Education and Training - More job training and more options, more training and educational opportunities, did not receive needed training
3% 3% 0% 5% 6% 1%
Employment - The client did not find employment and needed more assistance in finding a job, job search help or more job options
2% 2% 2% 2% 1% 8%
Client Financial Issues - Did not receive financial assistance, not financially independent, client had to pay for services, client did not receive assistance in paying for services
2% 2% 2% 1% 1% 3%
Additional Services - Services for the severely disabled, problems with services contracted by the Division, no services available in area
2% 3% 1% 1% 1%
Transportation - Distance to offices or services, need transportation, parking, vehicle assistance
1% 1% 2% 2% 1% 5%
Client Disabilities - Trouble reading, poor eyesight, difficulties understanding or comprehending, difficulties due to disability
1% 1% 1% 1%
Delays - Long wait time to receive services, haven’t received services, took a long time to get help
1% 1% 1% 1%
Results by region for 2011
Note: columns listed as “0%” indicated instances where less than 0.5% gave this response. Blanks represent cases where no client gave this response.

151
Q24: What could the agency do to improve the services it offers to you and others?
MAIN CATEGORIES of Suggestions (continued)
ME
DVR Region
1 Region
2 Region
3 Region
4 Region
5
Client Involvement - More client involvement in process, client had no control over process, client was told what to do, felt pushed into a job
0% 3%
Discrimination - Experience discrimination by agency or employer, feels discriminated against
0% 1% 1%
Testing - Need for more testing, less testing 0% 1% 1%
Eligibility - Person did not qualify for services, person was denied services
0% 1%
Easy - Easy to understand, everything clear 0% 1%
Referred - Referred to Voc Rehab or Voc Rehab referred to another agency
0% 0%
Negative - Negative feedback, dissatisfied with program in general
0% 1%
Client Issues - Lack of success was fault of client, counselor and Division tried to help
0% 1%
Support - The client felt that no services were provided or that the services provided were of little help, the client needed more support and guidance
0% 1%
Other 0% 0% 1%
None or Unsure 54% 52% 57% 49% 60% 55%
Total 100% 100% 100% 100% 100% 100%
Results by region for 2011
Note: columns listed as “0%” indicated instances where less than 0.5% gave this response. Blanks represent cases where no client gave this response.

152
Q24: What could the agency do to improve the services it offers to you and others?
SUB CATEGORIES of Suggestions
ME
DVR Region
1 Region
2 Region
3 Region
4 Region
5
COMM - No follow up, should follow up more often
2% 4% 1% 4% 1%
STAFF - More counselors, staff, counselors are overworked
2% 3% 2% 3% 1% 3%
POSITIVE - Satisfied with program, doing their best
2% 4% 1% 3%
INFO - Clear, detailed information about services offered
2% 3% 2% 1% 2% 1%
EXPAND - Program to other locations, open office nearby
1% 2% 2% 1% 4%
STAFF - Qualified staff, knowledge of disabilities, services
1% 2% 2% 1% 1%
EFFECTIVE - Long time to get things going, process slow
1% 1% 2% 1% 1% 1%
EXPAND - More info needed, need to broaden programs
1% 1% 1% 1% 1% 3%
COMM - Counselor did not return calls, No follow up
1% 1% 3% 2% 1%
EFFECTIVE - Broken promises, no follow thru
1% 1% 4% 1%
EFFECTIVE - Tailor to individual needs- know each client
1% 1% 2% 1% 2%
INFO - Increase awareness of program to help more people
1% 2% 0% 2% 2%
COMM - Do not return calls, follow up, hard to contact
1% 1% 2% 1% 2%
EXPAND - More funds needed to expand and improve programs
1% 2% 0% 1% 2%
POSITIVE - They are helping me 1% 2% 0% 2%
TRANS - Transportation issue 1% 1% 0% 1% 1% 2%
EDUCATION - Need educational services 1% 1% 0% 2% 1%
Results by region for 2011
Note: columns listed as “0%” indicated instances where less than 0.5% gave this response. Blanks represent cases where no client gave this response.

153
Q24: What could the agency do to improve the services it offers to you and others?
SUB CATEGORIES of Suggestions (continued)
ME
DVR Region
1 Region
2 Region
3 Region
4 Region
5
EXPAND - Stronger network, agencies, businesses, doctors
1% 2% 0% 1%
EFFECTIVE - Program did not meet expectations
1% 1% 1% 1% 2%
EFFECTIVE - Training did not match with interest, ability
1% 1% 0% 1% 1% 2%
EFFECTIVE - Counselor had different goals, direction in mind
1% 1% 1% 2%
STAFF - Honest counselors, clear about what can be done
1% 1% 1% 1%
FINANCE - Did not receive needed financial help
1% 2% 0% 3%
STAFF - More caring, understanding and encouraging staff
1% 1% 1% 0%
STAFF - Counselor was not helpful, supportive
1% 1% 1% 1%
FINANCE - Financial help 1% 1% 1%
STAFF - More supervision of staff, management of services
1% 0% 2%
EDUCATION - Need more training available
1% 1% 1% 1%
EFFECTIVE - Agency was not very productive, effective
1% 0% 2% 1% 1%
COMM - More contact, more frequent contact, more support
1% 1% 1% 2%
EFFECTIVE - Counselor was holding out, not giving full options
1% 2% 1%
EFFECTIVE - Speed up process of obtaining services
1% 1% 1% 1%
EXPAND - More services options, more programs
1% 1% 1%
Results by region for 2011
Note: columns listed as “0%” indicated instances where less than 0.5% gave this response. Blanks represent cases where no client gave this response.

154
Q24: What could the agency do to improve the services it offers to you and others?
SUB CATEGORIES of Suggestions (continued)
ME
DVR Region
1 Region
2 Region
3 Region
4 Region
5
EXPAND - More effort allotted to follow-up
1% 1% 2%
EDUCATION - Need training 1% 1% 1%
EFFECTIVE - Agency did not follow through original plan
1% 2%
EFFECTIVE - Better meet needs, work closely with client
1% 0% 0% 2% 1%
WORK - Am on SSI, Put me on SSI rather than get me a job
1% 2%
COMM - Hard to reach counselor 1% 1% 1%
SERVICES - For severely disabled, uncommon disabilities
1% 1% 1% 0%
SERVICES - Services for hearing impaired 1% 1% 1%
EXPAND - Funding problems, No money for services
0% 1% 1%
EFFECTIVE - Clients needs were not met 0% 1% 0% 0%
WAIT - To get into program, to qualify for services
0% 1% 1%
WORK - No job, didn't receive much job search help
0% 1%
CONDITION - Trouble because of disability
0% 1% 1%
WORK - Dissatisfied with job, not what they wanted
0% 1% 5%
COMM - Did not return calls 0% 1% 1%
EFFECTIVE - Did not agree on choice, direction
0% 1% 1%
STAFF - Changing counselors, switching too much
0% 1% 1%
WORK - Help client get a job, more job services, job options
0% 1% 1%
Results by region for 2011
Note: columns listed as “0%” indicated instances where less than 0.5% gave this response. Blanks represent cases where no client gave this response.

155
Q24: What could the agency do to improve the services it offers to you and others?
SUB CATEGORIES of Suggestions (continued)
ME
DVR Region
1 Region
2 Region
3 Region
4 Region
5
COMM - They are too busy, They have large caseloads
0% 1% 0%
COMM - More frequent and, or productive appointments
0% 1% 1%
STAFF - Additional, ongoing training for staff
0% 1% 1%
STAFF - Office/counselor disorganized 0% 0% 1% 1%
CONTROL - No control over experience, told me what to do
0% 3%
EDUCATION - Did not receive needed education, training
0% 2% 1%
CONDITION - Trouble reading, writing, education
0% 1%
COMM - No follow through, get run around, nothing done
0% 1%
EXPAND - Options, need different, more options to choose from
0% 1% 0%
STAFF - Counselors make more effort, client does work
0% 1% 1% 1%
STAFF - Counselors were not overworked 0% 0% 1%
EFFECTIVE - Client felt misunderstood 0% 0% 0% 1%
EDUCATION - More job training, more options
0% 2%
STAFF - Lacks understanding needs, wants, ability
0% 1%
FINANCE - Cost of services is burden, should be free
0% 1%
TRANS - Transportation issues, unable to attend meetings
0% 1%
STAFF - Some good, some bad counselors 0% 1%
Results by region for 2011
Note: columns listed as “0%” indicated instances where less than 0.5% gave this response. Blanks represent cases where no client gave this response.

156
Q24: What could the agency do to improve the services it offers to you and others?
SUB CATEGORIES of Suggestions (continued)
ME
DVR Region
1 Region
2 Region
3 Region
4 Region
5
STAFF - Counselor too busy, pushed aside 0% 0% 1% 1%
COMM - Better communication needed 0% 0% 1%
Other 0% 0% 1%
INFO - Information needs to be accurate and current
0% 1%
STAFF - Program understaffed, counselors overwhelmed
0% 1% 1%
SERVICES - More rehabilitation services 0% 0% 0%
POSITIVE - Staff is great, very helpful 0% 1% 0%
EASY - Very Clear/Easy/no problem 0% 1%
EFFECTIVE - Give client opportunity to prove him, herself
0% 0% 0%
EFFECTIVE - Felt counselor, agency could have done more to help me
0% 1%
EFFECTIVE - Set up for failure 0% 1%
SERVICES - More services for the mentally disabled
0% 1%
DISCRIMINATION - Feels discriminated against
0% 1%
POSITIVE - Commendable efforts, services provided
0% 1%
EFFECTIVE - Did not receive much help with goal
0% 1%
STAFF - Did not listen to my needs 0% 1%
EFFECTIVE - Services should be easier to access
0% 1%
STAFF - Switching of counselors is confusing, has been a problem
0% 0% 0%
STAFF - Maintain consistency with staff throughout agency
0% 0% 3%
Results by region for 2011
Note: columns listed as “0%” indicated instances where less than 0.5% gave this response. Blanks represent cases where no client gave this response.

157
Q24: What could the agency do to improve the services it offers to you and others?
SUB CATEGORIES of Suggestions (continued)
ME
DVR Region
1 Region
2 Region
3 Region
4 Region
5
EFFECTIVE - Program hindered progress 0% 0%
INFO - Not enough information provided 0% 0% 1%
STAFF - Busy, lack staff, spend more time with clients
0% 1%
STAFF - Counselor is not reliable- late for appt., no shows
0% 1%
STAFF - Staff attitude, disrespect, unprofessional
0% 1%
EFFECTIVE - No goal set 0% 0%
TEST - Didn't receive needed, desired testing
0% 1%
EFFECTIVE - Don't close cases, cut clients off
0% 1%
REFFERED - To another agency- dissatisfied
0% 0%
STAFF - Counselor was ok, helpful, positive
0% 0%
STAFF - Counselor would not listen, dismissed concerns
0% 0%
NEGATIVE - Did not take care of problem 0% 1%
CLIENT - Denied services due to arrest, criminal behavior
0% 1%
STAFF - Maintain ongoing staff - changing counselors cause problems
0% 0%
SERVICES - More child and youth services 0% 1%
TRANS - Did not receive automobile buy, repair, insurance
0% 0%
COMM - Return call wait, too long returning calls
0% 1%
STAFF - Poor client-counselor relationship 0% 1%
EDUCATON - Too educated for agency standards
0% 1%
Results by region for 2011
Note: columns listed as “0%” indicated instances where less than 0.5% gave this response. Blanks represent cases where no client gave this response.

158
Q24: What could the agency do to improve the services it offers to you and others?
SUB CATEGORIES of Suggestions (continued)
ME
DVR Region
1 Region
2 Region
3 Region
4 Region
5 EFFECTIVE - Real solutions for long-term advancement
0% 1%
TRANS - Transportation in general 0% 1%
NOT ELIGIBLE - Denied assistance 0% 1%
WORK - Completed testing, training but still no job
0% 1%
COMM - Hard to reach staff 0% 0%
POSITIVE - They tried to help, received some help
0% 0%
STAFF - Listen to client, understand needs, wants, ability
0% 0%
EFFECTIVE - Time lags to get into the program
0% 0%
STAFF - Counseling services 0% 0%
SERVICES - Services for visually impaired, low vision aids
0% 0%
FINANCE - Client had to pay too many unexpected costs
0% 1%
NOT ELIGIBLE - Disability not severe enough to get services
0% 0%
STAFF - Have no counselor 0% 1%
SUPPORT - Needed more support, guidance, help
0% 1%
WAIT - Waiting for services 0% 0%
INFO - Not enough, unaware of available services
0% 1%
EXPAND - Pay staff higher wages 0% 0%
WAIT - Took a long time to get help 0% 1%
EFFECTIVE - Didn't establish any job goals
0% 1%
Results by region for 2011
Note: columns listed as “0%” indicated instances where less than 0.5% gave this response. Blanks represent cases where no client gave this response.

159
Q24: What could the agency do to improve the services it offers to you and others?
SUB CATEGORIES of Suggestions (continued)
ME
DVR Region
1 Region
2 Region
3 Region
4 Region
5
TEST - Testing, assessment to determine ability, interest
0% 1%
COMM - Hard to reach, hard to get a hold of
0% 1%
STAFF - Counselor, staff did not treat me with respect, rude
0% 2%
EXPAND - Not enough services available 0% 0%
WORK - Did not receive employment, Could not find me a job
0% 2%
WORK - Didn't receive needed job shadowing
0% 2%
STAFF - Treat clients respectfully, don't treat as number
0% 0%
EFFECTIVE - Not meet expectations, help with goals
0% 1%
EFFECTIVE - Don't rush people through program
0% 1%
None 40% 40% 39% 35% 49% 48%
DK-REF 13% 11% 18% 14% 11% 7%
Total 100% 100% 100% 100% 100% 100%
Results by region for 2011
Note: columns listed as “0%” indicated instances where less than 0.5% gave this response. Blanks represent cases where no client gave this response.

160
Current Employment Status
Forty-six percent of clients were working full or part time. Among those clients who were working, 81% were very satisfied or satisfied with
their job in 2011.
The types of careers sought by clients were varied.

161
Forty-six percent of clients were working full or part time.
Q25: These last few questions ask about what you are currently doing. Are you currently…?
ME
DVR Region
1 Region
2 Region
3 Region
4 Region
5
Working full time 14% 12% 14% 12% 18% 29%
Working part time 32% 30% 35% 32% 28% 39%
Currently looking for a job 24% 28% 15% 25% 27% 20%
In school or receiving job training 22% 20% 24% 21% 25% 14%
Keeping house 9% 12% 9% 7% 5% 14%
Currently unable to work 8% 9% 8% 10% 3% 7%
Volunteering your time 9% 13% 3% 8% 8% 11%
Other 11% 12% 9% 10% 10% 7%
None 1% 2% 1% 1% 1%
REF 3% 4% 4% 2% 2%
Total 100% 100% 100% 100% 100% 100%
Results by region for 2011
Note: columns listed as “0%” indicated instances where less than 0.5% gave this response. Blanks represent cases where no client gave this response.
Comments: Overall, 14% of clients reported that they were currently working full time and 32% indicated that they were working part time. Twenty-four percent of clients were currently looking for a job and another 22% were in school or receiving job training. Nine percent of clients reported that they were keeping house, and 9% were volunteering their time. Eight percent of clients reported that they were unable to work. By service region:
In Region 1, 12% of clients were working full time and 30% part time. In Region 2, 14% of clients were working full time and 35% part time. In Region 3, 12% of clients were working full time and 32% part time. In Region 4, 18% of clients were working full time and 28% part time. In Region 5, 29% of clients were working full time and 39% part time.

162
Among those clients who were working, 81% were very satisfied or satisfied with their job in 2011.
ME
DVR Region
1 Region
2 Region
3 Region
4 Region
5
Very dissatisfied 3% 1% 1% 1% 6% 12%
Dissatisfied 10% 13% 8% 10% 6% 3%
Neither satisfied nor dissatisfied 7% 5% 9% 7% 9% 2%
Satisfied 35% 36% 42% 33% 31% 25%
Very satisfied 45% 45% 39% 49% 48% 57%
Total 100% 100% 100% 100% 100% 100% Results by region for 2011
3%
10%7%
35%45%
0%
20%
40%
60%
80%
100%
Very dissatisfied
Dissatisfied Neither satisfied nor dissatisfied
Satisfied Very satisfied
Q26: Thinking about your current job, how satisfied are you with what you are doing? (Among employed clients)

163
2003 2006 2008 2011 Sig Diff (Region)
Sig Diff (Year)
ME DVR 78.8% 78.8% 81.3% 80.7%
Region 1 79.2% 76.7% 78.8% 80.7%
Region 2 85.4% 80.1% 87.0% 80.9%
Region 3 76.3% 74.8% 77.3% 81.8%
Region 4 76.1% 86.0% 84.9% 78.5%
Region 5 89.1% 83.8% 78.0% 82.3%
(% of respondents indicating very satisfied or satisfied)
78.8% 78.8% 81.3% 80.7%
0.0%
20.0%
40.0%
60.0%
80.0%
100.0%
2003 2006 2008 2011
Year of Survey Administration
Q26: Thinking about your current job, how satisfied are you with what you are doing?
(% very satisfied or satisfied)

164
Comments: In 2011, 81% were very satisfied or satisfied with their current job (among employed clients). This is comparable to the percentage in 2008. In 2011, 45% of employed clients indicated that they were very satisfied with their current job, while 35% were satisfied. Seven percent of employed clients indicated that they were neither satisfied nor dissatisfied with their current job, while 13% indicated some level of dissatisfaction (10% dissatisfied and 3% very dissatisfied). Significant Differences by Group:
97% of those whose disability is classified as deafness are satisfied 95% of those whose disability is classified as hard of hearing are satisfied
Among the 13% of employed clients that were not satisfied with their current job:
34% indicated their job is only temporary and does not meet career goals 25% indicated that they do not like their job, in general 10% indicated they have another job or career in mind
By service region, the main reasons clients were not satisfied were: Region 1:
47% indicated their job is only temporary and does not meet career goals 24% indicated they have another job or career in mind 17% indicated their job is “better than nothing” as they have limited employment options
Region 2:
62% indicated their job is only temporary and does not meet career goals 14% indicated that they do not like their job, in general 12% indicated they have another job or career in mind
Region 3:
39% indicated that they do not like their job, in general 24% indicated they are bored with their job 24% indicated their job has crazy hours and they’ve experienced scheduling problems 18% indicated their job is too physically demanding

165
Region 4:
63% indicated that they do not like their job, in general 21% indicated their job does not provide benefits 16% indicated they have experienced problems with their employer or co-workers
Region 5:
39% indicated they are bored with their job 20% indicated they need a job that is aligned with their skills and training 15% indicated their job is “better than nothing” as they have limited employment options
Q26: Thinking about your current job, how satisfied are you with what you are doing?
Reasons not Satisfied
ME
DVR Region
1 Region
2 Region
3 Region
4 Region
5
JOB - Not a career move, only temporary 34% 47% 69% 10%
NEGATIVE - Just do not like it in general 25% 12% 14% 39% 63%
EXPECTATION - Have another job, career, training in mind
10% 24% 12%
JOB - Bored with job 9% 24% 39%
DEMANDING - Physically demanding 7% 5% 18% 13%
HOURS - Crazy hours, scheduling problems
6% 24%
EXPECTATION - Better than nothing, employment limited
6% 17% 15%
EXPECTATION - Needs a job aligned with skills, training
4% 10% 20%
BENEFITS - No benefits 2% 21%
ENVIRONMENT - Problems with employer or co-workers
2% 16%
FINANCE - Low pay- does not meet financial needs
1% 13%
Total 100% 100% 100% 100% 100% 100%
Results by region for 2011
Note: columns listed as “0%” indicated instances where less than 0.5% gave this response. Blanks represent cases where no client gave this response.

166
The types of careers sought by clients were varied. Comments: All clients, including those currently working, were asked the type of career they wanted. Their responses are summarized in the tables below. The types of careers sought by these clients were quite varied. The most frequently mentioned was the desire to work in “any job,” mentioned by 12% of clients. Other careers mentioned included those related to gardening and landscaping (9%), social services and mental health (9%), customer service (8%), and starting their own business (7%), among others. Nine percent indicated that job options are limited due to their disability.
Q27: What type of job or career do you think you want?
ME
DVR Region
1 Region
2 Region
3 Region
4 Region
5
Any job 12% 13% 13% 11% 9% 11%
Gardening, landscaping 9% 9% 11% 7% 12% 3%
Human, social services, mental health 9% 5% 7% 19% 4% 5%
Job options are limited due to disability 9% 5% 14% 6% 10% 13%
Customer service 8% 9% 8% 7% 3% 12%
Business - start own 7% 7% 10% 2% 6% 7%
Health care, medical services 6% 7% 7% 7% 4% 5%
Agricultural 6% 6% 7% 16% 17%
Retail, sales 6% 9% 5% 4% 5% 6%
Food service 4% 7% 8% 3% 6%
Animal care 4% 4% 1% 9% 3%
Computer work 3% 5% 3% 3% 4%
State, federal gov’t job 3% 8% 2% 3%
Media related field 3% 3% 3% 1% 5% 7%
Education 2% 3% 1% 2% 3% 5%
Office work 2% 3% 1% 1% 1%
Engineering 1% 2% 1% 3%
Go back to school 1% 4%
Electrical, plumbing, heating, welding, refrigeration
1% 1% 2%
Custodial, maintenance, cleaning 1% 1% 3% Results by region for 2011
Note: columns listed as “0%” indicated instances where less than 0.5% gave this response. Blanks represent
cases where no client gave this response.

167
Q27: What type of job or career do you think you want? (continued)
ME
DVR Region
1 Region
2 Region
3 Region
4 Region
5 Research 1% 2%
Coaching, sports director 0% 1%
Writer 0% 1%
Other 1% 1% 5% 2%
None, do not want job 1% 1% 1% 1%
Total 100% 100% 100% 100% 100% 100% Results by region for 2011
Note: columns listed as “0%” indicated instances where less than 0.5% gave this response. Blanks represent
cases where no client gave this response.

168
Agency Specific Questions
In 2011, 76% of clients indicated that they were informed that they could address problems with the Client Assistance Project.
88% of clients were informed of their rights and the steps they could take if they had a problem with the Maine Division of Vocational Rehabilitation.
Only 5% of clients contacted the Client Assistance Program.
85% of clients indicated the Client Assistance Program was helpful (among those
contacting the Program).
Two in five (40%) clients indicated they had more than one vocational rehabilitation counselor.
Among those with more than one vocational rehabilitation counselor, 32% indicated
it affected their ability to get services through the Maine Division of Vocational Rehabilitation.
Forty percent of clients indicated they were able to access benefits counseling
through vocational rehabilitation while 13% indicated they were not able to access benefits counseling.
Among those using benefits counseling, 68% found this counseling very valuable
and 25% found it somewhat valuable.
56% of clients received job coaching or job development services.
Among those receiving job coaching or job development services, 85% were very satisfied or satisfied with these services.
23% of clients participated in the Career Exploration Workshop.
85% of clients indicated the Career Exploration Workshop was helpful (among
those participating in the Workshop).

169
In 2011, 76% of clients indicated that they were informed that they could address problems with the Client Assistance Project.
ME
DVR Region
1 Region
2 Region
3 Region
4 Region
5
Yes 76% 74% 77% 72% 82% 74%
No 24% 26% 23% 28% 18% 26%
Total 100% 100% 100% 100% 100% 100%
Results by region for 2011
76%
24%
0%
20%
40%
60%
80%
100%
Yes No
Q21: Were you informed that if you had a problem with ME DVR, you could address it with the Client Assistance
Program?

170
Comments: In 2011, 76% of clients indicated that they were informed that if they had a problem, they could address this problem with the Client Assistance Project. This is trending upwards since 2006. In 2011, 24% of clients indicated that they were not informed.
65%70%
76%
0%
20%
40%
60%
80%
100%
2006 2008 2011
Year of Administration
Were you informed that if you had a problem with the Maine Division of Vocational Rehabilitation, you could address it
with the Client Assistance Program?(% yes)

171
88% of clients were informed of their rights and the steps they could take if they had a problem with the Maine Division of Vocational Rehabilitation.
ME
DVR Region 1 Region 2 Region 3 Region 4 Region 5
Yes 88% 85% 91% 90% 90% 91%
No 12% 15% 9% 10% 10% 9%
Total 100% 100% 100% 100% 100% 100%
Results by region for 2011
88%
12%
0%
20%
40%
60%
80%
100%
Yes No
ME07: Were you informed of your rights and the steps that you could take if you had a problem with the Maine
Division of Vocational Rehabilitation?

172
Comments: Among all clients, 88% indicated that they were informed of their rights and the steps they could take if they had a problem with the Maine Division of Vocational Rehabilitation; 12% were not. By Region (in 2011)
85% of clients in Region 1 indicated that they were informed of their rights and the steps they could take if they had a problem with the Maine Division of Vocational Rehabilitation; 15% were not.
91% of clients in Region 2 indicated that they were informed of their rights and the steps they could take if they had a problem with the Maine Division of Vocational Rehabilitation; 9% were not.
90% of clients in Region 3 indicated that they were informed of their rights and the steps they could take if they had a problem with the Maine Division of Vocational Rehabilitation; 10% were not.
90% of clients in Region 4 indicated that they were informed of their rights and the steps they could take if they had a problem with the Maine Division of Vocational Rehabilitation; 10% were not.
91% of clients in Region 5 indicated that they were informed of their rights and the steps they could take if they had a problem with the Maine Division of Vocational Rehabilitation; 9% were not.

173
Only 5% of clients contacted the Client Assistance Program.
ME
DVR Region 1 Region 2 Region 3 Region 4 Region 5
Yes 5% 4% 5% 9% 6% 1%
No 95% 96% 95% 91% 94% 99%
Total 100% 100% 100% 100% 100% 100%
Results by region for 2011
5%
95%
0%
20%
40%
60%
80%
100%
Yes No
ME08: Did you ever contact the Client Assistance Program?

174
Comments: Among all clients, only 5% indicated they ever contacted the Client Assistance Program; 95% did not. By Region (in 2011)
4% of clients in Region 1 indicated they ever contacted the Client Assistance Program; 96% did not.
5% of clients in Region 2 indicated they ever contacted the Client Assistance Program; 95% did not.
9% of clients in Region 3 indicated they ever contacted the Client Assistance Program; 91% did not.
6% of clients in Region 4 indicated they ever contacted the Client Assistance Program; 94% did not.
1% of clients in Region 5 indicated they ever contacted the Client Assistance Program; 99% did not.

175
85% of clients indicated the Client Assistance Program was helpful (among those contacting the Program).
ME
DVR Region 1 Region 2 Region 3 Region 4 Region 5
Not at all Helpful 15% 13% 23% 19% 0% 0%
Not very Helpful 0% 0% 0% 0% 0% 0%
Somewhat Helpful 20% 0% 44% 14% 34% 0%
Very Helpful 65% 87% 32% 67% 66% 100%
Total 100% 100% 100% 100% 100% 100%
Results by region for 2011
15%
0%
20%
65%
0%
20%
40%
60%
80%
100%
Not at all Helpful Not very Helpful Somewhat Helpful Very Helpful
ME09: How helpful was the Client Assistance Program?(% among those contacting the Client Assistance Program)

176
Comments: Among those who contacted the Client Assistance Program, 85% indicated the Program was very or somewhat helpful. Sixty-five percent of those contacting the Program indicated it was very helpful while 20% indicated it was somewhat helpful. Fifteen percent of those contacting the Program indicated it was not helpful (0% not very helpful and 15% not at all helpful). By Region (in 2011)
87% of those in Region 1 contacting the Client Assistance Program indicated it was very helpful; 0% somewhat helpful.
32% of those in Region 2 contacting the Client Assistance Program indicated it was very helpful; 44% somewhat helpful.
67% of those in Region 3 contacting the Client Assistance Program indicated it was very helpful; 14% somewhat helpful.
66% of those in Region 4 contacting the Client Assistance Program indicated it was very helpful; 34% somewhat helpful.
100% of those in Region 5 contacting the Client Assistance Program indicated it was very helpful; 0% somewhat helpful.

177
Two in five (40%) clients indicated they had more than one vocational rehabilitation counselor.
ME
DVR Region
1 Region
2 Region
3 Region
4 Region
5
Yes 40% 30% 49% 44% 44% 30%
No 60% 70% 51% 56% 56% 70%
Total 100% 100% 100% 100% 100% 100%
Results by region for 2011
46% 48%
40%
0%
20%
40%
60%
80%
100%
2006 2008 2011
Year of Administration
ME01: While a client of the Maine Division of Vocational Rehabilitation, did you have more than one vocational
rehabilitation counselor?(% Yes)

178
Comments: Statewide, 40% of clients reported they had more than one vocational rehabilitation counselor. By Region (in 2008)
30% of clients in Region 1 had more than one vocational rehabilitation counselor. 49% of clients in Region 2 had more than one vocational rehabilitation counselor. 44% of clients in Region 3 had more than one vocational rehabilitation counselor. 44% of clients in Region 4 had more than one vocational rehabilitation counselor. 30% of clients in Region 5 had more than one vocational rehabilitation counselor.

179
Among those with more than one vocational rehabilitation counselor, 32% indicated it affected their ability to get services through the Maine Division of Vocational Rehabilitation.
ME
DVR Region
1 Region
2 Region
3 Region
4 Region
5
Yes 32% 26% 39% 38% 18% 37%
No 68% 74% 61% 62% 82% 63%
Total 100% 100% 100% 100% 100% 100%
Results by region for 2011
33% 39% 32%
67%61%
68%
0%
20%
40%
60%
80%
100%
2006 2008 2011
Year of Administration
ME02: (If you had more than one counselor) Did this in any way affect your ability to get services through the Maine
Division of Vocational Rehabilitation?
% Yes
% No

180
Comments: Among those clients who indicated they had more than one vocational rehabilitation counselor, 32% indicated this affected their ability to get services through the Division. By Region (in 2011)
26% of those clients in Region 1 indicated that having more than one counselor affected their ability to get services through the Division.
39% of those clients in Region 2 indicated that having more than one counselor affected their ability to get services through the Division.
38% of those clients in Region 3 indicated that having more than one counselor affected their ability to get services through the Division.
18% of those clients in Region 4 indicated that having more than one counselor affected their ability to get services through the Division.
37% of those clients in Region 5 indicated that having more than one counselor affected their ability to get services through the Division.
Among those indicating this affected the services they received, the most frequently cited reasons were that they were not getting what they needed (32%), they were bounced around (15%), it slowed down the process (15%) and they had to re-start the process (11%), among others.
How did this affect your ability to get services through the Maine Division of Vocational Rehabilitation?
ME
DVR Region
1 Region
2 Region
3 Region
4 Region
5
Not getting what I needed 32% 34% 36% 26% 26% 55%
Bounced around 15% 24% 11% 36%
Slowed down process 15% 23% 12% 18% 4%
Restart process 11% 14% 13% 4% 19%
Communication issues 8% 11% 1% 12% 8% 28%
Personality clash 7% 7% 18%
Other 6% 10% 3% 8%
Confusing, difficult 4% 5% 4% 7%
Unprofessional staff 2% 5% 17%
Total 100% 100% 100% 100% 100% 100%
Results by region for 2011
Note: columns listed as “0%” indicated instances where less than 0.5% gave this response. Blanks represent cases where no client gave this response.

181
Among those needing benefits counseling, 75% indicated they were able to access benefits counseling through vocational rehabilitation while 25% indicated they were not able to access benefits counseling.
ME
DVR Region
1 Region
2 Region
3 Region
4 Region
5 Total % Needing Benefits Counseling 53% 53% 50% 60% 52% 50%
Among those needing counseling:
Yes, able to access 75% 74% 76% 72% 83% 86%
No, not able to access 25% 26% 24% 28% 17% 14% Did not need benefits counseling
46% 46% 50% 40% 48% 49%
Results by region for 2011
77% 79% 75%
0%
20%
40%
60%
80%
100%
2006 2008 2011
Year of Administration
ME03: If you needed benefits counseling, were you able to access benefits counseling through vocational rehabilitation?
(% yes among those needing benefits counseling)

182
Comments: Among all clients, 53% indicated they needed to access benefits counseling whilt 46% indicate they did not need counseling. Among those indicating that they needed benefits counseling, 75% were able to access this counseling. By Region (in 2011) among those needing to access counseling
74% of clients in Region 1 indicated they could access benefits counseling through the Division while 26% were not able to access benefits counseling.
76% of clients in Region 2 indicated they could access benefits counseling through the Division while 24% were not able to access benefits counseling.
72% of clients in Region 3 indicated they could access benefits counseling through the Division while 28% were not able to access benefits counseling.
83% of clients in Region 4 indicated they could access benefits counseling through the Division while 17% were not able to access benefits counseling.
86% of clients in Region 5 indicated they could access benefits counseling through the Division while 14% were not able to access benefits counseling.

183
Among those using benefits counseling, 68% found this counseling very valuable and 25% found it somewhat valuable.
ME
DVR Region
1 Region
2 Region
3 Region
4 Region
5
Very valuable 68% 68% 68% 66% 72% 70%
Somewhat valuable 25% 27% 22% 28% 24% 30%
Not very valuable 4% 3% 9% 6%
Not at all valuable 2% 3% 1% 4%
Total 100% 100% 100% 100% 100% 100%
Results by region for 2011
98% 96% 94%
0%
20%
40%
60%
80%
100%
2006 2008 2011
Year of Administration
ME04: How valuable did you find this benefits counseling?(% very or somewhat valuable among those receiving
benefits counseling)
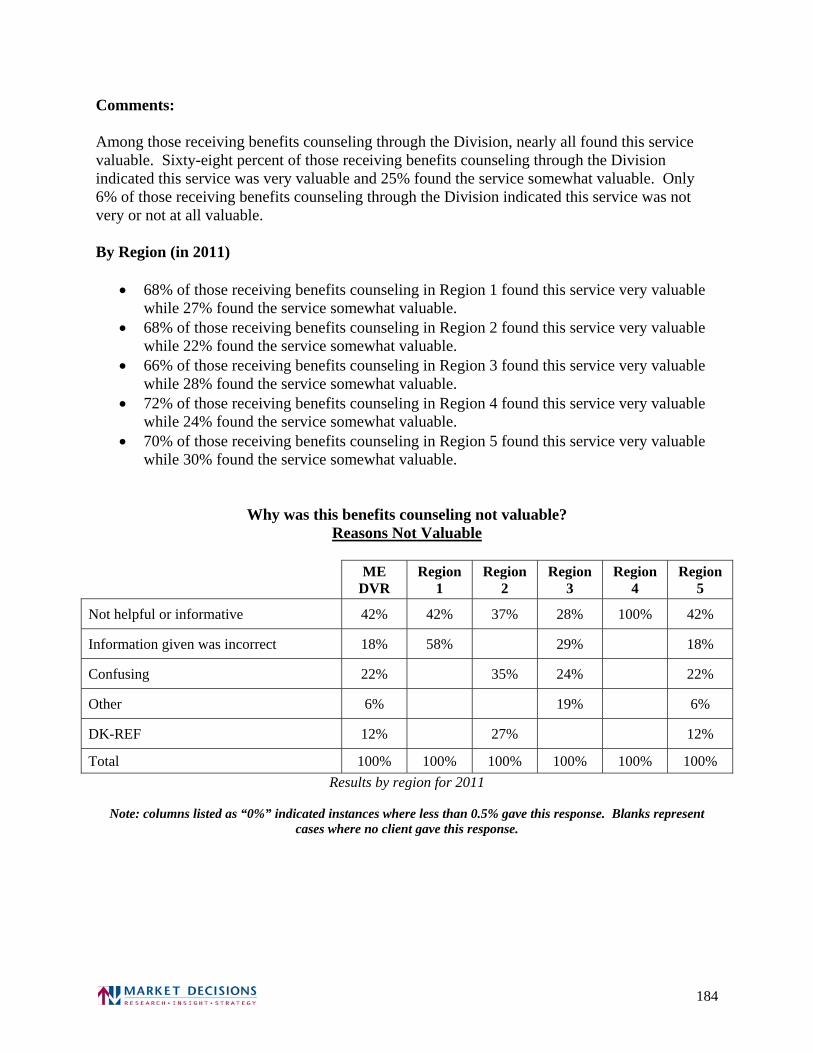
184
Comments: Among those receiving benefits counseling through the Division, nearly all found this service valuable. Sixty-eight percent of those receiving benefits counseling through the Division indicated this service was very valuable and 25% found the service somewhat valuable. Only 6% of those receiving benefits counseling through the Division indicated this service was not very or not at all valuable. By Region (in 2011)
68% of those receiving benefits counseling in Region 1 found this service very valuable while 27% found the service somewhat valuable.
68% of those receiving benefits counseling in Region 2 found this service very valuable while 22% found the service somewhat valuable.
66% of those receiving benefits counseling in Region 3 found this service very valuable while 28% found the service somewhat valuable.
72% of those receiving benefits counseling in Region 4 found this service very valuable while 24% found the service somewhat valuable.
70% of those receiving benefits counseling in Region 5 found this service very valuable while 30% found the service somewhat valuable.
Why was this benefits counseling not valuable? Reasons Not Valuable
ME
DVR Region
1 Region
2 Region
3 Region
4 Region
5
Not helpful or informative 42% 42% 37% 28% 100% 42%
Information given was incorrect 18% 58% 29% 18%
Confusing 22% 35% 24% 22%
Other 6% 19% 6%
DK-REF 12% 27% 12%
Total 100% 100% 100% 100% 100% 100%
Results by region for 2011
Note: columns listed as “0%” indicated instances where less than 0.5% gave this response. Blanks represent cases where no client gave this response.
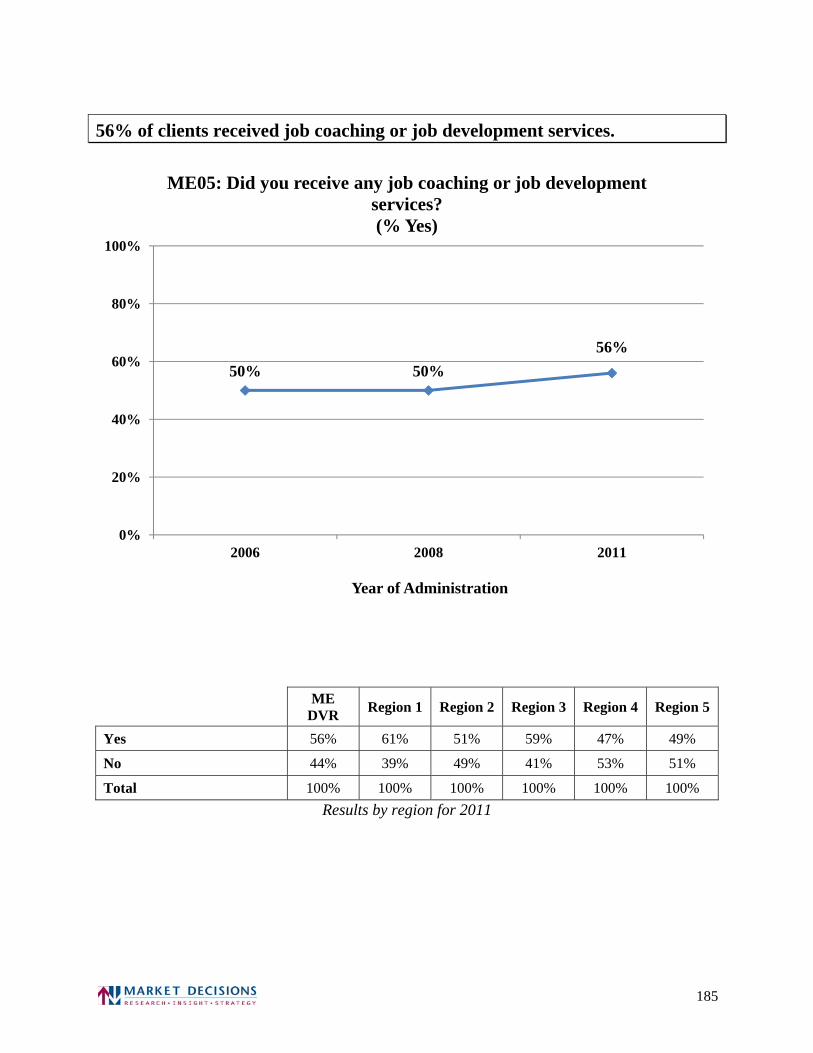
185
56% of clients received job coaching or job development services.
ME
DVR Region 1 Region 2 Region 3 Region 4 Region 5
Yes 56% 61% 51% 59% 47% 49%
No 44% 39% 49% 41% 53% 51%
Total 100% 100% 100% 100% 100% 100%
Results by region for 2011
50% 50%
56%
0%
20%
40%
60%
80%
100%
2006 2008 2011
Year of Administration
ME05: Did you receive any job coaching or job development services?(% Yes)
186
Comments: Among all clients, 56% reported they had received job coaching or job development services. By Region (in 2011)
61% of clients in Region 1 reported receiving job coaching or job development services. 51% of clients in Region 2 reported receiving job coaching or job development services. 59% of clients in Region 3 reported receiving job coaching or job development services. 47% of clients in Region 4 reported receiving job coaching or job development services. 49% of clients in Region 5 reported receiving job coaching or job development services.

187
Among those receiving job coaching or job development services, 85% were very satisfied or satisfied with these services.
ME
DVR Region
1 Region
2 Region
3 Region
4 Region
5
Very satisfied 51% 56% 45% 49% 46% 65%
Satisfied 34% 33% 41% 29% 41% 23%
Neither satisfied nor dissatisfied
5% 6% 3% 5% 7% 7%
Dissatisfied 4% 3% 4% 8% 4%
Very dissatisfied 5% 2% 7% 9% 3% 6%
Total 100% 100% 100% 100% 100% 100%
Results by region for 2011
83% 82% 85%
0%
20%
40%
60%
80%
100%
2006 2008 2011
Year of Administration
ME06: How satisfied were you with this job coaching or job development service?
(% very or somewhat satisfied among those receiving job coaching or job development services)

188
Comments: Among those receiving job coaching or job development services, 85% were very satisfied or satisfied with these services. Fifty-one percent of those receiving job coaching or job development services were very satisfied and 34% were satisfied with these services. Five percent of those receiving job coaching or job development services indicated they were neither satisfied nor dissatisfied while 9% expressed some level of dissatisfaction (4% being dissatisfied and 5% very dissatisfied). By Region (in 2011)
56% of those receiving job coaching or job development services in Region 1 were very satisfied with these services while 33% were satisfied.
45% of those receiving job coaching or job development services in Region 2 were very satisfied with these services while 41% were satisfied.
49% of those receiving job coaching or job development services in Region 3 were very satisfied with these services while 29% were satisfied.
46% of those receiving job coaching or job development services in Region 4 were very satisfied with these services while 41% were satisfied.
65% of those receiving job coaching or job development services in Region 5 were very satisfied with these services while 23% were satisfied.
Among those that were not satisfied, the main reasons cited were that the Division did not provide much help (46%), they are unemployed or not gainfully employed (25%) and that the program wastes time (9%), among others.
Why were you not satisfied with this job coaching or job development service? Reasons Not Satisfied
ME
DVR Region
1 Region
2 Region
3 Region
4 Region
5
Not helpful 46% 53% 31% 58% 12% 28%
Unemployed or not gainfully employed 25% 40% 44% 9% 72%
Program wastes time 9% 13% 6% 35%
Would like further training 2% 11%
Other 11% 7% 16% 28%
DK-REF 6% 10% 25%
Total 100% 100% 100% 100% 100% 100% Results by region for 2011
Note: columns listed as “0%” indicated instances where less than 0.5% gave this response. Blanks represent
cases where no client gave this response.

189
23% of clients participated in the Career Exploration Workshop.
ME
DVR Region 1 Region 2 Region 3 Region 4 Region 5
Yes 23% 22% 22% 22% 25% 25%
No 77% 78% 78% 78% 75% 75%
Total 100% 100% 100% 100% 100% 100%
Results by region for 2011
23%
77%
0%
20%
40%
60%
80%
100%
Yes No
ME10: Did you participate in the Career Exploration Workshop?

190
Comments: Twenty-three percent of clients participated in the Career Exploration Workshop; 77% did not. By Region (in 2011)
22% of those in Region 1 participated in the Career Exploration Workshop; 78% did not. 22% of those in Region 2 participated in the Career Exploration Workshop; 78% did not. 22% of those in Region 3 participated in the Career Exploration Workshop; 78% did not. 25% of those in Region 4 participated in the Career Exploration Workshop; 75% did not. 25% of those in Region 5 participated in the Career Exploration Workshop; 75% did not.
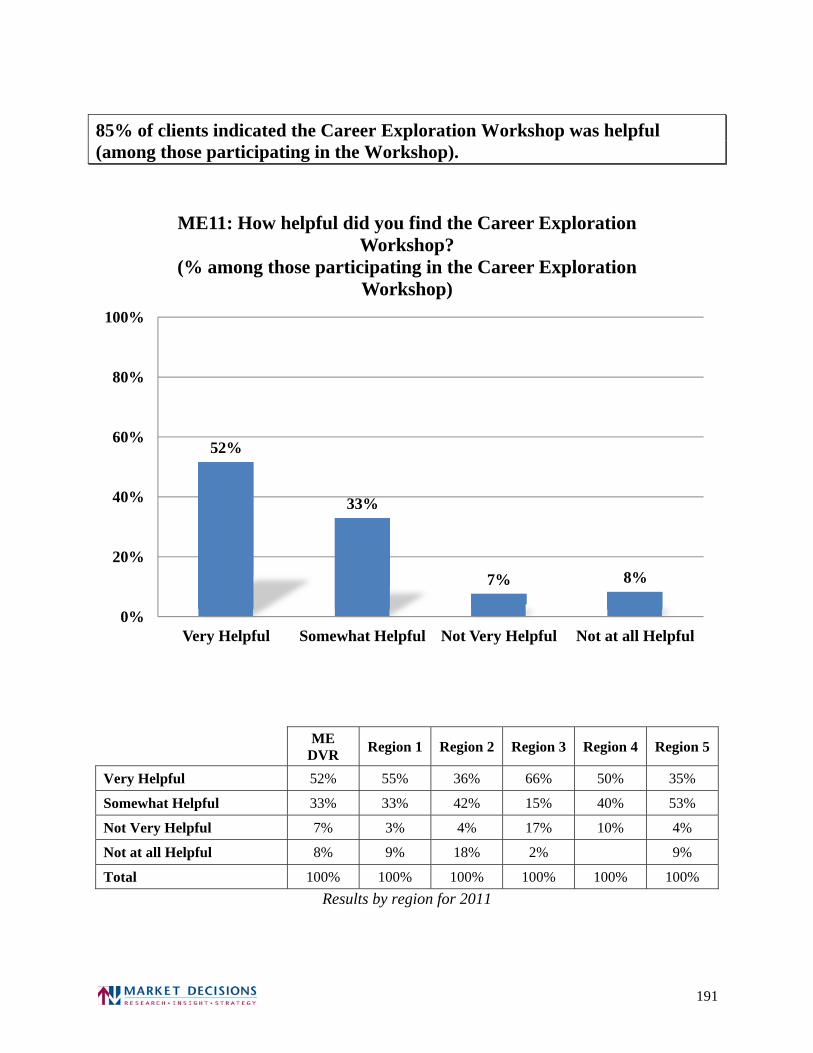
191
85% of clients indicated the Career Exploration Workshop was helpful (among those participating in the Workshop).
ME
DVR Region 1 Region 2 Region 3 Region 4 Region 5
Very Helpful 52% 55% 36% 66% 50% 35%
Somewhat Helpful 33% 33% 42% 15% 40% 53%
Not Very Helpful 7% 3% 4% 17% 10% 4%
Not at all Helpful 8% 9% 18% 2% 9%
Total 100% 100% 100% 100% 100% 100%
Results by region for 2011
52%
33%
7% 8%
0%
20%
40%
60%
80%
100%
Very Helpful Somewhat Helpful Not Very Helpful Not at all Helpful
ME11: How helpful did you find the Career Exploration Workshop?
(% among those participating in the Career Exploration Workshop)

192
Comments: Among those who participated in the Career Exploration Workshop, 85% indicated the Workshop was very or somewhat helpful. Fifty-two percent of those participating in the Workshop indicated it was very helpful while 33% indicated it was somewhat helpful. Fifteen percent of those participating in the Workshop indicated it was not helpful (7% not very helpful and 8% not at all helpful). By Region (in 2011)
55% of those in Region 1 participating in the Career Exploration Workshop indicated it was very helpful; 33% somewhat helpful.
36% of those in Region 2 participating in the Career Exploration Workshop indicated it was very helpful; 42% somewhat helpful.
66% of those in Region 3 participating in the Career Exploration Workshop indicated it was very helpful; 15% somewhat helpful.
50% of those in Region 4 participating in the Career Exploration Workshop indicated it was very helpful; 40% somewhat helpful.
35% of those in Region 5 participating in the Career Exploration Workshop indicated it was very helpful; 53% somewhat helpful.

193
Respondent Characteristics
ME
DVR Region
1 Region
2 Region
3 Region
4 Region
5
Male 53% 53% 50% 53% 57% 58%
Female 47% 47% 50% 47% 43% 42%
Total 53% 53% 50% 53% 57% 58%
Results by region 2011
54%
46%
54%
46%
53%47%
0%
20%
40%
60%
80%
100%
Men Women
Gender of Respondent
2006 2008 2011

194
ME
DVR Region
1 Region
2 Region
3 Region
4 Region
5
< 25 37% 34% 42% 35% 42% 18%
25 - 34 16% 16% 15% 18% 12% 13%
35 - 44 15% 16% 14% 16% 12% 17%
45- 54 19% 19% 19% 17% 18% 23%
55 - 64 11% 12% 7% 12% 14% 19%
65+ 2% 2% 2% 2% 2% 9%
Total 100% 100% 100% 100% 100% 100%
Results by region for 2011
37%
15%
18% 20%
9%
2%
37%
15% 15%
21%
11%
1%
37%
16%15%
19%
11%
2%
0%
20%
40%
60%
80%
100%
< 25 25 - 34 35 - 44 45- 54 55 - 64 65+
Age of Respondent
2006 2008 2011
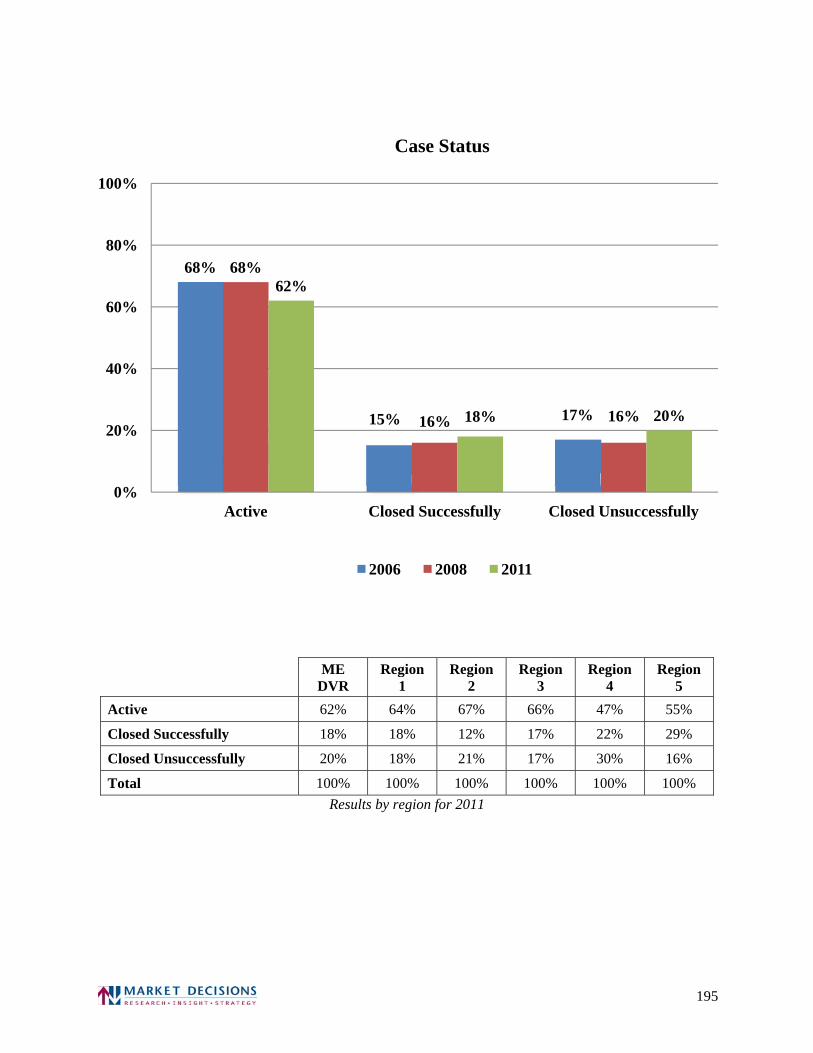
195
ME
DVR Region
1 Region
2 Region
3 Region
4 Region
5
Active 62% 64% 67% 66% 47% 55%
Closed Successfully 18% 18% 12% 17% 22% 29%
Closed Unsuccessfully 20% 18% 21% 17% 30% 16%
Total 100% 100% 100% 100% 100% 100%
Results by region for 2011
68%
15% 17%
68%
16% 16%
62%
18% 20%
0%
20%
40%
60%
80%
100%
Active Closed Successfully Closed Unsuccessfully
Case Status
2006 2008 2011

196
Disability Category
2008 2011 Mental and Emotional Problems 30% 30%
Learning Disability 20% 19%
Medical 15% 11%
Mental Retardation 7% 9%
Traumatic Brain Injury 7% 7%
Hard of Hearing 6% 7%
Orthopedic 5% 4%
Autism 1% 3%
Neurological 3% 3%
Deafness 3% 3%
Unspecified 2% 2%
Low Vision 0% 1%
Amputation, Absence of limbs 1% 0%
Communication 0% 0%
ME
DVR Region
1 Region
2 Region
3 Region
4 Region
5
Unspecified 2% 2% % 3% 1% 2%
Low Vision 1% 1% 1% 1%
Deafness 3% 6% 1% 1% 6%
Hard of Hearing 7% 7% 2% 5% 13% 24%
Neurological 3% 5% 1% 3% 3% 3%
Orthopedic 4% 3% 3% 8% 6% 2%
Medical 11% 11% 12% 11% 7% 23%
Amputation, Absence of limbs % 1% %
Mental and Emotional Problems 30% 28% 30% 33% 32% 17%
Autism 3% 6% 2% 2% 2% 6%
Mental Retardation 9% 10% 9% 10% 7% 7%
Learning Disability 19% 13% 33% 16% 18% 5%
Communication % 1%
Traumatic Brain Injury 7% 8% 6% 8% 8% 5%
Total 100% 100% 100% 100% 100% 100%
Results by region for 2011